Volcanic-Ash Dispersion Modeling of the 2006 Eruption of Augustine Volcano Using the Puff Model - Alaska Volcano ...
←
→
Page content transcription
If your browser does not render page correctly, please read the page content below
The 2006 Eruption of Augustine Volcano, Alaska
                                                                                       Power, J.A., Coombs, M.L., and Freymueller, J.T., editors
                                                                                       U.S. Geological Survey Professional Paper 1769

Chapter 21

Volcanic-Ash Dispersion Modeling of the 2006 Eruption of
Augustine Volcano Using the Puff Model

By Peter W. Webley1, Kenneson G. Dean1, Jonathan Dehn1, John E. Bailey1,2, and Rorik Peterson3

Abstract                                                                     remote-sensing data, Next Generation Radar (NEXRAD)
                                                                             radar, and ashfall measurements. In addition, we discuss
     Volcanic ash is one of the major potential hazards from                 how automated predictions for volcanoes at elevated alert
volcanic eruptions. It can have both short-range effects from                status provide a quicker assessment of the risk from the
proximal ashfall and long range impacts from volcanic ash                    potential ash clouds.
clouds. The timely tracking and understanding of recently
emitted volcanic ash clouds is important, because they can
cause severe damage to jet aircraft engines and shut down                    Introduction
major airports. Dispersion models play an important role in
forecasting the movement of volcanic ash clouds by being                          Volcanoes can inject large volumes of ash into the
the only means to predict a clouds’ trajectory. Where avail-                 atmosphere, posing a threat to international and domestic
able, comparisons are possible to both remote-sensing data                   aircraft as well as disrupting local communities. Ash clouds
and observations from the ground and aircraft. This was                      can cause severe damage to jet aircraft engines and fuel
demonstrated in January 2006, when Augustine Volcano                         lines, abrade aircraft internal and external surfaces and
erupted after about a 20-year hiatus. From January 11 to                     shut down major airports (Blong, 1984; Casadevall, 1993;
28, 2006, there were 13 explosive events, with some lasting                  Casadevall and Krohn, 1995; Miller and Casadevall, 2000).
as long as 11 minutes and producing ash clouds as high as                    The North Pacific (NOPAC) region is a vast expanse, 5,000
10–12 km (33,000–39,000 ft) above mean sea level (a.m.s.l).                  km by 2,500 km, containing numerous active volcanoes,
From January 28 to February 4, 2006, there was a more                        most of which are located in uninhabited areas along the
continuous phase, with ash clouds reaching 4–5 km a.m.s.l                    Aleutian Islands and Kamchatka Peninsula, Russia (fig. 1).
(13,000–16,000 ft). During the eruption, the Puff disper-                    From 1975 to 2006, there were more than 200 separate vol-
sion model was used by the Alaska Volcano Observatory for                    canic ash clouds that reached at least 6 km (20,000 ft) above
trajectory forecasting of the associated volcanic ash eruption               mean sea level (a.m.s.l) and potentially jeopardized aircraft
clouds. The six explosive events on January 13 and 14, 2006,                 safety. Within the NOPAC region, the agencies responsible
were the first time the “multiple eruptions” capability of                   for monitoring volcanoes and their associated eruptions are:
the Puff model was used during an eruption response. Here                    Alaska Volcano Observatory (AVO), Kamchatka Volcano
we show the Puff model predictions made during the 2006                      Emergency Response Team (KVERT), and Sakhalin Volca-
Augustine eruption and compare these predictions to satellite                nic Eruption Response Team (SVERT) who work together
                                                                             with the Tokyo, Washington and Anchorage Volcanic Ash
                                                                             Advisory Centers (VAAC) to provide advisories of airborne
                                                                             volcanic ash. These advisories are used by the local meteo-
  1
   Alaska Volcano Observatory, Geophysical Institute, University of Alaska   rological watch offices to provide a Significant Meteorologi-
Fairbanks, 903 Koyukuk Drive, Fairbanks, AK 99775.                           cal Information (SIGMET) warning to the aviation commu-
  2
   Now at: Scenarios Network for Alaska Planning, University of Alaska       nity and volcanic ashfall warnings to local communities.
Geography Program, Fairbanks, AK 99775.                                           Volcanic Ash Transport and Dispersion (VATD) models
  3
   Department of Mechanical Engineering, University of Alaska Fairbanks,     play an important role in forecasting the movement of vol-
P.O. Box 755905, Fairbanks, AK 99775.                                        canic ash clouds and provide information that is otherwise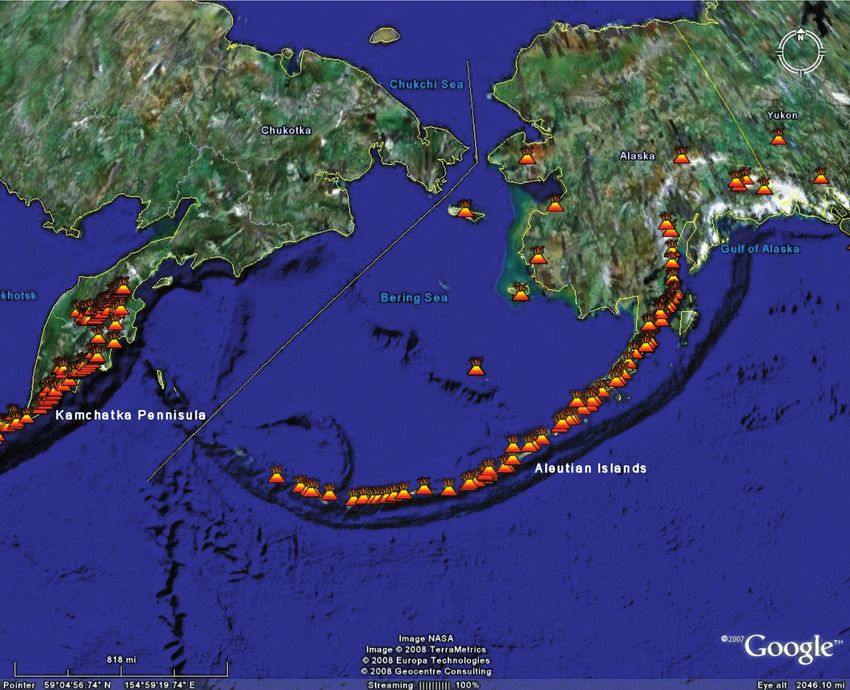
508   The 2006 Eruption of Augustine Volcano, Alaska

difficult or impossible to collect from other data sources.         and Federal Aviation Administration (FAA) for corroboration
When remote-sensing data and observations from the ground           and to solicit additional information. AVO itself is a joint
and aircraft are available, these model predictions can be          program of the United States Geological Survey (USGS), the
compared and validated. Before, and in the initial stages of        Geophysical Institute of the University of Alaska Fairbanks
volcanic eruptions, VATD models are invaluable in predicting        (UAF-GI) and the State of Alaska Division of Geological and
the movement of volcanic ash clouds and ensuring aviation           Geophysical Surveys (ADGGS).
safety. A warning system should be capable of a 5-minute                 VATD models provide the only means to quantitatively
response time once an eruption has been detected (Hufford           predict an ash cloud’s trajectory. There are three VATD
and others, 2000). During these initial minutes, predicting the     models often used for forecasting ash cloud motion in the
movement of the ash cloud and the potential impacts on air-         NOPAC region: Canadian Emergency Response Model
craft are critical. Within Alaska, AVO’s level of response to       (CanERM: Pudykiewicz, 1988, 1989), Hybrid Single-Parti-
remote volcanic activity varies depending on the source and         cle Lagrangian Integrated Trajectories (HYSPLIT: Draxler
content of the observation. After receiving a report of an erup-    and Hess, 1997, 1998), and Puff (Searcy and others, 1998).
tion, AVO works with the National Weather Service (NWS)             Peterson and others (2010) provide a detailed description

Figure 1. Map of North Pacific region, illustrating the numerous volcanoes (colored triangles) from Kamchatka in the west to the
Alaska mainland and Canada in the east (image courtesy of Google Earth).
21. Volcanic-Ash Dispersion Modeling of the 2006 Eruption of Augustine Volcano Using the Puff Model 509
of all three models. Puff is primarily focused on forecast- (2010) compared model predictions from Puff, HYSPLIT, and
ing volcanic ash transport and dispersion using an adjust- CanERM for selected eruptions in the NOPAC.
able number of tracer particles to represent a volcanic ash Most recently, the Puff model was used in January
cloud. The model is designed to rapidly predict the extent 2006, when Augustine Volcano (fig. 2) reawakened and
and movement of airborne ash particles during an eruption over a period of 20 days produced 13 explosive eruptions,
(Searcy and others, 1998). Model simulations place hypo- followed by a period of continuous ash emission. The
thetical particles above a selected volcano, release them into 2006 eruption was preceded by approximately 8 months of
a gridded wind field and calculate their movement. Current increasing unrest that included escalating seismic activity,
numerical weather prediction (NWP) model forecasts are deformation of the volcanic edifice, gas emission, and small
used for real-time predictions. phreatic explosions (Power and others, 2006). The eruption
Puff is used at AVO, Anchorage and Washington progressed through four phases. In May 2005, the volcano
VAACs, the Airforce Weather Agency (AFWA), and other started a precursory phase with increasing microearthquakes
national agencies and universities worldwide. The Puff (Power and others, 2006). From January 11 to 28, 2006
model has been used as a VATD model for numerous volca- the volcano was in an explosive phase characterized by 13
nic eruptions in the North Pacific. The first use of the model discrete explosions, followed by a more continuous phase of
was during the eruption of Redoubt Volcano in 1989–90 lesser explosivity and lava effusion from January 28 through
(Tanaka, 1994). Searcy and others (1998) demonstrated the February 10 and concluding with an effusive phase from
model’s use by comparing predictions to satellite images March 3 to 15 (Coombs and others, this volume).
of the eruptions of Crater Peak at Mount Spurr in 1992 and In this paper, we show the use of the Puff model dur-
of Klyuchevskoi Volcano in 1994. Dean and others (2002) ing the 2006 eruption of Augustine Volcano. New modeling
predicted the movement of the ash cloud from the 2001 erup- capabilities are introduced, many of which were used for
tion of Cleveland Volcano and showed possible limitations of the first time during an eruption response, with validation of
satellite data when compared to the model predictions, and these model simulations. Also shown is how the frequency of
Aloisi and others (2002) used the model to analyze the July the explosive events at Augustine led to both new develop-
1998 eruption cloud from the Mount Etna paroxysm. Addi- ments and new data-visualization tools. We compare the Puff
tionally, Papp and others (2005) investigated the probability model simulations to satellite data and ashfall measurements
of ash distribution in the NOPAC based on multiple, hypo- to assess the reliability of the eruption response predictions.
thetical eruptions over several years, and Peterson and others We describe the Puff model’s use by separating the explosive
phase into three parts on the basis of the timings of the events:
(1) January 11, (2) January 13 and 14, and (3) January 17, with
152
o
150 o the early part of the following continuous phase as one period,
(4) January 28 to February 2, 2006.
Talkeetna
ALASKA
62
o
The 2006 Eruption at Augustine Volcano
Hayes Volcano
The 2006 eruption of Augustine Volcano was preceded by
Area of Mount
figure Spurr increased seismicity beginning in May 2005. By January 11,
Crater
Peak Anchorage 2006, there were significant satellite detected thermal anoma-
lies and strong seismic signals, and on that day two explosions
occurred, each lasting less than 4 minutes (Power and oth-
let
In
Redoubt Kenai ers, 2006). The January 11 explosions produced ash plumes,
Volcano
Kasilof LA reported by NWS to have reached heights greater than 9 km
SU
IN a.m.s.l. (approximately 30,000 ft), which moved slowly to the
k
Iliamna N
Coo
Volcano PE o
60 north and northeast (Power and others, 2006). On January 13,
AI
K EN a third explosive event occurred, which lasted for 11 minutes
na and produced volcanic plumes/ash clouds detected to 10 km
e I liam Homer
an
Lak
(33,000 ft) a.m.s.l. During January 13, there were five discrete
ce
Augustine
O
Volcano Seldovia
fic
events, followed by events on January 14 and 17 (see table 1).
ci
Pa
Kamishak
Bay
0
Figure 3A is a time-lapse camera image from Augustine Island
50 100 KILOMETERS
Mount Douglas that shows that the events on January 13 were ash rich, and by
Fourpeaked Mountain 0 30 60 MILES
January 28, the continuous-phase eruptions were a mixture of
steam, gases and some ash (fig. 3B).
Figure 2. Map showing location of Augustine Volcano, in Cook In response to these explosive eruptions, the Puff
Inlet, southwest of Anchorage, Alaska. Grey triangles show the model was used by AVO to track and predict the movement
locations of the volcanoes within this region of Alaska. of the volcanic ash clouds. The model simulations were
510   Professional Paper on Metallogenesis and Tectonics of Northeast Asia

compared with all available satellite remote-sensing data.          to 4 km (~13,000 ft) a.m.s.l. frequently during the continu-
During the 2006 eruption, satellite data were available from        ous phase. Winds carried ash to the south, depositing trace
the Advanced Very High Resolution Radiometer (AVHRR)                amounts on Kodiak Island and interrupting air traffic at the
on the National Oceanic and Atmospheric Administration              Kodiak Airport, and then carried ash north across Alaska
(NOAA) satellites, the Moderate Resolution Imaging Spec-            (Webley and others, 2008).
troradiometer (MODIS) on National Aeronautics and Space
Administration (NASA) Terra and Aqua satellites and the
NOAA Geostationary Operational Environmental satellites             Puff Model Simulations
(GOES). Bailey and others (this volume) provide a descrip-
tion of the data for both thermal monitoring and the detec-               At AVO, once a volcanic event was confirmed, the Puff
tion of the volcanic ash clouds. On January 28, the volcano         model was used to predict the movement of the subsequent
entered a period of more continuous eruptive activity that          ash cloud for the following 24-hour period. Initially, several
lasted until February 2. This phase began with four explo-          assumptions were made for the plume height, eruption dura-
sive eruptions that generated ash plumes up to 9 km (30,000         tion, particle-size distribution, and vertical distribution of
ft) a.m.s.l (Power and others, 2006). Ash plumes ascended           the ash particles in the plume. As more information became
                                                                    available, the model prediction was updated to provide a
                                                                    better representation of the ash cloud movement. The Puff
                                                                    model uses numerical weather prediction (NWP) forecasts
 A                                                                  for its advective term when predicting the future movement
                                                                    of a volcanic cloud trajectory. During the Augustine erup-
                                                                    tion, the North American Mesoscale model (NAM) domain
                                                                    216 was used; this is a 32-km spatial resolution data set.
                                                                    Additional NWP forecasts were available from the Weather
                                                                    Research Forecast (WRF) model at 1.67-km and 5-km spa-
                                                                    tial resolutions. However, this was an experimental data set
                                                                    and so was not used during the eruption response.
                                                                          For this paper, AVHRR channel 4 (10.2–11.2 micron)
                                                                    and channel 5 (11.5–12.5 micron) data were used to detect
                                                                    ash clouds, including generating “split window” images,
                                                                    using the reverse absorption method, first noted by Prata
                                                                    (1989a, b). AVHRR channel 4 data are useful for detect-
                                                                    ing opaque ash clouds (Dean and others, 2002) and the
                                                                    reverse absorption method becomes a useful tool once the
                                                                    ash clouds are “semi-transparent”. Here we use the reverse
 B                                                                  absorption method through a brightness temperature dif-
                                                                    ference (BTD) of the infrared channels as stated by Prata
                                                                    (1989a). Eruption clouds early on in their development
                                                                    can fail to allow discrimination of ash, given that they are
                                                                    spectrally opaque (Wen and Rose, 1994; Krotkov and oth-
                                                                    ers, 1999; Simpson and others, 2000). Part of the ash cloud
                                                                    needs to be “translucent”, which indicates a low optical
                                                                    depth, for the reverse absorption method to be successful.
                                                                    The ash signal can be affected by water vapor in the atmo-
                                                                    sphere, which can cause the signal sometimes to become
                                                                    slightly negative, even there is not ash present in the atmo-
                                                                    sphere (Simpson and others, 2000; Prata and others, 2001;
                                                                    Simpson and others, 2001). Additionally, ice within volcanic
                                                                    clouds can cause the reverse absorption method to be inef-
                                                                    fective (Rose and others, 1995).
Figure 3. Photographs of Augustine Volcano’s 2006 eruption.
A, Time lapse camera image taken on January 13, 2006, from a
site at Burr Point, 5 km north of Augustine’s summit (Paskievitch   January 11, 2006
and others, this volume). B, Oblique aerial photograph of a steam
plume with minor ash, extending northeast from Augustine                On January 11, 2006, Augustine Volcano had two
Volcano on January 30, 2006. The view is from southwest. AVO        explosive events at 0444 and 0512 Alaska Standard time
photo by R.G. McGimsey.                                             (AKST; 1344 and 1412 UTC), as much as 3 minutes 13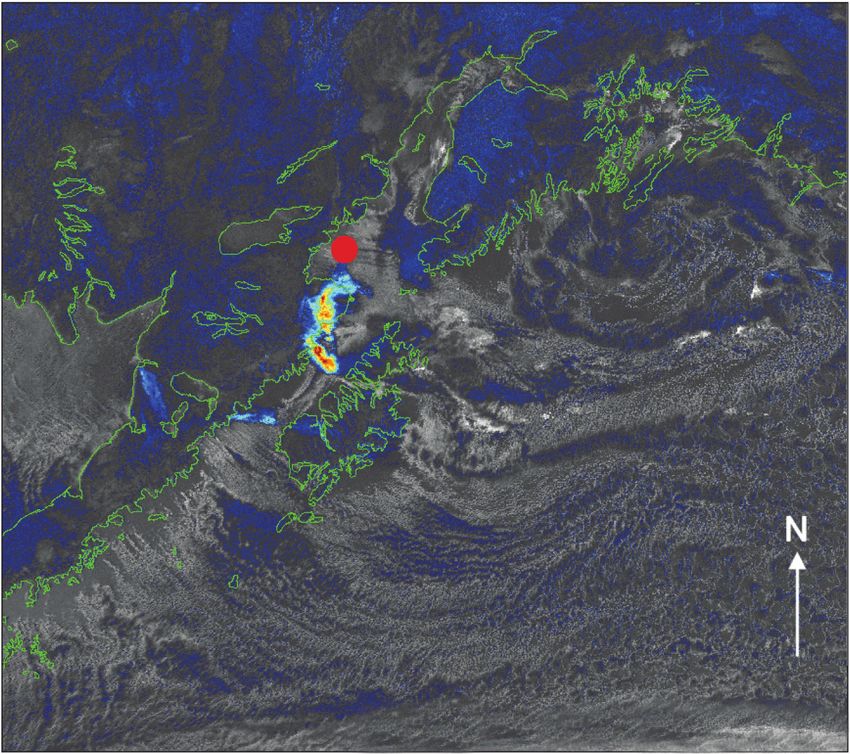
21. Volcanic-Ash Dispersion Modeling of the 2006 Eruption of Augustine Volcano Using the Puff Model 511

Table 1. Volcanic eruption parameters for Augustine’s 2006 explosive and continuous phases, as used by the Puff model.
[All heights a.m.s.l . UTC = coordinated universal time, AKST = Alaska Standard Time, Jan = January, Feb = February, km = kilometers, ft = feet, s = seconds,
min= minutes. AKST = UTC – 9 hours. Note that the start and end times of the eruptive events were determined from AVO seismic stations]

 Event No.                Date             Start Time (AKST)           End Time (AKST)               Duration           Plume Height1         Plume Height2

      1               11 Jan 2006          04:44:00                     04:45:18                     1 min 18 s           30,000 ft               6.5 km
                                           (13:44:00 UTC)               (13:45:18 UTC)                                    (~9 km)
      2               11 Jan 2006          05:12:00                     05:15:18                     3 min 18 s           28,000 ft             10.2 km
                                           (14:12:00 UTC)               (14:52:18 UTC)                                    (~8.5 km)
      3               13 Jan 2006          04:24:00                     04:35:00                     11 min               34,000 ft             10.2 km
                                           (13:24:00 UTC)               (13:35:00 UTC)                                    (~ 10.4 km)
      4               13 Jan 2006          08:47:00                     08:51:17                     4 min 17 s           30,000 ft +           10.2 km
                                           (17:47:00 UTC)               (17:51:17 UTC)                                    (~ 9 km+)
      5               13 Jan 2006          11:22:00                     11:25:24                     3 min 24 s           36,000 ft +           10.5 km
                                           (20:22:00 UTC)               (20:25:24 UTC)                                    (~ 11 km+)
      6               13 Jan 2006          16:40:00                     16:44:00                     4 min                34, 000 ft +          10.5 km
                                           (1/14 01:40:00 UTC)          (1/14 01:44:00                                    (~ 10.4 km+)
                                                                        UTC)
      7               13 Jan 2006          18:58:00                     19:01:00                     3 min                30,000 ft             13.5 km
                                           (1/14 03:58:00 UTC)          (1/14 04:01:00                                    (~ 9 km)
                                                                        UTC)
      8               14 Jan 2006          01:14:00                     01:17:00                     3 min                ~ 30,000 ft           10.2 km
                                           (09:14:00 UTC)               (09:17:00 UTC)                                    (~ 9 km)
      9               17 Jan 2006          07:58:00                     08:02:11                     4 min 11 s          45,000 ft              13.5 km
                                           (16:58:00 UTC)               (17:02:11 UTC)                                   (~ 13.7 km)
      10              27 Jan 2006          20:24:00                     20:33:00                     9 min               30,000 ft              10.5 km
                                           (1/28 05:24:00 UTC)          (1/28 05:33:00                                   (~ 9 km)
                                                                        UTC)
      11              27 Jan 2006          22:37:21                     22:38:45                     1 min 2 s           < 10,000 ft             3.8 km
                                           (1/28 08:37:21 UTC)          (1/28 08:38:45                                   (< 3 km)
                                                                        UTC)
      12              28 Jan 2006          02:04:13                     02:06:40                     2 min 6 s           26,000 ft               7.3 km
                                           (11:04:13 UTC)               (11:06:40 UTC)                                   (~ 8 km)
      13              28 Jan 2006          07:42:00                     07:45:00                     3 min                25,000 ft               7 km
                                           (16:42:00 UTC)               (16:45:00 UTC)                                    (~ 7.6 km)
 continuous           28 Jan 2006          14:30:00                     1 Feb 2006                   4 days              10,000 –                 3.8 km 4
 phase                                     (23:30:00 UTC)                                                                14,000 ft 3
                                                                                                                         (~ 3 – 4.3 km)

  1
      Eruption response plume height from NWS.
  2
      NEXRAD radar plume height.
  3
      Discrete events to 30,000 ft.
  4
      Discrete events to 7.2 km. 1 km = 3,280 ft.

seconds in duration, and that produced ash clouds of 8–9                        similar patterns in both simulations (fig. 4): a spiral-shaped
km a.m.s.l. (26,000–30,000 ft) (table 1). Once the explo-                       ash cloud with the ash above 6 km (20,000 ft) a.m.s.l
sions were detected by the AVO seismic network, the Puff                        drifting mostly east away from Augustine and across the
model was implemented to predict the movement of the                            Kenai Peninsula and the lower ash, < 6 km a.m.s.l, drifting
emitted ash clouds using a default plume height of 16 km                        mostly north. Initially, an opaque ash cloud was detected by
a.m.s.l (52,000 ft), to ensure that the full eruption column                    satellite data (fig. 5A). Once translucent, this ash cloud was
was included. For these two events, Puff predicted very                         detectable by the reverse absorption method (fig. 5B), with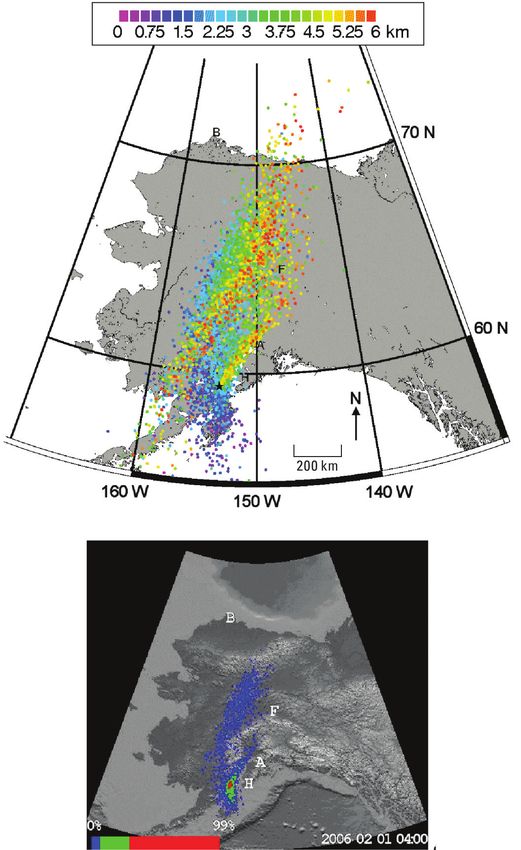
512 The 2006 Eruption of Augustine Volcano, Alaska
    A                                                                                       B

                                                                                 60o N                                                                                  60o N

                                       150o W                                                                                 150o W

     C                                                                                      D

                                                                                 60o N                                                                                  60o N

                                       150o W                                                                                   150o W

Figure 4. Puff eruption response simulations for the January 11, 2006 explosions. A and B for the first event at 0444 AKST (1344 UTC) eruptions at +1 and +6 hours. C and D
are for the second event at 0512 AKST (1412 UTC) eruption at +1 and +6 hours. Times are in UTC, and particles are color-coded by elevation a.m.s.l.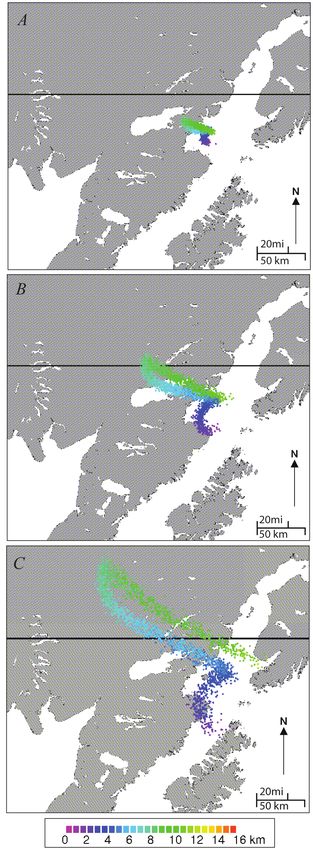
21. Volcanic-Ash Dispersion Modeling of the 2006 Eruption of Augustine Volcano Using the Puff Model 513

a negative brightness temperature difference (BTD) signal.         tracked using the “multiple eruption” option in the Puff
For these two events on January 11, the ash cloud was only         model. This was the first time that this tool had been applied
detectable in a few satellite images. The NWS tracked the          during an eruption response. The tool allows Puff to predict
plume moving north towards the west side of Cook Inlet,            the movement of many volcanic ash clouds at one time. As
corresponding to the low level sections of the Puff forecast       each of the six events was confirmed, the model predictions
below 6 km a.m.s.l. The explosive events on January 11             were then updated. For each new prediction, the Puff model
showed little ash in the satellite data, consistent with inter-    integrated the new and older ash clouds to track all of them
pretation of seismic signals from the events, which suggest        together, so all six plumes’ movements were forecasted
the explosions were mostly caused by gas release (McNutt           simultaneously. These forecasts were then compared to any
and others, this volume).                                          additional data once available.
                                                                        Figure 6 shows the volcanic ash plumes detected on
                                                                   several AVHRR satellite images during January 13–14.
January 13–14, 2006                                                Figure 6A shows the first plume at 0609 AKST (1509 UTC)
                                                                   on January 13 drifting east across Cook Inlet towards the
      Starting at 0424 AKST (1324 UTC) on January 13,              Kenai Peninsula. Figure 6B shows that there were two ash
Augustine Volcano had six further explosive events. On             plumes detectable in the satellite data at 1024 AKST (1924
the basis of the AVHRR satellite sensor data, the events           UTC). The first was over the Kenai Peninsula, with a weak
on January 13 and 14 (fig. 6) showed a stronger ash signal         ash signal, and the second was to the east of Augustine
than seen for the second explosive event on January 11             Volcano, in Cook Inlet. Figure 6C shows three detected ash
(fig. 5). The first event on January 13 started at 0424 AKST       clouds at 1203 AKST (2103 UTC) that moved in an east-
(1324 UTC), had an 11-minute duration, and produced an             northeast direction. By 2020 AKST on January 13 (0520
ash cloud that ascended to approximately 10 km a.m.s.l             UTC on January 14), these first three plumes had dispersed
(33,000 ft) (table 1). Within approximately 24 hours, there        and moved out into the Gulf of Alaska. Figure 6D shows the
would be five more explosive events lasting around 3 to 4          fourth and fifth plumes (events 6 and 7 in table 1), which
minutes each, and producing ash columns from 9 to 11 km            moved in a more south-easterly direction, through the strait
a.m.s.l (30,000–36,000 ft) (table 1). The movements of ash         between the Kenai Peninsula and Kodiak Island and out
clouds from these events were predicted and simultaneously         into the Gulf of Alaska, with the strongest ash signal at the

               N
    A                                                                B
                                                                                  N

                                                      Augustine                                              Augustine
                                                       Volcano                                                Volcano

                      20 mi
                                                                                       20 mi
                                  Band 4 Temperature (oC)                                                    BTD
                      50 km                                                            50 km

  Figure 5. Advanced Very High Resolution Radiometer (AVHRR) satellite sensor data as images from January 11, 2006. A, Opaque
  ash cloud at 0448 AKST (1348 UTC). B, Ash signal, shown as brightness temperature differences (BTD), at 0659 AKST (1559 UTC). BTD
  scale is difference in AVHRR channels 4 and 5 using the reverse absorption method.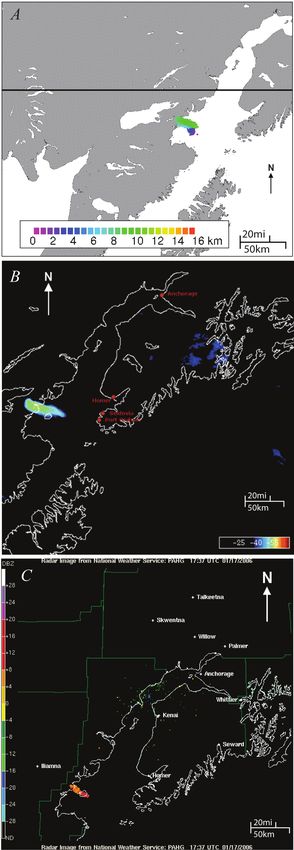
514 The 2006 Eruption of Augustine Volcano, Alaska

“head” of the ash clouds. Additional discussion of the satel-                of these multiple ash clouds simplified a very complex geo-
lite data collected on January 13–14 is included in Bailey                   graphic problem of displaying and accounting for all of the
and others (this volume). Figure 7 shows time-snapshots                      ash clouds at one given time and demonstrated that we can
during the Puff model forecasts of the six plumes (events 3                  track and forecast all of them to make a hazard assessment.
to 8 in table 1) from January 13–14 as they drift across the                      Figure 8 shows a comparison of the Puff eruption
Gulf of Alaska. The simultaneous forecast of the movement                    response forecasts to the AVHRR satellite sensor data

    A                                                                          B

                                         Brightness Temperature Difference                                       Brightness Temperature Difference
                          20mi                                                                     20mi
                          50 km                                                                    50 km

    C                                                                          D

                                         Brightness Temperature Difference                                       Brightness Temperature Difference
                          20mi                                                                     20mi
                          50 km                                                                    50 km

 Figure 6. Time-snapshot series of the multiple plumes from Advanced Very High Resolution Radiometer sensor satellite data using
 reverse absorption method, BTD, on January 13, 2006. A, 0609 AKST (1509 UTC). B, 1024 AKST (1924 UTC). C, 1203 AKST (2103 UTC). D,
 2020 AKST (0520 UTC on 14 January 2006). BTD scale is difference in AVHRR channels 4 and 5 using the reverse absorption method.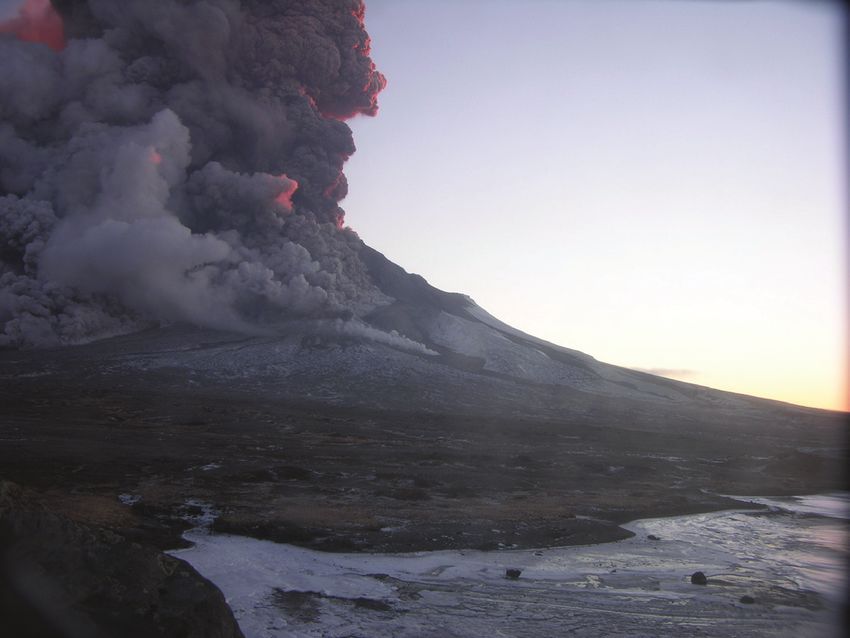
21. Volcanic-Ash Dispersion Modeling of the 2006 Eruption of Augustine Volcano Using the Puff Model 515

     A                                                                B

     C                                                                D

     E                                                                F

                                     100 mi
                                     200 km

Figure 7. Time snapshots during the 24 hour Puff simulations from the six plumes during January 13–14, 2006. A, January 13 at 0520
AKST (1420 UTC). B, January 13 at 1020 AKST (1920 UTC). C, January 13 at 15:20 AKST (14 January at 0020 UTC). D, January 13 at 1820
AKST (14 January at 0320 UTC). E, January 13 at 2120 AKST (14 January at 0620 UTC). F, January 14 at 0720 AKST (1620 UTC). Date and
times in Puff model forecasts are in UTC, and particles are color-coded by elevation a.m.s.l.
516 The 2006 Eruption of Augustine Volcano, Alaska

from the events on January 13 and 14. Figure 8A shows the       concentrations, a spatial comparison was the only possible
AVHRR sensor satellite data at 1246 AKST (2146 UTC)             method for data comparison. Here, the “footprint match”
on January 13. Here, the first three events from January 13,    between the Puff predictions and the satellite data is empha-
events 3–5 in table 1, are detected with the reverse absorp-    sized by points labeled 1, 2 and 3 (fig. 8C). From the Puff
tion method in the satellite data, giving a negative BTD        forecasts, the modeled ash at altitudes from 8–10 km a.m.s.l.
signal. Figure 8B shows the Puff forecast at 1250 AKST          (26,000–33,000 ft) matches the satellite data. As the ash
(2150 UTC), within 5 minutes of the satellite data. Figure      clouds were detectable in the satellite data using the reverse
8C shows a comparison of the two data sets, by evaluating       absorption method and a negative BTD signal, they were
their spatial footprint. As we were unable to determine ash     termed translucent. Determination of their altitude is only
retrievals and then use the Puff model to predict airborne      possible from this comparison method with Puff. The Puff

       A                                                          C

                                                                                                                         60oN

                                                  Brightness
                                                 Temperature
                                                  Difference
                          20 mi                                                                                  20 mi
                          50 km
                                                                                            150oW                50 km

        B
                                                                      Figure 8. Comparison between Advanced Very
                                                                      High Resolution Radiometer (AVHRR) sensor
                                                                      remote-sensing data and the first three plumes from
                                                                      the January 13–14 explosive events. A, AVHRR at
                                                                      1246 AKST (2146 UTC) on January 13. Brightness
                                                         60oN
                                                                      temperature difference (BTD) scale is difference in
                                                                      AVHRR channels 4 and 5 using the reverse absorption
                                                                      method. B, Puff-eruption response simulation at
                                                                      1250 AKST (2150 UTC). Date and times are in UTC,
                                                                      and particles are color-coded by elevation a.m.s.l. C,
                                                                      AVHRR BTD plumes superimposed on the Puff model
                                                                      simulation (Puff plumes match to satellite noted at
                                                                      points 1, 2 and 3).

                                                 20 mi
                                    150oW        50 km
21. Volcanic-Ash Dispersion Modeling of the 2006 Eruption of Augustine Volcano Using the Puff Model 517
simulations were able to match the ash cloud movements, altitude. In addition, there is a “time stamping option”, high-
even though they showed a larger amount of dispersion. This lighted within the box in figure 9B, which allows an animation
increased dispersion could be a result of (1) the ash concen- of ash cloud movement. This three-dimensional viewpoint and
trations seen in the modeled cloud being below the detection interactive ability is a novel tool for analyzing the disper-
limits of the reverse absorption technique or (2) in the model sion model forecasts, something that is not possible with the
forecast, the dispersion factor being set too high. graphical map image.
In the past few years, virtual globes, specifically Google Additional comparison data during the January 13–14
Earth™, have been used for displaying scientific data. They period included ashfall reports in Homer/Port Graham on
allow the Puff model predictions to be shown in their three- January 13, as well as Shasta County, California, on Janu-
dimensional form. Figure 9 shows both a graphical representa- ary 16 (Wallace and others, this volume) and aerosol data
tion of the Puff model forecast and a three-dimensional view collected in Homer on January 13 (Cahill and others, unpub.
of event 3 on January 13. Figure 9A shows the ash cloud’s data). All reports indicate that ashfall was very light. Figure
location in a graphical plan view, with no three-dimensional 8B shows the Puff simulation of the low level ash cloud
viewpoint. Here, the ash cloud altitudes are shown as color- moving towards Homer and the Kenai Pennisula, towards
coded particles from 0 to 16 km a.m.s.l (0 to 52,000 ft). Figure the ashfall reports in Port Graham and aerosol samplers in
9B shows a three-dimensional viewpoint of the same Puff Homer. In addition, the Puff simulations of the six plumes
prediction in Google Earth. Selecting each ash particle in (fig. 7F) show that the forecasted ash clouds could have
Google Earth, the observer is provided with its location and passed over the northwestern contiguous United States,
A B
Figure 9. Comparison of Puff
simulation in Google Earth™. A, Puff
simulation time snapshot from 2006
eruption at Augustine Volcano. Red
arrow indicates the direction of
view in B. B, Google Earth™ image
from same time interval illustrating
the three-dimensional movement
of the ash cloud. Date and times in
Puff forecast is in UTC, and particles
are color-coded by elevation a.m.s.l.518 The 2006 Eruption of Augustine Volcano, Alaska
towards the reported ashfall in California. Peterson and
others (2010) provide a comparison of the Puff simulations
during the events on January 13–14 with those using the
HYSPLIT and CanERM VATD models.
January 17, 2006
Following 3 days of relative quiescence, on January
17, 2006, Augustine had a single explosive event starting
at 0758 AKST (1658 UTC), and lasting 4 minutes and 11
seconds, with a volcanic ash plume rising to an altitude
of approximately 13 to 14 km a.m.s.l (43,000–46,000 ft)
(event 9 in table 1). The ash cloud was only detected on 3
AVHRR satellite images (Bailey and others, this volume).
Figure 10 shows the Puff model simulations in response to
20 mi the detected eruption at 1 hour, 3 hours, and 6 hours after
the start of the event. Here, the high altitude sections of
the ash cloud travel north-northwest, and the low altitude
sections travel to the southwest. Figure 11 shows a com-
parison between the Puff model simulations, the AVHRR
satellite sensor data and the NWS Next Generation Radar
(NEXRAD). Comparison between the Puff simulation (fig.
11A) and the satellite data (fig. 11B) show that the detected
opaque ash cloud is at 8 to 10 km a.m.s.l (26,000–33,000 ft).
The 0300 AKST January 17, 2006 radiosonde sounding col-
lected from Kodiak, King Salmon, and Anchorage stations
(http://weather.uwyo.edu/upperair/naconf.html), indicate
that the −55.45oC temperature in figure 11B corresponds to
approximately 8.5 to 9 km a.m.s.l (26,000-30,000 ft), using
the altitude-temperature method of Sparks and others (1997)
as developed from Kienle and Shaw (1979). NEXRAD, in
clear air mode, shows very little reflectivity across Cook
Inlet except for signals of +4 to +16 DBZ at Augustine (fig.
20 mi 11C). The match in timing between the three datasets pro-
vides good agreement that (1) the radar was able to detect
the ash cloud, (2) the Puff model results matched the satel-
lite data, and (3) the ash cloud was at 8 to 10 km a.m.s.l.
(26,000–33,000 ft).
In addition, a retrospective comparison between the
Puff predictions and measured ashfall from the Janu-
ary 17 event was used to assess the Puff model’s ability
to reliably forecast ashfall (fig. 12). Figure 12A, adapted
from Wallace and others (this volume), shows that ashfall
occurred to the northwest of Augustine Volcano towards
Lake Iliamna (location is shown in Figure 2). There are also
ground observations of ashfall from Iliamna, Pedro Bay,
Figure 10. Puff time snapshots following simulation of January
20 mi 17, 2006 explosive event. A, +1 hour or 0858 AKST (1758 UTC). B,
+3 hours or 1058 AKST (1958 UTC). C, +6 hours or 1358 AKST (2258
UTC). Date and times are in UTC, and particles are color-coded by
elevation a.m.s.l.21. Volcanic-Ash Dispersion Modeling of the 2006 Eruption of Augustine Volcano Using the Puff Model 519
and Nondalton from local citizens. Figures 12B–12D show
the Puff modeled ashfall predictions using three different
wind-field datasets: National Centers for Environmental
Prediction (NCEP) global reanalysis, WRF 5-km resolution
and WRF 1.67-km resolution. For the reanalysis wind-field
data (fig. 12B), the Puff-forecast ashfall occurs mostly over
Cook Inlet. Although no ashfall samples were collected,
there were ashfall reports at Port Graham, and the reanalysis
forecast suggests that it could have been from this eruption,
on the basis of a few predicted ashfall particles in the area.
Because Puff is a tracer model, ashfall amounts can be simu-
lated only relative to other locations, but light ashfall would
be consistent with the model prediction.
Using the higher spatial resolution wind-field data from
WRF, figures 12C and 12D show a very different ashfall
20 mi pattern. Figure 12C predicts ashfall north of the volcano
50 km towards Pedro Bay and north-west towards Port Graham.
Figure 12D predicts ashfall both southeast over the ocean
and northwest towards Lake Iliamna (its location is shown
in figure 2). This 1.67-km spatial resolution wind field was
an experimental dataset used during the eruption, and as a
result its spatial domain doesn’t extend much beyond 20
km from the volcano. A larger domain at this finer spatial
resolution could have resulted in a better match between the
Puff model forecasts and the ashfall reports and measure-
ments shown in figure 12A. The Puff model uses the wind
field for its advection term, and the speed and direction for
all particles is determined from the wind-field model data.
A coarse resolution wind-field dataset requires interpolation
to determine the wind field for each ash particle. Finer grids
require less interpolation and hence more accurate represen-
tation of the actual atmospheric conditions.
20 mi This retrospective analysis suggests that an area like
50 km Cook Inlet, which has complex winds due to surround-
ing mountainous terrain and numerous valleys open to the
ocean, requires higher resolution wind fields to better model
the atmospheric boundary layer. This could result in more
accurately modeled volcanic ashfall, an important factor
for producing volcanic ashfall advisories in volcanic crises.
Other factors, such as size distribution, aggregation, and
deposition processes can also affect ashfall forecasts. How-
ever, a better representation of the wind field in the model’s
advective term will provide an improved forecast for both
airborne ash movement and ashfall. Figures 10 through 12
have shown that the Puff model was able to match both the
Figure 11. Three views of the January 17, 2006, explosive event.
A, Puff model output from 0838 AKST (1738 UTC). Times are in UTC,
and particles are color-coded by elevation a.m.s.l. B, Advanced
Very High Resolution Radiometer single channel satellite data
from 0838 AKST (1738 UTC), showing cold temperatures of the
20 mi infrared spectrally opaque ash cloud. C, NEXRAD radar from 0837
50 km
AKST (1737 UTC).520 The 2006 Eruption of Augustine Volcano, Alaska
radar and satellite data for the January 17 event, but they January 28 to February 2, 2006
also show how higher resolution wind-field data are needed
for the Puff model to provide reliable forecasts of ash- On January 27–28, 2006, at 2024 to 0742 AKST
fall. After this single event on January 17, the next events Augustine Volcano again produced several explosions
occurred on January 28 and led to the continuous eruptive (events 10–13 in table 1), lasting as long as 9 minutes with
phase from January 28 to February 10, 2006, with declining ash plumes varying from 3 to 9 km (10,000–30,000 ft)
vigor from February 2 to 10. a.m.s.l. that dispersed to the southeast and south-southwest.
20 mi
50 km
20 mi
50 km
20 mi
50 km
Figure 12. Measurements and simulations of ashfall from January 17, 2006 event. A, Ashfall isopach in g/m2, (from Wallace and
others, this volume). B, Puff model simulated ashfall from post event analysis with NCEP reanalysis wind field. C, Puff model simulated
ashfall from post event analysis with WRF 5-km resolution wind field. D, Puff model simulated ashfall from post event analysis with WRF
1.67-km resolution wind field. Ashfall particles are color-coded by ground elevation a.m.s.l.21. Volcanic-Ash Dispersion Modeling of the 2006 Eruption of Augustine Volcano Using the Puff Model 521
Then the volcano was relatively quiet for several hours from 31. The movement of the ash clouds was initially in a southerly
0742 AKST (1642 UTC) until around 1430 AKST (2330 or south-easterly direction on January 28, shifting to a more
UTC), when seismicity began to increase. This led to the southerly direction by January 29, then an easterly direction on
continuous phase as seen in the NEXRAD radar, which January 30, and a northeasterly direction by January 31. These
immediately started to detect a signal over the volcano, from observations support Puff forecasts for this time period (fig.
ash emission, that continued for several days (D. Schneider, 15). Volcanic ash concentrations eventually receded to levels
written communication (2006) and AVO Logs). Over the below the detection limits of the satellite data, with no ash
continuous phase, ash clouds reached approximately 3 to 4.5 clouds detected beyond the Cook Inlet area.
km a.m.s.l (10,000–15,000 ft), with discrete events reach- For the period from January 29 to February 1, the Puff pre-
ing 7.3 km (24,000 ft) (table 1). For the period from January dictions showed an ash-cloud trajectory towards Kodiak Island
28, 2006, onwards, Puff used an initial 5 km (~16,500 ft) (fig. 15A) with a subsequent rotation to the northeast and across
a.m.s.l ash plume and forecast wind fields from the NAM the Kenai Peninsula by the following day (fig. 15B). By the
216 model domain. To make the best use of the forecast third day, predictions indicated a northeasterly trajectory (fig.
data, the model was run for an initial 24 hours (from 1430 15C). Aerosol samples, from an eight stage impactor (described
AKST/2330 UTC on January 28, 2006) and then restarted in Cahill, 2003) were collected at Homer, Alaska, and confirmed
for another 24 hours, continuing in this way until February the presence of ash “at ground level there.” These provide
2. Each new model run used the most recent forecast wind ground-based verification to go with the airborne ash detec-
fields. Figure 13 is an example of the ash signal as detected tion (fig. 14) of the ash within Cook Inlet. Lidar measurements
from the BTD signal using the AVHRR satellite remote-sensing from three distinct systems across Alaska were also used to aid
data on January 28 at 1731 AKST (January 29 at 0231 UTC). in confirming the Puff-model-predicted volcanic ash clouds
There is a very strong negative BTD signal to the south of the from the continuous period (Sassen and others, 2007; Webley
volcano across Kodiak Island. Additional discussion of the and others, 2008). The lidar measurements at two sites were
satellite data is included in Bailey and others (this volume). collected in response to the Augustine volcanic activity and Puff
At the beginning of the continuous phase, the synoptic simulations. Lidar detected the ash cloud under both clear skies
conditions showed that volcanic material would initially move and partially cloudy conditions. The characteristics of the volca-
towards the southeast and then curve rapidly around with a nic ash were distinct from those of the atmospheric clouds. Fig-
northerly heading and be transported rapidly to the Alaska ure 16 shows the Puff model prediction at 1900 AKST, January
interior (Webley and others, 2008). Figure 14, adapted from 31 (0400 UTC, February 1), during the acquisition of the lidar
Webley and others (2008), shows daily AVHRR and MODIS data at one station, as described in Webley and others (2008).
sensor data composites of the ash clouds from January 29 to The lidar data confirmed the presence of the volcanic
cloud overhead at Fairbanks, Alaska, and
also confirmed the independent motion
of the upper and lower level ash clouds.
The location of the ash cloud in figure 16
shows ash passing over Fairbanks (marked
as “F”). Aerosol analysis showed that
ratios of iron to calcium at both Homer
and Fairbanks indicated to a similar source
and under “normal conditions” such ratios
would not have been recorded at Fairbanks
(Cahill and others, unpub. data). Figures
15C and 16 show that Puff-predicted ash
clouds would have passed over Homer and
Figure 13. Advanced Very High Resolution
Radiometer brightness temperature difference
satellite data from January 28, 2006, at 1731
AKST (January 29, at 0231 UTC) showing the
ash signal as detected through the reverse
absorption method. Here, the ash is shown as
50 mi
a negative BTD signal. Location of the volcano
100 km
is show by the red circle.522 The 2006 Eruption of Augustine Volcano, Alaska
Fairbanks at the times the aerosol data were collected. The shown by Sassen and others (2007), an autonomous lidar
measurements of the aerosol signals in the lidar returns pro- could be used by both the meteorological and volcanological
vided a unique confirmation tool to the Puff predictions. communities for eruption crisis monitoring. Lidar measure-
The continuous phase of the eruption provided some ments as an eruption response tool for volcano monitoring
unique validation opportunities for the Puff model predic- could be applied to known erupting volcanoes as well as the
tions. Webley and others (2008) show the possibilities of dispersed volcanic material from a much more distant erup-
lidar being used as a validation tool for volcanology. As tion (Webley and others, 2008).
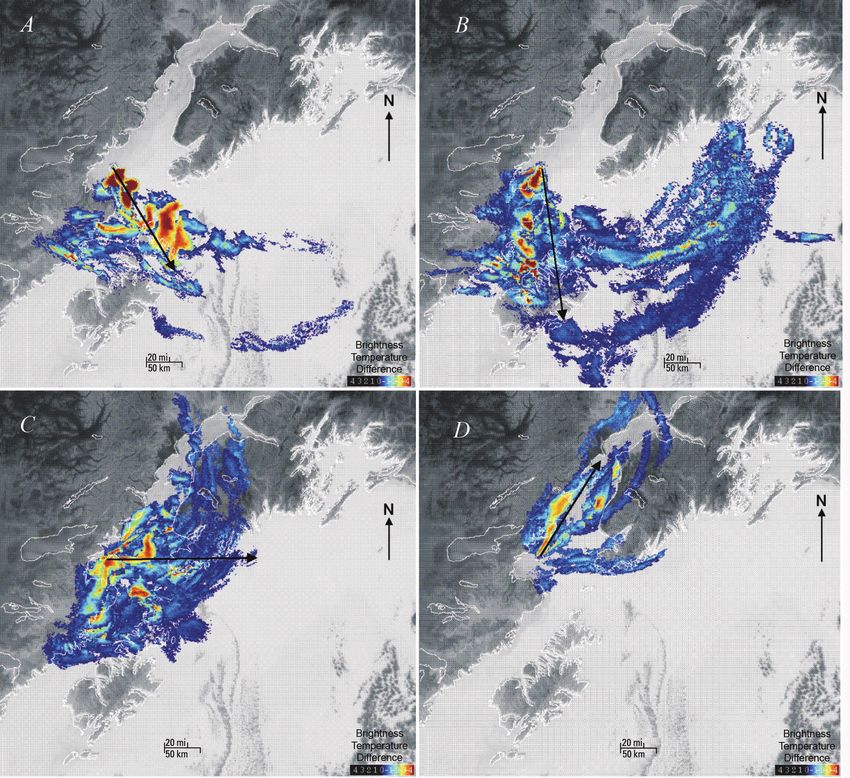
Figure 14 Moderate Resolution Infrared Spectrometer (MODIS) and Advanced Very High Resolution Radiometer data (AVHRR) ash-
detection daily composites for (A), January 28, (B), January 29, (C), January 30 and ,(D), January 31 2006. Black arrows indicate general
direction of ash cloud movement. Adapted from Webley and others (2008). Here, the ash is shown as a negative brightness temperature
difference (BTD) signal.21. Volcanic-Ash Dispersion Modeling of the 2006 Eruption of Augustine Volcano Using the Puff Model 523
A
H
A
H
A
H
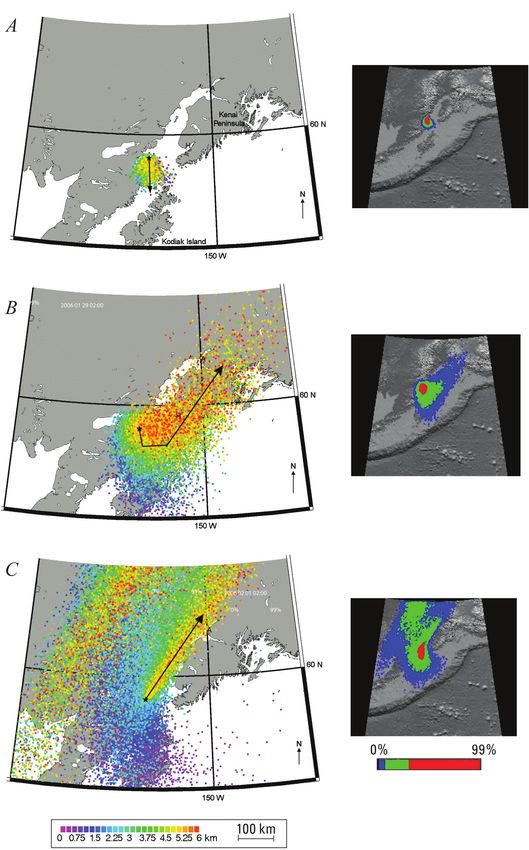
Figure 15. Puff model simulation of ash cloud movement in Cook Inlet during the continuous phase of the 2006 Augustine eruption,
adapted from Webley and others (2008). Black arrows show general direction of the ash clouds movement. A, January 28 at 1700 AKST
(January 29 at 0200 UTC). B, January 29 at 1700 AKST (January 30 at 0200 UTC). C, January 31 at 1700 AKST (February 1 at 0200 UTC).
Date and times in Puff model forecasts are in UTC, and particles are color-coded by elevation. H, Homer; A, Anchorage. Thumbnail
shows relative airborne concentration as a percentage of maximum predicted concentration.524 The 2006 Eruption of Augustine Volcano, Alaska
The Puff volcanic ash transport and dispersion model’s ability
Discussion and Conclusions to track multiple volcanic ash clouds was first used for an
Volcanic ash clouds are a very real hazard during an eruption response during this eruption. Its use was highly suc-
eruption, even after the explosive/effusive activity has ended. cessful during the January 13–14 events and compared well
They can pose a hazard to domestic and international air traf- with the satellite data (fig. 8). The NWS, with assistance from
fic and affect local communities. Also, they can be tracked AVO, produced numerous volcanic ash advisories, and at one
over long distances for several days after the end of an erup- point Anchorage airport was affected, as airline flights were
tive period. The 2006 eruption of Augustine Volcano, Alaska, cancelled. Predicting the movements of these ash clouds from
produced 13 explosive events over a 2-week period, followed Augustine was critical to assess the impact they would have
by a continuous period of ash emission over several days. on their surroundings. The Puff model was able to provide
forecasts of all the ash clouds from the events in table 1. The
model’s predictions were used during the eruption response
by AVO and also the NWS to assess the cloud’s movements
and the impacts they would have on the aviation community
and local residents.
As a result of the enormity of the data obtained dur-
ing the Augustine eruption, the Google Maps™ application
programming interface (API) is now used to display Puff
automated predictions for potential eruptions at volcanoes
of elevated alert status see Puff Web site (http://puff.images.
alaska.edu). Webley and others (2009) provide a detailed
description of the automated predictions and the API to all the
Puff model predictions for these volcanoes. Virtual Globes
are an excellent geographic frame of reference to display
model results that can be easily understood. Figure 9 showed
how displaying the data in a Virtual Globe provides (1) a bet-
ter understanding of ash cloud movement and (2) an ability
to visualize the data in three dimensions. Additional informa-
tion, such as satellite and seismic data can be easily added to
the Virtual Globe interface.
This paper illustrates the reliability of the Puff model
airborne-ash predictions near Augustine Volcano and the distal
ash plumes as compared to various other techniques, such as
remote-sensing satellite data, aerosol samplers, and the lidar
systems. Figure 11 for the January 17 event shows that use of
higher spatial resolution wind fields would improve ashfall
predictions, especially in a topographically diverse region such
as Cook Inlet. Further work on the use of the WRF model for
Puff predictions is required, both for airborne ash movement
and for ashfall forecasts.
During the 2006 Augustine eruption, a large amount of
information was provided by the model predictions. As a result,
an improved tool to provide up-to-date analysis and allow
quick assessments was required. The new automated predic-
tions, now used by AVO, alleviated the requirement to initiate
Puff model runs 24 hours a day, once an eruption was reported.
The 5-minute assessment can be made from these automated
Puff predictions and then “improved” once more information
Figure 16. Puff model simulation snapshot on January 31, on the eruption is available. Since the 2006 eruption of Augus-
2006 at 1900 AKST (February 1, 2006 at 0400 UTC) of ash cloud tine, the Puff model predictions have been used for numerous
movement across Alaska mainland that coincided with lidar volcanoes around the world (Webley and others, 2009). They
measurements, from Webley and others (2008). Particles are used by AVO, NWS, AFWA, and KVERT to determine the
are color-coded by elevation. Black star shows location of movement of volcanic eruption clouds in the NOPAC. Further
Augustine Volcano. H, Homer, A, Anchorage; F, Fairbanks. Lower developments for the Puff model will include determining reli-
panel shows relative airborne concentration as a percentage of able actual airborne volcanic ash cloud concentrations, through
maximum predicted concentration. model initialization from satellite derived ash retrievals, and to21. Volcanic-Ash Dispersion Modeling of the 2006 Eruption of Augustine Volcano Using the Puff Model 525
work with the USGS-led eruption source parameters working Dean, K., Dehn, J. Engle, K., Izbekov, P., Papp, K., and
group (Mastin and others, 2009) to provide improved volcanic Patrick, M., 2002, Operational Satellite Monitoring of
ash forecasts by taking account of past eruption history. Volcanoes at the Alaska Volcano Observatory: Advances in
Environmental Monitoring and Modelling, v. 1, no. 1,
p. 3–35.
Acknowledgments Draxler, R.R., and Hess, G.D., 1997, Description of the
Hysplit-4 modeling system: NOAA Technical Memo ERL
The authors wish to thank the staff and students in the ARL-224, 24 p.
AVO remote-sensing group for their monitoring of Augustine
Volcano and analysis of the remote-sensing satellite data dur- Draxler, R.R., and Hess, G.D., 1998, An overview of the
ing the eruption response. The authors would like to thank Hysplit 4 modeling system for trajectories, dispersion and
the Arctic Region Supercomputing Center (ARSC) for its deposition: Australian Meteorological Magazine, v. 47,
support of Webley’s and Bailey’s postdoctoral fellowships p. 295–308.
during the eruption crisis. The authors also appreciate the Hufford, G.L., Salinas, L.J, Simpson, J.J., Barske, E.G., and
Geophysical Institute at the University of Alaska Fairbanks Pieri, D.C., 2000, Operational Implications of airborne vol-
for their support of the AVO remote-sensing team. canic ash: Bulletin of the American Meteorological Society,
v. 81, no. 4, p. 745–755.
Kienle, J., and Shaw, G.E., 1979, Plume Dynamics, thermal
References Cited energy and long distance transport of Vulcanian eruption
clouds from Augustine Volcano, Alaska: Journal of Volca-
Aloisi, M., D’Agostino, M., Dean, K.G., Mostaccio G., and nology and Geothermal Research, v. 6, no.1–2, p. 139–164.
Neri, A., 2002, Satellite analysis and PUFF simulation of Krotkov, N.A., Torres, O., Seftor, C., Krueger, A.J., Kostinski,
the eruptive cloud generated by the Mount Etna paroxysm A., Rose, W.I., Bluth, G.J.S., Schneider, D. and Schaefer.,
of 22 July 1998: Journal of Geophysical Research, v. 107, S.J., 1999, Comparison of TOMS and AVHRR volcanic
no. B12, doi:10.1029/2001JB000630.
ash retrievals from the August 1992 eruption of Mt. Spurr:
Bailey, J.E., Dean, K.G., Dehn, J., and Webely, P.W., 2010, Inte- Geophysical Research Letters, v. 26, no. 4, p. 455–458.
grated satellite observations of the 2006 eruption of Augustine Mastin, L.G., Guffanti, M., Servranckx, R., Webley, P.W, Bar-
Volcano, in Power, J.A., Coombs, M.L., and Freymueller, J.T., sotti, S., Dean, K., Denlinger, R., Durant, A., Ewert, J.W.,
eds., The 2006 eruption of Augustine Volcano, Alaska: U.S. Gardner, C.A., Holliday, C., Neri, A., Rose, W.I., Schneider,
Geological Survey Professional Paper 1769 (this volume). D., Siebert, L., Stunder, B., Swanson, G., Tupper, A., Volen-
tik, A., and Waythomas, C.F., 2009, A multidisciplinary
Blong, R.J., 1984, Volcanic hazards: A sourcebook on the effort to assign realistic source parameters to model of vol-
effects of eruptions. Sydney. Academic Press, 424 p. canic ash-cloud transport and dispersion during eruptions
Mastin, Larry, and Webley, Peter, eds., in Special Issue on
Cahill, C.F., 2003, Asian aerosol transport to Alaska during Volcanic Ash Clouds: Journal of Volcanology and Geo-
ACE-Asia: Journal of Geophysical Research, v. 108, no. thermal Research, v. 186, no. 1–2, p. 10–21. doi:10.0116/j.
D23, doi:10.1029/2002JD003271. volgeores.2009.01.008.
Casadevall, T.J., 1993, Volcanic hazards and aviation safety, McNutt, S.R., Tytgat, G., Estes, S.A., and Stihler, S.D., 2010,
lessons of the past decade: FAA Aviation Safety Journal, A parametric study of the January 2006 explosive erup-
v. 2, p. 1–11. tions of Augustine Volcano, using seismic, infrasonic, and
lightning data, in Power, J.A., Coombs, M.L., and Freym-
Casadevall, T.J., and Krohn, D., 1995, Effects of the 1992 Cra- ueller, J.T., eds., The 2006 eruption of Augustine Volcano,
ter Peak eruptions on airports and aviation operations in the Alaska: U.S. Geological Survey Professional Paper 1769
United States and Canada: U.S. Geological Survey Bulletin (this volume).
2139, p. 205–220.
Miller, T.P., and Casadevall, T.J., 2000, Volcanic ash hazards
Coombs, M.L., Bull, K.F., Vallance, J.W., Schneider, D.J., to aviation. In: Sigurdsson, H., ed., Encyclopedia of
Thoms, E.E., Wessels, R.L., and McGimsey, R.G., 2010, Volcanoes: San Diego, Academic Press, p. 915–930.
Timing, distribution, and volume of proximal products of
the 2006 eruption of Augustine Volcano, in Power, J.A., Papp, K.R., Dean, K.G., and Dehn, J., 2005, Predicting
Coombs, M.L., and Freymueller, J.T., eds., The 2006 erup- regions susceptible to high concentrations of airborne volca-
tion of Augustine Volcano, Alaska: U.S. Geological Survey nic ash in the North Pacific region: Journal of Volcanology
Professional Paper 1769 (this volume). and Geothermal Research. v. 148, p. 295–314.526 The 2006 Eruption of Augustine Volcano, Alaska
Paskievitch, J., Read, C., and Parker, T., 2010, Remote tele- Simpson, J.J., Hufford, G., Pieri, D., and Berg, J., 2000,
metered and time-lapse cameras at Augustine Volcano, in Failures in detecting volcanic ash from satellite based tech-
Power, J.A., Coombs, M.L., and Freymueller, J.T., eds., The nique: Remote Sensing of Environment. v. 72, p. 191–217.
2006 eruption of Augustine Volcano, Alaska: U.S. Geologi-
cal Survey Professional Paper 1769 (this volume). Simpson, J.J., Hufford, G., Pieri, D., and Berg, J., 2001,
Response to Comments on “Failures in detecting volcanic
Peterson, R., Webley, P.W., D’Amours, R., Servranckx, R., ash from satellite based technique”: Remote Sensing of
Stunder, R., and Papp, K., 2010, Volcanic ash transport and Environment, v. 78, p. 347–357.
dispersion models, in Dean, K.G., and Dehn, J., eds., Moni-
toring volcanoes in the North Pacific—observations from Sparks, R.S.J., Bursik, M.I., Carey, S. N., Gilbert, J.E., Glaze,
space: Springer Praxis, London. L., Sigurdsson, H. and Woods, A. W., 1997, Volcanic
Power, J.A., Nye, C.J., Coombs, M.L., Wessels, R.L., Cervelli, Plumes: Chichester, Wiley, 589 p.
P.F., Dehn, J., Wallace, K.L., Freymueller, J.T., and Dou-
kas, M.P., 2006, The reawakening of Alaska’s Augustine Tanaka, H.L., 1994, Development of a prediction scheme for
Volcano: Eos (American Geophysical Union Transactions), volcanic ash fall from Redoubt Volcano, Alaska in Proceed-
v. 87, no. 37, p. 373–377. ings of the First International Symposium on Volcanic Ash
and Aviation Safety: U.S. Geological Survey Bulletin, 2047,
Prata, A.J., 1989a, Infrared radiative transfer calculations for p. 283–291.
volcanic ash clouds: Geophysical Research Letters, v. 16,
p. 1293–1296. Wallace, K.L, Neal, C.A., and McGimsey, R.G., 2010, Timing,
Prata, A.J., 1989b, Observations of volcanic ash clouds in distribution, and character of tephra fall from the 2005–
the 10-12 µm window using AVHRR/2 data: International 2006 eruption of Augustine Volcano, Alaska, in Power, J.A.,
Journal of Remote Sensing, v. 10, p. 751–761. Coombs, M.L., and Freymueller, J.T., eds., The 2006 erup-
tion of Augustine Volcano, Alaska: U.S. Geological Survey
Prata, F., Bluth, G., Rose, W., Schneider, D., and Tupper, A., Professional Paper 1769 (this volume).
2001, Comments on ‘‘Failures in detecting volcanic ash
from a satellite-based technique”: Remote Sensing of Waythomas, C.F., Dorava, J. M., Miller, T. P., Neal, C. A., and
Environment, v. 78, p. 341–346. McGimsey, R. G., 1998, Preliminary volcano-hazard assess-
Pudykiewicz, J., 1988, Numerical simulation of the transport ment for Redoubt Volcano, Alaska: U.S. Geological Survey
of radioactive cloud from the Chernobyl nuclear accident: Open-File Report OF 98-0857, 40 p.
Tellus, v. 40B, p. 241–259.
Webley, P.W., Dean, K., Collins, R., Fochesatto, J., Sassen, K.,
Pudykiewicz, J., 1989, Simulation of the Chernobyl dispersion
Atkinson, D., Cahill, C., and Prata, A., 2008, Predicting and
with a 3-D hemispheric tracer model: Tellus, v. 41B,
validating the tracking of a volcanic ash cloud during the
p. 391–412.
2006 eruption of Mt. Augustine Volcano: Bulletin of Ameri-
Rose, W.I., Delene, D.J., Schneider, D.J., Bluth, G.J.S., can Meteorological Society. v. 89, no. 11, p. 1647–1658 doi:
Krueger, A.J., Sprod, I., McKee, C., Davies, H. L., and 10.1175/2008BAMS2579.1.
Ernst, G.G.J., 1995, Ice in the 1994 Rabaul eruption cloud;
implications for volcano hazard and atmospheric effects: Webley, P.W., Dean, K., Bailey, J.E., Dehn, J., and Peterson,
Nature, v. 375, p. 477–479. R., 2009, Volcanic ash modeling for North Pacific volcanoes
automated operational monitoring and virtual globes, in Avia-
Sassen, K., Zhu, J., Webley, P.W., Dean, K., and Cobb, P.,
tion Hazards from Volcanoes: Natural Hazards, special issue
2007, Volcanic ash plume identification using polarization
v. 51, no. 2, p. 345–361 doi:10.1007/s11069-008-9246-2.
lidar; Augustine eruption, Alaska: Geophysical Research
Letters. v. 34, no. 8, doi: 10.1029/2006GL027237.
Wen, S., and Rose, W.I., 1994, Retrieval of sizes and total
Searcy, C., Dean, K.G., and Stringer, W., 1998, PUFF; A vol- masses of particles in volcanic clouds using AVHRR bands
canic ash tracking and prediction model: Journal of Volca- 4 and 5: Journal of Geophysical Research, v. 99,
nology and Geothermal Research, v. 80, p. 1–16. p. 542–5431.You can also read