Performance indicators in rugby union - Original Article - Core
←
→
Page content transcription
If your browser does not render page correctly, please read the page content below
Original Article

Performance indicators in rugby union
MICHAEL THOMAS HUGHES 1   , MICHAEL DAVID HUGHES1, JASON WILLIAMS2, NIC JAMES1,
GORAN VUCKOVIC3, DUNCAN LOCKE4

1University of Middlesex, London, UK
2Cardiff School of Management, University of Wales Institute Cardiff, UK
3University of Ljubljana, Slovenia
4PGIR, Bath, UK

                                                     ABSTRACT

Hughes MT, Hughes MD, Williams J, James N, Vuckovic G, Locke D. Performance indicators in rugby
union. J. Hum. Sport Exerc. Vol. 7, No. 7, pp. 383-401, 2012. Team performance in rugby has typically
been assessed through the comparison of winning and losing teams, however, the distinction between
winning and losing was used as the sole independent variable. Thus potential confounding variables that
may affect performance such as match venue, weather conditions and the strength of the opposition were
not considered in this profile of a rugby team. Insufficient data currently exist regarding the development
and measurement of performance indicators in rugby union. In particular, there is little research concerning
position-specific performance indicators and their subsequent performance profiles. Research has also yet
to establish the confidence to which these performance profiles are representative of an individual’s
performance. The aim of this study was to exploit the unique opportunity of a large dataset from the 2011
World Cup, from analysts working with national teams, and combine this with examples of data taken from
previous studies, in an attempt to identify a more focused direction for the analysis of rugby union. The
majority of data collected in the results section were during and after the 2011 Ruby Union World Cup in
New Zealand by professional analysts working for a firm called PGIR, which has the analysis franchise for
the England RFU. All data were checked for accuracy and reliability by cross-referencing actions to post
event from video. It was concluded that in a complex dynamic interactive team sport, such as rugby, that
simple analyses of frequency data, although informative, cannot possibly be expected to model this very
difficult and multivariate problem. Key words: PERFORMANCE INDICATORS, RUGBY UNION

1
    Corresponding author. University of Middlesex, London, UK.
     E-mail: mikehughes@data2win.org
     Submitted for publication October 2011
     Accepted for publication December 2011
     JOURNAL OF HUMAN SPORT & EXERCISE ISSN 1988-5202
     © Faculty of Education. University of Alicante
     doi:10.4100/jhse.2012.72.05
                                                                           VOLUME 7 | ISSUE 2 | 2012 | 383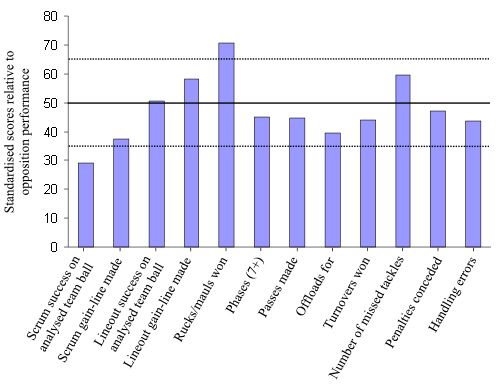
Hughes et al / Performance indicators in rugby union                   JOURNAL OF HUMAN SPORT & EXERCISE

INTRODUCTION

Team performance in rugby union has typically been assessed through the comparison of winning and
losing teams (Hughes & White, 1997; Stanhope & Hughes, 1997; Potter, 1997; Hunter & O’Donoghue,
2001; McCorry et al., 2001; Jones et al., 2004). For example Hunter and O’Donoghue (2001) assessed
positive and negative aspects of attacking and defensive play, changes in possession and methods used to
gain territory during the 1999 rugby union World Cup. Winning and losing sides were found to differ in the
number of occasions that a team entered into the opposition’s last third of the field and the frequency of
attacks by which the team went around the opposition. However, this type of analysis tends to compare
aggregated data of two or more different teams to randomly sample winning and losing sides. This is likely
to obscure individual team differences and as such may not be the most appropriate method for
determining specific strengths and weaknesses for an individual team.

Jones et al. (2004) considered the winning and losing performances of a single team and found a number
of statistically and practically significant differences. For example, while ‘lineout success on the opposition
throw’ differed significantly between winning and losing performances, large observable (but non-
significant) differences were apparent for a number of performance indicators (Hughes & Bartlett, 2002)
such as ‘turnovers won’. A similar study was undertaken by Ortega (2009), where analysis was undertaken
on indicators such as line breaks, possessions kicked and turnovers. These indicators were then correlated
to winning or losing performances in the Six Nations tournament and significant differences were identified
for winning performance. Vaz et al. (2010) tried to link game related statistics that discriminated between
winning and losing teams in International Rugby Board and Super 12 games. However, as with the
previously cited research, the distinction between winning and losing was used as the sole independent
variable. Thus potential confounding variables that may affect performance such as match venue, weather
conditions and the strength of the opposition (James et al., 2002) were not considered in this profile of a
rugby team.

Performance indicators (PIs)
The correct identification and definition of performance behaviors before designing a coding system may be
considered as crucial as highlighted in many papers and books on performance analysis in sport (Rico &
Bangsbo, 1996; O'Donoghue, 2007; Cooper et al., 2007; Hughes & Franks, 2004). These definitions are
then used to define Performance Indicators (PI) in order to define a performance against some form of
outcome or are used in a comparative way, with opponents, other athletes or peer groups of athletes or
teams, but often they are used in isolation as a measure of the performance of a team or individual alone
(Hughes & Bartlett, 2002).

Similarities can be made to Biomechanics where analysis has generally concentrated on analyses of
performance on sports in which the movement technique is critical. The performance goal, or primary
performance parameter, (such as the distance jumped in the long jump) is initially partitioned into
secondary performance parameters – such as the take-off, flight and landing distances in the long jump:
these are sometimes based on phase analysis of the technique (e.g. Bartlett, 1999). In this example, these
partial distances can be normalised by expressing them as ratios of the distance jumped – a similar
approach is often used in the triple jump and, sometimes, in gymnastic vaults. The use of hierarchical
technique models then allows these performance parameters to be related to the movements of the athlete
that contribute to successful execution of the skill. All of these parameters and movement variables can be
considered as performance indicators providing that they do meaningfully contribute to the performance.

 384 | 2012 | ISSUE 2 | VOLUME 7                                                   © 2012 University of Alicante
Hughes et al / Performance indicators in rugby union                  JOURNAL OF HUMAN SPORT & EXERCISE

These performance indicators are usually kinematic variables or parameters, such as body segment
speeds or angles. When trying to relate such indicators to the theoretical mechanisms of the movement,
net joint reaction forces and moments and electromyographic (EMG) descriptors of muscle activation
patterns are also used.

PIs in team sports
Performance analysts have focused on general match, tactical and technical indicators and have
contributed to our understanding of the physiological, psychological, technical and tactical demands of
team sports. For example, in tennis, the performance of a player may be assessed by the distribution of
winners and errors around the court. In soccer, one aspect of a team’s performance may be appraised by
the ratio of goals scored to shots attempted by the team.

These indicators can be categorised as either scoring indicators, or indicators of the quality of the
performance (Hughes & Bartlett, 2002). Examples of scoring indicators are goals, baskets, winners, errors,
the ratios of winners to errors and goals to shots, and dismissal rates. Examples of quality indicators are
turnovers, tackles, passes/possession, shots per rally, and strike rate. Both types of indicator have been
used as positive or negative measures in the analysis of particular performances. If presented in isolation, a
single set of data (indicators for a performance of an individual or a team) can give a distorted impression
of a performance, because of other, more or less important variables. From our reviews of recent research
and the work of many consultants, it is clear that many analysts do not gather sufficient or appropriate data
from a performance to represent fully the significant events of that event. Presenting data from both sets of
performers is often not enough to inform on the performance, see Hughes and Bartlett (2002) for examples.
The comparison of performances between teams, team members and within individuals, by either
performance or biomechanical analysts, is often facilitated if the performance indicators are expressed as
ratios, as in the examples, given by Hughes and Bartlett (2002) above, of the winner/error and goal/shot
ratios, and the ratios of jump phases to overall jump distance. These ratios are explicitly or implicitly non-
dimensional.

James (2006) adapted the form chart method to show a soccer team’s median values for PIs over six
matches compared against the opposition’s values taken from the same six matches. This analysis
suggested that the analysed soccer team had typically outperformed the opposition on all of the PIs but
actual match results had not been particularly good (1 win, 2 draws and 2 defeats). Consequently, this
particular chart had been used as a motivational tool to show the players that their performances had
remained good even though the match results had not necessarily borne this out.

PIs in rugby
A study by Parsons and Hughes (2001) analysed the patterns of play of elite players in a large sample of
international (Six Nations and World Cup) and European club rugby union matches. Specifically, the skill
demands for each playing position were analysed with reference to on- and off-the-ball supporting
activities, with the total number of behaviours found to differ between playing positions, emphasizing the
different requirements of each playing role. However, one of the limitations of Parsons and Hughes’ (2001)
study was that although a clear picture of certain skill demands of individual playing positions were given,
common and specific positional performance indicators were not constructed. In rugby union, each playing
position has role responsibilities that are both unique and common to other positions in the team
(Greenwood, 1997). Acknowledgement of both common and individual behaviours is therefore needed to
present a more accurate representation of a player’s contribution to performance.

                                                                          VOLUME 7 | ISSUE 2 | 2012 | 385
Hughes et al / Performance indicators in rugby union JOURNAL OF HUMAN SPORT & EXERCISE Although a considerable body of research exists across a broad range of sports using match analysis to observe performance, relatively limited information is provided on the actual development of the coding systems adopted to collect data on specific performance indicators. In particular, little detail is provided as to how or why relevant behaviours are selected, defined and coded by the researcher and the subsequent validation procedures undertaken to ensure that the performance behaviours targeted by the analysis system are accurately identified and measured. Despite the work of Hunter and O’Donoghue (2001) and Vivian et al. (2001), insufficient data currently exist regarding the development and measurement of performance indicators in rugby union. In particular, there is little research concerning position-specific performance indicators and their subsequent performance profiles. Research has also yet to establish the confidence to which these performance profiles are representative of an individual’s performance. Consequently, there is a need to develop a rigorous methodology for practitioners to adopt when conducting the analysis of performance behaviours in rugby union (Hughes & Williams, 1988; Potter & Hughes, 1999; Williams, 2012). As with many other sports, within performance analysis there has been limited progress on the standardisation of operational definitions and performance indicators. The formation of individual performance profiles, through the utilization of key performance indicators is therefore an important area of investigation (Hughes & Bartlett, 2002). Performance profiles in rugby The development of performance indicators subsequently leads to the creation of performance profiles, which describe a pattern of performance by a team or individual analysed, typically created from collected frequencies of a combination of key performance indicators that offer some prediction of future performance (Hughes et al., 2001). But to date there has been little guidance in the extant literature on how to develop a performance profile, other than the formative papers by Hughes et al. (2001), James et al. (2005) and O’Donoghue (2002). In Vivian and colleagues’ (2001) study of performance profiles in rugby union, it was suggested that individual skill profiles were suitable for comparison after five matches. Hughes et al. (2001) investigation of the number of samples required for the creation of a performance profile in several sports found that between three and seven matches were needed to create true averages of the main behaviours in rugby union. Intuitively, it would appear that the larger the database of matches analysed, the more accurate the performance profile, but as Hughes et al. (2001) identified, as a database increases in size it becomes more insensitive to changes in playing patterns. Indeed, fluctuations in performance in an invasion game such as rugby union can be dependent upon external factors such as the strength of the opposition, previous performances of the team or individual, the dynamics of the analysed team, and the changing environmental conditions (Hughes & Bartlett, 2002; James et al., 2002; Rue & Salvesen, 2000). Jones et al. (2005) assessed 18 performance indicators (PIs) for team performance using a novel ‘form chart’ to interpret representation of the PIs on the same scale. Performance in one match was compared to previous matches to depict relative performance levels for each of the PIs. This was achieved by standardising the individual match values against the median and inter-quartile range from the previous 15 and 5 match distributions. The number of matches was selected arbitrarily as exemplars and it was suggested that this methodology could enable coaches to isolate areas where performance levels were lower or higher than previously accomplished standards so that training could be modified to address pertinent issues. Furthermore different combinations of PIs could be used to provide both team and individual feedback. 386 | 2012 | ISSUE 2 | VOLUME 7 © 2012 University of Alicante
Hughes et al / Performance indicators in rugby union                   JOURNAL OF HUMAN SPORT & EXERCISE

However, in most sports, perceptions of which performance indicators are most important, vary from coach
to coach. Therefore, if sets of PIs can be identified and clear operational definitions defined, there is
significant scope/benefit for consultancy and research, particularly in commercially orientated sports such
as rugby, soccer, basketball and so on. Insufficient data currently exist regarding the development and
measurement of performance indicators in rugby union. In particular, there is little research concerning
position-specific performance indicators and their subsequent performance profiles. Research has also yet
to establish the confidence to which these performance profiles are representative of an individual’s
performance. The aim of this study was to exploit the unique opportunity of a large dataset from the 2011
World Cup, from analysts working with national teams, and combine this with examples of data taken from
previous studies, in an attempt to identify a more focused direction for the analysis of rugby union.

MATERIAL AND METHODS

To highlight problems associated with current thinking on the definition and presentation of PIs the study
presents collected data on the 2011 Ruby Union World Cup in New Zealand by professional analysts
working for a firm called PGIR, which has the analysis franchise for the England RFU. All data were
checked for accuracy and reliability by cross-referencing actions post event from video. The analyses
presented are those used by the analysts, coaches and players in their preparations for competition. There
is a limited amount of data, the losing quarter-finalists played 5 matches (2 against the top ranked teams)
the semi-finalists played 7 matches (4 against the top teams), so this must be recognised when considering
these data.

RESULTS AND DISCUSSION

The following presents an overview of the data captured from the study that was then used for analysis by
the coaching team identified in the paper. First impressions of the data suggest that there is a wealth of
useful information that could be used to improve performance. Indeed, there is a colourful display of data
in Figure 1 and Table 2, and as a feedback mechanism for coaches working with a team between games in
a tournament, there are a host of messages in terms of actions executed. However, it is difficult to
determine from these data the levels of performance of the respective teams.

                  Table 1. The final ranking of the top 8 teams (Tier A) at the 2011 World Cup.

                            Winner                                            New Zealand
                          Runner-up                                               France
                              Third                                              Australia
                             Fourth                                               Wales
                   Losing Quarter Finalist                                      Argentina
                   Losing Quarter Finalist                                       England
                   Losing Quarter Finalist                                        Ireland
                   Losing Quarter Finalist                                     South Africa

                                                                           VOLUME 7 | ISSUE 2 | 2012 | 387
Hughes et al / Performance indicators in rugby union JOURNAL OF HUMAN SPORT & EXERCISE
In Figure 1, the ‘Points scored per match’, ‘Points scored per match against Tier A teams’, ‘Tries scored per
match’ all give interesting details of performance of the competing teams, but apart from the dominance of
NZ, give no indication of the relative performances of the other teams. Similarly the summary data in Table
2, mainly oriented to time and phases of play, have no possibility of informing on performance outcomes.
RWC 2011: England v the Quarter Finalists
RWC 2011 Points Scored Points Scored per Match v Tier A Teams
Points
Points Scored Points Scored Points/Match Difference 0.0 5.0 10.0 15.0 20.0 25.0 30.0
Nation Scored v
RWC 2011 per Match v Tier A to NZ
Tier A New Zealand 24.5
1 New Zealand 301 43.0 98 24.5 - Ireland 20.3
2 Ireland 145 29.0 61 20.3 -4.2 Wales 16.2
3 Wales 228 32.6 81 16.2 -8.3
Australia 15.2
4 Australia 211 30.1 76 15.2 -9.3
5 England 149 29.8 41 13.7 -10.8 England 13.7
France 13.0
6 France 159 22.7 52 13.0 -11.5
7 South Africa 175 35.0 39 13.0 -11.5 South Africa 13.0
8 Argentina 100 20.0 32 10.7 -13.8 Argentina 10.7
Table 1. Table of Points Scored in the RWC 2011 & v Tier A Teams by each of the Quarter Finalists
- In both Points scored per match and points scored per match v Tier A England were 5th
- Against Tier A teams Enlgand were a Try and a Penalty worse off than New Zealand (10.8 points)
RWC 2011 Tries Scored
Broken Av. Tries
Tries Scored Set Piece Broken Play Tries per SP Tries BP Tries
Nation Set Piece Tries Play Tries Differenc
RWC 2011 Tries % Tries Game per Game per Game
% e v Opp
1 New Zealand 40 22 55% 18 45% 5.7 3.1 2.6 4.6
2 South Africa 21 8 38% 13 62% 4.2 1.6 2.6 3.6
3 Wales 29 10 34% 19 66% 4.1 1.4 2.7 3.3
4 England 20 10 50% 10 50% 4.0 2.0 2.0 3.4
5 Australia 28 13 46% 15 54% 4.0 1.9 2.1 3.3
6 Ireland 16 6 38% 10 63% 3.2 1.2 2.0 1.8
7 France 17 7 41% 10 59% 2.4 1.0 1.4 0.6
8 Argentina 11 6 55% 5 45% 2.2 1.2 1.0 1.0
Table 2. Table of Tries Scored in the RWC 2011
- England scored the 2nd highest amount of Set Piece tries per game (2.0)
- This was over a try per game less than New Zealand (3.1)
- Given that only 40% of England's possession came Set Piece from to score 50% of tries from this shows that perhaps we should have scored more tries from Broken Play
- This is supported by England's Broken Play tries per game only being joint 5th (2.0)
RWC 2011 Tries Scored v Tier A Teams
Broken Av. Tries
Set Piece Tries Set Piece Broken Play Tries per SP Tries BP Tries
Nation Tries v Tier A Play Tries Differenc
v Tier A Tries % Tries v Tier A Game per Game per Game
% e v Opp
1 New Zealand 9 6 67% 3 33% 2.3 1.5 0.8 1.3
2 Wales 8 3 38% 5 63% 1.6 0.6 1.0 0.4
3 Australia 7 4 57% 3 43% 1.4 0.8 0.6 0.8
4 England 4 2 50% 2 50% 1.3 0.5 0.5 0.7
5 Ireland 4 2 50% 2 50% 1.3 0.7 0.7 0.3
6 France 5 1 20% 4 80% 1.3 0.3 1.0 -1.0
7 South Africa 3 2 67% 1 33% 1.0 0.7 0.3 0.0
8 Argentina 2 1 50% 1 50% 0.7 0.3 0.3 -0.3
Table 3. Table of Tries Scored v Tier A teams in the RWC 2011
- Again against Tuer A sides England's split of Set Piece to Broken Play tries was 50:50
- The All Blacks were a try a game better than pretty much all of the teams with sides 2 to 6 in the table being very close in terms of tries scored
- There is very little difference in the sides 2 to 6 in the table in terms of tries scored
Figure 1. Summary data from the 2011 world Cup.
The data presented in Figure 2 tell a similarly confusing story, with strange anomalies within the data.
France, the runners-up in the tournament, had the least line breaks and tries per match, Australia (3rd) had
very few attacking penalties. Although the data presented in the Tables and Figures are correct and
reliable, the meaning that they present is limited as there is no context for the data. For example, the
“Attack Penalties Won” chart does not give the reader how many penalties there were in the game as a
total or how many the opposition gave in a game. The data are interesting, however, for improving
performance their effectiveness in terms of coaching is limited.
388 | 2012 | ISSUE 2 | VOLUME 7 © 2012 University of AlicanteHughes et al / Performance indicators in rugby union JOURNAL OF HUMAN SPORT & EXERCISE
Table 2. Summary data from the 2011 world Cup.
Ball in Rest Possession Possession Possession Phases
Date Round Nation Opposition Result Phases
Play Time Time % s Per Poss
110909 Pool A New Zealand Tonga Win 34:11 0:56:19 16:39 50% 43 100 2.3
110910 Pool B England Argentina Win TIER A 38:38 0:55:24 16:29 47% 44 109 2.5
110910 Pool B Argentina England Loss TIER A 38:38 0:55:24 18:18 53% 39 111 2.8
110910 Pool A France Japan Win 36:21 0:52:06 16:53 48% 47 102 2.2
110911 Pool C Australia Italy Win TIER A 33:24 0:52:17 18:47 54% 56 140 2.5
110911 Pool C Italy Australia Loss TIER A 33:24 0:52:17 15:59 46% 54 103 1.9
110911 Pool D Wales South Africa Loss TIER A 42:35 0:44:18 23:57 57% 54 164 3.0
110911 Pool D South Africa Wales Win TIER A 42:35 0:44:18 17:56 43% 52 125 2.4
110911 Pool C Ireland USA Win 33:49 0:50:42 20:14 61% 48 137 2.9
110916 Pool A New Zealand Japan Win 31:00 0:56:05 16:40 54% 54 106 2.0
110917 Pool B England Georgia Win 35:51 1:00:37 18:07 51% 50 117 2.3
110917 Pool C Australia Ireland Loss TIER A 28:50 1:00:43 13:56 50% 39 87 2.2
110917 Pool C Ireland Australia Win TIER A 28:50 1:00:43 14:10 50% 37 104 2.8
110917 Pool D South Africa Fiji Win 42:28 0:51:40 23:18 56% 51 145 2.8
110917 Pool B Argentina Romania Win 38:08 0:52:04 25:15 68% 51 157 3.1
110918 Pool A France Canada Win 37:09 0:53:06 20:23 57% 56 141 2.5
110918 Pool D Wales Samoa Win TIER A 39:44 0:49:41 17:18 44% 47 118 2.5
110922 Pool D South Africa Namibia Win 36:08 0:51:12 20:35 59% 65 140 2.2
110923 Pool C Australia USA Win 29:46 1:08:35 16:17 49% 52 107 2.1
110924 Pool B England Romania Win 32:28 0:56:31 18:30 57% 53 113 2.1
110924 Pool A New Zealand France Win TIER A 36:34 0:52:28 18:05 51% 48 130 2.7
110924 Pool A France New Zealand Loss TIER A 36:34 0:52:28 17:37 49% 46 121 2.6
110925 Pool B Scotland Argentina Loss TIER A 44:47 0:48:12 23:27 55% 61 166 2.7
110925 Pool B Argentina Scotland Win TIER A 44:47 0:48:12 19:14 45% 60 142 2.4
110925 Pool C Ireland Russia Win 35:36 0:52:59 22:47 67% 55 157 2.9
110926 Pool D Wales Namibia Win 35:24 0:57:29 24:31 72% 53 160 3.0
110930 Pool D South Africa Samoa Win TIER A 41:46 0:57:10 16:51 41% 54 109 2.0
111001 Pool B England Scotland Win TIER A 31:35 0:57:48 16:30 52% 60 114 1.9
111001 Pool B Scotland England Loss TIER A 31:35 0:57:48 15:43 48% 60 118 2.0
111001 Pool C Australia Russia Win 31:55 0:50:21 14:25 47% 43 107 2.5
111001 Pool A France Tonga Loss 36:03 0:58:46 15:38 44% 41 103 2.5
111002 Pool A New Zealand Canada Win 30:59 0:56:55 20:49 62% 56 144 2.6
111002 Pool C Ireland Italy Win TIER A 30:38 0:57:18 15:44 52% 42 118 2.8
111002 Pool C Italy Ireland Loss TIER A 30:38 0:57:18 14:28 48% 43 83 1.9
111002 Pool D Wales Fiji Win 39:15 0:49:58 20:41 53% 63 132 2.1
111002 Pool B Argentina Georgia Win
111008 Quarter-Final England France Loss TIER A 41:58 0:53:54 19:46 50% 53 136 2.6
111008 Quarter-Final France England Win TIER A 41:58 0:53:54 20:08 50% 46 126 2.7
111008 Quarter-Final Wales Ireland Win TIER A 42:33 0:43:56 19:37 46% 52 136 2.6
111008 Quarter-Final Ireland Wales Loss TIER A 42:33 0:43:56 23:03 54% 52 171 3.3
111009 Quarter-Final New Zealand Argentina Win TIER A 38:12 0:53:20 25:20 67% 42 159 3.8
111009 Quarter-Final Argentina New Zealand Loss TIER A 38:12 0:53:20 12:19 33% 33 71 2.2
111009 Quarter-Final Australia South Africa Win TIER A 41:20 0:49:32 14:43 36% 62 104 1.7
111009 Quarter-Final South Africa Australia Loss TIER A 41:20 0:49:32 26:04 64% 64 178 2.8
111015 Semi-Final Wales France Loss TIER A 39:40 0:50:39 24:22 62% 52 164 3.2
111015 Semi-Final France Wales Win TIER A 39:40 0:50:39 14:57 38% 57 102 1.8
111016 Semi-Final New Zealand Australia Win TIER A 39:27 0:50:26 18:56 49% 54 134 2.5
111016 Semi-Final Australia New Zealand Loss TIER A 39:27 0:50:26 19:54 51% 58 135 2.3
111021 3/4th Play-Off Australia Wales Win TIER A 38:28 0:52:35 15:09 38% 53 105 2.0
111021 3/4th Play-Off Wales Australia Loss TIER A 38:28 0:52:35 24:50 62% 56 171 3.1
111023 Final New Zealand France Win TIER A 40:18 0:48:47 18:49 46% 50 122 2.4
111023 Final France New Zealand Loss TIER A 40:18 0:48:47 22:23 54% 46 126 2.7
Figure 2. A selection of charts illustrating the data captured within the study.
VOLUME 7 | ISSUE 2 | 2012 | 389Hughes et al / Performance indicators in rugby union JOURNAL OF HUMAN SPORT & EXERCISE
Table 3 shows an analysis of kicking performance for England, again confusion, the worst figure against
Scotland was a match England won. Additionally, in terms of performance, there is nothing in the data that
indicates how difficult any of the kicks were. For example, a kicking performance of 100% compared to
75% would suggest that the kicker with a success rate of 100% was better than the kicker that had 75%.
However the kicker who had a success rate of 100% may have been able to take the kicks directly in front
of the posts, whereas the kicker who had a success rate of 75% could have taken the kicks from the
touchline. Unless there is some added context to the data, there is little that we can draw from such data.
Table 3. Summary data of England’s goal kicking performance in the 2011 world Cup.
Kicks at Kicks Goal GK % Pens
Nation Opposition Result
Goal Converted Kick % Difference Conceded
England Argentina Win TIER A 8 3 38% 4% 11
England Georgia Win 7 5 71% 42% 14
England Romania Win 11 8 73% 53% 12
England Scotland Win TIER A 7 3 43% -57% 10
England France Loss TIER A 2 1 50% 17% 6
Av. 7 4 55% 12% 10.6
Max. 11 8 73% 53% 14
Min. 2 1 38% -57% 6
Table 4 has some very interesting analyses relating to possession (frequencies and time) and the
productivity measured in pints scored, tries scored and line breaks made. Yet again New Zealand has by
far the best data in all these categories but the other nations have big differences from category to
category. France (2nd) and Argentina (joint 5th) have the worst data in all categories, they vie for 8th place,
the other five teams vary in ranking, so this sophisticated analysis again does not produce any data that
correlate with outcome.
Table 4. RWC 2011 Possession (Poss) - Times & Productivity.
Poss
Poss Poss Poss Poss Poss
Poss per Time per Poss per Time
Nation Time per per Time per Time per per
Match Poss Try per
Match Point Point Try LB
LB
England 52 17:52 0:21 1.7 0:36 13 4:28 9.3 3:12
New Zeal. 49.6 19:20 0:23 1.2 0:27 8.7 3:23 5.3 2:05
France 48.4 18:17 0:23 2.1 0:48 19.9 7:32 14.7 5:34
Australia 51.9 16:10 0:19 1.7 0:32 13 4:03 9.6 2:59
Wales 53.9 22:11 0:25 1.7 0:41 13 5:21 11.4 4:42
South Africa 57.2 20:57 0:22 1.6 0:36 13.6 4:59 9.9 3:37
Ireland 46.8 19:12 0:25 1.6 0:40 14.6 6:00 12.3 5:03
Argentina 45.8 18:47 0:25 2.3 0:56 20.8 8:32 8.3 3:25
390 | 2012 | ISSUE 2 | VOLUME 7 © 2012 University of AlicanteHughes et al / Performance indicators in rugby union JOURNAL OF HUMAN SPORT & EXERCISE
The tries scored in matches should correlate highly with outcome – it is the ultimate aim of the game, and 5
points are given for scoring a try, together with the chance to add 2 more points through a conversion kick.
The analysis in Table 5 clearly shows again the superiority of New Zealand, but few other correlations with
the final ranking order in Table 1. This analysis might be considered more relevant if we examine the
scoring only against the higher ranked teams in the world (Table 6).
Table 5. RWC 2011 Tries Scored.
Tries Broken
Broken Tries BP Tries Av. Tries
Scored Set Piece Set Piece Play SP Tries
Nation Play Tries per per Difference
RWC (SP) Tries Tries % (BP) per Game
% Game Game v Opp
2011 Tries
New
40 22 55% 18 45% 5.7 3.1 2.6 4.6
Zealand
South Africa 21 8 38% 13 62% 4.2 1.6 2.6 3.6
Wales 29 10 34% 19 66% 4.1 1.4 2.7 3.3
England 20 10 50% 10 50% 4 2 2 3.4
Australia 28 13 46% 15 54% 4 1.9 2.1 3.3
Ireland 16 6 38% 10 63% 3.2 1.2 2 1.8
France 17 7 41% 10 59% 2.4 1 1.4 0.6
Argentina 11 6 55% 5 45% 2.2 1.2 1 1
Table 6. RWC 2011 Tries Scored v Tier A Teams.
Set
SP BP
Tries Piece Broken Broken Tries Av. Tries
Set Piece Tries Tries
Nation v Tries Play Tries Play Tries per Difference
Tries % per per
Tier A V v Tier A % Game v Opp
Game Game
Tier A
New Zealand 9 6 67% 3 33% 2.3 1.5 0.8 1.3
Wales 8 3 38% 5 63% 1.6 0.6 1 0.4
Australia 7 4 57% 3 43% 1.4 0.8 0.6 0.8
England 4 2 50% 2 50% 1.3 0.5 0.5 0.7
Ireland 4 2 50% 2 50% 1.3 0.7 0.7 0.3
France 5 1 20% 4 80% 1.3 0.3 1 -1
South Africa 3 2 67% 1 33% 1 0.7 0.3 0
Argentina 2 1 50% 1 50% 0.7 0.3 0.3 -0.3
VOLUME 7 | ISSUE 2 | 2012 | 391Hughes et al / Performance indicators in rugby union JOURNAL OF HUMAN SPORT & EXERCISE
Table 7 shows different rankings, but again no indications of a correlation to Table 1. Similarly, it might be
expected that line breaks made in matches should correlate highly with outcome – it is the ultimate aim of
the game, and will often lead to tries. If the line break is made, the required outcome is indeed some form
of score of advantage from the line break, but unless there is some form of measurable termination point,
such as a try or ground gained, the data has limited use.
Table 7. RWC 2011 Linebreaks.
Set SP BP
Broken Broken
Linebreaks Set Piece Piece Linebreaks LB's LB's
Nation Play Play Tries
RWC 2011 Linebreaks Tries Per Game per per
Linebreaks %
% Game Game
New Zealand 65 33 51% 32 49% 9.3 4.7 4.6
South Africa 29 6 21% 23 79% 5.8 1.2 4.6
England 28 11 39% 17 61% 5.6 2.2 3.4
Australia 38 14 37% 24 63% 5.4 2 3.4
Wales 33 9 27% 24 73% 4.7 1.3 3.4
Argentina 22 8 36% 14 64% 4.4 1.6 2.8
Ireland 19 5 26% 14 74% 3.8 1 2.8
France 23 9 39% 14 61% 3.3 1.3 2
Table 8. RWC 2011 Linebreaks v Tier A Teams.
SP BP
SP Broken Broken
Linebreaks v Set Piece Linebreaks LB's LB's
Nation LB's v Play LB's v Play
Tier A Linebreaks % Per Game per per
Tier A Tier A LB's %
Game Game
New Zealand 20 10 50% 10 50% 2.9 1.4 1.4
Australia 13 5 38% 8 62% 1.9 0.7 1.1
Argentina 9 3 33% 6 67% 1.8 0.6 1.2
France 12 3 25% 9 75% 1.7 0.4 1.3
England 8 3 38% 5 63% 1.6 0.6 1
Ireland 6 3 50% 3 50% 1.2 0.6 0.6
Wales 8 4 50% 4 50% 1.1 0.6 0.6
South Africa 5 1 20% 4 80% 1 0.2 0.8
The analysis in Table 7 clearly shows again the superiority of New Zealand, but few other correlations with
the final ranking order in Table 1. This analysis is then extended (as above) to making breaks against the
higher ranked teams in the world – the Tier A (top 8). Table 8 shows different rankings, but again no
similarity to Table 1.
392 | 2012 | ISSUE 2 | VOLUME 7 © 2012 University of AlicanteHughes et al / Performance indicators in rugby union JOURNAL OF HUMAN SPORT & EXERCISE
Table 9 is an analysis of possession ‘completion’ – a subjective term denoting the end of a possession for a
team that was on their own terms, e.g. winning a penalty, scoring a try, making a positive kick, and so on.
This might be expected to present an improved correlation with the tournament outcome, as it relates to the
quality of play and pressurising the opposition, but once again the ranking of the teams in the first column
show no relationship with Table 1. France (2nd) and Wales (4th) are respectively 7th and 8th, once again New
Zealand has the best performance in terms of data.
Table 9. Possession Completion.
Completion
Completion
Completion Completion Battles
Nation V
RWC 2011 Battles Won V
Tier A
Tier A
New Zealand 60% 100% 65% 100%
England 58% 80% 59% 67%
Ireland 56% 60% 55% 67%
Australia 56% 43% 53% 40%
South Africa 54% 80% 53% 67%
Argentina 54% 60% 55% 33%
France 52% 57% 51% 50%
Wales 51% 57% 50% 40%
The number of times a team enters the attacking ‘22’ (the Red Zone) must bear a relationship with their
attacking prowess and their conversion of these possessions into points an indicator of their control and
purpose. But again there is little correlation in Table 10 with the teams and the outcome. In the data for the
teams playing against Tier A teams (Table 11), France actually top one column, ‘Points per Red Zone
Possession’, for the first time.
Table 10. Red Zone Conversion.
Red Red Points
Converted
Zone Red Zone Points Per Per Conversion
Red
Nation Poss Conversion Zone Pts Red Zone Red Battles
Zones per
per Pts per Possession Zone Won
Game
Game Game Diff
New Zealand 3.7 2.3 62% 76 10.9 2.6 2.1 75%
France 4.1 1.7 41% 37 5.3 1.1 1.1 80%
England 4.4 2.2 50% 48 9.6 2.4 1 60%
Australia 4.4 2.3 52% 55 7.9 1.5 0.9 43%
South Africa 5 1.8 36% 42 8.4 1.7 0.7 80%
Ireland 4.8 2.8 58% 31 6.2 0.9 0.5 60%
Wales 2.6 1.4 56% 39 5.6 1.9 0.3 57%
Argentina 3.5 1.5 43% 8 2 0.5 -1.1 57%
VOLUME 7 | ISSUE 2 | 2012 | 393Hughes et al / Performance indicators in rugby union JOURNAL OF HUMAN SPORT & EXERCISE
Table 11. Red Zone Conversion v Tier A.
Red Red
Converted Points
Red Zone Zone Zone Points Per Conversion
Red Per Red
Nation Poss per Conversion Pts v Pts Red Zone Battles
Zones per Zone
Game Tier per Possession Won
Game Difference
A Game
France 3.8 1.8 47% 15 0.1 3.8 0.8 75%
New Zealand 1.5 0.8 50% 11 2.8 2.4 1.3 75%
England 4.7 2 43% 17 5.7 1.4 -0.3 33%
South Africa 4 1 25% 7 2.3 1.2 -0.5 33%
Australia 3 1.2 40% 20 4 1.1 0.7 25%
Wales 1.6 0.6 38% 6 1.2 0.8 -1.2 0%
Argentina 1.7 0.3 20% 3 1 0.5 -1.3 0%
Ireland 3 1.3 44% 0 0 0 -0.7 0%
Before moving on to more general discussion of PIs, we should recognise the limitations that beset these
data. Firstly, there is not a large amount of data here. The losing quarter-finalists played 5 matches (2
against the top ranked teams) the semi-finalists each played 7 matches (4 against the top teams), so this
must be borne in mind when considering these data sets. To perform accurate multivariate correlations of
these PIs against the ranking of the teams would require many more matches – in the region of 12000,
which would be very difficult. But what has been attempted here was to cast a ‘rule of thumb’ estimation of
the relative worth of these PIs at a tournament such as the world cup, or the Six Nations or the Tri-Nations.
Analysts, and therefore coaches, are always working with limited amounts of data, in statistical terms, and
must do their best to present the messages of the performances. These PIs presented and discussed here,
useful as they are to the coaches because of their summarising of elements of the performances, do not tell
the story of what won those matches. They do, however, consistently demonstrate that New Zealand were
the best team, but failed to accurately differentiate between the other teams. For example, most of the
indicators defined France (2nd) as one of the worst teams of the top eight, with which all the media agreed,
up until the quarter-finals. They won their quarter-final and semi-final by 2 points and one point respectively.
PIs in rugby
The general approach of research into rugby is typified by Parsons and Hughes, (2001), Vivian et al.,
(2001) and James et al., (2005), producing great quantities of frequencies of actions of winning and losing
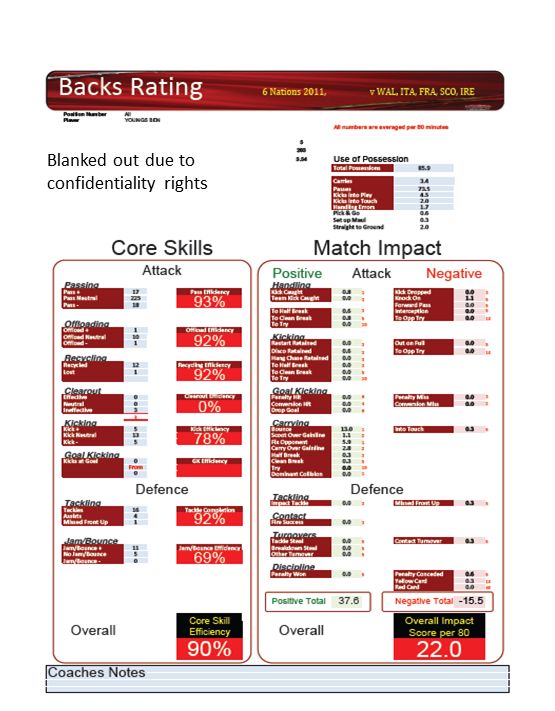
teams. The study by Jones et al., (2005) evaluated how an elite rugby team performed in a match against a
similar standard team measured against a prediction (form chart based on the previous relative
performances of the two teams on 12 PIs over five matches. Hence, when the analysed team had
performed relatively better on a PI, compared with the second elite team, it was predicted that the analysed
team was showing better form on this variable and as such was likely to outperform the other team in the
subsequent match, relatively worse performance suggested the analysed team would be outperformed. As
can be seen these PIs have a similar feel to them as those presented earlier – more frequencies of actions,
without relation to pressure, pitch position, time in the match nor game state. The actual form chart (Figure
3) is however a good visual presentation of the data because of the simplicity of its visual format. Coaches
and players alike can instantly pinpoint specific areas where performance is below set standards or vice
versa. This can be done without the use of large tabulated statistical reports which can overload or confuse
394 | 2012 | ISSUE 2 | VOLUME 7 © 2012 University of AlicanteHughes et al / Performance indicators in rugby union JOURNAL OF HUMAN SPORT & EXERCISE
the reader. Indeed, the standardisation of PIs and their presentation as a versatile form chart provides
immediate information on a single visual scale.
Figure 3. Form chart comparing the median performances for the analysed team (previous 5 matches)
relative to prior performances (previous 5 matches) by their next opponents (from Jones et al., 2005).
Performance profiles in rugby
An important issue in the current notational analysis literature is the construction of performance profiles
and the amount of data required for the analyst to be confident that the numbers of behaviours recorded
are truly representative of an individual’s performance of that behaviour. Indeed, Hughes et al. (2001)
suggest that without achieving a stable profile for a set of performance behaviours, any inferences
regarding an individual or team performance can be considered to be somewhat spurious. In our study, we
introduced the use of confidence limits for the population median (Zar, 1999; Hughes et al., 2002) of
performance behaviours, which was deemed sufficient to allow the creation of profiles (cf. Hughes et al.,
2001; Vivian et al., 2001).
The aim of James et al. (2007) was to construct a rigorous methodology for the analysis of individual
performances within a professional rugby union team. This was achieved through the development of
validated key performance indicators, the adoption of appropriate reliability procedures (Hughes et al.,
2002) and the use of statistical techniques to determine individual player performance profiles and make
intra-positional comparisons. Despite the use of performance analysis in applied sports science for some
time, little detail has been documented,
VOLUME 7 | ISSUE 2 | 2012 | 395Hughes et al / Performance indicators in rugby union JOURNAL OF HUMAN SPORT & EXERCISE
Figure 4. Inter-positional comparison of the positional clusters of scrum-half and outside-half, illustrating
median frequencies and 95% confidence limits for the population median.
Particularly in rugby union, regarding the design and construction of systems and scientific procedures
used to assess the reliability and validity of these systems (Hughes et al., 2002; More, 2002; Nevill et al.,
2002). A further aim of the study was to utilize the performance profiles of players to compare intra-
positional differences in key performance indicators. The results showed that when compared, general
positional profiles were evident, although significant between-player differences were found for all of the
analysed positional clusters (see Figure 4). This suggests that for some positions a general profile may be
created, which is probably specific to each team, and may indicate the strengths and weaknesses of the
performances of players in that position. With regard to the differences of the principal behaviours for
individuals of the same positions, the findings observed particular variation within the playing position of
outside-half.
These types of individual profiles were also being used by the analysts in PGIR, to produce subjective
evaluations of the different skill elements that make up a positional profile (see Figure 5 – some detail has
been obscured because of confidentiality issues). These different skill sets can be defined for each playing
position in rugby.
396 | 2012 | ISSUE 2 | VOLUME 7 © 2012 University of AlicanteHughes et al / Performance indicators in rugby union JOURNAL OF HUMAN SPORT & EXERCISE
Figure 5. Qualitative analysis of skills specific to position (Scrum-half).
James et al. (2005) believed that the use of confidence limits was the most applicable methodology,
particularly to the applied practitioner, in that performance profiles of individual and team behaviours can be
established after the collection of relatively few data sets. It should also be noted that some performance
profiles may never ‘stabilize’ or become consistent due to the variability or unpredictability of the individual.
In this case, the use of confidence limits provides an appropriate means for assessing such inconsistency
in performance. Often analysts and coaches of all sport are analyzing only a few games, statistically
speaking, so this limited amount of data is a perennial problem with most sports analysis.
While this study introduced some new scientific processes to facilitate the development of systems to
analyse and collect behaviour, the findings are preliminary and there are several areas that require further
investigation. First, despite careful consideration of operational definitions through content validity
procedures by panels of expert coaches and performance analysts, some bias was inevitable in studies of
this nature. For example, in a lineout play, some subjectivity is involved when deciding whether the thrower
of the ball or the player jumping for the ball was at fault when a lineout was unsuccessful. Similarly,
problems may occur when deciding whether an individual player is intending to kick the ball to the touchline
line to put it out of play or long down the pitch to achieve field territory. In addition, it could be argued that
two or more profiles are required to account for potential confounding variables such as the time of day,
match venue, officials, weather conditions, the effect of injured players, and the nature and strength of the
VOLUME 7 | ISSUE 2 | 2012 | 397Hughes et al / Performance indicators in rugby union JOURNAL OF HUMAN SPORT & EXERCISE opposition (Hughes & Bartlett, 2002; James et al., 2002; Rue & Salvesen, 2000). To further enhance our understanding of the performance of rugby union teams, there is also a need to complement individual performance profiles with analysis of playing patterns or team profiles. For example, Hunter and O’Donoghue’s (2001) preliminary work investigating positive and negative aspects of attacking and defensive play in winning and losing rugby union teams suggested distinct differences in terms of changes in possession and methods used by the teams to gain territory. Additional direction may also come from research into other sports, such as soccer, where some success has been achieved in identifying patterns of play and team strategies (i.e. Luhtanen et al., 2001; James et al., 2004). PIs in team sports Hughes and Probert (2006) undertook a technical analysis of playing positions within elite level International soccer at the European Championships 2004. The qualitative data were gathered, post event, based on the relative successful execution of techniques performed. Players were classified by position as goalkeepers, defenders, midfielders or strikers. A comparison was also made between the technical distributions of both a successful and unsuccessful team. The study showed that it is possible to use qualitative assessments of skills in a quantitative way that is reliable, and that it was a more informative way of analysing the respective merits of team performance. Coaches must take into account the skills required by each position and hence be selective of which players play within those positions. Furthermore, coaches must plan training sessions that are accurate to the specific needs of individuals and their position within a team. These ideas of analysis can be used with the different skill sets in rugby union. This work on soccer was further explored by Hughes et al., (2012, Ibid) and, if the skills and appropriate operational definitions, can be adopted by performance analysts, then these analyses will become more powerful (Williams, 2009). Moneyball and rugby union The literature identified in this paper has highlighted the importance of the association of giving meaning to data is sometimes overlooked within the analysis of rugby and sport in general. The initial aim of this work was to use data gathered by professional analysts working for national teams, from the recent World Cup for rugby union in New Zealand (2011). However the data gathered, and any subsequent ‘performance indicators’ derived from these data, failed to answer any basic questions about the game. In racket sports the task is much easier as each rally ends in a winner (W) or error (E), and so using W/E ratios for different shots, in different positions can give powerful analyses of how matches are won and lost. In rugby the players within the team, and separate units, have far more complex interactions with each other, and of course with the opposing team. There are not always immediate positive outcomes, but it becomes more clear that just counting actions, and then paying ‘lip-service’ to PI methodology (non-dimensionalising them in some way) is not sufficiently sensitive to differentiate between winning and losing teams. Billy Bean (Moneyball & Lewis, 2003) defined these processes and definitions for baseball and used them, with large objective databases, to recruit players more efficiently and economically, and hence achieve success far in excess of the expectation of his club’s financial standing. Therefore, if the different skill sets of PIs for each position in rugby union can be identified and clear operational definitions defined, there is significant scope/benefit for consultancy and research. Having defined the operational definitions of a pass, tackle, running with the ball, different types of kick, etc., the more tricky task is to rate the level of execution of that skill in a consistent, reliable and accurate manner. The method used by Hughes and Probert (2006), a relatively simple process, showed that, with considerable training and practise, it was reliable and accurate. The next step would then be to create some form of ‘unit interaction analyses’ between players (e.g. the front row; No 8, scrum half and fly half; back 3 – 11, 14 and 15) for analysis for squad selection 398 | 2012 | ISSUE 2 | VOLUME 7 © 2012 University of Alicante
Hughes et al / Performance indicators in rugby union                  JOURNAL OF HUMAN SPORT & EXERCISE

and comparison with other teams. It might be possible to use aspects of momentum and perturbations
analyses (Hughes & Reed, 2004) to integrate these data sets and link them to outcomes. Recent research
using sociometric network analysis (Duch et al., 2010) offers another way of integrating these different sets
of interactive data, and ordering them to differentiate between their respective importance.

Some or all of these ideas could mean that PIs of more relevant importance to outcome, particularly with
respect to execution of skills, would be available to coaches, managers and analysts. This would make
selection of players and squads more objective and would also be very useful when considering players in
transfer negotiations.

CONCLUSIONS

A large dataset from the 2011 World Cup, from analysts working with national teams, and examples of data
taken from previous studies, enabled an analysis of how notational data have been used. It was concluded
that in a complex dynamic interactive team sport, such as rugby, that simple analyses of frequency data,
although informative, cannot possibly be expected to model this very difficult and multivariate problem. It is
therefore recommended that more qualitative analyses of individual skill sets for each position be
undertaken. Ways of combining these sets of data into the playing units (e.g. front row, half backs) that
interact within and between teams, could then give comparative permutations and combinations for
selection and transfer decisions. It is suggested that these data sets could be further examined and
integrated using methods based on momentum, perturbations and sociometric network analysis.

REFERENCES

    1. DUCH J, WAITZMAN JS, AMARAL, LAN. Quantifying the Performance of Individual Players in a
        Team Activity. PLoS ONE. 2010; 5(6):e10937. doi:10.1371/journal.pone.0010937 [Back to text]
    2. GREENWOOD J. Total Rugby. London: A&C Black; 1997. [Back to text]
    3. HUGHES M, BARTLETT R. The use of performance indicators in performance analysis. Journal of
        Sports Science. 2002; 20:739-754. doi:10.1080/026404102320675602 [Back to text]
    4. HUGHES M, PROBERT GA. Technical analysis of elite male soccer players by position and
        success. In DANCS, H., HUGHES, M., O’DONOGHUE, P. (Eds.). Notational Analysis of Sport -
        VII, Cardiff: UWIC; 2006, pp. 76-91. [Back to text]
    5. HUGHES MD, BARTLETT RM. The use of performance indicators in performance analysis.
        Journal of Sports Sciences. 2002; 20:739-754. doi:10.1080/026404102320675602 [Back to text]
    6. HUGHES MD, COOPER SM, NEVIL A. Analysis procedures for non-parametric data from
        performance analysis. International Journal of Performance Analysis in Sport. 2002; 2:6-20.
        [Abstract] [Back to text]
    7. HUGHES MD, EVANS S, WELLS J. Establishing normative profiles in performance analysis.
        International Journal of Performance Analysis in Sport. 2001; 1:1-26. [Abstract] [Back to text]
    8. HUGHES MD, WHITE P. An analysis of forward play in the men's Rugby Union World Cup, 1991.
        In M.D. HUGHES (Ed.). Notational Analysis of Sport - I and II, Cardiff: UWIC; 1996, pp. 183-193.
        [Back to text]
    9. HUGHES MD, WILLIAMS D. The development and application of a computerized rugby union
        notation system. Journal of Sports Sciences. 1988; 6:254-255. [Back to text]
    10. HUNTER P, O’DONOGHUE P. A match analysis of the 1999 rugby union world cup. In Pass.com:
        Fifth World Congress of Performance Analysis of Sport (edited by M.D. HUGHES AND I.
        FRANKS). Cardiff: UWIC; 2001, pp. 85-90. [Back to text]

                                                                          VOLUME 7 | ISSUE 2 | 2012 | 399
Hughes et al / Performance indicators in rugby union JOURNAL OF HUMAN SPORT & EXERCISE
11. JAMES N. The role of notational analysis in soccer coaching. International Journal of Sports
Science and Coaching. 2006; 1(2):185-198. doi:10.1260/174795406777641294 [Back to text]
12. JAMES N, MELLALIEU SD, HOLLELY C. Analysis of strategies in soccer as a function of
European and domestic competition. International Journal of Performance Analysis in Sport. 2002;
2:85-103. [Abstract] [Back to text]
13. JAMES N, MELLALIEU SD, JONES NMP. The development of position-specific performance
indicators in professional rugby union. Journal of Sports Sciences. 2005; 23:63-72.
doi:10.1080/02640410410001730106 [Back to text]
14. JONES NMP, JAMES N, MELLALIEU SD. The development of objective methodologies for scoring
team performance in elite rugby union. Journal of Sports Sciences. 2005. [Back to text]
15. JONES NMP, MELLALIEU SD, JAMES N. Team performance indicators as a function of winning
and losing in rugby union. International Journal of Performance Analysis in Sport. 2004; 4(1):61-71.
[Abstract] [Back to text]
16. LEWIS M. Moneyball: The Art of Winning an Unfair Game. USA: W. W. Norton & Co; 2003. [Back
to text]
17. LUHTANEN PH. Reliability of video observation of individual techniques used in soccer. In T.
REILLY, A. LEES, K. DAVIDS, W.J. MURPHY (Eds.). Science and Football. London: E. & F.N.
Spon; 1988, pp. 356-360. [Back to text]
18. MCCORRY M, SAUNDERS ED, O’DONOGHUE PG, MURPHY MH. A match analysis of the
knockout stages of the 1995 rugby union World Cup. In M.D. HUGHES (Ed.). Notational Analysis
of Sport III. Cardiff: UWIC; 2001, pp. 230-239. [Back to text]
19. MORE K. Observation and analysis. Sports Coach UK: Faster, Higher, Stronger. 2002; 16:10-11.
[Back to text]
20. NEVILL A, ATKINSON G, HUGHES M, COOPER SM. Statistical methods for analysing discrete,
categorical data recorded in sport performance and notation analyses. Journal of Sports Science.
2002; 20:829-844. doi:10.1080/026404102320675666 [Abstract] [Back to text]
21. O’DONOGHUE PG. Performance models of ladies’ and men’s singles tennis at the Australian
Open. International Journal of Performance Analysis of Sport. 2002; 2(1):73-84. [Abstract] [Back to
text]
22. BARTLETT RM. Sports Biomechanics: Reducing Injury and Improving Performance. London:
E&FN Spon; 1999. [Back to text]
23. PARSONS A, MULLEN R, HUGHES M. Performance profiles of male rugby union players. In M.
Hughes and I.M. Franks (Eds.). Cardiff: CPA, UWIC; 2001, pp. 129-137 [Back to text]
24. POTTER G. Modelling winning performance in invasive team games. Thesis (PhD). University of
Wales Institute Cardiff; 1997. [Back to text]
25. POTTER G, HUGHES MD. Modeling in competitive sports. In M.D. Hughes (Ed.). Notational
Analysis of Sport III. Cardiff, UK: University of Wales Institute; 1999, pp. 67-83. [Back to text]
26. REED D, HUGHES M. An exploration of team sport as a dynamical system. In H. Dancs, M.
Hughes, and P. O’donoghue, (Eds.). Notational Analysis of Sport - VII, Cardiff: UWIC; 2006, pp.
63-72. [Back to text]
27. RUE H, SALVESEN Ø. Prediction and retrospective analysis of soccer matches in a league. The
Statistician. 2000; 49:399-418. doi:10.1111/1467-9884.00243 [Back to text]
28. STANHOPE J, HUGHES MD. An analysis of scoring in the 1991 Rugby Union World Cup for men.
In M.D. Hughes (Ed.). Notational Analysis of Sport - I and II. Cardiff: UWIC; 1996, pp. 167-176.
[Back to text]
400 | 2012 | ISSUE 2 | VOLUME 7 © 2012 University of AlicanteHughes et al / Performance indicators in rugby union JOURNAL OF HUMAN SPORT & EXERCISE
29. VAZ L, VAN ROOYEN M, SAMPAIO J. Rugby game-related statistics that discriminate between
winning and losing teams in IRB and Super twelve close games. Journal of Sports Science and
Medicine. 2010; 9:51-55. [Full Text] [Back to text]
30. VIVIAN R, MULLEN R, HUGHES MD. Performance profiles at league, European Cup and
International levels of male rugby union players, with specific reference to flankers, number 8s and
number 9s. In M.D. Hughes and I. Franks (Eds.). Fifth World Congress of Performance Analysis of
Sport. Cardiff: UWIC; 2001, pp. 137-143. [Back to text]
31. WILLIAMS JJ. An investigation into operational definitions used within performance analysis.
Presentation at the International Workshop in Performance Analysis. Lincoln; 2009. [Back to text]
32. WILLIAMS JJ. Operational definitions in performance Analysis and the need for consensus.
International Journal of Performance Analysis in Sport. 2012; 12(1):52-63. [Abstract] [Back to text]
33. ZAR JH. Biostatistical Analysis: Fourth Edition. New Jersey: Prentice-Hall, Inc; 1999. [Back to text]
VOLUME 7 | ISSUE 2 | 2012 | 401You can also read