FEASIBLE ESTIMATION OF PV INSTALLATION IN BANGLADESH THROUGH STUDYING STATISTICAL DATA OF LANDS, HOUSEHOLDS, AND INDUSTRIES - DIVA PORTAL
←
→
Page content transcription
If your browser does not render page correctly, please read the page content below
Uppsala University logo type

                                                                                                                         Serial number

                                                                                                           Degree project 15 credits
                                                                                                                         June 2021

Feasible estimation of PV
installation in Bangladesh through
studying statistical data of lands,
households, and industries
Kazi Ashraful Haque   Master's Programme in Renewa ble El ectricity Producti on

 Master's Programme in Renewable Electricity Production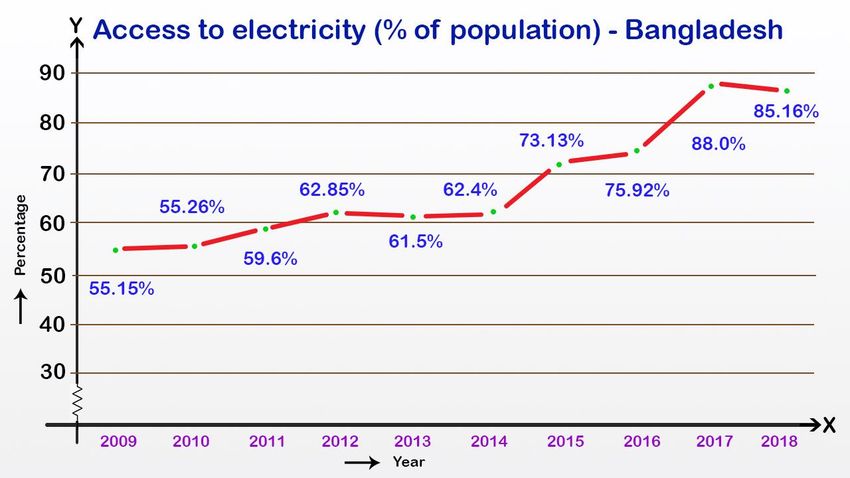
Uppsala University logo type

                   Feasible estimation of PV installation in Bangladesh through studying statistical data
                   of lands, households, and industries

                   Kazi Ashraful Haque

Abstract
This thesis aims to determine the accessible solar potential and estimation of PV installation in
Bangladesh to increase solar power production concerning conventional power production in Bangladesh.
The rise of renewable energy sources and especially solar energy may result in a significant contribution
to the power generation system. To achieve its advantage, proper study and research are important to
establish the tangible solar capacity from relevant parameters. Conventional power production depends on
a variety of factors and needs to be replaced by renewable resources for the increasing demand. Solar
energy is a free source of energy and Bangladesh receives a huge quantity of solar radiation due to its
geographical location in the tropical zone. In this thesis, solar irradiation, PV output, and many other
parameters are determined to discover the potential of solar power. After that, total land area, population,
number of households from the home establishment, number of industries, untilled land area, and other
related factors are thoroughly studied and calculated to establish accessible solar electricity. Economic
and environmental impacts are the most important criteria of this renewable resource from the country's
perspective. Cost and CO2 emission are discussed for conventional electricity production and compared
to solar electricity production.

Keywords: Solar potential, sunshine in Bangladesh, conventional energy, daylight availability, solar
irradiation, PV output, solar electricity

                              Faculty of Science and Technology
                     Uppsala University, Place of publication Uppsala

                           Supervisor: Marika Edoff Subject reader: Carl Hägglund
                                           Examiner: Irina Temiz
Acknowledgments
At first, I would like to express my sincere gratitude to my supervisor Marika Edoff,
Professor in Solid State Electronics, spec. Solar Cells Division head, Solar Cell Technology,
Department of Material Science and Engineering for her continuous guidance, effort, and
valuable suggestions throughout the project. I have regarded all our meetings as very
enjoyable and beneficial to the quality of my work. I am grateful to her for all the support and
time; this research would not have been possible without your continuous guidance.
Secondly, I would like to thank Carl Hägglund, Senior lecturer at the Department of
Materials Science, Solar Cell Engineering for his review of my final draft and presentation.
His comments have improved the correctness and readability of this thesis.
I would like to express my sincere gratitude to my examiner Irina Temiz, Programme
Director Int. Master Programme in Renewable Electricity Production for her continuous
support, and valuable suggestions throughout the thesis. I have regarded all our email
communications as very enjoyable and beneficial to the quality of my work
Table of Contents
List of Abbreviations .............................................................................................................................. 6
List of tables............................................................................................................................................ 7
List of figures .......................................................................................................................................... 7
Appendix-1 Content List......................................................................................................................... 8
Appendix-3 Content List......................................................................................................................... 8
Appendix-2 Content List......................................................................................................................... 8
Introduction ............................................................................................................................................. 9
   1.1 Background ................................................................................................................................. 10
       1.1.1 Present Electric Power Sector of Bangladesh ...................................................................... 10
       1.1.2 Solar Electricity Sector in Bangladesh ................................................................................. 10
       1.1.3 Comparative Status .............................................................................................................. 11
       1.1.4 Observation .......................................................................................................................... 14
   1.2 Objectives ................................................................................................................................... 14
   1.3 Limitations .................................................................................................................................. 15
   1.4 Report Structure .......................................................................................................................... 15
Method Development............................................................................................................................ 17
   2.1 Methodology ............................................................................................................................... 20
   2.2 Acquired Data ............................................................................................................................. 21
       2.2.1 Solar Irradiation ................................................................................................................... 21
       2.2.2 Land & Population Analysis ................................................................................................ 23
       2.2.3 Available Home Establishment ............................................................................................ 24
       2.2.4 Available Untilled Land & Industrial Establishment ........................................................... 25
       2.2.5 Solar Irradiation Parameters Description ............................................................................. 25
Result .................................................................................................................................................... 28
   3.1 Photovoltaic Power Potential ...................................................................................................... 28
   3.2 Estimated Solar (PV) Energy from Available Home Establishments ......................................... 28
   3.3 Estimated Solar (PV) Energy from Available Industrial Establishments ................................... 29
   3.4 Estimated Solar (PV) Energy from Available Untilled Land ..................................................... 29
   3.5 Developable Solar Power ............................................................................................................ 30
   3.6 Development of a Solar electricity Map ..................................................................................... 31
Discussion ............................................................................................................................................. 33
   4.1 Impact Analysis .......................................................................................................................... 36
       4.1.1 Comparing 1kW SHS with 1kW portable generator including fuel costs: .......................... 37
       4.1.2 Fuel Price cost comparison (mass production perspective) ................................................. 38
       4.1.3 Comparing fuel (4MWh/day) with solar system (1 MWp) .................................................. 39
       4.1.4 Effectiveness of solar electricity gen. Vs conventional electricity gen. ............................... 40
Conclusions & Future works ................................................................................................................ 43 References ............................................................................................................................................. 44 Appendix-1 ........................................................................................................................................... 47 Appendix-2 ........................................................................................................................................... 50 Appendix-3 ........................................................................................................................................... 52
List of abbreviations
DIF            Diffuse Horizontal Irradiation
DNI            Direct Normal Irradiation
ELE            Terrain elevation
GHI            Global Horizontal Irradiation
GTI            Global Tilted Irradiation
GTIOPTA        Global Tilted Irradiation at the optimum angle
GWh            Giga Watt-hour
HSD            High-Speed Diesel
HFO            Heavy Furnace Oil
IDCOL          Infrastructure Development Company Limited
IPS            Instant Power Supply
kWh            Kilo Watt-hour
MWh            Mega Watt-hour
OPTA           Optimum tilt of PV modules
p.a            per annum (each year)
PV             Photovoltaic
PVout          Photovoltaic power output
RE             Renewable Energy
W              Watt
Wp             Watt peak
SHS            Solar Home System
SREDA        Sustainable & Renewable Energy Development Authority Power Division
TEMP           Air temperature
Gen.           Generation
List of tables
Table 1 Solar power generation by some Asian countries
Table 1.1 Potential analysis for 10% households using 37W, 150W, and 300W system
Table 1.2: Potential analysis for 5% industries using 10kW, 100kW, and 500kW system
Table 1.3: Potential analysis for 1%, 2%, and 5% untilled land area
Table 1.4: Share of electricity generation from PV for corresponding sectors
Table 1.5: Unit System capacity overview and comparison for different sectors
Table 2 GDP and GDP growth of some Asian countries
Table 3 Solar irradiance on a Horizontal Surface (kWh/m2/day)
Table 4 Comparison between different parameters related to solar irradiation
Table 4.1: Average PV output for 1kW PV system after considering Capacity factor
Table 5 PV output for 10% household using 300W peak system
Table 6 PV output for 5% industries using 10kW peak system
Table 7 PV output for 5% untilled land using 1MW/4 acres peak system
Table 8 Developable solar power
Table 9 Total PV output for household, industries, and untilled land
Table 10 10 years fuel cost vs. solar home system cost
Table 11 Solar potentiality and output result.
List of figures
Figure 1 Population of the world according to countries
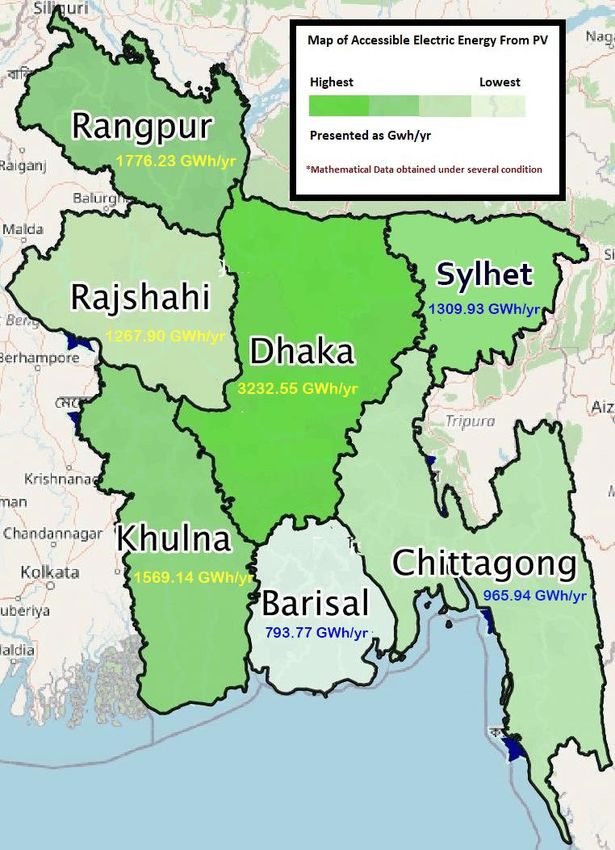
Figure 2 Year vs. access to electricity (% of the population) graph
Figure 3 Current Energy Status of Bangladesh in 2020
Figure 4 Renewable energy share
Figure 5 Solar insolation incident on a horizontal surface
Figure 6 Solar irradiance of NASA vs. PVOUT, GHI, and GTIOPTA of SolarGIS.
Figure 7 Accessible PV potential model
Figure 8 1MW solar system vs. 4MWh/day fuel costs of 10 years
Figure 9 CO2emissions from fuels and solar of 10 years
Figure 10 Comparison between Installed SHS (left) with Accessible Home
Establishment (right)
Figure 11 Comparison between all the current solar park projects (left) with accessible
untilled land (right)Appendix-1 Content List Table A Energy Generation by country Table B Area and population of different divisions in Bangladesh Table C Total number of households including the commercial establishment Table D Agriculture related land, permanent untilled area, and number of industries Table E Comparison between solar and other fuel costs for 10 years - 4MWh/day Table F Comparison between CO2emissions from fuel with solar 10 years- 4MWh/day Appendix-3 Content List Table A PV output for 300W, 10kw, and 1MW from 1kW peak system Table B Installable capacity measurement (MW) using 10% households Table C Installable capacity measurement (MW) using 5% industries Table D Installable capacity measurement using 1%, 2% & 5% untilled lands Appendix-2 Content List Figure A Average PV Output for all administrative Divisions Figure B Accessible Electric Energy from PV
Introduction
Bangladesh is one of the most densely populated countries and ranked 8th [1] in the world
according to the population. The population is increasing rapidly where the country has a
very small area. This overgrowing population needs the constant availability of energy and as
technology is advancing, the consumption of power is successively increasing. In the figure
below, the current top countries in the world according to the number of populations has
shown.

                   Figure 1: Population of the world according to countries [1]
Power sectors in Bangladesh are highly dependent on conventional fossil fuels including gas
and coal. Mainly, maximum power is generated from gas, heavy fuel oil (HFO), coal, and
high-speed diesel (HSD) in this country[2]. Such conventional fuel usage and consumption to
generate electrical power increases global warming and traditional power plants are
responsible to increase carbon dioxide emissions. The power generation sector alone
contributed 52.80% of carbon dioxide emission in the country [3] in 2014 and the amount
was 63 million metric tons of CO2 gas. According to the last report of 2017, the amount is
increased to 78 million metric tons [4].

The deployment of photovoltaic (PV) systems is increased in a large number over the last few
years in the world. The growth is accelerated in this 21st century by installing multiple
Terawatts capacity for the de-carbonization to reduce global warming and environmental crisis.
In this perspective, it is required to explore the accessible capacity of solar power with an
efficient model because Bangladesh is lagging generation of electricity from renewable
resources.
1.1 Background
1.1.1 Present Electric Power Sector of Bangladesh
Bangladesh has recently achieved some progress in the power sector, but it has not yet been
able to fully meet the needs of the country. Till now, the total installed capacity is 19,846
MW [5] of the equal contribution of both the private and public sectors. The total electricity
generation of Bangladesh in 2019 is 70,533 GWh [28], which is almost double than the last
population census year 2011.
The Government of Bangladesh is trying to ensure access to electricity for the entire citizen
according to vision 21 to meet their goal. At present in 2020, only about 85% [6]of the
population has access to electricity. But, the per capita energy consumption in Bangladesh is
one of the lowest (374.62 kWh in 2019) in the world [6].
The generation of electricity in Bangladesh largely depends on fossil fuels. Most of the part
of electricity generation is coming from natural gas (48.81%) among all other installed power
plants [7]. Rest major amounts are from heavy fuel oil-HFO (23.81%) [7]and high-speed
diesel-HSD (8.21%) [7]. Till now, electricity production from solar is relatively low which is
only 1.42% among the total generation. In Figure 3, the Electricity Generation percentage
according to the fuel branches has been shown.
Figure 3: Current Energy status of Bangladesh,2020 [8]
1.1.2 Solar Electricity Sector in Bangladesh
The government of Bangladesh has recently emphasized and taken so many projects at
electricity production from solar. A grid-connected solar power plant has started at the end of
the year 2017. According to the “National Database of Renewable Energy”, the total off-grid
capacity is 312.97 MW [9] and on-grid capacity is 80.92 MW [9]. So, the total installed solar
electricity capacity is currently 393.89 MW [9]. Figure 4 is showing that the large part of
electricity produced from renewable resources is solar 62.7% and 36.6% is from hydro.Figure 4: Renewable Electricity Generation share [9] In the country so far, 4 solar parks [10] are completed and fully in operation. The total installed capacity from these four solar parks is 38.4 MW [10]. Among them, Kaptai Solar Power Plant is installed by the government and the three other parks are private. Recently, 10 new solar parks [11] are under construction including public and private sectors. Progression of all these parks is ongoing and the probable to start their operations at the end of 2020 to 2021. The total capacity of these parks is 664 MW [11]. The biggest solar projects by far in Bangladesh are taken in between 2017 to 2018. Currently19 solar parks [12] are in the planning stage. Contract signing of parks is under planning by the public and private sectors. The total capacity of these 19 solar parks is 1257 MW [12]. Presently, a total of 33 solar parks are listed in the country’s national database of renewable energy (NDRE) of 1910.56 MW capacities. Of them, 12 parks [Figure 11] are situated at Rangpur with 625 MW capacities and the Barisal division has no solar park established yet. But, most of the untilled lands have been found in the Dhaka division and lowest in the Mymensingh division [Figure 11]. The highest value of PV output is found at the Chittagong division and the lowest in Rangpur [Appendix-2 Figure A]. So from these studies, it is seen that there is a huge scope to increase and maximize solar electricity production capabilities comparing with current establishments. 1.1.3 Comparative Status Energy demand in Bangladesh increased rapidly for the growth of population in the same way that global energy consumption has grown. But Bangladesh is currently ranked 40th [Appendix-1 Table A] to produce electricity in the world [13] despite having a large population. It clearly shows the demand crisis and lagging of electricity production comparing other countries having less population than Bangladesh. The last census was conducted in 2011 in Bangladesh and that year, the access to electricity was 59.6% [Figure 2] of the total population. At present, the value is increased to 85.16% [Figure 2]. So, Bangladesh has made significant progress in access to electricity in recent years but it still behind the goal compared to the other countries. Moreover, due to the large
population, the amount of the population is huge who are not being able to access the
electricity for the rest 14.84% (100% - 85.16%) [14].

         [%]

               Figure 2: Year vs. access to electricity (% of the population) graph [14]
Renewable energy is ecologically acceptable than conventional fossil fuel and that’s why the
Government of Bangladesh is trying to generate environmental-friendly electricity from
renewable resources. To fulfill the vision, the government has set up a target to provide
quality electricity to all by 2021 where 10% of electricity [15] from renewable energy
resources. This 10% is planned to generate from the contribution of both public and private
sectors which is 3100 MW [15]. The government of Bangladesh has named this project
`Vision 21`***.
But the progress has not been successful as expected because at the end of 2020, a total of
1910.56 MW [12] is registered and operation of this capacity will have a chance to be started
at the end of 2022 or more. At present, the major sources of renewable energy are provided
by solar, hydro, wind, biogas, and biomass respectively in Bangladesh [13]. Among all these
renewable resources, solar electricity [13] is ahead a lot as a percentage of production.
Renewable energy sources like Bio-fuels, geothermal, river current, and wave & tidal energy
are not yet popular in Bangladesh [13].
Recently, the progress of solar in both on-grid and off-grid especially solar home system
(SHS)** has been increased significantly. Over 3 million homes have been provided with
small solar PV systems so far [15]. Still, Bangladesh is lagging comparing with neighboring
countries to increase solar capacity. In the table below, the status of solar power in
Bangladesh comparing with top neighboring countries has been shown.
Table 1: Solar power generation by some of Asian countries [16]
Countries Population Land Area (km2) Density (P/ km2) Solar
Electricity G.
Capacity
India 1,380,004,385 2,973,190 464 42,800 MW
Thailand 69,799,978 510,890 137 2,982 MW
Pakistan 220,892,340 770,880 287 1,329 MW
Philippines 109,581,078 298,170 368 1928 MW
Malaysia 32,365,999 328,550 99 882 MW
Bangladesh 164,689,383 130,170 1,265 393.89 MW*
*Present status according to SREDA
Rapid urbanization with population growth has created a huge electricity demand. Without
the availability of electricity, it is difficult to fulfill basic needs, economic growth, and
poverty eradication for the country. The Gross Domestic Product (GDP) in Bangladesh was
6.46% [17] in 2011. World Bank forecasted that the economic growth will be more than 7%
[18]. The Gross Domestic Product (GDP)of a country is one of the main indicators used to
measure the performance of a country’s economy. At present, the growth is 7.86% [17].
Future economic growth significantly depends on the availability of electricity and vice
versa. In the table below, the comparison of total GDP between Bangladesh and other top
neighboring countries is given below, where the growth rate of Bangladesh is satisfactory.
Table 2: GDP and GDP growth of some Asian countries [19]
Countries GDP GDP Growth GDP Per Capita Share of the world
India $2.651 trillion 6.68% $1,980 3.28%
Thailand $455 billion 3.91% $6,579 0.56%
Pakistan $305 billion 5.70% $1,467 0.38%
Philippines $314 billion 6.68% $2,982 0.39%
Malaysia $315 billion 5.90% $10,118 0.39%
Bangladesh $250 billion 7.28% $1,564 0.31%
According to the last census report 2011, Bangladesh has an urban population of 28% [20] and
rural 72% [20]. Households of the rural areas are situated remote and scattered and their
consumption rate is low compared to the urban areas. So, electrification in rural areas is less
efficient and also more expensive than in urban areas. But to develop social life in Bangladesh
needs the availability of a reliable and adequate source of energy for the electricity supply. So,
in those circumstances, solar power would be the best choice for the demand for electricity in
rural areas by increasing the number of solar home systems (SHS).
** Solar Home System (SHS) mainly consists of solar module (30W-100W), a storage system, Voltage
controller, low voltage DC powered appliances like tube lights, fans. SHS is installed by the government-
approved organization that is slightly subsidized by the government and the rest of the costs are paid by the
consumer.
*** Vision 2021 was a prospective plan of the government of Bangladesh for 2010-2021. The proposition was
drafted in 2010. The proposition was to aim for sustainable development in all sectors throughout the period.
The energy access target was ´Electricity for all´. To retain the energy, target the contribution of renewable
sources like solar, biogas, small-hydro, wave, wind, tidal, and geothermal will be 10% of total electricity
generation.1.1.4 Observation Bangladesh has made some progress in establishing a solar home system (SHS) and solar parks in the recent few years. The solar system mainly depends on proper places with good technologies to attain the utmost power from it. Since the government of Bangladesh has made some goals to achieve power from renewable resources mainly from solar as vision 2021 [20], this master thesis will draw the complete scenario between the current status and how much lagging than the actual goal by making a proper idea to fulfill the gap. After applying the model, it will be clearer that how much power can we generate using a minimum portion of areas and the recent projects are installed in suitable places or not. Bangladesh is divided into 8 major administrative divisions with a total of 64 districts. Each division consists of numerous numbers of districts. Dhaka division consists of 13 districts and Mymensingh and Sylhet division consists of 4 districts each. The value of solar irradiation or other related parameters of each district is very nearest to each other and almost the same in many cases. So, in this thesis, all the related parameters are collected according to the districts and presented as a division to visualize a proper comparison between all other divisions. Since SHS installment is dependent on roof space and solar parks is required plenty of unused lands, the data of total home establishment, major industries, and untilled land is collected from the Bangladesh Bureau of Statistics(BBS) targeting to install SHS on the rooftop of households, industrial roof space or unused areas and untilled land for solar parks. A portion of households, industrial establishments, and untilled land is considered from the total amount of households, major industrial establishments, and untilled land using described model (Figure 7) with estimated PV output and related parameters to find the probable scenario of the outcome. 1.2 Objectives A major challenge to produce electricity from solar is the requirement of a large amount of land and good solar irradiation. The land area of Bangladesh is very limited, and the average daily solar irradiation varies from 4 kWh/m2 to 6 kWh/m2 [21]. Proper utilization of remaining land areas and the power of the sun with good strategy and technology can be much more effective to produce adequate electricity from solar. In recent times, the prospect of solar energy is increased especially most of the contribution is from the private sector and joint venture with foreign countries [22] to install solar power plants. At present, decisions on many solar projects are taken and few numbers of projects have become a success and are fully in running condition. In this thesis, the main objective is to determine accessible solar electricity production capability throughout the country by suitable method development after studying solar irradiation and available unused spaces in Bangladesh to install solar systems. To achieve this goal following steps are taken:
1. Total numbers of running and ongoing projects from the present conventional
power sector and the solar sector are listed. Their status and capacities are observed to
analyze suitable areas for accessible solar electricity.

         2. Solar irradiation, PV output, and other related parameters are collected from the
district level. Then the data is categorized according to the administrative divisions to make a
comparison between them.

        3. Total land area, number of households and industries, amount of untilled land area
are calculated to find out the accessible capacities.

        4. Suitable method development and applied to a specific percentage of households,
industries, and untilled land area according to district level than presented as administrative
divisions level.

        5. Accumulated the abovementioned three categories and got total developable
electricity from solar systems.

1.3 Limitations
To complete this thesis, a large amount of statistical data of Population and Housing Census of
Bangladesh 2011, Industrial establishments statistical data, ten years (2008-2018) of
metrological data relating sunlight and rainfall, latest ten years (2008-2018) soler irradiation for
every district´s central point, 2016-2018 retail electricity consumption statistics, 2016-2018
Non-solar electricity generation statistics, present solar installation statistics for both SHS and
solar parks, operational non-solar power plant statistics have been collected for analyzing the
present situation and estimate the overall solar potential through addressing developable areas.
Data of different resources vary and updates frequently, but more authentic and latest resources
are used. The last population and housing census 2011 have been performed in 2011 in
Bangladesh. So, the number of populations, home establishments, and other data differs from
the current values. Despite having these limitations, calculated percentage-based accessible PV
potential outcome is found reasonable, efficient than the present scenario, and exceeding the
goal set by the Government of Bangladesh as their vision 2021. To develop an indicative solar
radiation map for each district one central point has been taken into consideration through
latitude and longitudinal point of view then collected latest 10 years average radiation data
which in some cases does not represent the practical scenario of the whole region. PV output
has been collected from SolarGIS developed averaged PV output map where solar resource data
and PV modeling software has been used rather than any mounted PV module for every region
(districts).

1.4 Report Structure
In this thesis, background, presents conventional and renewable resources with their status
are presented as background information and limitations of this thesis. Method development
represents methodology, data analysis model, brief introduction of backbone parameters, all
the necessary required data related to this thesis. Result presents the outcome of the analysis
of backbone parameters and development of various maps based on calculated values. Discussion explains the outcome result with discussion as well as analysis of the impact of conventional and renewable resources with the outcome according to the country's perspective. Conclusion provides conclusions of this thesis and some suggestions regarding future research related to this master thesis.
Method Development
The progress of solar energy conversion in recent years with historical data is analyzed to
find the solar potential throughout the country. The outcome from the assumption to estimate
solar potential can fluctuate comparing the real scenario according to the country’s economic,
environmental, or political perspective. In this case, the strategy of the estimation is detained
and compared to the recent goal of the Government of Bangladesh and how the infrastructure
company used all the categories (households, industries, and solar parks).
To achieve the objective of vision 2021, the Government of Bangladesh has set the target to
attain 10% [15] of total electrical power generation from renewable resources which are
3100MW [15]. Already some portion of the renewable electricity generation target has been
achieved. To develop the method and find the potential comparison between current status,
increasing accessible amount regarding parameters (households, lands & industries)
upgradations every year.
Household: About 6 million solar-home systems [23] are targeted for installation by IDCOL
(Infrastructure Development Company Limited)* as vision 21 [15]. Already 4 million SHS
has been installed where more than 30 million total households are available in Bangladesh.
This corresponds to 13% of the total number of households. If IDCOL fulfills the goal by
installing 6 million SHS, the estimated generation capacity would be 220 MW of electricity
[23] indicate an average 37W solar system installed per house. With this capacity, it will be
able to contribute approximately 7% of the whole renewable electricity generation target. So,
households of urban denser areas are still available for installing to increase overall PV
capacity for the household section. Considering all these facts, 10% of households are taken
visualizing the lowest potential to the highest potential with 37W, 150W, and 300W
individually to compare target achievable of 3100MW [24].
   Table 1.1: Potential analysis for 10% households using 37W, 150W and 300W system
   Households                    37W                     150W                     300W
 Total Capacity for            119 MW                   483MW                    965MW
 10% Households
Target achievable of             3.84%                   15.57%                   31.14%
     3100MW
     Applying                   20MW                     80MW                    161MW
  Capacity Factor

Industries: The consumption of electricity in industries is found almost half of domestic
consumption. But the solar panel establishment is lagging comparing with domestic areas at
present. Only 4 industries with a total of 3.07MW are installed by IDCOL, an average
capacity of 767.5MW [23]. IDCOL has a target to finance a total capacity of 300 MW by
2022 [23]. So, 10kW, 100kW, and 500kW are applied for 5% of industries.
Table 1.2: Potential analysis for 5% industries using 10kW, 100kW and 500kW system
Industry 10kWp 100kWp 500kWp
Total Capacity for 28.72MW 287.2MW 1435.85MW
5% Industries
Target achievable of 0.93% 9.26% 46.32%
3100MW
Applying 4.79MW 47.86MW 239.31MW
Capacity Factor
Untilled land area: Currently, 38.4MW [12] cumulative capacities of 4 solar parks are
completed and running, and a total of 33 solar park projects are registered with 1910.56 MW
[12] capacities implementation ongoing by both public and private sectors. Mentioned
ongoing installation capacity will be able to fulfill almost 62% of vision 2021 (10% of the
whole generation from renewable resources) [25]. But it is observed that most of the projects
are in those divisions where little untilled land is available. So, there is still a good
opportunity to access suitable areas of untilled land. Since, currently, all the solar parks are
using almost 2% of total untilled land, in this section potential is shown up for 1%, 2%, and
5% untilled land.
Table 1.3: Potential analysis for 1%, 2% and 5% untilled land area
Untilled land 1% 2% 5%
Total Capacity from 1332MW 2664MW 6660MW
Untilled land
Target achievable of 42.97% 85.94% 214.85%
3100MW
Applying 222MW 444MW 1110MW
Capacity Factor
Installation of 1 mega-watt-peak solar power plant requires approximately 3.5 to 4 acres or
0.014 km2 to 0.016 km2 of land in Bangladesh [24]. If 5% of untilled land is considered for
the estimation, it corresponds to a doubling of the area targeted in the vision of Government
2021 (10% of the whole generation from Renewable resources) from untilled land.
District and division-wise detailed data of households, industries, and untilled land are
included in Table 8.
In this section, the comparison between Bangladesh and the country where solar energy
development has come further is compared. So, a comparison between Germany [26] with
Bangladesh before and after applying the model is shown. At present, how much power is
going to achieve aiming 3100MW [25] from the entire project is listed. Then how much
power can be achieved from all the categories is calculated. It is to mention that if
Bangladesh fulfills 3100MW [25] generation from solar energy then the country will become
one of the top countries in south Asia after India of producing PV electricity.Table 1.4: Contribution of electricity generation from PV for corresponding sectors
Germany Bangladesh (Present Bangladesh (After applying
Country
(Present)[26] Govt. Target)) model -Figure7)
Household 14.10% 7% 33%
Industry 52.30% ´0.1% 1%
Untilled
33.50% 62% 200%
land
Table 1.5: Unit System capacity overview and comparison for different sectors
Bangladesh (Present Bangladesh(After applying
Country Germany [26]
Govt. Target)) model -Figure7)
Household 10kW 10-150Wp 300Wp
Industry 10-500kW 500kW-1MW 10kW
Untilled
>500kW 3-200MW 1MW<
land
Above table 1.4 and 1.5 shows Contribution denoting handout percentage of whole renewable
electricity generation within the corresponding field.
Generation Capacity denoting the projected or targeted generation capacity for the corresponding field
of PV production which addressing the mentioned percentages later.
Panel capacity denoting as per Unit system.
* Infrastructure Development Company Limited (IDCOL) is a government-owned specialized non-bank
financial institution. IDCOL subsidized to finance renewable projects mainly solar projects like the SHS system
in Bangladesh.2.1 Methodology
Method of getting accessible PV electricity potentials determined by using PV output and
applied it to the acquired data of home establishment, industrial establishment, and untilled
land from all the districts in the country. In the figure below, the proposed methodology is
shown with a diagram.
Figure7: Accessible PV potential model
In this section, both accessible electrical energy (kWh) and developable power (W) are
constructed by forming equations using the solar energy model and it will be conducted using
suitable methods based on the statistical analysis from Section 3.
To find PV electrical energy (kWh) following equations is used according to three different
categories:
(4.1)
(4.2)
(4.3)
Here,
is the accessible PV energy from 10% households of total households per day
is the accessible PV energy from 5% Industries of total industries per day
is accessible PV energy from 5% untilled lands of total untilled lands area per
dayis 10% accessible household from the total number of households
is 5% accessible industrial establishment from the total number of industrial
establishments
is 5% accessible untilled lands from the total area of untilled lands
is total PV output of 300W PV System during each day
is total PV output of 10kW PV System during each day
is total PV output of 1Mw PV System during each day
(km2) is coefficient 0.016;used to produce 1MW from 0.016km2 area [27]
Now, adding (4.1), (4.2), and (4.3)
(4.4)
is the combined accessible electrical energy per day (kWh/Day) against the
respective percentage of considered sectors found by adding the household, industry,
and untilled land categories.
To find solar power (W), the following equations are used:
(4.5)
(4.6)
(4.7)
Now, adding (4.4), (4.5), and (4.6)
(4.8)
is the outcome of combined accessible power against the respective percentage of
considered sectors by adding three categories.
2.2 Acquired Data
2.2.1 Solar Irradiation
The magnitude of solar irradiance varies into different regions and solar irradiance is an
important parameter to achieve solar electricity from the Sun. The unit to measure solar
energy is Watt-hour per square meter (Wh/m2 ). This energy is transferred by the sun
performing a nuclear fusion reaction which generates electromagnetic energy.The value of solar irradiances incident on earth surfaces are currently available at NASA
Langley Research Center and published through their website and API services. Solar
radiation data were collected of “All-Sky Insolation Incident on a Horizontal Surface” at
kilowatt-hour per meter square in a day for all the 64 districts of Bangladesh [28]. At first, all
the 64 districts are identified according to their latitude and longitude. Then the average solar
irradiance value from 2008-2018 is collected of each district. After that, the district value is
arranged according to the division by calculating its average value.
The solar irradiation map of Bangladesh indicating all the 64 districts is developed according
to the data and attached below.
Figure5: Solar insolation incident on a horizontal surfaceSource: This map is developed by the data of “All-Sky Insolation Incident on a Horizontal
Surface” from “NASA Langley Research Center” [28] according to all the 64 districts of
Bangladesh.
Latitude & longitude of one location has been taken for every district as a reference to get
solar insolation on a horizontal surface. For the defined location of the district´s last ten years
irradiation has been collected and taken the 10 years average irradiation. Districts with the
red zone are indicating the highest, yellow is moderate and gray color is the lowest value of
solar irradiation. The highest value is found at Cox’s Bazar district (4.98 kWh/m2/day) and
the lowest value is found at Sylhet district (4.61 kWh/m2/day). Solar irradiance average value
is ranged from 4.61 to 4.78 (kWh/m2/day) in all the divisions. The highest value is 4.78
kWh/m2/day found in the Chittagong division by averaging all the 11 districts under it and
the lowest value is 4.61 kWh/m2/day in Sylhet by averaging all the 4 districts under it. The
collected data from 2008-2018 are presented on the table of all the divisions.
Table 3: Solar irradiance on a Horizontal Surface (kWh/m2/day)
Division/ Barisal Chittagong Dhaka Khulna Mymensingh Rajshahi Rangpur Sylhet
Month
2008 4.85 4.97 4.92 5.01 4.82 4.95 4.86 4.83
2009 5.03 5.15 5.1 5.18 4.95 5.12 4.98 4.95
2010 4.93 5 4.98 5.09 4.86 5.06 4.88 4.76
2011 4.86 4.99 4.91 5.03 4.89 5.06 4.93 4.85
2012 4.95 5.01 4.99 5.11 4.89 5.11 4.97 4.79
2013 4.41 4.61 4.45 4.42 4.45 4.47 4.57 4.54
2014 4.63 4.79 4.56 4.57 4.51 4.57 4.58 4.57
2015 4.34 4.47 4.43 4.45 4.4 4.5 4.48 4.34
2016 4.42 4.58 4.52 4.51 4.46 4.55 4.51 4.5
2017 4.36 4.47 4.39 4.42 4.32 4.43 4.46 4.26
2018 4.49 4.58 4.5 4.51 4.45 4.56 4.56 4.37
Average 4.66 4.78 4.7 4.75 4.64 4.76 4.71 4.61
2.2.2 Land & Population Analysis
Bangladesh is one of the most densely populated countries in the world with a small land area
of 1, 47, 570 sq. km. According to the last “Population and housing census 2011”[20], its
population is over 144 million [29] with a density of 976 people per square kilometer [29]. At
present in 2020, its population reached 164 million [29] with density 1265 [29]. Analyzing
current population projections, Bangladesh’s population will reach its peak in 2053 [29] with
a population of a 192.78million [29]. So, the electricity demand will rise in the future for the
increasing population.
The solar power plant needs a larger area than a conventional fossil fuel-based and nuclear
power plant, where a 1000MW nuclear power plant requires a maximum of 8 acres [30] of
lands every year, on the other hand, a 1000MW PV power plant requires 5000 acres [31] of
lands which is equivalent to 20 square kilometers. Solar home system (SHS) also needs either
household´s rooftop area or other land areas. So, it is required to analyze thoroughly the land,
population, and houses of different districts in Bangladesh. Based on Bangladesh “Population
and housing census 2011”, amount of area, sub-district, village, population, and density iscollected of the total of 64 districts. It is found that the Dhaka division has the highest population density of 1773 persons per square kilometer with 20,551 square kilometers of the area [Appendix-1 Table B]. So, there is a good opportunity to use SHS in these areas, and having a large portion of land there is a chance to get a good number of untilled lands to establish solar parks. But from the SHS map of Infrastructure Development Company Limited (IDCOL) [Figure 10], it is found that the lowest numbers of SHS are installed in this division (Dhaka) and also two solar parks with 135 MW capacity has been installed here. The largest division by area is the Chittagong division (33,771 sq km) but the amount of untilled land is found very few comparing its large area than other divisions. But in this division, installed SHS is very good in numbers and the highest capacities of solar parks (637.4 MW) are found here. Population density is found lowest (704 per sq km) in the Khulna division (22,272 sq km) and the lowest amount of untilled land area is in the Sylhet division (12,596 sq km). Calculating all 64 districts, a short presentation of the 8 divisions is shown in the table [Appendix-1 Table B]. 2.2.3 Available Home Establishment Solar home systems (SHS) can play a vital role for the urban and rural areas to decrease the dependency on diesel or other fuels and in turn to reduce carbon emission by installing solar panels on the rooftop. Since the number of populations is increasing and also the number of their households, it is a suitable place to generate electricity using unused household areas. The number of households has been collected from “Population and housing census 2011” [20] from all the districts of Bangladesh. According to their report, persons either related or unrelated, living together and taking food from the same kitchen constitute a household. A single person living and eating alone forms a one-person household and the size of a single household consists of 4.5 persons on average. In 2019, per capita consumption of electricity was 374.62 kWh [32]and the consumption is increasing than the previous year. So, the solar home system can lessen pressure on the national grid by fulfilling the demand of households. Most rooftops (roof surfaces) of commercial and residential buildings are completely or partially unused. By using this large portion of unused area, after supplying power as per the demand of the household or the building, additional power can be supplied to the local distribution system. From the data [Appendix-1 Table C], it is found the maximum number of households is at Dhaka division (83,09,923) and the lowest numbers are in the Sylhet division (17,90,892). Households in the urban and rural areas are also highest in Dhaka and lowest in the Sylhet division as well. It is mentioned because; despite having a large number of households at Dhaka division, the solar home system is installed maximum in the division which has less household area. From the map of IDCOL[Figure 10], it is found that SHS is installed highest in Sylhet, Barisal, and Chittagong divisions. Though the main target of IDCOL is to install SHS in rural areas, they targeted the areas which have maximum numbers of “No Electricity” or deprived of access to electricity. So, there is still a modest quantity of households that yet to install SHS by targeting other divisions which have the highest numbers of households including urban and rural areas. Numbers of the home establishment of all the 64 districts are collected from “Population and
housing census 2011” and presented according to respective divisions. The complete data is
presented at - [Appendix-1 Table C].

2.2.4 Available Untilled Land & Industrial Establishment

Several industrial establishments & untilled areas can be used to produce PV. All the data
related to land and numbers of industrial establishments have been collected from “District
Statistics 2011”[33]. Numbers of industrial establishments are some of the selected industrial
establishments in Bangladesh including readymade garments, textile mill, rice mill, match
factory, steel, aluminum, jute mill, sugar mill, etc. It is noted that untilled area is the area that
is not available for cultivation due to the residence and commercial and other uses.
The highest amount of untilled land has been found in the Dhaka division and the lowest in
the Chittagong division. Maximum numbers of industries are found at Dhaka (21,083) and
minimum at Sylhet division (2,454). Numbers of industrial establishment and untilled land
are shown in detail at - [Appendix-1 Table D].

2.2.5 Solar Irradiation Parameters Description

In this section, the comparison between “NASA” developed solar irradiation data and
“SolarGIS” developed solar irradiation data is shown. In the previous section, solar irradiance
from “NASA Langley Research Center” is discussed. Now, those data are being compared
with different parameters found from “SolarGIS”. The full data of “SolarGIS” is shown
below. After that, the average PV output (Photovoltaic Electricity Potential) from SolarGIS
[34] is presented for all divisions from the district level. That PV output is applied in home
establishments, industries, and untilled lands later to find out the minimum accessible power
potential for the country.
Table 4: Comparison between different parameters related to solar irradiation [35]
    Divisions         DNI     Cos(θ    DIF      GHI     GTI       OPTA           TEM      ELE
    Name                      )                         OPTA                     P
    Barisal           2.92    0.70     2.58     4.63    4.94      23.2 / 180°    25.9°    6.12
    Chittagong                                                    24.5 / 180°
                      3.20    0.69     2.48     4.70    5.05                     25.6°    18.18
    Dhaka             2.83    0.71     2.57     4.57    4.88      23.3 / 180°    25.7°    8
    Khulna            2.87    0.71     2.61     4.65    4.95      22.9/ 180°     25.9°    8.9
    Mymensingh        2.86    0.69     2.5      4.47    4.82      25.3/ 180°     25°      16
    Rajshahi          2.85    0.70     2.57     4.57    4.88      24.1/ 180°     25. 5°   19
    Rangpur           2.75    0.69     2.53     4.42    4.76      25.1/ 180°     24.9°    41.75
    Sylhet            3.09    0.69     2.41     4.53    4.91      25.5°/ 180°    24.9°    12

Now, it is required to analyze those parameters with all the divisions. These data are suitable
for preliminary studies because they represent default values and are important for designing
photovoltaic systems. These parameters are very effective to PV assessment and regional
solar climate analysis:
DNI: Direct normal irradiation or DNI is the average yearly, monthly, or daily sum of direct
normal irradiation. The unit of DNI is kWh/m².
Cos(θ): It is the value that is multiplied with DNI and added the outcome with DIF to get the
amount of GHI. The value of cos(θ) is found between 0.69 to 0.70 so the value of θ is almost
between 450-460.
DIF: Diffuse horizontal irradiation or DIF is average yearly, the monthly or daily sum of
diffuse horizontal irradiation. The unit of DIF is kWh/m².
GHI: Global horizontal irradiation or GHI is the average yearly, monthly, or daily sum of
global horizontal irradiation. The unit of GHI is kWh/m².
GTI OPTA: Global tilted irradiation at an optimum angle or GTIOPTA is the average annual,
monthly, or daily sum of global tilted irradiation for PV modules fix-mounted at an optimum
angle. The unit of GTIOPTA is kWh/m².
OPTA: Optimum tilt of PV modules or OPTA is Optimum tilt of fix-mounted PV modules
facing towards equator set for maximizing GTI input. The unit of OPTA is ° (Degree). From
the data, it is found that the default azimuth of PV panels is 180° for all the divisions, and tilt
angle varies between 22.9° to 25.5°. These values are similar for small residential, medium-
size commercial, and ground-mounted large-scale PV systems.
TEMP: Air temperature or TEMP is yearly, monthly, and daily air temperature at 2 m above
ground. The unit of TEMP is °C.
ELE: Terrain elevation or ELE is the elevation of terrain surface above/below sea level,
processed and integrated from related data products. The unit of ELE is meter (m).
Now, a comparison between many parameters including solar irradiance of NASA vs. GHI
and GTIOPTA of SolarGIS is shown below.
5.1
5
4.9
Y- Irradiance [kWh/m²]
4.8
4.7
4.6
4.5 Solar Irradiance
4.4 GHI
4.3
GTIOPTA
4.2
4.1
X- Divisions
Figure 6: Solar irradiance of NASA vs. GHI and GTIOPTA of SolarGIS.PV output (PVout): Photovoltaic power output is the yearly and monthly average values of
photovoltaic electricity delivered by a PV system. The unit of PV output is kWh/day. Since
all the parameters are necessary to achieve the highest efficiency from the solar establishment
but for the estimation in the “Methodology” section, “PV output” is considered and applied to
each district. “PV output” is the measurement that provides the average amount of
photovoltaic electricity during the whole day. As because the solar system does not work at
night or in other adverse situations, the average PV output for 1kW [34] system is found 3.8
to 4.03 kWh/day after studying the PV output map for Bangladesh from solarGIS and directly
applied to each district to get the utmost acceptable value which is shown in table 4.1. Here
capacity factor 4/24 or 16.67% for Bangladesh has not been deployed rather used the PV
output data from SolarGIS to get more accurate PV output values for different divisions. It is
to mention that photovoltaic output data for the 1kWp system from SolarGIS has been
calculated after considering the capacity factor for each division [36], similarly, the PV
output for 300Wp, 10kW, and 1MW PV system has been calculated.
Table 4.1: Average PV output (kWh/day) for 1kW system after considering Capacity factor
Division Name Average PV output
Barisal 3.95
Chittagong 4.03
Dhaka 3.89
Khulna 3.95
Mymensingh 3.88
Rajshahi 3.91
Rangpur 3.80
Sylhet 3.93Result
3.1 Photovoltaic Power Potential
PV output for the 1kW system varies in different regions in Bangladesh. PV output is lower
in the northern part and relatively higher in the southern part. Average PV output is found
highest in Chittagong (4.03 kWh/day) [37] and lowest in Rangpur (3.80 kWh/day) [37]. This
data has been collected from Global Solar Atlas [37], which is prepared by “SolarGIS” for
The World Bank [37] studying solar radiation estimation from the measurement of sunshine
hours of all the districts in Bangladesh. The required data relating to this thesis has been
calculated for 300W, 10kW, and 1MW (PV system) from 1kWp PV [38] system in
kWh/m2/day and then converted to kWh/m2/year [Appendix-3 Table A] which is obtained
from “SolarGIS” developed Photovoltaic Electricity Potential map [37]. According to
SolarGIS, solar to electricity conversion has been performed based on solar resources data
and PV modeling software considering solar radiation, air temperature, and later losses (about
11%) [36]. The attached figure in the appendix shows the average PV output for all the
divisions. [Appendix-2Figure A]
3.2 Estimated Solar (PV) Energy from Available Home Establishments
The number of households collected of all the 64 districts from “Population & Housing
Census 2011 Bangladesh” and all the districts is arranged into divisions. To discover solar
potential from the household, 10% household has been considered with minimum 300W peak
system for the household including commercial institutions. Since the number of households
is maximum in Dhaka (83 million) and minimum in Sylhet (17 million), the amount of total
PV output for Dhaka is maximum for kilo-watt hour per day as well as year. The amount of
PV output 1.19 kWh [Table 5] per day for Barisal indicates the average of all 6 districts in the
Barisal division for the 300W peak system.
Table 5: PV output for 10% household using 300W peak system (using equation 4.1)
Division Households 300W Peak system Total PV output for 10% of
Name PV energy output households
Total 10% kWh/ kWh/ MWh/ GWh/
Household Household day year Day year
Barisal 1862841 186285 1.19 434 222 81
Chittagong 5626310 562631 1.21 442 681 249
Dhaka 8309923 830992 1.17 427 972 355
Khulna 3739779 373978 1.19 434 445 163
Mymensingh 2539392 253939 1.16 423 295 108
Rajshahi 4486829 448682 1.17 427 525 192
Rangpur 3817664 381766 1.14 416 435 159
Sylhet 1790892 179089 1.18 431 211 77
Total 32173630 3217363 1.18 (avg) 429.33 (avg) 3785.82 1382According to the equation (4.1),
Here, ; 10% of the household of the Barisal division
Since we found, 3.95 kWh PV output using 1kW peak system from Barisal division,
according to Appendix 3 Table A,
∴ =300W × 3.95= 1.19kWh/day; using 300W peak system
Now, =
3.3 Estimated Solar (PV) Energy from Available Industrial Establishments
10kW peak PV system and 5% industrial establishment are considered to calculate total PV
output from the industry sector of Bangladesh. The total number of industrial establishments
found 57434 from all the districts. The average PV output for the Dhaka division is 3.89
kWh/day for a 1kW peak system [Table 4]. So, 10kW system output becomes 38.9 kWh/day.
By taking 5% industrial establishment, the total number of PV electricity potential output
becomes 40.99 GWh/year.
Table 6: PV output for 5% industries using 10kW peak system (using equation 4.2)
District Name Industries 10kW Peak system Total PV output for
PV energy output 5% Industries
No. of 5% kWh/ kWh/ MWh/ GWh/
Industries Industries day year day year
Barisal 2855 143 40 14418 6 2
Chittagong 6841 342 40 14699 14 5
Dhaka 21083 1054 39 14206 41 15
Khulna 6928 346 40 14418 14 5
Mymensingh 3234 162 39 14144 6 2
Rajshahi 7517 376 39 14283 15 5
Rangpur 6522 326 38 13870 12 5
Sylhet 2454 123 39 14326 5 2
Total 57434 287 39(avg) 14295 (avg) 112 41
3.4 Estimated Solar (PV) Energy from Available Untilled Land
On-grid commercial solar PV power plants of big margin production require plenty of lands.
The Government of Bangladesh justifiably preserves agricultural lands from being used for
the development of solar PV projects for having an agriculture-dominated economy. As a
result, there are very few non-agricultural untilled lands scattered all over the country.
Installation of 1 mega-watt-peak solar power plant requires approximately 3.5 to 4 acres or
0.014 km2to 0.016 km2of lands in Bangladesh [27]. 4 acres or 0.016 km2 of land for 1MW
and 5% untilled land is considered for the estimation.Total PV output for 5% land is approximately 9492.65 GWh/ year.
Table 7: PV output for 5% untilled land using 1MW/0.016 km2 peak solar system (using
equation 4.3)
District Untilled Land (km2) 1MW peak system Total PV output for 5%
Name [0.016km2 -> 1MW] PV energy output Untilled Land
Total 5% kWh/ kWh/ MWh/ GWh/
Untilled Untilled day year day year
Land Land
Barisal 160 8 3950 1441750 1947 711
Chittagong 157 8 4027 1469954 1952 712
Dhaka 578 27 3892 1420694 6946 2535
Khulna 315 16 3950 1441750 3840 1402
Mymensingh 50 33 3875 1414375 597 218
Rajshahi 243 12 3912 1428062 2934 1071
Rangpur 375 199 3800 1387000 4419 1613
Sylhet 278 14 3925 1432625 3373 1231
Total 2156 108 3917 (avg) 1429526 (avg) 26007 9492
3.5 Developable Solar Power
Developable PV power is the amount solar power which can be gained by utilizing 10%
household, 5% industrial establishments and 5% untilled land by using 300W, 10kW and
1MW peak system respectively. The complete data is presented below:
Table 8: Developable solar power including home establishments(households), industrial
establishments, and untilled lands (using equation 4.5, 4.6, 4.7)
Division Household Industries Untilled Land
Name For 300W Peak system For 10kW Peak system For 1MW Peak system
10% Accessible PV 5% Accessible PV 5%Untilled Accessible PV
Household Capacity Industries Capacity Land (km2) Capacity
(MW) (MW) (MW)
Barisal 186284 56 143 1.43 8 493
Chittagong 562631 169 342 3.42 8 485
Dhaka 830992 249 1054 11 29 1784.48
Khulna 373978 112 346 3.46 16 972
Mymensingh 253939 76 162 2 2.49 154
Rajshahi 448683 135 376 4 12 750
Rangpur 381766 115 326 3.26 19 1163
Sylhet 179089 54 123 1.22 14 859
Total 3217363 965.21 2872 29 108 6660You can also read