Should Shippers Be Afraid of Ghost Freight? An Empirical Analysis of a Customer Portfolio From TMC, a Div. of C.H. Robinson
←
→
Page content transcription
If your browser does not render page correctly, please read the page content below
Should Shippers Be Afraid of Ghost Freight? An Empirical Analysis of a Customer
 Portfolio From TMC, a Div. of C.H. Robinson
 by
 Yu Xuan Liu
 BA in Economics & Mathematics, Waseda University
 and
 Alexander Clayton Miller
 BS in Economics, Washington State University

 SUBMITTED TO THE PROGRAM IN SUPPLY CHAIN MANAGEMENT
 IN PARTIAL FULFILLMENT OF THE REQUIREMENTS FOR THE DEGREE OF
 MASTER OF APPLIED SCIENCE IN SUPPLY CHAIN MANAGEMENT
 AT THE
 MASSACHUSETTS INSTITUTE OF TECHNOLOGY

 June 2021
 © 2020 Yu Xuan Liu, Alexander Clayton Miller. All rights reserved.
The authors hereby grant to MIT permission to reproduce and to distribute publicly paper and electronic
 copies of this capstone document in whole or in part in any medium now known or hereafter created.

Signature of Author: ____________________________________________________________________
 Department of Supply Chain Management
 May 21, 2021

Signature of Author: ____________________________________________________________________
 Department of Supply Chain Management
 May 21, 2021
 Certified by: __________________________________________________________________________
 Dr. Chris Caplice
 Executive Director, Center for Transportation & Logistics
 Capstone Co-Advisor
 Certified by: __________________________________________________________________________
 Angela Acocella
 PhD Candidate, Research Assistant
 Capstone Co-Advisor

Accepted by: __________________________________________________________________________
 Prof. Yossi Sheffi
 Director, Center for Transportation & Logistics
 Elisha Gray II Professor of Engineering Systems
 Professor, Civil and Environmental Engineering
Should Shippers Be Afraid of Ghost Freight? An Empirical Analysis of a Customer Portfolio From TMC, a
 Div. of C.H. Robinson
 by

 Yu Xuan Liu

 and

 Alexander Clayton Miller

 Submitted to the Program in Supply Chain Management
 on May 21, 2021 in Partial Fulfillment of the
 Requirements for the Degree of Master of Applied Science in Supply Chain Management

ABSTRACT

Over the past several years, there has been severe market volatility in the truckload industry leading to
cost increases and efficiency losses for shippers and carriers. Previous research has investigated the many
factors that contribute to such market conditions. One topic that has yet to be analyzed is “ghost freight.”
Ghost freight occurs either when no volume materializes on a lane (origin-destination pair) that was
previously awarded to one or more primary carriers (a “full ghost” lane), or when the shipper tenders to
only a subset of awarded primary carriers (a “partial ghost” lane). Our research leveraged five years of
truckload market transactions for 15 shippers and over 300 carriers to conduct our analysis. We utilized
Python and Tableau to identify and visualize the frequency of ghost freight across the market along with
the types of lanes that tend to become ghost lanes. In addition, Ordinary Least Squares (OLS) regression
was used to determine the impact of ghost freight on carrier performance. This research found that both
full and partial ghost lanes occur very frequently in general each year, however there is a lack of pattern
with respect to individual shipper behavior. The regression models did not show a clear impact of ghost
freight on acceptance rates or prices. This may be the case in part because full ghost freight occurs
overwhelmingly on low-volume lanes, which are traditionally not a capacity planning priority. That being
said, we found that partial ghost lanes tend to occur on lanes that are often medium-to-high volume. This
finding may be a topic of interest for carriers for future capacity planning. Further, although shippers do
not appear to face direct financial repercussions resulting from carriers, it is ultimately inefficient to spend
time and money awarding lanes that are never tendered to.

Capstone Co-Advisor: Dr. Chris Caplice
Title: Executive Director, Center for Transportation & Logistics

Capstone Co-Advisor: Angela Acocella
Title: PhD Candidate, Research Assistant

 2
ACKNOWLEDGMENTS

We would first like to thank our advisors, Dr. Chris Caplice and Angela Acocella. Dr. Caplice is an inspiring
leader who provided clear guidance and valuable mentorship throughout the project. Ms. Acocella was
selflessly committed to assisting us at every step of the project, and we extend our highest thanks for her
conscientiousness and kindness.

We next thank the team at our project sponsor C.H. Robinson, particularly Steve Raetz and Andy Welch.
We greatly appreciate their enthusiasm for solving problems along with the essential insights and
knowledge shared with us over the course of the research.

Last, but certainly not least, we want to thank Toby Gooley for the comprehensive and outstanding
feedback provided to us during the editing process.

 3
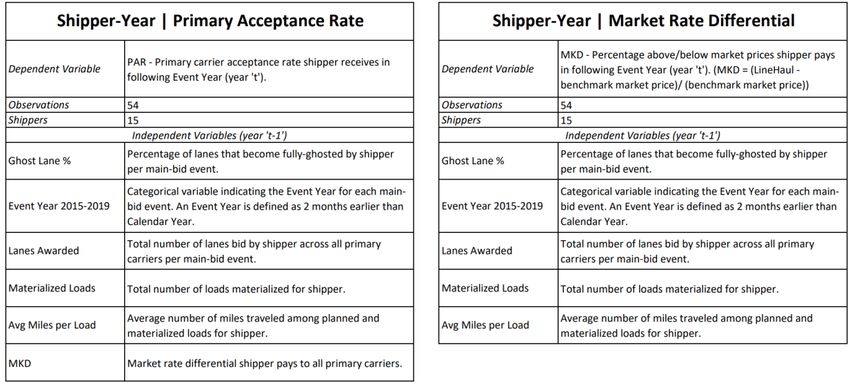
TABLE OF CONTENTS

LIST OF TABLES ............................................................................................................................................... 5
1. INTRODUCTION .......................................................................................................................................... 6
 1.1 The Truckload Market .......................................................................................................................... 6
 1.1.1 Shipper-Carrier Procurement ....................................................................................................... 6
 1.1.2 Ghost Freight ................................................................................................................................ 8
 1.2 Research Questions and Hypotheses .................................................................................................. 9
2. LITERATURE REVIEW ................................................................................................................................11
 2.1 The Truckload Industry ......................................................................................................................11
 2.2 Transportation Procurement and Routing Guides ............................................................................11
 2.3 Routing Guide Performance ..............................................................................................................12
 2.4 Mitigating Routing Guide Failures .....................................................................................................13
 2.5 Conclusion ..........................................................................................................................................14
3. DATA SUMMARY AND PREPARATION .....................................................................................................15
 3.1 Data Summary ...................................................................................................................................15
 3.2 Shipper Procurement Tendencies .....................................................................................................17
 3.3 Procurement Profiles .........................................................................................................................20
4. GHOST FREIGHT ANALYSIS .......................................................................................................................22
 4.1 Ghost Freight Identification ...............................................................................................................22
 4.2 Ghost Freight Frequency ...................................................................................................................24
 4.3 The Impact of Ghost Freight ..............................................................................................................27
 4.3.1 Regression Results ......................................................................................................................30
5. GHOST FREIGHT FROM A NETWORK PERSPECTIVE .................................................................................34
 5.1 Network Characterization ..................................................................................................................34
 5.2 Network Hierarchy Analysis ...............................................................................................................36
 5.3 Lane Analysis ......................................................................................................................................39
6. CONCLUSION............................................................................................................................................46
 6.1 Insights and Management Recommendations ..................................................................................46
 6.2 Future Research .................................................................................................................................49
REFERENCES .................................................................................................................................................50
APPENDIX .....................................................................................................................................................51

 4
LIST OF FIGURES
Figure 1: Freight Award and Tendering Outcome Matrix ............................................................................. 8
Figure 2: Routing Guide Tender Process .....................................................................................................12
Figure 3: Shipper #4 Annual Lane Procurement ..........................................................................................18
Figure 4: Shipper #17 Quarterly Lane Procurement ....................................................................................19
Figure 5: Shipper #16 Continuous Lane Procurement.................................................................................20
Figure 6: Shipper #4 Procurement Profile ...................................................................................................21
Figure 7: Shipper #4 Ghost Freight Percentage Per Year ............................................................................23
Figure 8: Annual Full & Partial Ghost Lane Percentage—All 15 Shippers ...................................................24
Figure 9: Shipper #4 Ghost Lane Percentage By Lane Hierarchy (All Hierarchies) ......................................35
Figure 10: Shipper #4 Full Ghost Lane Percentage By Lane Hierarchy (Consolidated) ...............................36
Figure 11: Annual Volume Weighted Averages (All 15 Shippers) ...............................................................36
Figure 12: Network Ghost Freight Trends – 2015 .......................................................................................37
Figure 13: Network Ghost Freight Trends – 2016 .......................................................................................38
Figure 14: Network Ghost Freight Trends – 2017 .......................................................................................38
Figure 15: Network Ghost Freight Trends – 2018 .......................................................................................38
Figure 16: Network Ghost Freight Trends – 2019 .......................................................................................39
Figure 17: Full Ghost Lane Previous Volume – 2016 ...................................................................................40
Figure 18: Full Ghost Lane Previous Volume – 2017 ...................................................................................40
Figure 19: Full Ghost Lane Previous Volume – 2018 ...................................................................................41
Figure 20: Full Ghost Lane Previous Volume – 2019 ...................................................................................41
Figure 21: Full Ghost Lane Consistency Year-over-Year ..............................................................................42
Figure 22: Partial Ghost Lane Volume – 2015/2016 ....................................................................................43
Figure 23: Partial Ghost Lane Volume – 2016/2017 ....................................................................................44
Figure 24: Partial Ghost Lane Volume – 2017/2018 ....................................................................................44
Figure 25: Partial Ghost Lane Volume – 2018/2019 ....................................................................................45

LIST OF TABLES
Table 1: Full Dataset Summary ....................................................................................................................15
Table 2: Data File and Key Feature Summaries ...........................................................................................17
Table 3: Annual Partial Ghost Lane Percentage Per Shipper .......................................................................25
Table 4: Annual Full Ghost Lane Percentage Per Shipper ...........................................................................26
Table 5: Shipper-Year Regression Model Summaries ..................................................................................29
Table 6: Shipper-Carrier-Year Regression Model Summaries .....................................................................29
Table 7: Carrier-Year Regression Model Summaries ...................................................................................30
Table 8: Shipper-Year Regression Results....................................................................................................30
Table 9: Shipper-Carrier-Year Regression Results .......................................................................................31
Table 10: Carrier-Year Regression Results ...................................................................................................31
Table 11: Shipper-Year Regression Results (High-Volume Lanes) ...............................................................32
Table 12: Shipper-Carrier-Year Regression Results (High-Volume Lanes) ..................................................32
Table 13: Carrier-Year Regression Results (High-Volume Lanes) ................................................................33
Table 14: Shipper Summary Statistics .........................................................................................................51

 5
1. INTRODUCTION

 Over the past several years, the trucking industry has experienced severe market volatility

resulting from fluctuations in supply and demand. This circumstance has been exacerbated by the COVID-

19 global pandemic. These swings in trucking supply and demand have caused frequent failures and

overall underperformance in shippers’ truckload plans and strategies, referred to as “routing guides” in

this research. The outcome of such failure and underperformance is a dramatic increase in transportation

costs and reduction in operational efficiency for many shippers across industries. According to truckload

industry common knowledge, most shippers experience reduced efficiency and transportation budget

overruns in trucking markets where capacity is tight. Following the 2017-2018 tight market, Q3 and Q4 of

2020 saw the tightest ever markets as a result of the Covid-19 pandemic.

1.1 The Truckload Market

 The truckload transportation industry represents over $800b in annual gross domestic product

(GDP) and has continued to grow over time (Pickett, 2018). There are four primary actors involved in the

trucking process: shippers, carriers, brokers, and receivers (Caplice, 2007). Shippers are manufacturers,

retailers, distributors, importers/exporters, etc., that own the freight and determine where it is going and

when it needs to be delivered to a receiver. The carrier is the trucking firm that physically moves the load

at hand for the shipper. Carriers are typically for-hire trucking firms, though some shippers operate their

own private fleets. Brokers are non-asset providers that coordinate with shippers on a carrier’s behalf.

While a broker might be awarded a contract, it’s ultimately a carrier that hauls the freight.

1.1.1 Shipper-Carrier Procurement

 Transportation shipments are procured in a two-stage, two-moments-of-truth process. The first

stage is a reverse auction, where a shipper issues a Request for Proposals (RFP) and awards lanes (i.e.,

origin-destination pairs) to one or more primary (preferred) carriers for future trucking services. These

 6
contracts are binding in price, but not in capacity (i.e. space provided by a carrier) or volume (i.e. freight

actually offered by a shipper). That said, there is an expectation of volume that carriers plan for as

determined by such contracts. The second stage occurs when a shipper tenders a load to a carrier. The

carrier can either accept or reject the load. Because acceptance is not guaranteed, shippers identify

backup carriers along with the primary carrier(s) in a “routing guide” that is managed electronically within

a Transportation Management System (TMS). Shippers proceed down the routing guide in a “waterfall”

process until the load is accepted. Loads are tendered on the real-time “spot market” when neither the

primary carrier nor backup carriers accept a given load.

 As noted above, shippers are not obligated to tender loads on the lanes they award during an RFP.

When none of the expected volume is tendered to the primary carrier on a lane, we identify this as a

“ghost lane.” The reverse of this, an “unplanned lane,” occurs when shippers tender loads on lanes that

are not associated with a formal RFP and have not been contracted to the tendered carrier. Lanes

associated with RFPs that are tendered to are considered “planned & materialized.” A simple matrix

summarizing these occurrences is shown in Figure 1.

 7
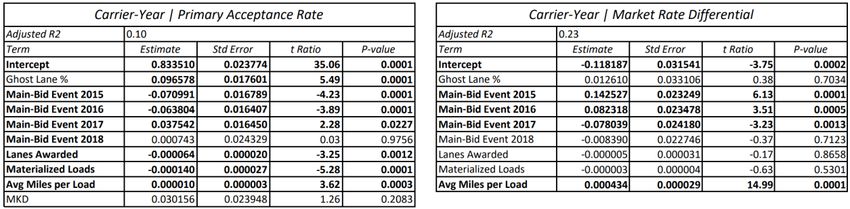
Figure 1: Freight Award and Tendering Outcome Matrix

 Shippers typically conduct an annual RFP that accounts for most of their freight in a given year.

This procurement rhythm is referred to as an “annual main-bid event” strategy in this research, and our

analysis focuses on the shippers that utilize this strategy. These shippers tend to also conduct smaller RFPs

throughout a given year referred to as “mini-bid” events, but those are not the focus of this research.

1.1.2 Ghost Freight

 The fact that truckload contracts are not binding in capacity or volume is the basis for weakness

and failure during the tendering process. Various factors contributing to this failure and the impact on

shippers and carriers have been studied extensively in recent years (for details, see Section 2). Ghost

freight is one such factor many in the industry believe to be relevant to routing guide success, cost

minimization, and stronger shipper-carrier relationships. This intuition has not been analyzed formally,

however, and the overall purpose of this research is first to document and characterize the occurrence of

ghost freight, then present novel insights regarding the impact of ghost freight on shipper business

outcomes.

 8
Ghost freight can be thought of as falling into two categories: “full ghost” and “partial ghost”. Full

ghost represents a lane that a shipper awards to one or more primary carriers, but no volume materializes

on that lane over the contract timeframe. This type of lane represents a situation where the shipper

actually didn’t have control over the ghosting activity because the planned volume never materialized.

Partial ghost occurs when a shipper awards a lane to multiple primary carriers yet tenders loads to only a

subset of the awarded primary carriers. In contrast to full ghost, these are situations where the shipper is

at fault because they disregarded the planned load allocation from their annual RFP. The shipper

could/should have tendered to all of the primary carriers, yet that is not the outcome. Note that the two

definitions are shipper-centric. A carrier is unable to distinguish between full and partial ghost, as they

are unaware of how shippers respond to other primary carriers awarded the same lanes. From a carrier’s

perspective, a ghost lane is the same whether it is full or partial for a given shipper. Carriers expect loads

to be tendered on lanes awarded to them, which is why many suspect ghost freight may be a contributing

factor to higher cost for shippers and lower acceptance rates by carriers. This principle applies especially

to high-volume lanes, as those represent the bulk of carrier capacity planning expectations.

1.2 Research Questions and Hypotheses

 This research addresses three primary questions: (1) what is ghost freight and how frequently

does it occur across the truckload market; (2) how does ghost freight impact shippers’ business outcomes;

and (3) are there any network-wide ghost freight trends? The dataset used to address these questions is

five years of shipment transactions spanning the US truckload market. Our hypotheses are as follows:

 1. Ghost freight (both full and partial) occurs at consistent rates among shippers utilizing an annual

 main-bid event strategy.

 2. Shippers with higher percentages of ghost lanes in a given year tend to experience lower

 acceptance rates and higher market prices from carriers in the following year.

 9
3. Full-ghost lanes are less common on specifically defined lane hierarchies (e.g. City-to-City) than

 on broadly defined lane hierarchies (e.g. Region-to-Region).

 4. Ghost lanes (both full and partial) tend to be low volume lanes.

 The first hypothesis revolves around the assumption that patterns will form with respect to

shipper behavior. Whether it is the proportion of ghost lanes overall or fluctuations in ghost lanes

between certain industries and/or market conditions, we hypothesize that some degree of pattern

emerges. The second hypothesis reflects the logical notion that ghost freight impacts carrier capacity

planning, and therefore carriers will respond to shippers with lower acceptance rates and higher prices.

The result of this hypothesis may be impacted by lane volume, however. Capacity planning matters most

on traditionally high-volume lanes, so ghosting may not be so impactful if it occurs mostly on traditionally

low-volume lanes. The intuition of our advisors and sponsor company is that ghosting is more common

on lower volume lanes, and this is reflected in our third and fourth hypotheses. The fourth assumes that

both full and partial ghost lanes tend to be low-volume. The third, predicting that ghosting is less common

on more specifically defined hierarchies, reflects the industry knowledge that that those hierarchies tend

to be higher in volume.

 This paper is structured as follows: in Section 2, recent literature is presented to provide additional

background on truckload procurement and routing guide weaknesses. In Section 3, we summarize our

data and explain the manipulation processes required to identify ghost freight. Next, in Section 4, we

present the results regarding the frequency of ghost freight and the impact of ghost freight on shippers

and carriers. Then, we analyze ghost freight trends from a TL network perspective. We conclude with key

insights and recommendations for future research.

 10
2. LITERATURE REVIEW

2.1 The Truckload Industry

 The truckload industry is unique in the sense that there are hundreds of thousands of carriers

moving freight for hundreds of thousands of shippers. Contrast this with other, highly concentrated

industries, such as the airline industry, where there are only a handful of carriers for customers to choose

from. As of 2015, there were an estimated 580,000 common trucking carriers along with another 747,781

private carriers. Roughly 97% of carriers operate just 20 trucks or fewer, and the fifteen largest carriers

account for only 12% of overall industry revenue (Pickett, 2018).

 Transportation is important to the budgets and strategies of the shippers involved. It has been

estimated that transportation accounts for over 60% of shippers’ logistics costs (Caplice, 2007). Further,

truckload transportation tends to be a key component of those large transportation budgets. Given this,

it is paramount for shippers to maximize efficiency and minimize excess costs with respect to their

truckload strategies. Unfortunately, in practice shippers often experience cost escalations resulting from

breakdowns in their trucking contracts. This research aims to help shippers identify when and why these

failures occur and subsequently provide insights as to how they can deploy more effective planning

techniques.

2.2 Transportation Procurement and Routing Guides

 Since the 1980’s, shippers typically either procure their expected freight via long-term contracts

with carriers or they secure capacity on the spot market. The spot market is a way to secure capacity

immediately in an open marketplace where prices are determined by real-time supply and demand factors

(Acocella et al., 2020). The long-term contracts are typically determined via a reverse auction, and hauling

rights are awarded to carriers for a future period of time. Shipments are then tendered using electronic

catalogs referred to as “routing guides” (Caplice, 2007).

 11
Because trucking contracts are not binding in capacity or volume, they can break down in

response to general market forces or due to other scenarios where the incentives lead a shipper or carrier

to deviate from the plan within a routing guide (C.H. Robinson, 2017). An overview of the routing guide

process is illustrated by Aemireddy & Yuan (2019) and is shown in Figure 2.

 Figure 2: Routing Guide Tender Process

Loads are either tendered to the primary carrier and accepted by that carrier, or the shipper proceeds in

a waterfall process down the routing guide to backup carriers (if applicable) or ultimately to the spot

market.

2.3 Routing Guide Performance

 Again, trucking contracts are not binding in capacity or volume, and reality can deviate from the

plan defined in a routing guide, especially in a tight market. A tight market, where demand from shippers

exceeds the supply offered by carriers, puts upward pressure on spot market prices. This is turn

incentivizes carriers to reject contracted loads and instead realize higher levels of profitability via high

spot market prices as opposed to the now-below-spot-market contract rates (Convoy, 2020). Conversely,

in a soft market (where capacity is not constrained), freight rejections and routing guide failures tend to

 12
be rare. For example, in the 2004 timeframe, only 5% of all loads were rejected by carriers (Caplice, 2007).

That number can reach over 30% in a tight market (Acocella et al, 2020).

 One example of a tight market occurred in 2017-2018. The introduction of a variety of US

Government regulations that negatively impacted carrier efficiency coincided with a strong economy.

Such a situation typically leads to higher volumes of freight as shippers seek more trucking capacity to

align with consumer activity (Soskin, 2018). High rates of routing guide failure impacts not only efficiency

and service quality, but also transportation budgets of shippers. The outcome of a tight market and

routing guide failure is often to resort to the spot market, where costs tend to be much higher than

contract rates. In 2018, for example, truckload spot market prices were 35% higher than contract freight

rates (Aemireddy & Yuan, 2019).

2.4 Mitigating Routing Guide Failures

 Previous research has identified what causes freight rejections, and some studies have

recommended strategies for shippers to potentially avoid such routing guide failures, even in tight

markets. While shippers may expect that carriers they paid premiums to in previous soft markets will

accept most of their freight, in tight markets carriers tend instead to respond more positively to shippers.

Examples of this phenomenon include competitive tight market prices, frequent and consistent load

tenders, and lanes with low dwell (i.e., waiting) times (Acocella et al., 2020).

 Another finding suggests that lane volume is a key factor in contracts leading to routing guide

failures and transportation budget overruns. Some shipping lanes have consistently high levels of freight

traveling on them in a given week, whereas low-volume lanes experience a lot of volatility with respect to

weekly levels of freight. As mentioned above, carriers value consistency, and the variability on low-volume

lanes results in higher levels of loads being rejected and ending up on the often costly spot market

(Alnajdawi & Jimenez, 2020).

 13
In addition, some evidence suggests that a close relationship between shippers and carriers

contributes to lower rates of routing guide failures (Zidisin et al., 2007). Consistent business and strong

communication can reap benefits. Good relationships tend to be particularly important between a shipper

and the primary carrier identified in their routing guide. Conversely, the value of a stronger relationship

does not appear to hold up with backup carriers, which typically prioritize real-time economic factors

when accepting or rejecting freight (Scott, 2016).

2.5 Conclusion

 Though the trucking market is complex and volatile, shippers and carriers ultimately have a shared

goal of minimizing costs and maximizing service levels (C.H. Robinson, 2017). Ghost freight is a

phenomenon that may contribute negatively to this process of optimizing business outcomes, yet no prior

literature analyzes this intuition. This paper fills that gap and adds to the existing body of work that

provides insights into the factors that contribute to issues and weaknesses in truckload routing guides.

 14
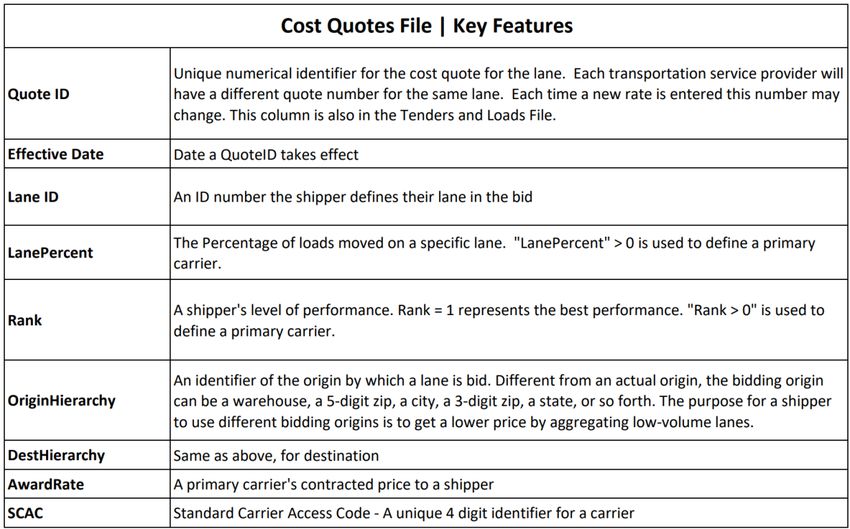
3. DATA SUMMARY AND PREPARATION

3.1 Data Summary

 The data used for this research represent both “moments” of truckload transportation. First, the

outcome of the strategic RFP: the contracts between shippers and carriers along with the associated prices

for each lane. Second, the load tendering process representing carrier load acceptance and rejection

decisions followed by a record of the final outcome of each load. The RFP data spans a timeframe of

September 1, 2012 to September 1, 2020 and the tendering data spans September 1, 2016, through

September 1, 2020. Altogether, the data consists of over 7,500 awarded carriers, 80 shippers, and 3.8

million distinct freight loads. This is a large and broad dataset as compared to similar research in recent

years. A more precise summary of the dataset is found in Table 1.

 Table 1: Full Dataset Summary

The data is separated into three files: Cost Quotes, Tenders, and Loads. Each represents a different phase

of the truckload procurement and execution process. The Cost Quotes file provides information as to

when shippers awarded specific lanes to carriers along with the associated cost. This file can be thought

of as the output of RFPs, which was then input into shippers’ routing guides. The Tenders file represents

 15
the next step in the procurement process, where loads are tendered to carriers within a shipper’s routing

guide and are subsequently either accepted or rejected. Finally, the Loads file records the final outcome

(e.g., accepted by a primary carrier, accepted by a backup carrier, or accepted on the spot market) of all

of the 3.8+ million loads within the dataset. A subset of key data features and their associated

relationships between the three files is shown in Table 2.

 16
Table 2: Data File and Key Feature Summaries

Not all accepted and materialized loads in the Loads file are associated with contracts in the Cost Quotes

file. Such materialized loads do not have an associated Quote ID (an ID number associated with a formal

bid for a freight lane). These are unplanned loads, as they were not part of an RFP. On the other hand,

shippers sometimes award lanes and obtain an associated Quote ID, yet never actually tender freight on

those lanes or to those carriers. These are ghost lanes. Both unplanned and ghost freight reflect the earlier

stated fact that truckload contracts are not binding in capacity or volume.

3.2 Shipper Procurement Tendencies

 Prior to analyzing unplanned and ghost freight, we identify and visualize several distinct strategies

shippers use to procure truckload transportation. This strategic-level data is found in the Cost Quotes file

by analyzing the number of distinct lanes a given shipper awards on a daily basis over the timeframe of

the data. Querying the distinct number of lanes a shipper awards each day provides a visualization of the

shipper’s procurement rhythm, seen for Shipper #4 in Figure 3. The x-axis is the timeframe of the dataset

and each bar represents the number of lanes the shipper awarded, effective on the indicated calendar

day. We identify a main-bid event as the tallest spike of bidding activity each year (see Figure 3) coupled

with all bidding activity afterwards from a range of seven days to up to 1-2 months after the spike. The

process of selecting a date range is a discretionary one determined by each individual shipper’s activity

 17
profile. The date range of each shipper’s annual main-bid event was approved by our advisors and project

sponsor.

 Figure 3: Shipper #4 Annual Lane Procurement

 Shipper #4 (a packaging company) appears to follow a procurement strategy of concentrating the

bulk of their annual procurement activity in one month per year, as visualized in Figure 3. The spikes in

the number of newly awarded lanes represent an annual main bid event because these spikes occur at

regular annual intervals. This is the most common practice we observed across shippers. The smaller

spikes seen in other months are referred to as mini-bids and tend to occur at varying frequencies among

shippers. Though less common, there are other distinct procurement strategies utilized by some shippers.

 18
One such strategy is when shippers conduct procurements on a quarterly basis. An example of this

approach is displayed in Figure 4. Another strategy is when shippers conduct procurement events

continuously throughout a given year, as opposed to concentrating RFP activity at one or a few points

throughout the year. An example of a shipper utilizing a continuous procurement strategy is shown in

Figure 5. Since the annual main-bid strategy is the most common approach and is considered to be the

default strategy in the truckload industry, our analysis in Sections 4 and 5 focuses solely on the 15 shippers

from the dataset that utilize an annual main-bid strategy.

 Figure 4: Shipper #17 Quarterly Lane Procurement

 19
Figure 5: Shipper #16 Continuous Lane Procurement

3.3 Procurement Profiles

 Visualizing an annual procurement strategy identifies main bid events (tall spikes, typically an

annual RFP) and mini-bids (small spikes), as illustrated in Figure 6. All lanes within those respective bidding

events are flagged as associated with a main bid (per year), mini-bid, or entirely unplanned (i.e. one on

which loads materialize but were never part of a bid). We plot the number of loads that materialize on

these flagged lanes with the month the load was tendered on the x-axis and the number of loads on the

y-axis (see Figure 6). The average sequence number over time is displayed in addition to monthly load

data. An average sequence number closer to zero indicates more loads are accepted by primary carriers.

Sequence numbers increase as loads are rejected by carriers. An example of the output of this exercise is

displayed in Figure 6, again for Shipper #4.

 20
Figure 6: Shipper #4 Procurement Profile

 Loads on fully unplanned lanes (ones which were not part of an RFP) are identified at the top in

orange, loads from mini-bid lanes are identified throughout in red, and loads from main-bid lanes are

identified in a color associated with each annual main event. The average sequence number is shown as

a continuous blue line throughout the timeframe. This visualization enables quick analysis of bid timing

and the impact of overall market forces. For this shipper, we see a spike in tender rejections in 2017

followed by a spike in mini-bids in 2019. This may have happened as a result of shippers issuing new mini-

bid RFPs in an effort to obtain better acceptance rates. It appears this was the case (see average sequence

number that year), however it also coincided with a softening of the market overall. Although this broad

exercise is not the key topic of this research, it is a useful starting point for future research and is also a

building block to develop insights about the primary focus of this research: ghost lanes.

 21
4. GHOST FREIGHT ANALYSIS

4.1 Ghost Freight Identification

 Ghost freight occurs when a shipper awards a lane to a primary carrier and creates a Quote ID

associated with that lane-carrier-price combination, yet never actually tenders loads to that carrier. The

carrier expected that business, planned and budgeted for it, but never received it. This research

hypothesizes that carriers respond to such shipper behavior by accepting freight at lower rates and

charging higher prices the following year.

 Ghost freight is identified through a data manipulation process that differentiates between full-

ghost lanes, partial-ghost lanes, and materialized lanes. Our research focuses on lanes awarded as part of

an annual main-bid event. A lane is flagged as full ghost when the Quote ID(‘s) (contract) associated with

that lane from a given year’s main-bid see no loads tendered to any of the associated primary carriers for

at least 15 months from the contract effective date. These lanes can be thought of as ones that are actually

out of the shipper’s control because the volume they planned for never materialized. Also, some full ghost

lanes may be new lanes the shipper has not had any volume on in the past.

 The second type of ghost freight, partial ghost lanes, occurs when a shipper awards a lane to

multiple primary carriers during a main-bid event and ultimately tenders to only a subset of those carriers.

Such instances where at least one primary carrier is not tendered any volume are flagged as a partial-

ghost lane for that main-bid event. Partial-ghost lanes indicate a situation in which they selected certain

carriers over others. The shipper is at fault in this situation because they disregarded their planned load

allocation from the annual RFP. Finally, lanes in which the shipper tenders at least one load to all of the

primary carriers within 15 months of the initial award.

 We selected 15 months as our contract timeframe because freight quotes tend to be valid for a

few months more than a year due to RFP processing times. With the support of our sponsor, 15 months

 22
was selected as a sweet spot that accounts for these routine delays. The above process is then applied to

aggregate the number of full-ghost lanes, partial-ghost lanes, and fully materialized lanes during each

main-bid event for all of the shippers in the dataset which utilize an annual main-bid event strategy. This

data is then converted to an annual percentage of main-bid event lanes that differentiates between full-

ghost, partial-ghost, and fully materialized. An example of this output, again for Shipper #4, is shown in

Figure 7.

 Figure 7: Shipper #4 Ghost Freight Percentage Per Year

 This visualization provides a snapshot of ghost freight identification and frequency for each main-

bid event. This process is next applied to compare the frequency of ghost freight for all of the shippers we

analyze across the data timeframe.

 23
4.2 Ghost Freight Frequency

 Of the shippers in the full dataset, 15 have sufficient data for a comprehensive analysis across the

full timeframe. Thus, the analysis from this point on will focus on these 15 shippers. Summary statistics

for each of these 15 shippers is found in Appendix A. The data manipulation process is applied to all 15

shippers to calculate the amount of full-ghost, partial-ghost, and fully materialized lanes from each

shipper’s main-bid event from 2015-2019. Then, these figures are converted to percentages of the total

lanes associated with the respective main-bid event. The output shown in Figure 8 is generated by taking

the average of all 15 shippers’ ghost freight rates for each main-bid event.

 Figure 8: Annual Full & Partial Ghost Lane Percentage—All 15 Shippers

 Figure 8 shows that this set of shippers fully ghost 50% or more of their total main-bid events each

year. Further, the average rate across all five years of data is closer to 60% of total lanes. This figure is far

higher than our project sponsor expected. In addition, roughly 10-25% of a typical shipper’s lanes are

 24
partially ghosted in each main-bid event and only 15-25% of total lanes are typically tendered to all

awarded primary carriers associated with a given lane. Ghosting, either full or partial, frequently occurs

at high levels each year when viewed from the perspective of all 15 shippers combined.

 The outlook is less consistent when looking at percentages of full-ghost and partial-ghost from an

individual shipper perspective, year-over-year. Tables 3 and 4 display percentages of partial-ghost and

full-ghost lanes, respectively, for each main-bid event for all 15 shippers. The rates are color-coded on a

temperature scale. Darker blue indicates lower percentages, darker red indicates higher percentages, and

white indicates moderate percentages. Grey-colored observations indicate missing data from that

respective main-bid event. For each shipper-year combination in the tables, the percentage of partial

ghost lanes plus the percentage of full ghost lanes added to its percentage of fully materialized accounts

for 100% of lanes associated with the respective main-bid event.

 Table 3: Annual Partial Ghost Lane Percentage Per Shipper

 25
Table 4: Annual Full Ghost Lane Percentage Per Shipper

 With the exception of Shipper #15, which sees extremely high levels of full-ghost lanes each year

(and therefore low levels of partial and fully materialized lanes), the other 14 shippers have percentages

of full and partial ghost lanes that fluctuate highly year-over-year, as seen in Tables 3 and 4. This lack of

pattern prevents us from drawing any conclusions with respect to shipper industry verticals or market

conditions affecting the levels of ghost freight seen across the data timeframe. The takeaways from these

three visualizations are that (1) full and partial ghost lanes occur consistently at much higher-than-

expected rates (50%+ and ~10-25% each year, respectively) when viewed as an average of all shippers;

and (2) full and partial ghost lane percentages lack any clear patterns when viewed from the individual

shipper perspective, year-over-year.

 26
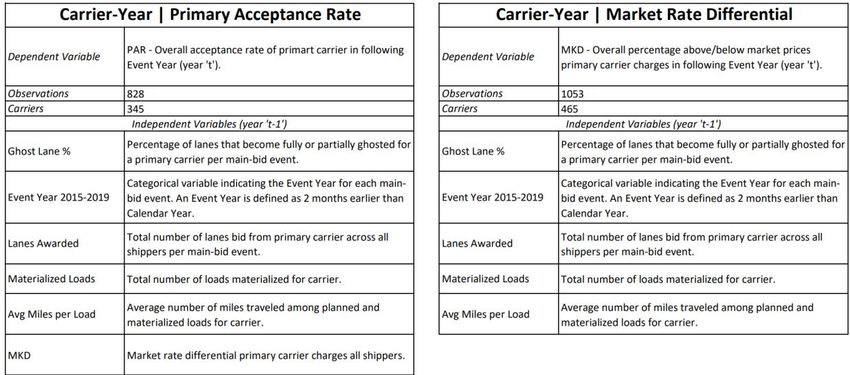
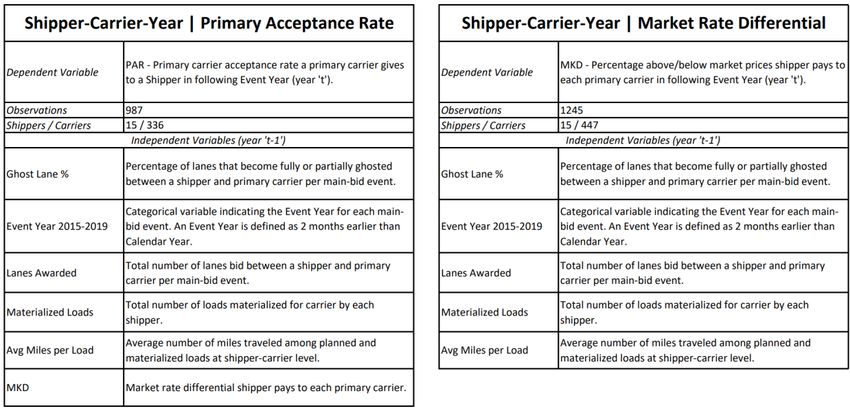
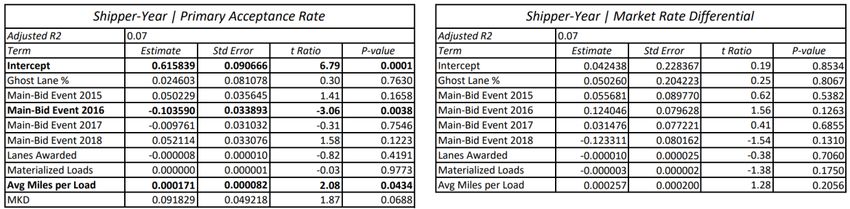
4.3 The Impact of Ghost Freight

 The second hypothesis of this research predicts that higher levels of ghost freight by a shipper

tends to coincide with lower acceptance rates and higher-than-market prices from carriers the next year.

Several Ordinary Least Squares (OLS) regression models are run using JMP software to investigate this

hypothesis. The scope of each model is limited to the main-bid events of the 15 shippers outlined in

Section 4.2. The structure of our models is broken out by three perspectives and two dependent variables,

for a total of six regression models. The three perspectives are Shipper-Year, Shipper-Carrier-Year, and

Carrier-Year, and the dependent variables are Primary Acceptance Rate (PAR – dependent variable for

acceptance rate) and Market Rate Differential (MKD – dependent variable for market prices). The data

used for the Shipper-Year perspective focuses on fully-ghosted lanes. The Shipper-Carrier-Year and

Carrier-Year perspectives include both fully and partially ghosted lanes. This is because full and partial

ghost lanes are the same from a carrier’s perspective. The rate at which they are ghosted in each main-

bid event includes both full and partial ghost lanes from a shipper’s perspective, but there is no distinction

to the carrier.

 PAR is the ratio of loads associated with a main-bid event that are accepted by a primary carrier

(i.e., Sequence Number of 0 in the data) relative to the total number of loads tendered to that carrier by

that shipper. MKD is the percentage above or below benchmark prices a given shippers tends to pay in

linehaul rates throughout a given main-bid event. The process and associated formulas for calculating

benchmark prices and MKD are found in Appendix B. In each model, the dependent variables are

calculated by looking ahead to the following year. For example, for an observation that shows a

percentage of ghost lanes from the 2015 main-bid event, the dependent variable indicates the PAR or

MKD from the following main-bid event. Doing so is essential to predicting whether future acceptance

rates and market prices are influenced by behavior in the past.

 27
The Shipper-Year perspective looks at the impact of ghost freight on acceptance rates and market

prices for all 15 shippers year-over-year. There are 54 observations in this data frame for the 15 shippers

being analyzed (example of an observation: Shipper #1’s main-bid event in 2015). Each observation

contains the following independent variables: (1) percentage of full-ghost lanes; (2) main-bid event year

as a categorical variable; (3) number of lanes bid during the main-bid event; (4) number of materialized

loads from each main-bid event; and (5) average miles traveled for each materialized load. The lanes,

loads, and miles variables are all indicative of the size of each year’s procurement activity. When running

the models in JMP, the software treats 2019 as a reference year and thus removes it from the analysis.

 The Shipper-Carrier-Year and Carrier-Year models have the same structure as Shipper-Year,

however the nature of each variable and the specific question addressed are different due to the shift in

perspective. The carriers included in these models are limited to the primary carriers associated with the

2015-2019 main-bid events of our 15-shipper subset. The number of observations and carriers

represented in each model are identified in Tables 5-7. The percentage of ghost lanes in these models

includes partial ghost lanes along with fully ghosted lanes, since these are one and the same from the

carrier’s perspective. A summary of all six models is shown in Tables 5-7.

 28
Table 5: Shipper-Year Regression Model Summaries

Table 6: Shipper-Carrier-Year Regression Model Summaries

 29
Table 7: Carrier-Year Regression Model Summaries

4.3.1 Regression Results

 Tables 8-10 display the output of each regression model. The adjusted R-squared values indicate

the fit of each model, the P-values indicate whether each independent variable is statistically significant,

and the estimates indicate the magnitude and direction of the relationship between each independent

variable and the dependent variable.

 Table 8: Shipper-Year Regression Results

 30
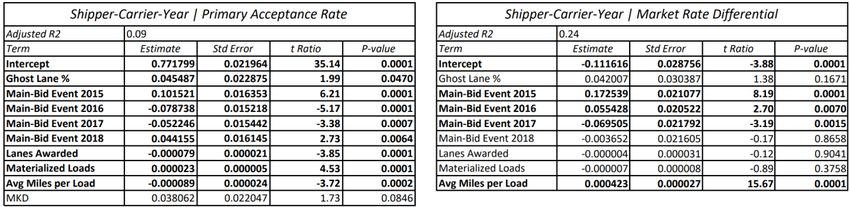
Table 9: Shipper-Carrier-Year Regression Results

 Table 10: Carrier-Year Regression Results

 The results of all six models are similar and indicate a universal conclusion from both the shipper’s

and carrier’s perspective. All of the R-squared values are far lower than what is commonly considered

significant for truckload industry regression models. Most variables are not statistically significant enough

to draw any conclusions. On the Shipper-Year models, however, there appears to be a positive correlation

between rates of ghost lanes and both PAR and MKD. Higher market prices in response to more ghost

lanes aligns with our hypothesis, yet the positive correlation with PAR is the opposite of what we expect.

That being said, the lack of fit in the overall model prevents any network-wide conclusions from being

drawn. This finding is instead treated as an outlier. The overall lack of correlation, especially with the

percentage of ghost lanes in each main-bid event, leads us to reject the hypothesis that carriers accept

less freight and charge higher-than-market prices in response to being ghosted at higher rates.

 31
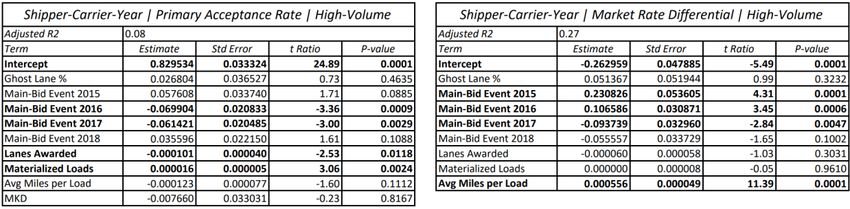
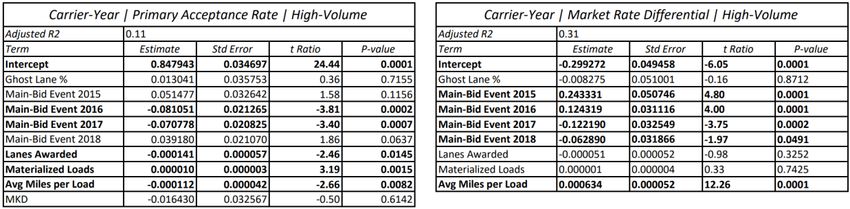
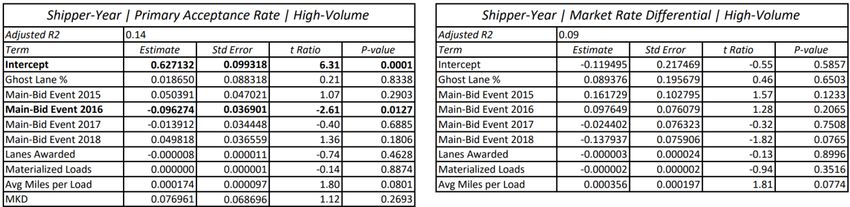
The same regression models are generated again in Tables 11-13, however the data underlying

these models only include high-volume lanes. Specifically, only lanes with 52 or more loads materialized

per main-bid event are considered for these models. Since high-volume lanes are more important to

capacity planning, we predict that these will display more authoritative results in favor of our second

hypothesis. Ultimately, though, the results held with the findings above, which take all lanes into

consideration (see Tables 11-13). This may be caused by the fact that most ghost lanes (especially full

ghost) occur on low-volume lanes, as shown in Section 5.3. Overall, the results of all the regression models

indicate shippers are not facing repercussions from carriers as a result of higher ghosting activity.

 Table 11: Shipper-Year Regression Results (High-Volume Lanes)

 Table 12: Shipper-Carrier-Year Regression Results (High-Volume Lanes)

 32
Table 13: Carrier-Year Regression Results (High-Volume Lanes)

 33
5. GHOST FREIGHT FROM A NETWORK PERSPECTIVE

5.1 Network Characterization

 The truckload network is made up of a multitude of lanes defined at different geographical

hierarchies. A Warehouse-to-Warehouse lane is considered the most specific type of route, whereas a

broader Region-to-Region lane is on the opposite end of this spectrum. Many combinations of these lane

hierarchies exist in the data, and each origin and destination is number-coded (e.g., 20 = Warehouse, 60

= City, etc.). Many, though not all, Lane IDs within the data are accompanied by Origin and Destination

(O&D) features that are utilized to determine which network hierarchy they belong to. Some

Origin/Destination pairs do not exist in the data. Also, not all shippers bid at every network hierarchy in a

given year.

 By querying the Lane IDs that have O&D data, we are able to calculate the percentage of lanes

associated with each of the five hierarchies that become full ghost lanes during each year’s main-bid event

for a given shipper. The proportion of awarded lanes and tendered loads on each hierarchy is queried as

well to provide context as to how much transactional activity occurs within each area. An output of this

process for Shipper #4 is shown in Figure 9. For this particular shipper, a very high amount of ghosting is

happening at more specifically defined lanes, such as City-to-City and Warehouse-to-Warehouse. Also,

the vast majority of awarded lanes and tendered load volume occurs at the City-to-City level. For this

particular shipper, the intuition that hierarchies such as City-to-City would account for most of a year’s

volume is affirmed. However, the hypothesis that those hierarchies would see lower rates of ghosting

does not hold.

 34
Full Ghost %
Origin/Destination D 20 (Warehouse) D 40 (5 Digit Zip) D 60 (City & State) D 80 (3 Digit Zip) D 100 (State)
O 20 (Warehouse) 92.3% 94.1% 28.1% 21.4%
O 40 (5 Digit Zip) 100.0% 96.4%
O 60 (City & State) 48.0% 98.7% 44.3% 24.2% 75.0%
O 130 (Country) 0.0%

 Lane %
Origin/Destination D 20 (Warehouse) D 40 (5 Digit Zip) D 60 (City & State) D 80 (3 Digit Zip) D 100 (State)
O 20 (Warehouse) 0.5% 1.4% 5.6% 0.6%
O 40 (5 Digit Zip) 0.1% 4.6%
O 60 (City & State) 4.1% 3.3% 75.5% 4.0% 0.2%
O 130 (Country) 0.0%

 Tender Load %
Origin/Destination D 20 (Warehouse) D 40 (5 Digit Zip) D 60 (City & State) D 80 (3 Digit Zip) D 100 (State)
O 20 (Warehouse) 0.0% 0.0% 7.5% 1.1%
O 40 (5 Digit Zip) 0.0%
O 60 (City & State) 2.2% 0.0% 86.8% 2.4% 0.0%
O 130 (Country) 0.0%

 Figure 9: Shipper #4 Ghost Lane Percentage By Lane Hierarchy (All Hierarchies)

 To simplify our network characterization, we consolidated the network hierarchies into five

categories: Point-to-Point, City-to-City, Point-to-Zone, Zone-to-Point, and Zone-to-Zone. Figure 10

displays the same information as Figure 9, however the hierarchies have been consolidated into a

simplified matrix. Later in this section, the same process is conducted at the network level, meaning that

the percentages of full ghost lanes, total lanes, and total volume identified in each hierarchy are

aggregations of all shippers that utilize a main-bid event strategy for that given year, as opposed to

conducting the analysis shipper-by-shipper. This information is calculated using an averages of averages,

which is why the respective sections do not add up to 100%. The output shows how much activity is being

conducted on average at each hierarchy along with the amount of ghosting that happens within those

hierarchies. In addition, the percentage of full ghost lanes for each shipper each year is calculated using a

weighted average based on annual load volume. Each of the load volume weighted averages are displayed

in Figure 11.

 35
Shipper 4 Ghost % Shipper 4 Lane % Shipper 4 Volume %
 O/D Pt C Z O/D Pt C Z O/D Pt C Z

 Pt 91% Pt 2% Pt 3%
 4 0 %
 12% 9 2 %
 6% 9 5 %
 5%
 C 40% C 92% C 95%

 Z 0% 0% Z 2% 0% Z 3% 0%

 Figure 10: Shipper #4 Full Ghost Lane Percentage By Lane Hierarchy (Consolidated)

 Shipper Volume %
 Shipper/Year Main_2015 Main_2016 Main_2017 Main_2018 Main_2019
 1 10.6% 10.6% 9.0% 8.8% 6.2%
 2 0.0% 0.7% 0.8% 0.6% 0.5%
 3 2.4% 1.8% 1.6% 1.4% 1.6%
 4 11.7% 11.0% 11.3% 11.2% 10.9%
 5 1.2% 3.1% 3.4% 3.4% 4.0%
 6 35.6% 34.6% 32.2% 31.0% 30.6%
 7 19.7% 20.3% 17.7% 17.7% 21.2%
 8 0.6% 0.6% 0.8% 0.9% 0.9%
 9 4.7% 6.2% 9.3% 9.4% 10.2%
 10 6.8% 4.8% 3.4% 3.2% 3.2%
 11 1.8% 1.6% 2.5% 2.4% 2.4%
 12 0.0% 0.0% 3.2% 4.2% 2.6%
 13 0.0% 0.1% 1.0% 2.0% 2.0%
 14 4.3% 3.5% 3.3% 3.5% 3.4%
 15 0.6% 1.1% 0.5% 0.3% 0.2%
 Total Volume 100% 100% 100% 100% 100%

 Figure 11: Annual Volume Weighted Averages (All 15 Shippers)

5.2 Network Hierarchy Analysis

 Figures 12-16 display the output from the Figure 10 visualization across all 15 shippers, broken

out by main-bid event each year. Annual percentages of full ghost lanes, total lanes, and load volume are

broken out by the five network hierarchies defined earlier. These outputs indicate mixed results with

respect to ghosting trends at the network level. We hypothesized that rates of ghost freight would be

lower on more specific types of lanes, particularly at the City-to-City level. This hypothesis was chosen

because those hierarchies tend to represent the most volume in a given year. Further, based on industry

 36
knowledge provided by our project sponsor, we hypothesized that ghosting is concentrated on low-

volume lanes. Therefore, we logically suspect ghosting will be less common within traditionally higher-

volume hierarchies.

 The outputs in Figures 12-16 confirm the vast majority of awarded lanes and tendered load

volume occur within the Point-to-Point and, particularly, City-to-City hierarchies. The levels of ghosting in

each lack any distinct year-over-year pattern, as displayed by the fluctuating heat-map color code.

Although it cannot be concluded that a particular hierarchy tends to be low or high ghost, the levels of

ghosting within the Point-to-Point and City-to-City hierarchies contain consistently high levels of ghosting

(often around or above 50% per year). This leads us to reject the hypothesis that those hierarchies would

be distinctly low-ghost. That said, the results shown next in Section 5.3 confirm that most ghost lanes

(especially full ghost) occur on low-volume lanes. Logically, this leads us to believe that there are small

percentages of very high-volume lanes on the specific hierarchies along with many low-volume ghost

lanes in a given year.

 2015 Ghost % 2015 Lane % 2015 Volume %
 O/D Pt C Z O/D Pt C Z O/D Pt C Z

 Pt 62% Pt 36% Pt 37%
 5 3 %
 10% 4 4 %
 8% 4 3 %
 6%
 C 53% C 44% C 43%

 Z 66% n/a Z 0% n/a Z 1% n/a

 Figure 12: Network Ghost Freight Trends – 2015

 37
You can also read