2020 Freight Rate Survey - Owner-Operator Independent Drivers Association Foundation - Owner-Operator Independent ...
←
→
Page content transcription
If your browser does not render page correctly, please read the page content below

2017 Freight Rate Survey   0

                                   2020 Freight
                                   Rate Survey

Owner-Operator Independent Drivers Association Foundation

                                                                        02/19/21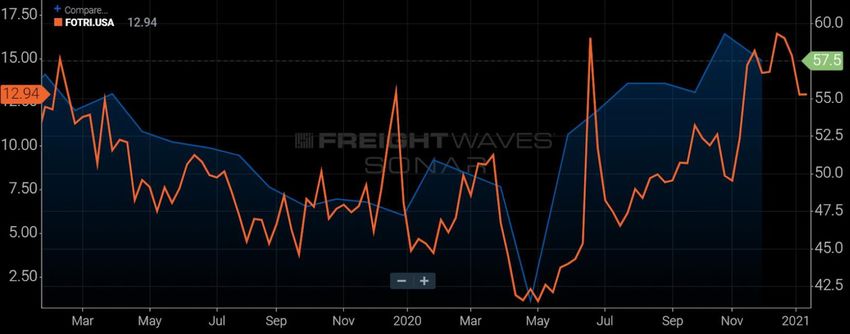
2020 Freight Rate Survey

        February 2021

      OOIDA Foundation, Inc.
          One OOIDA Dr.
      Grain Valley, MO 64029
    FoundationDept@ooida.com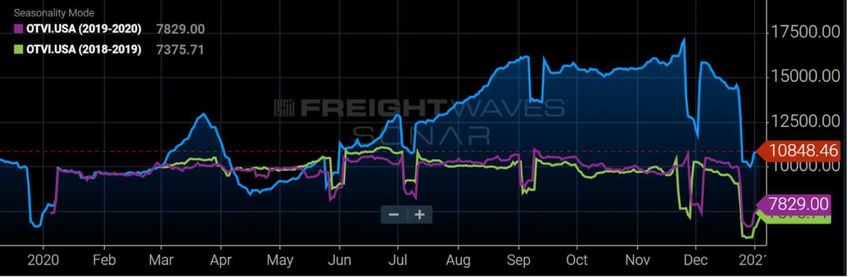
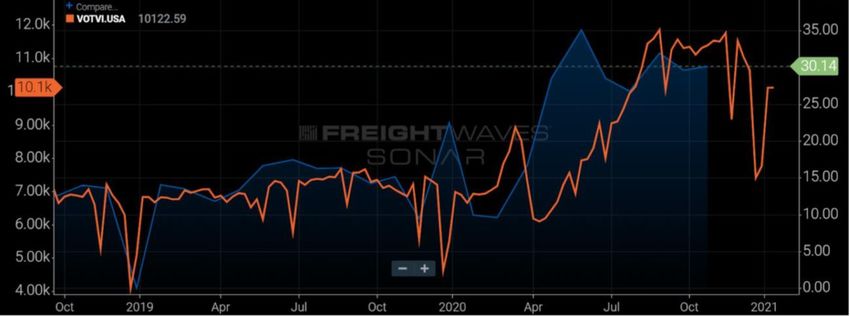
Table of Contents
Introduction .................................................................................................................................................. 6

Looking Back at 2020 .................................................................................................................................... 7

Analysis of the Freight Rate Survey ............................................................................................................ 15

   Conclusions and Economic Outlook ........................................................................................................ 23
List of Figures
Figure 1: JOC Truckload Capacity Index ........................................................................................................ 8
Figure 2: Weekly Initial Jobless Claims, 2020 ................................................................................................ 9
Figure 3: ISM Purchasing Managers Index, 2020.......................................................................................... 9
Figure 4: Industrial Production Index .......................................................................................................... 10
Figure 5: Retail Sales YoY Change, (Electronic Shopping and Mail-Order Houses), 2020 ........................... 11
Figure 6:Total Business Inventory/Sales Ratio, 2020 .................................................................................. 11
Figure 7: Outbound Tender Volume Index, 2018-2020 ............................................................................... 11
Figure 8: Van and Reefer Outbound Tender Reject Index, 2020 ................................................................. 12
Figure 9: Truckstop.com Van, Reefer, and Flatbed Freight Rates, 2020 ..................................................... 12
Figure 10: New For-Hire Trucking Companies............................................................................................. 13
Figure 11: Operation by Region .................................................................................................................. 16
Figure 12: Non-seasonally Adjusted Truck Transportation Employment (000s) ......................................... 24
Figure 13:ACT Research Class 8 Equipment Orders .................................................................................... 24

List of Graphs
Graph 1: Type of Operation ........................................................................................................................ 15
Graph 2: Compensation per mile, 2015-2020 ............................................................................................. 17
Graph 3: When were freight rates at their peak? ....................................................................................... 18
Graph 4: Comparison of Pay Per Mile between those who do and do not know their Cost of Operations 19
Graph 5: Comparison of Pay Per Mile by those who attempt to Negotiate their Rates ............................. 20
Graph 6: Loads turned down due to cheap freight, 2018-2019 .................................................................. 21
Graph 7: Freight Market Outlook................................................................................................................ 21
Graph 8: Negotiating Rates and Fuel Surcharge......................................................................................... 22
Graph 9: Rates are, 2013-2020 ................................................................................................................... 26
Graph 10: Prospects for Next Year, 2016-2020........................................................................................... 26

List of Tables
Table 1: Year-over-Year (YOY) Performance of Key Trucking Metrics......................................................... 13
Table 2: Accuracy of DAT Trendlines ........................................................................................................... 23
2020 Freight Rate Survey        6

Introduction
The Owner-Operator Independent Drivers Association Foundation, Inc. (OOFI) was established in 1991 as
a 501(c)(3) non-profit with a mission to conduct research to fight for the rights of all truck drivers through
education. This research includes both economic and safety issues that especially affect small business
owners and professional truck drivers. According to the Federal Motor Carrier Safety Administration
(FMCSA), 85 percent of all fleets operate six trucks or less and approximately 95 percent have fewer than
twenty trucks.1 Single-truck motor carriers represent nearly half of all active motor carriers operating in
the United States today.

Since 1998, OOFI has performed yearly surveys of its membership not only to understand the profile and
demographics of its members, but also to document the holistic changes that are occurring within the
trucking industry, including freight rates. Information concerning the current state of the freight market
is vital in order to help professional truck drivers and small business owners-operators run a successful
business. The freight rate data not only provides important information for the Owner-Operator
Independent Drivers Association (OOIDA or Association), but it also helps give a clearer and more time
sensitive image of the present-day freight market in order to equip OOIDA members with the right
information to make good business decisions.

In 2010, OOFI conducted the first freight rate survey of the Association’s membership. The purpose of
the survey was to gather valuable information and knowledge of OOIDA’s members, who are the
professional truckers who truly represent the long haul truckload industry and move our nation’s
economy, and to examine the data in order to better understand today’s freight market. This is the ninth
edition of the Freight Rate Survey, or “Survey,” which is conducted annually.

1
    Source: Motor Carrier Management Information System Database December 2020

Owner-Operator Independent Drivers Association Foundation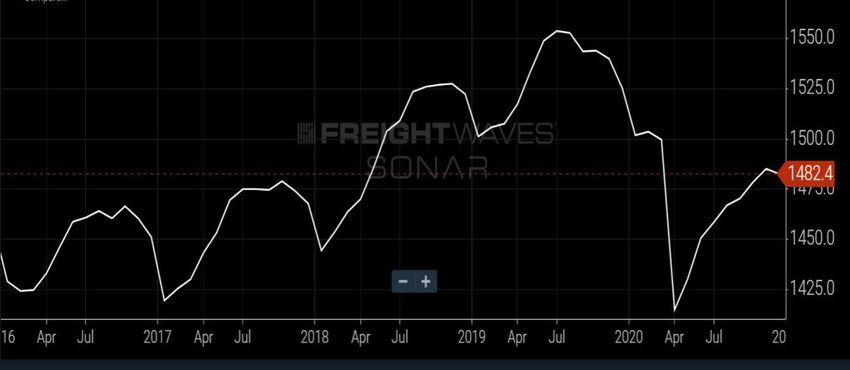
7 2020 Freight Rate Survey
Looking Back at 2020
In many ways, the trucking industry is the lifeblood of the nation as it not only employs approximately 3.9
million commercial driver’s license holders, but it is also responsible for delivering 70 percent of all freight
worth $11.5 trillion2 while collecting $791.7 billion in gross revenue.3 For obvious reasons, trucking is
vital to the overall economic health of the United States, and thus serves as a barometer for the current
state of the economy. When the freight market experiences higher freight volumes and strong rates, this
typically indicates a healthy economy, along with sturdy consumer confidence levels, housing and
construction starts, oil prices, industrial production, and manufacturing output.
The trucking industry in general however is always in flux and often difficult to predict as it faces numerous
government regulations and mixed economic growth. The 2020 freight market was no different as the
excess capacity which plagued the industry during the later portion of 2018 and most of 2019 continued
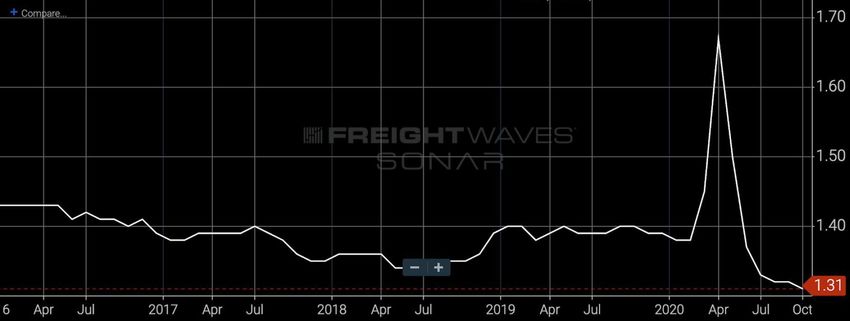
to keep truckload rates low at the start of 2020 as indicated in Figure 1. While there was some optimism
for a gradual increase in rates by the second quarter due to the United States-Mexico-Canada Agreement
(USMCA), the phase one trade agreement between the U.S. and China, and a potential recovery for the
U.S. manufacturing sector after a months-long slump, 2020 began with much uncertainty.
Susquehanna Financial Group released a report in early January 2020 predicting that dry van spot rates
would decline through the first quarter before increasing later in the spring. The report concluded, “Most
carriers expect a slow bleed of this extra capacity as we move through 1H20 [the first half of 2020] aided
by depressed rates, increasing insurance costs and new regulations that are expected to limit supply.4”
Paul Bingham, the director of transportation consulting in the Economics and Country Risk unit of IHS
Markit, expected that 2020 “may not be a boom year, but it could still be a better one [than 2019].5” Few
could have anticipated the global pandemic which would shape most, if not all, of 2020.
On December 31, 2019, the world received first news of the virus that would eventually be called COVID-
19 after Chinese health officials informed the World Health Organization (WHO) of 41 patients who had
been diagnosed with a “mysterious pneumonia.” Chinese media reported its first death two weeks later,
while the CDC confirmed the first case of the Coronavirus in the U.S. on January 20, 2020. On March 11,
the WHO declared the virus a pandemic.6 Nevertheless, COVID-19 was already starting to impact trucking
even before it became a global pandemic as China quickly shuttered its manufacturing in an attempt to
curb the virus, which began to negatively impact imports and thereby outbound tender volumes and
trucking rates in the first two months.
2
Bureau of Transportation Statistics, Transportation Statistics Annual Report 2020, Department of Transportation
(2020) pg. 4-3
3
“Trucking Moved 11.84 Billion Tons of Freight in 2019,” American Trucking Association (July 13, 2020),
https://www.trucking.org/news-insights/trucking-moved-1184-billion-tons-freight-2019
4
John Kingston, “Trucking rates may be moving toward a ‘melt-up’: Majors,” FreightWaves (January 15, 2020).
5
William B. Cassidy, “US manufacturing upturn may boost spring freight volumes, truck rates,” Journal of Commerce
(Jan 22, 2020).
6
Bryson, Derrick. (March 27, 2020). A Timeline of the Coronavirus Pandemic. Retrieved from
https://www.nytimes.com/article/coronavirus-timeline.html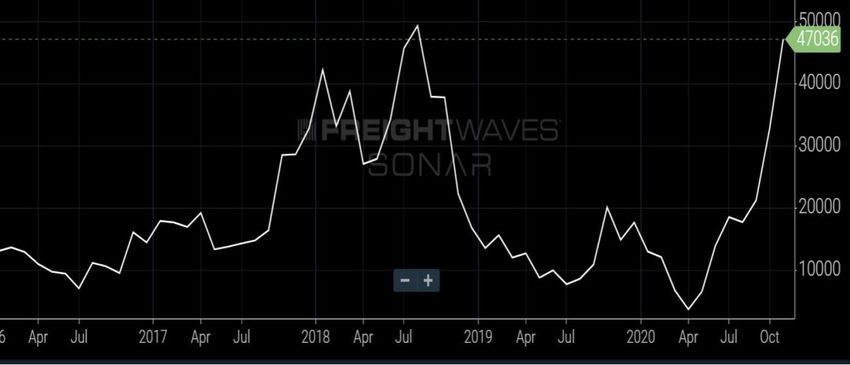
Figure 1: JOC Truckload Capacity Index7

Shippers however were warned in early March to begin preparing for a potential trucking rate shock, but
few could have expected the tremor that would occur. Jeff Tucker, CEO of freight brokerage Tucker
Company Worldwide, predicted in an interview with The Journal of Commerce, “A shock wave is going to
be felt across the country in trucking…shippers better brace for the worst.” He forewarned that once
China reestablished its supply chains and began moving freight through U.S. ports it would “be like the
2018 market all over again when the freight starts flooding back in, folks are going to charge an arm and
a leg, and that will have a ripple effect that doesn’t go away in a quarter. It’s going from one extreme to
another.8”

President Donald Trump declared a national emergency on March 13, 2020 with most states following
suit. In the wake of these declarations, many non-essential businesses, and thereby the overall economy
in many respects, were forced to close their doors and all public gatherings of more than ten people were
banned, greatly impacting the various service and good industries, especially restaurants and industrial

7
  The TCI represents change in tractor count at a group of companies fielding more than 23,000 tractor-trailers, and
is meant to capture and measure changes in capacity at large contract carriers, and may not reflect trends at mid-
sized companies and smaller truckload fleets, which in many respects are a different operational segment of the
overall trucking market.
8
  William B. Cassidy, “Coronavirus blurs trucking’s 2020 vision,” Journal of Commerce (March 5, 2020).
9       2020 Freight Rate Survey

    production.9 Freight volumes plummeted, pushing rates to all-time lows as carriers competed over limited
    loads. Although most of the country shuttered its doors, causing unemployment to rise exponentially,
    truck drivers continued to haul essential goods to homes, grocery stores, and hospitals across the nation.

    The following figures were generated using SONAR, an analytics platform which collects data from
    hundreds of different indices, such as CASS, Freightos Baltic Index, Institute of Supply Management
    Metrics, Logistics Managers’ Index, etc., to provide a comprehensive view of the freight market and how
    it was impacted by COVID-19. Figure 2 demonstrates that weekly initial jobless claims spiked in late March
    and in early April due to the shutdowns, which effectively limited manufacturing (Figure 3) and industrial
    production (Figure 4), as well as consumer spending, driving down volumes, rejection rates, and trucking
    rates.

    Figure 3 depicts the Institute for Supply Management’s (ISM) Purchasing Managers Index (PMI) which is
    a diffusion index that summarizes economic activity in the manufacturing sector. A PMI over 50
    characterizes overall expansion of the manufacturing economy where as a PMI under 50 represents a
    contraction. Figure 4 shows the Federal Reserves’ Industrial Production Index (IPI) which measures real
    output in the manufacturing, mining, electric, and gas industries. Industrial production is perhaps the
    largest single contributor to domestic surface freight movements in the economy and thereby trucking,
    of which manufacturing makes up approximately 75 percent. Hence industrial output, as measured by
    the IPI, serves as a starting point for most of the goods that end up flowing through various supply chains
    to the end consumer.10

                                     Figure 2: Weekly Initial Jobless Claims, 2020

    SONAR: Weekly Initial Jobless Claims (blue line)

                                   Figure 3: ISM Purchasing Managers Index, 2020

    9
       Mark Schremmer, “A coronavirus timeline: How we got here,” Land Line Magazine (April 1, 2020),
    https://landline.media/a-coronavirus-timeline-how-we-got-here/
    10
       https://knowledge.freightwaves.com/industrial-production-ipro-iprog/
SONAR: ISM Purchasing Managers Index (blue line), Flatbed Outbound Tender Rejection Index (orange line)
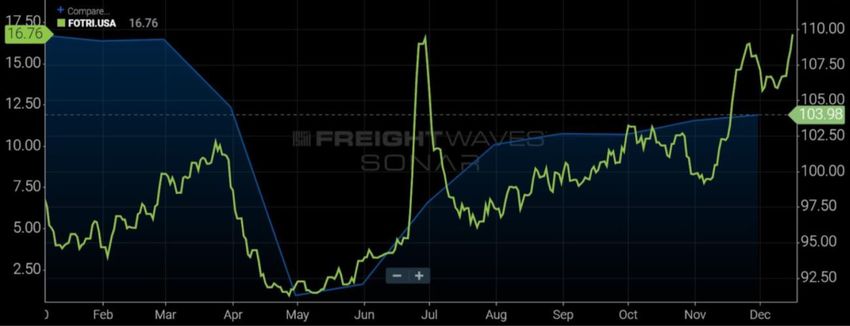
Figure 4: Industrial Production Index
SONAR: Industrial Production Index (blue line), Flatbed Outbound Tender Rejection Index (green line)
Each of these individual factors impacted one another with unemployment reaching a pandemic high of
14.7% in April, the worst since the Great Depression. Some owner-operators experienced freight rates
below a dollar during the onset of the pandemic. However, the figures presented above also display a
sharp V-shaped recovery following the first round of stimulus checks, increased jobless claims benefits,
and federal loans administered through the Paycheck Protection Program and the Economic Injury
Disaster Loan program, which combined to inspire consumer confidence and spending. Demand for goods
rose steeply and so did trucking rates throughout the second half of 2020.
Consumer spending traditionally comprises 70 percent of the overall economy. Of that, two thirds
typically derive from services while the remaining one third results from goods. In 2020 however, the
traditional split moved closer toward 60/40, with goods (the items which truckers transport) accounting11 2020 Freight Rate Survey
for 40 cents of every dollar of consumer spending.11 This was particularly manifested in ecommerce,
shown in Figure 5, which exploded as Americans were unable to travel or shop in brick-and-mortar stores.
In response, shippers sought to pull their freight forward in order to both meet demand and mitigate their
depleting inventories (Figure 6), which pushed freight volumes to all-time highs (Figure 7) and challenged
trucking capacity. Large motor carriers were forced to reject more than a fourth of their tendered loads
(Figure 8), which shifted freight toward the spot market and increased rates after the trough earlier in the
year (Figure 9).
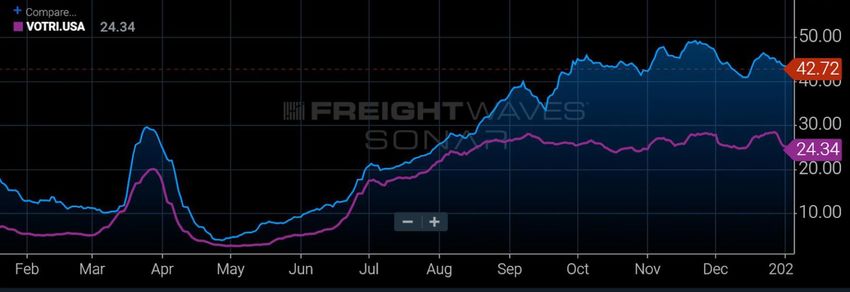
Figure 5: Retail Sales YoY Change, (Electronic Shopping and Mail-Order Houses), 2020
SONAR: Retail Sales Electronic and Mail-Orders (blue line), Van Outbound Tender Rejection Index (orange line)
Figure 6:Total Business Inventory/Sales Ratio, 2020
SONAR: Total Business Inventory/Sales Raito (white line)
Figure 7: Outbound Tender Volume Index, 2018-2020
11
2021 Freight Forecast, FreightWaves FreightIntel Research (January 2021).SONAR: Outbound Tender Volumes 2020 (blue line), 2019 (purple line), 2018 (green line)
Figure 8: Van and Reefer Outbound Tender Reject Index, 2020
SONAR: Van Outbound Tender Reject Index (purple line), Reefer Outbound Tender Reject Index (blue line)
Figure 9: Truckstop.com Van, Reefer, and Flatbed Freight Rates, 2020
SONAR: Truckstop.com 7 Day Van Rate Per Mile (blue line), Truckstop.com 7 Reefer Rate Per Mile (purple line),
Truckstop.com 7 Day Flatbed Rate Per Mile (green line)13 2020 Freight Rate Survey
The above figures illustrate that the year 2020 experienced both extreme lows and highs due to the COVID-19
pandemic, which greatly impacted owner-operators and professional drivers who witnessed acute fluctuations in
rates over the course of the year. According to DAT Trendlines, spot rates for dry vans, refrigerated trailers, and
flatbeds hit bottom around April and May. The lowest average monthly spot rate was $1.60 for dry vans, $1.93 for
reefers, and $1.91 for flatbeds. Conversely, the spot rates shifted gears starting in June, reaching year highs in
November and December. The highest average monthly spot rate was $2.46 for vans, $2.70 for reefers, and $2.48
for flatbeds. Table 1 also depicts the volatility of the freight market through three key trucking metrics, tendered
load volumes, tender rejection rates, and Truckstop.com spot rates.
Table 1: Year-over-Year (YOY) Performance of Key Trucking Metrics
Metric Q1 Q2 Q3 Q4
Tendered Load Volumes YoY 6.42% 2.91% 39.31% 55.02%
Tender Rejection Rate YoY 13.5% 26.0% 371% 278%
Truckstop.com Spot Rates YoY -1.4% -12.9% 28.8% 29.4%
Source: SONAR
These dynamics combined to help make 2020 a boon year for trucking, especially for owner-operators. In
fact, OOIDA filed a record number of new authorities on behalf of its’ membership. Interestingly, this
trend began at the start of the pandemic in March 2020. When OOFI asked those members who were
seeking to become owner-operators under their own authority why they were doing so at this time, 74
percent stated that they wanted to because they desired to be their own boss. However, this trend gained
even more momentum in the second half of the year with FMCSA granting nearly 58,000 common
authorities in 2020 overall, a 36 percent increase from 2019.12 The movement to become an owner-
operator was not just sparked by those seeking to become their own boss, but by those company drivers
hoping for a more successful and profitable career as an owner-operator in a time when spot rates were
rising too meet increasing demand.
Figure 10: New For-Hire Trucking Companies
Source: FTR analysis of FMCSA data
12
Avery Vise, “New Entries in Trucking Surged in 2020,” Heavy Duty Trucking (Feb 9, 2021).15 2020 Freight Rate Survey
Analysis of the Freight Rate Survey
While most economic and trucking industry analysts focus primarily on large carriers and shippers, as well
as various macro-economic factors as highlighted above, few remember the small owner-operators and
professional drivers. Thus, in order to gauge the current freight market for this unique segment of
trucking, OOFI emailed a thirty-two question survey to 21,000 members who allow for email
communication on November 4, 2020. The Survey generated 425 responses for a started/viewed rate of
51 percent and a 99 percent confidence level with a 6.2 percent margin of error, thus the Survey provides
an essential snapshot of what is occurring within the small carrier population today.
In particular, the survey respondents were comprised almost entirely of owner-operators (88%), with a
small segment of company drivers (8%) and fleet owners (6%). Owner-operators consisted of two distinct
segments, owner-operators under their own authority (44%), which experienced a five-percentage point
increase from 2018, and owner-operators leased-on to a motor carrier (40%), which, for the first time
since OOFI began conducting this survey in 2010, did not represent the largest section of respondents. A
majority of members indicated that they are truckload carriers (77%) regardless of the type of equipment
or freight they haul. It is interesting to note that those pulling hazmat (63%) and oversize loads (64%)
were more likely to be a leased on owner-operator than most other types of operation, perhaps due to
higher insurance and equipment costs related to these freight types.
Graph 1: Type of Operation
Fleet owner Retired
6% 1%
Other
Company driver 0%
8%
Owner-operator (own
authority)
45%
Owner-operator
(leased to motor
carrier)
40%
Consistent with other surveys of OOIDA members, OOFI found that dry vans, flatbeds, and refrigerated
trailers, or reefers, were the three most common types of trailers members pull. General food products
were the most common type of freight regardless of operational type followed by refrigerated freight.
Although most members indicated that they were long haul operators, meaning that their average
distance hauled was over 500 miles, fleet owners (57%) and those pulling hazmat (48%) or buildingmaterials (52%) were principally regional, i.e. operating between 151 and 500 miles. Most members
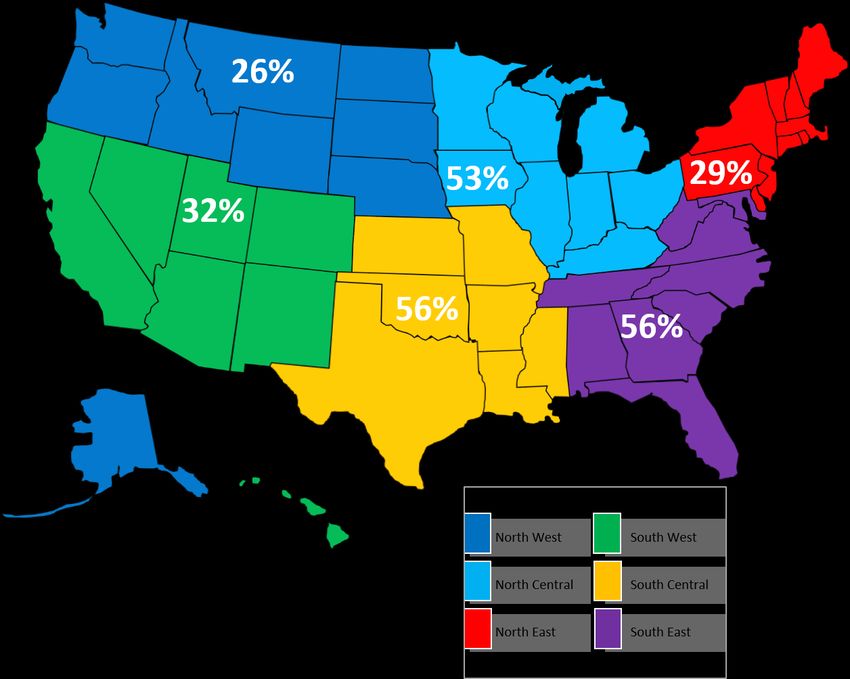
continue to drive in the north central, south central, and south east regions of the United States. However,
those under their own authority tend to operate primarily in the south east, while those leased-on operate
mainly in the south central region.
In terms of compensation, “per trip” and “per mile” pay continue to be the primary methods of payment
for all operational types except for those members who are leased-on. They primarily receive
compensation by the “percentage of the load,” which was also true for those hauling hazmat loads.
Although the methods of compensation were fairly similar across the various operational and equipment
types, the rates were not as leased-on owner-operators received the highest average compensation rate
per trip at $1,937.45, a nearly 22 percent increase from 2019, and fleet owners experienced the highest
average per mile at $2.65, which was a 24 percent increase over last year. Company drivers on the other
hand received the lowest compensation overall at $0.52 per mile, which actually represented a 17 percent
decrease from 2019.
Figure 11: Operation by Region17 2020 Freight Rate Survey
Most of the industry segments that OOFI surveyed experienced an increase in pay per mile year-over year
except for company drivers and those pulling flatbeds, in particular those hauling building materials and
oversize and overweight (OSOW) loads. While general and refrigerated freight saw steep rebounds after
the initial effects of the pandemic in the spring, flatbed freight experienced a much slower recovery as
nonresidential construction spending gradually improved throughout the year. Thus, those pulling
flatbeds witnessed a 12 percent decrease in per mile pay, from $2.33 per mile in 2019 to $2.05 in 2020,
and those hauling building materials and OSOW loads observed a 6 percent and a 55 percent decrease in
pay per mile, respectively. Members overall lost a penny in average per mile pay this year from $1.85 per
mile in 2019 to $1.84 in 2020. However, most of this was due to a decrease in pay per mile for company
drivers. If this segment is filtered from the data, members actually received a 12 percent increase in
compensation per mile, which is in harmony with the rest of the freight market.
Graph 2: Compensation per mile, 2015-2020
$2.00
$1.92
$1.90
$1.85 $1.84
$1.80
$1.71
$1.70
$1.64
$1.60
$1.54
$1.50
2015 2016 2017 2018 2019 2020
Though pay per mile decreased slightly, compensation per trip continued its positive trend, increasing 9
percent from $1,609 in 2019 to $1,756 in 2020, and nearly 16 percent from 2018. The most noteworthy
increases were experienced by fleet owners (32%) and those leased-on (22%), and those pulling dry van
trailers (41%) and OSOW loads (86%).
According to the results of last year’s survey, the majority of members indicated that rates had gone down
over the course of 2019, though this trend actually originated in the second half of 2018. Thus, for almost
a year and half the freight market experienced a contraction in rates. The 2020 survey however saw a
stark reversal as percentage of members who believed rates were going down decreased from 70 percent
in 2019 to 33 percent in 2020. Moreover, the percentage of members who stated rates were increasing
jumped from 4 percent to 28 percent, which was seven times greater than the previous survey. When
asked when freight rates were at their peak, 41percent indicated it was best within the past six months.Graph 3: When were freight rates at their peak?
35%
30%
25%
20%
15%
10%
5%
0%
1 YEAR AGO 6 MONTHS AGO 3 MONTHS AGO RIGHT NOW HAVEN'T SEEN A
CHANGE
The acquisition of loads is vital for both fleet owners and those under their own authority and yet these
two operational types tend to obtain freight through different means. Fleet owners typically build direct
relationships with shippers and receivers, while those under their own authority primarily utilize load
boards. Although OOIDA encourages its members to work directly with shippers, it is interesting to note
that the compensation per mile was similar between these two methods. For those utilizing load boards,
the top three are DAT (58%), Truckstop.com (34%), and C.H. Robinson (24%). While load boards have
become highly popular over the past few years, a fairly new option has entered into the market place.
Namely, digital load matching.
Digital load matching primarily consists of a technology company, acting as a broker, who develops a
platform which automates the load acquiring process by allowing a driver to match their truck with a
pending load. The platform then utilizes machine learning and artificial intelligence in an attempt to
match that driver to future loads of similar kind. Thereby bypassing the various brokers who typically post
loads on load boards. According to the 2020 Freight Rate Survey, four percent of members utilize such
applications. For those who do, the most popular load matching apps are Convoy, Uber, and JB Hunt 360.
When asked how they set their rates, several fleet owners and owner-operators under their own authority
stated that they do so by utilizing region, state, and seasonal information, as well as various economic
data such as DAT’s 15-day rate view. Members also calculate their rates by determining the minimum
price per mile they need in order cover their operating costs, including fuel, insurance, tolls, truck
payments, etc. In fact, 77 percent of respondents indicated that they know their cost of operations. This
was especially true for fleet owners (92%). The average cost per mile was $1.85 for those under their own
authority, $1.61 for those leased-on, and $1.96 for fleet owners.19 2020 Freight Rate Survey
It is critical for an owner-operator to know how much they need to earn in order to both cover their
operating expenses and pay themselves. Without this knowledge, the possibility for failure rises
exponentially every year within the first five years of operation. An owner-operator who knows their
costs is better equipped to choose which freight, region, and type of operation is best for their business,
as well as being better able to negotiate their rates. Those who knew their cost of operations earned
$1.00 more per mile and over $700 more per trip than those who did not know.
Although most company drivers did not know how their carrier sets their rates (79%), those who did said
their carrier utilized various market information, including volume, demand, distance, season, freight lane,
spot rate, and what specialized equipment is needed to complete the shipment.
Graph 4: Comparison of Pay Per Mile between those who do and do not know their Cost of Operations
$2.50
$2.09
$2.00 $1.84
$1.50
$1.09
$1.00
$0.50
$-
DO KNOW DO NOT KNOW OVERALL
When it comes to negotiating, fleet owners (65%) and those with their own authority (56%) felt that they
were in a better position in 2020 to negotiate rates than in 2019, which was also true for those pulling dry
van trailers (56%) and reefers (56%). However, leased-on owner-operators (65%), those pulling flatbeds
(55%), and those hauling hazmat (88%) and OSOW (85%) loads felt that they were in a worse position this
year. Again, this probably due to the sluggish recovery for these segments of the industry.
While 45 percent of respondents always attempt to negotiate their rates, several members were unable
to negotiate and instead were pressed to obtain a certain level of compensation. For example, several
members stated that they always strive to earn a certain benchmark, or more, on all miles, while others
felt forced to settle for less than their operating costs or just enough to pay their bills. Some members
chose not to negotiate their rates because they were afraid of losing business, did not feel they would
receive it anyway, or were not comfortable with negotiating. Additional members stated that they did
not negotiate simply because the rates were in the range of what they were asking for. Others stated the
rates were pre-set or that the rates have always been this way. One member wrote, “I only negotiate if Ifeel the rate is substandard.” It is important to note however that those who at least attempt to negotiate
their rate earned more per mile and per trip than those who never made the attempt.
Graph 5: Comparison of Pay Per Mile by those who attempt to Negotiate their Rates
$2.40
$2.21 $2.23
$2.20
$2.05
$2.00
$1.80 $1.75
$1.60
$1.40
$1.20
$1.00
ALWAYS USUALLY OCCASIONAL NEVER
For company driver members, 41 percent stated that their carrier was better equipped to negotiate rates
in 2020 rather than in 2019, which was a 40 percent increase from the previous survey. This positive trend
also transitioned into the number of loads hauled overall, as both those who receive freight through
brokers or a third party and those who utilize carriers or shippers, indicated that loads were increasing,
particularly fleet owners and those pulling van or reefers. Moreover, members also demonstrated that
they are turning down less loads than before due to cheap freight, with 51 percent stating that they turned
down less than 25 percent of their loads in comparison to 35 percent in the previous survey as shown in
Graph 6.
The number of overall loaded miles decreased slightly in 2020 compared to the previous year, primarily
due to a sharp decrease in miles for those pulling flatbed trailers and hauling building materials and OSOW
loads. In fact, all other operational and equipment types experienced increases in loaded miles, with only
33 percent of members in general stating their loaded miles shrank in comparison to 48 percent who
indicated so in 2019. Deadhead or unloaded miles also decreased overall, but much more drastically as
only 28 percent stated their deadhead miles grew in 2020 compared to 50 percent in 2019.
The average member drove approximately 93,500 loaded miles and 13,000 unloaded miles, representing
a 1 percent decrease in loaded miles and a nearly 45 percent decrease in unloaded miles. Those hauling
reefers continued to incur the most loaded miles at 121,500, a 20 percent increase, while leased-on
owner-operators drove the fewest. Fleet owners and those pulling dry vans experienced the most
unloaded miles behind leased-on owner-operators. In general, a majority (54%) of members were able
to negotiate a fuel surcharge into their freight rates.21 2020 Freight Rate Survey
Graph 6: Loads turned down due to cheap freight, 2018-2019
50%
45%
40%
35%
30%
25%
20%
15%
10%
5%
0%
I do not turn down 0 to 25% 26 to 50% 51 to 75% More than 75%
cheap freight
2019 2020
Graph 7: Freight Market Outlook
70%
60%
50%
40%
30%
20%
10%
0%
Overall, freight rates are: If you use a freight broker or third If you get your loads from a motor
party, the number of loads are: carrier or shipper, are the number of
loads:
Increasing Decreasing Staying the same
OOFI also inquired to know how many members utilize factoring services, which are designed to help
motor carriers to obtain finances for their immediate cash needs in return for a percentage of their
accounts receivable or invoices. A vast majority do not use a factoring service in their trucking business
(77%). The average fee overall for those who do use such a service was 3.2 percent, which was the same
fee as in 2019.When asked concerning their professional opinion of factoring in the 2018 Freight Rate Survey, most
members responded that they were not supportive of such a service, stating, “It’s better to manage your
own money, than to pay someone to pay you.” Many wrote that the fees were too high and that factoring
simply enables those that cannot manage their cash flow properly. However, others view factoring as a
necessary evil and even a useful tool for small carriers and independents who do not have the funds to
run their business for 30, 90, or 180 days while they wait to be compensated. One member said, “Honestly
I think they provide a very important service to those of us looking to get a foothold in the industry.”
However, many noted that individuals should use factoring sparingly.
Graph 8: Negotiating Rates and Fuel Surcharge
Have you been able to include a fuel surcharge in freight
rates?
Have you been able to negotiate rates more this year than
last?
42% 44% 46% 48% 50% 52% 54% 56%
No Yes
In order to obtain a better understanding of the current freight market, as well as to ascertain the accuracy
of other freight indicators, OOFI posed three different questions concerning the average spot and contract
rates as indicated by DAT Trendlines for the dry van, flatbed, and reefer segments of the industry. OOFI
also asked if any of the respondents were currently utilizing additional economic information published
by groups such as DAT, FreightWaves, the Cass Index, IHS Markit, etc. Although a majority of respondents
stated the figures published by DAT were correct, the members’ average compensation rate per mile for
each equipment type was below DAT’s numbers.
Of those members earning less than the average pay per mile, 40 percent did not know their cost of
operations and 30 percent stated that they never try to negotiate their rate. These figures suggest that
members who are receiving less than average compensation are those same individuals who do not know
what they need to make to be profitable and do not ask for more pay. Conversely, of those members who
receive more than the average per mile pay, 87 percent know their cost of operations and 52 percent said
they always attempt to negotiate their rates. Regardless, the table below demonstrates that DAT’s23 2020 Freight Rate Survey
Trendlines is an accurate barometer of the current freight rates across the trucking industry according to
OOIDA’s members.
Table 2: Accuracy of DAT Trendlines
These figures The average spot and The average spot and The average spot and
are: contract rates for vans has contract rates for flatbeds contract rates for reefers
been $1.96 and $2.10 has been $2.18 and $2.47 has been $2.26 and $2.36
respectively respectively respectively
Far too high 19% 16% 12%
Slightly high 26% 19% 19%
Correct 33% 45% 46%
Slightly low 14% 12% 15%
Fart too low 9% 9% 9%
Conclusions and Economic Outlook
From 2018 to 2020, OOIDA members have seen dramatic shifts in the overall freight rates as the freight
market reached record highs in June 2018, but began to slowly contract through the later part of the year
and into 2019. Following a disappointing 2019, freight rates once again roared back to record heights
during the second half of 2020. In particular, the number of respondents who indicated that freight rates
were dropping in comparison to the previous year, decreased 53 percent, coupled with a 600 percent
increase in those who stated rates were improving.
Despite the volatility in the freight market throughout 2020 due to the pandemic, the trucking industry
overall finished off the year strong and is expected to continue into the first half of 2021. However, the
health of the freight market will depend largely on a few factors. Perhaps the most important factor is
unemployment as jobless claims continue to hover around high levels. This could potentially stunt
consumer confidence and thereby consumer spending which will ultimately impact freight demand
moved by trucks. Moreover, analysts believe that the market will return to normal in regards to
traditionally consumer spending. In 2020, consumer spending shifted more toward goods than services
as the country began shuttering its doors. The consensus however is that this trend will shift back to the
more traditional 67/33 split instead of the current 60/40 split, which could possibly lesson freight demand.
The next factor that will have a significant impact on the outlook for 2021 is imports and global trade. The
ports of Los Angeles and Long Beach have experienced tremendous congestion through the first two
months of 2021 due to extremely high inbound volumes and logistical complications both inside and
outside the ports. On February 1, 2021, there were twenty-five container ships at berth at the ports and
40 container ships at anchor, an all-time record.13 The congestion issues are rippling across other major
U.S. ports as well, which virtually guarantees high truck demand for the foreseeable future in certain
markets.
The final factor is capacity, which has slowly been coming back online as carriers have been filling their
empty seats and ordering new trucks. Figure 12 demonstrates that there was a steep drop in truck
13
Greg Miller, “New video shows massive scope of California box-ship traffic jam,” FreightWaves (February 11, 2021)transportation employment in early 2020 after the industry had experienced few years of steady increase.
The figure also illustrates how truck employment has rebounded since then, eventually reaching 2018
employment levels by the end of the year. Moreover, according to ACT Research, while the trucking
industry experienced a large influx in new Class 8 truck orders in 2018 and 2019, equipment orders
dropped off significantly in 2020. However, as with the other economic indicators discussed in this report,
new orders have rapidly recovered since then. This additional capacity could potentially put downward
pressure on freight rates as it did in 2018 and 2019.
Although macroeconomic indicators which help to gauge the overall health of the economy such as the
PMI, Gross Domestic Product, the Cass Freight Shipments Index, the Freightos Baltic Daily Index, U.S.
Customs and Maritime Import Shipment Volumes, Total Construction Spending, and others have showed
momentum over the last few months of 2020 and into 2021, capacity is a crucial element concerning the
condition of the freight market. Thus the trucking industry faces a possible overhang if capacity rises
freight demand normalizes or falls. For example, when economic growth began to slow in 2019, the
truckload market found itself in the midst of an overcapacity problem due to the record number of Class
8 truck orders in 2018, causing rates to fall. It is imperative for the owner-operator to be examining the
current condition of the freight market and to prepare accordingly.
Figure 12: Non-seasonally Adjusted Truck Transportation Employment (000s)
Source: SONAR
Figure 13:ACT Research Class 8 Equipment Orders25 2020 Freight Rate Survey
Source: SONAR
While large motor carriers and the broader market tend to focus on these economic indicators, it is
important for the small business owner to do the same. The purpose of the Freight Rate Survey is to
gather information from the owner-operator and professional truck driver. Thus when members were
asked for their perception concerning the prospects for the coming year based on their experience and
professional opinion, 70 percent forecasted either similar or improving prospects for 2021, compared with
62 percent in the previous survey.
Though many members have positive outlooks for next year, there is some disconnect between market
analysts and those truckers on the ground level. While many reports indicate that the first quarter in 2021
will be a strong one, some members felt rates were dropping and that political uncertainty would
negatively impact the market for the foreseeable future, as well as increased capacity. It is important to
note however that OOFI sent the survey Wednesday, November 4, 2020. Since that time, much of the
uncertainty surrounding the presidential election has been resolved, yet there is still more uncertainty to
come, which is normal when a new administration enters the White House. Members are not only
concerned with market conditions, but also how the regulatory agenda of a new incoming administration
will affect their livelihoods.
In response to the members’ prospects for 2021, 46 percent indicated that they are planning to make
changes in their business plan for next year, which is the same percentage as last year. Several fleet
owners and owner-operators under their own authority expressed their desire to expand their operations
by either purchasing a new truck, new or newer equipment, or even both. Others mentioned downsizing
their operation or leaving the business altogether due to volatile rates and excessive rules and regulations.
For leased-on owner operators, many are looking to obtain their own authority, while a few are looking
to get out of the business. However, regardless of operational type, many members pledged to increase
the efficiency of their business, whether through more research into freight markets, changing lanes orregions, being more selective of their routes and securing backhauls, becoming more specialized, or
simply focusing to reduce expenses and deadhead miles.
Graph 9: Rates are, 2013-2020
80%
70%
60%
50%
40%
30%
20%
10%
0%
2013 2014 2015 2016 2017 2018 2019 2020
Going up Going down Not Changing
Graph 10: Prospects for Next Year, 2016-2020
50%
45%
40%
35%
30%
25%
20%
15%
10%
5%
0%
2016 2017 2018 2019 2020
Better Worse About the same
In short, the data from the survey creates a picture of a freight market ready to continue strong into the
first half of 2021. There are still some big questions that remain however, will unemployment rise and
consumer spending decrease, will industrial production and manufacturing cool off, will freight demand27 2020 Freight Rate Survey
finally level out, and most importantly, will carriers continue to add truck capacity in order to gain more
business as they did in 2018 and 2019. Much of the freight market will hinge on these important factors.
It is crucial for any small business owner or professional truck driver to keep these questions in mind
moving into 2021. Depending on capacity and freight volume, members might consider consolidating
their business, changing operations, or perhaps even obtaining their authority or purchasing another truck
in order to expand their scope of operation. Either way, it is vital for members to follow the state of the
market in order to make the best decision for their business and their livelihood.You can also read