The Initial Effects of the Expanded Child Tax Credit on Material Hardship
←
→
Page content transcription
If your browser does not render page correctly, please read the page content below
POVERTY AND SOCIAL POLICY WORKING PAPER August 30, 2021

 The Initial Effects of the Expanded Child Tax
 Credit on Material Hardship
Zachary Parolina,c, Elizabeth Ananatb, Sophie Collyera, Megan Currana, and Christopher Wimera

 (a) Center on Poverty & Social Policy, Columbia University
 (b) Barnard College, Columbia University
 (c) Bocconi University

Note: The current draft of this Working Paper is based on evidence from the Census Household
Pulse Surveys from April 14, 2021 to August 2, 2021. We plan to update these findings in mid-
 September with additional data from the Census Household Pulse Survey. The findings below
 may change with the addition of new data in subsequent waves of the Pulse.

Abstract: The transformation of the Child Tax Credit (CTC) into a more generous and inclusive
monthly payment marks a historic, albeit temporary, shift in the American welfare state’s
treatment of low-income families. To investigate the initial impact of the monthly CTC payments
on material hardship among families with children, this study applies a series of difference-in-
differences estimates using Census Household Pulse Survey microdata collected from mid-April
through early August 2021. Our findings offer three primary conclusions regarding the initial
effects of the first monthly CTC payment delivered mid-July 2021. First, the July 2021 CTC
payment strongly reduced food insufficiency among low-income households with children. The
first monthly CTC payment is associated with an 8-percentage point or, 29 percent, decline in
food insufficiency among low-income families. Second, the effects of the first CTC payment on
food insufficiency are concentrated among households with annual incomes of less than $35,000.
Third, increasing the coverage rate of the CTC is critical for further reducing material hardship.
Self-reported receipt suggests the lowest-income households were less likely than higher-income
families to receive the first payment. As more children receive the benefit in future months,
levels of material hardship may decline further. Even with imperfect coverage, however, our
findings suggest that the first CTC payment was largely effective at reducing food insufficiency
among low-income families with children.

 povertycenter.columbia.edu 1
POVERTY AND SOCIAL POLICY WORKING PAPER August 30, 2021

INTRODUCTION

 In March 2021, the United States (U.S.) Congress passed the American Rescue Plan (ARP),

which included a large expansion of the Child Tax Credit (CTC). The ARP increased the benefit

values of the CTC, removed the earnings requirement and made the benefit fully refundable, and

shifted the distribution schedule from a once-per-year payment of the CTC to monthly payments.

The first monthly payment was distributed to families of 59.3 million children (around 80 percent

of all children in the U.S.) in July 2021 (U.S. Department of Treasury, 2021a). The CTC expansion

marks a notable shift in the American welfare state’s treatment of low-income families; however,

the program is implemented only for one year and, in the absence of Congressional renewal, will

expire in 2022. As such, timely and reliable evidence is critical for informing policymakers,

researchers, and the public of the CTC’s impact. This study investigates the effects of the expanded

CTC on material hardship among families with children in the initial weeks after the first CTC

payment.

 A large body of research shows that children who grow up in families with higher incomes

perform better across a host of measures of both short- and long-term development and well-being

(Brooks-Gunn and Duncan, 1997; Chaudry and Wimer, 2016). And a smaller but growing body

of literature attempts to understand whether these relationships are causal, given the fact that

lower- and higher-income families may differ on numerous fronts besides income alone. Most of

these studies use so-called “natural experiments,” which attempt to identify quasi-random

variation in income to see whether that exogenous change predicts changes in important child

outcomes. This growing literature is so far consistent in finding that enhanced incomes and reduced

poverty causally impact children’s short- and long-term development and well-being (Duncan,

Morris and Rodrigues, 2011; Wimer and Wolf, 2020; Garfinkel et al., 2021).

 povertycenter.columbia.edu 2
POVERTY AND SOCIAL POLICY WORKING PAPER August 30, 2021

 There are two primary channels through which increases in income are thought to impact

children’s outcomes (NAS, 2019). The family stress channel posits that the absence of resources

increases stress, which compromises healthy parenting and other family relationships, resulting in

worse child outcomes. The family resources channel posits that increased income allows parents

to purchase or invest in various things that enhance child development and well-being (e.g., books,

toys, enriching activities, academic supports, safer neighborhoods, etc.). Each channel assumes

that an increase in income would change aspects of the home environment in the shorter term, and

that these effects would accumulate over time into more positive child outcomes.

 This study seeks to add to this burgeoning literature by looking at the initial impacts of the

CTC, which now extends income support to children historically left out of the full benefit of the

credit (Collyer, Harris and Wimer, 2019; Goldin and Michelmore 2020). We apply difference-in-

difference estimates to take advantage of (1) the fact that effects of the policy differ between

households with children and those without, and (2) that households with children benefit

differentially based on the ages of their children, number of children, and pre-reform income

levels.

The Expanded Child Tax Credit

 Since the mid-1990s, the American welfare state has relied more on in-kind transfers, such

as benefits from the Supplemental Nutrition Assistance Program (SNAP), and work-conditional

transfers, such as benefits from the Earned Income Tax Credit (EITC), relative to cash-based

income support (Bauer et al., 2018; Hoynes, 2019; Pac et al., 2017). As a result, share of children

in families with very little cash income has grown (Shaefer & Edin, 2013). The lack of cash-based

assistance and the comparatively high rate of child poverty sets the U.S. apart from other high-

income countries, most of which have some form of child allowance (Curran, 2015; Garfinkel et

 povertycenter.columbia.edu 3
POVERTY AND SOCIAL POLICY WORKING PAPER August 30, 2021

al., 2016; Shaefer et al., 2018). The expansion of the CTC thus represents a historic deviation from

the direction of the U.S. welfare state throughout the past three decades.

 Prior to the expanded CTC, tax filers could receive a maximum CTC of $2,000 per child,

per year, but it was not fully refundable. 1 One in three children did not receive the full benefit

value because their families did not earn enough to qualify. Children with single parents, those in

rural areas, Black and Latino children, and those in larger families were disproportionally

ineligible for the full credit (Curran and Collyer, 2020; Collyer, Harris, and Wimer, 2019).

Following similar parameters to the American Family Act (a bill first introduced in both the Senate

and House of Representatives in 2017 and reintroduced in 2019), the ARP has temporarily

transformed the CTC into a nearly-universal child allowance for 2021. 2 Specifically, the ARP

includes three fundamental changes to the CTC. First, it makes the CTC available to almost all

children, including those in families with the lowest incomes previously excluded, by removing

the earnings requirement and making the credit fully refundable. Second, it raises the maximum

annual credit amounts to $3,000 for children ages 6-17 and $3,600 for children under age 6. Third,

beginning mid-July 2021, it delivers the credit in monthly installments of up to $250 per older

child or up to $300 per younger child, for a period of six months. 3

 One challenge facing the introduction of the expanded CTC is that not all eligible children

automatically receive the payments. Families who did not file taxes in the prior year, presumably

due to having an income below the tax-filing threshold, generally must register with the Internal

1
 See additional information on the history of the Child Tax Credit, see Crandall-Hollick (2021), Crandall-Hollick (2018), and Garfinkel et al.
(2016).
2
 The expansion to the CTC in the ARP mirrors the proposed reforms in the American Family Act (AFA) with one exception: in the AFA, the
credit would begin to phase out for heads of household with earnings above $120,000 or and joint filers with Adjusted Gross Incomes (AGI) over
$180,000. In the ARP, the credit begins to phase out for families with AGIs above $112,500 or $150,000 per year, depending on filing status, but
it only phases out until matching the credit values that a family would receive under prior law. This alteration was made because the Biden
administration committed to not raising taxes for those with incomes below $400,000 per year.
3
 Because the payments began halfway through the year, families will receive half of the full amount of their credit in 2021 and the remainder when
they file taxes in 2022.

 povertycenter.columbia.edu 4
POVERTY AND SOCIAL POLICY WORKING PAPER August 30, 2021

Revenue Service (IRS) in order to receive benefits. Several estimates suggest that the total number

of children in eligible tax units is around 64 to 67 million children (Parolin et al., 2021b), more

than the 59.3 million to whom the IRS distributed initial CTC payments to in July 2021. Put

differently, the first payment did not reach all eligible families. As we discuss in our Data and

Methods section, we take several steps to account for the imperfect coverage of the initial CTC

payment when evaluating the policy’s effects on hardship.

 Despite the challenge in reaching full coverage, early research suggests the expanded CTC

has potential to generate large reductions in child poverty (Center on Poverty and Social Policy,

2021; Marr et al., 2021; Acs and Werner, 2021; Parolin et al., 2021a; Wheaton et al., 2021) and

may contribute to reductions in economic hardship (Perez-Lopez, 2021). Thus far, however, it

remains unclear whether the expanded CTC has plausibly causal effects. This study investigates

that possibility, using household data released in the initial weeks following the first CTC payment,

to assess the policy’s effects on material hardship among families with children. We will add to

this analysis as the monthly payments continue and more data is available.

DATA AND METHODS

 Data Source: This study uses data from the Census Household Pulse Survey (Pulse). The

U.S. Census Bureau introduced the Pulse in April 2020 to begin collecting up-to-date and

nationally-representative information on the social and economic wellbeing of households across

the U.S. The Census Bureau randomly selects addresses to participate in the Pulse, then sends

either an email or a text message to the contact information associated with the household. The

message prompts the recipient to participate in a 20-minute online survey asking questions

related to education, employment, food security, housing, and more. The data have been used to

track trends in material hardship, subjective wellbeing, and other social and economic indicators

 povertycenter.columbia.edu 5
POVERTY AND SOCIAL POLICY WORKING PAPER August 30, 2021

throughout the pandemic (Bitler et al., 2020; Morales et al., 2020; Schanzenbach and Pitts, 2020;

Ziliak, 2021; Cai et al., 2020, Twenge and Joiner, 2020). Our particular focus in this analysis

centers on the hardship data, but there is potential to use the Pulse data to explore the relationship

between the CTC monthly payments and subjective wellbeing (see Appendix E).

 We use Pulse data collected between April 14, 2021 (three months before the start of the

monthly CTC) through August 2, 2021 (waves 28-34). The first payment of the expanded CTC

was delivered to recipients on July 15, 2021, which falls prior to the beginning of Wave 34 of the

Pulse (which spans July 21 to August 2, 2021). Our total sample size is 362,963 respondents.

 One limitation of the Pulse is that is conducted online-only (often sent via text message with

a link to complete a survey online), which may exclude segments of the population who lack

reliable internet connection. We provide descriptive statistics on the respondents in Appendix I.

The descriptive statistics show that the Pulse sample closely mirrors population estimates from

the U.S. Current Population Survey.

 Sample Criteria: We exclude all households in the Pulse who have imputed values of

number of children in the household, as error in the imputed values could bias our estimates. In

our sample, 1.3 percent (4,576 of 362,963) of all responses featured imputed values of the

number of children. Given that the expanded CTC should benefit lower-income households more

so than higher-income households, we restrict our primary estimates to households with a 2019

pre-tax income of under $35,000. In subsequent estimates, however, we also display results

when assessing the effect of the CTC on all households under $25,000 and at different income

bins up to $200,000 in 2019 pre-tax income. We also display subgroup analyses to estimate the

effects of the CTC by race and ethnicity.

 povertycenter.columbia.edu 6
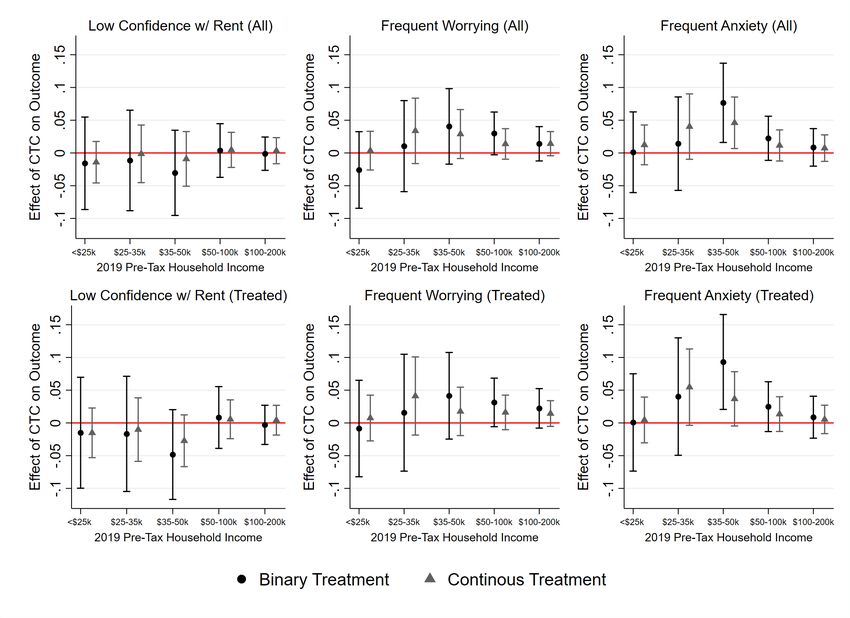
POVERTY AND SOCIAL POLICY WORKING PAPER August 30, 2021

 Receipt of the CTC: As noted, the first payment of the CTC did not reach all children in

eligible families. Though the Department of Treasury reports that 59.3 million children (around

80 percent of all children) received the first payment, the Pulse includes its own question of

whether the household received the CTC payment (U.S. Department of Treasury, 2021a). We

thus begin our Findings section with a descriptive portrait of coverage rates as reported in the

Pulse.

 Indicators of Material Hardship: Table 1 presents our primary measures of material

hardship. Our material hardship indicators include household food insufficiency, difficulty with

expenses, and not being caught up on rent or mortgage payments. We operationalize each of

these indicators as a binary variable using the criteria described in the right-most column of

Table 1. In a parallel exercise, we explore early indications of the relationship between the new

CTC monthly payment and three measures of subjective wellbeing, including confidence in

paying the rent/mortgage, frequent anxiety, and frequent worrying. These results are included in

Appendix E; as the monthly CTC payments continue and more data becomes available, this

represents an area for continued investigation. In general, however, we would expect measures of

subjective wellbeing to be more sensitive to continued receipt of monthly payments rather than

just the first payment, which serves as our treatment effect in the following analyses.

 povertycenter.columbia.edu 7
POVERTY AND SOCIAL POLICY WORKING PAPER August 30, 2021

Table 1: Overview of primary hardship indicators

 Type Prompt Qualifying
 Responses
 Household food In the last 7 days, which of these statements Sometimes or often
 insufficiency best describes the food eaten in your not enough to eat
 household?

 Difficulty with expenses In the last 7 days, how difficult has it been for Somewhat or very
 your household to pay for usual household difficult.
 expenses, including but not limited to food,
 rent or mortgage, car payments, medical
 expenses, student loans, and so on?

 Not caught up on rent [or Is this household currently caught up on rent No.
 mortgage] [or mortgage] payments?

 Methods: We estimate difference-in-differences models to assess the effect of the

expanded CTC on our outcomes of interest, as defined in Equation (1).

 = 1 + 2 + 3 ( ∗ ) + 4 + (1)

 The outcome variable is one of our hardship indicators (separate models for each).

PostCTC is a binary indicator of whether the time of survey occurred after July 15, 2021, the day

on which the expanded CTC was first administered. We specify our treatment variable,

Treatment, in two separate ways. First, we operationalize a binary treatment indicator measured

as whether the household has children (value set to 1) or is childless (value set to 0). Given that

our sample is limited to households reporting a 2019 pre-tax income of under $35,000, we

assume (but cannot directly test) that the vast majority of households with children in this

subsample are eligible to receive the monthly CTC. Childless households, in contrast, do not

directly benefit from the reform.

 As noted, coverage rates of the CTC among the eligible are imperfect. Given that the

Pulse specifically asks whether the family received the CTC payment, we also include an

 povertycenter.columbia.edu 8

POVERTY AND SOCIAL POLICY WORKING PAPER August 30, 2021

estimate of the treatment effect on the treated (the effect of the CTC on those who report actually

receiving the CTC). In our sample of households with children with 2019 pre-tax income of less

than $35,000, 54 percent of households report receiving the first CTC payment.

 For our second treatment indicator, we estimate models using a continuous indicator of

treatment intensity to capture the fact that the effects of the CTC are likely to vary by age of the

children (as families with children under age 6 receive larger monthly benefit values), the

number of children in the home, and the relative value of the new CTC benefits compared to

what the family likely received from the CTC prior to the reform. We cannot consistently

observe the age of each child in a given household in the Pulse, nor do we have information on

pre-reform CTC receipt. 4 Thus, we use data from the 2019 U.S. Current Population Survey to

estimate the mean pre- and post-reform benefit values for bins defined by the number of adults in

the household (ranging from 1 to 10), the number of children in the household (ranging from 0 to

10), and eight category pre-tax income bins (from under $25,000 annually scaling up to more

than $200,000 per year). For each bin, we compute the mean pre-reform refundable CTC

benefits as observed for each family unit in the CPS ASEC. We simulate the additional post-

reform benefits that each family is eligible for (not yet taking into account imperfect coverage in

benefit distribution) using detailed policy rules from the CTC reform as specified in the 2021

American Rescue Plan. We subtract the pre-reform benefit value from the post-reform benefit

value to create a “net benefit” indicator for each family unit. We then adjust the net benefit

indicator for family size using the modified OECD equivalence scale. 5 Finally, we calculate the

4
 Wave 34 of the Pulse does have binary variables of whether children are under 5 or between 5 to 11. Given that the
data are not consistently available throughout the waves included in this analysis, however, we cannot use it in our
estimations or creation of the treatment indicators.
5
 The modified OECD scale begins with a value of 1 for a single adult, then adds 0.5 for each child in the home and
0.3 for each additional adult in the home. Alternative family-size adjustments include the square-root equivalence
scale or dividing by a family-size-adjusted poverty-threshold, such as that of the U.S. official poverty measure.

 povertycenter.columbia.edu 9
POVERTY AND SOCIAL POLICY WORKING PAPER August 30, 2021

weighted mean of the size-adjusted net benefit value for each of the bins defined above. We then

import this value into the Pulse, matching on the number of adults, number of children, and 2019

pre-tax income category of the Pulse respondents. We provide more details and descriptive

statistics on the indicator in Appendix B.

 In a sensitivity test, we also produce an alternative version of our treatment intensity

indicator that matches the July 2021 coverage rate of the CTC – 59.3 million children – as

reported by the U.S. Department of Treasury. Specifically, we scale down coverage from all

likely-eligible children to match the reported numbers of children receiving the CTC by state,

following the procedure in Parolin, Collyer, Curran, and Wimer (2021b). Within each state, we

adjust coverage so that it is the lowest-income tax units who are removed first, representing the

fact that lower-income tax units are less likely to have filed taxes in the prior year and, thus, are

less likely to receive the benefits automatically (Cox, et al., 2021). In our Findings section, we

also present observed coverage rates from the Pulse among households with children by income

bin; these results corroborate the claim that the lowest-income households with children were

less likely to receive the benefit in July 2021. We present the results from our sensitivity tests in

Appendix B, but we note that they do not vary meaningfully from the results of our primary

analyses.

 In Equation (1), we control for the age, sex, and education status of the household head

and include wave dummies in each model (captured in vector X). In each estimate, 3 is our

primary coefficient of interest, as it informs us, when using the binary treatment indicator, of

whether households with children faced a larger (or smaller) difference in the outcome relative to

childless households after the introduction of the CTC

povertycenter.columbia.edu 10
POVERTY AND SOCIAL POLICY WORKING PAPER August 30, 2021

FINDINGS

 Our Findings section proceeds in three parts. First, we discuss reported receipt of the

CTC in the Pulse and compare this to administrative reports from the U.S. Department of

Treasury. Second, we present descriptive findings on trends in material hardship. Third, we

present the results of our difference-in-differences estimates.

Reported Receipt of the Child Tax Credit
 As noted, the U.S. Department of Treasury reports that 59.3 million children, or roughly

80 percent of all children, received the first CTC payment in July 2021 (U.S. Department of

Treasury, 2021a). Estimates from the Pulse, however, suggest that 65 percent of children were in

households that report receiving the initial CTC payment. This is equivalent to approximately 48

million children, or 11 million fewer than the IRS reports. The discrepancy could be due a

number of factors: sampling bias in the Pulse, benefit underreporting in the Pulse, overestimation

of children served from the Department of Treasury, or general measurement error. Regardless

of cause, all results should be interpreted with this discrepancy in mind. Moreover, the coverage

rate is likely to increase in subsequent months, considering that the Department of Treasury

reported that 1.6 million additional families received the benefit in August relative to July U.S.

(Department of Treasury, 2021b).

 Figure 1 breaks down reported CTC receipt rates by race and ethnicity (left panel) and

2019 pre-tax income bin (right panel). As noted, 65 percent of all children are in households that

report receipt of the first payment of the CTC in the Pulse, including 62 percent of Asian

children, 71 percent of Black children, 59 percent of Latino children, and 65 percent of White

children. Keep in mind that the sample here is not limited to eligible family units, and that not all

povertycenter.columbia.edu 11
POVERTY AND SOCIAL POLICY WORKING PAPER August 30, 2021

children in the U.S. are eligible; thus, the reported means should be interpreted as general

coverage rates and not take-up among the eligible.

Figure 1: Share of children in families receiving the first payment of the Child Tax Credit (self-
reported receipt from responses of Census Household Pulse Survey)

Note: Race and ethnicity refers to that of the household head in which the child lives. Coverage rates are
across the entire sample of households with children and are not limited to eligible households, as
eligibility cannot be inferred with precision in the Pulse.

 The results by income bin (right panel) suggest that families with children that had 2019

pre-tax incomes below $25,000 are less likely than higher-income families to have received the

benefit. According to the Pulse data, just over half (55 percent) of children in families with

incomes under $25,000 received the first payment. Rates of (self-reported) receipt rise as

incomes rise. Among families with earnings between $25,000 to $35,000, more than two-thirds

povertycenter.columbia.edu 12
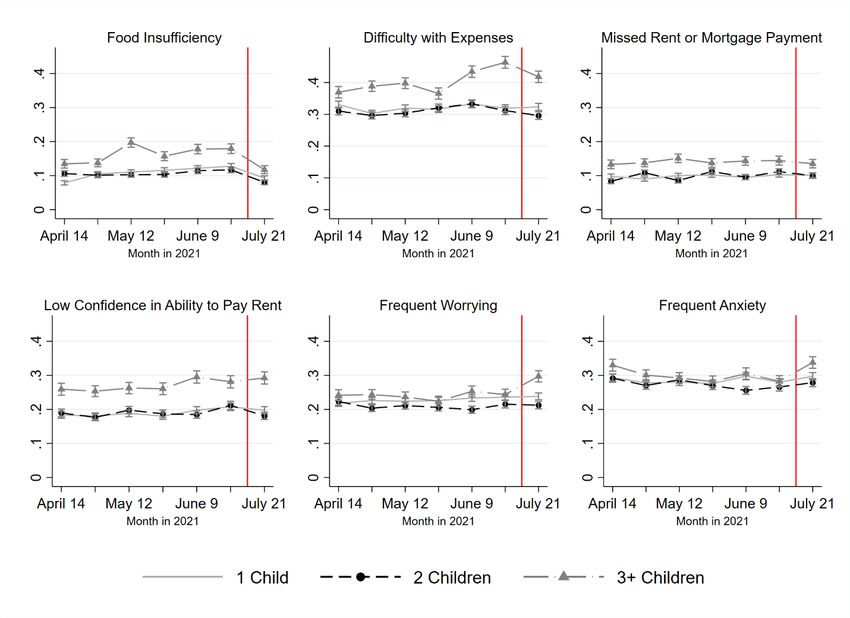
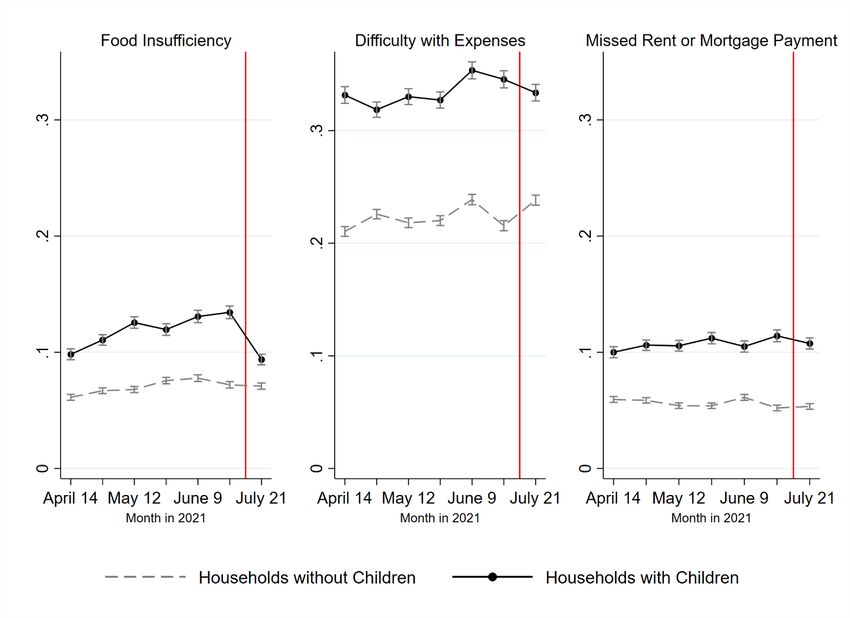
POVERTY AND SOCIAL POLICY WORKING PAPER August 30, 2021

(68 percent) of children received the benefit in July. Among families with incomes between

$75,000 and $100,000, approximately three-quarters (73 percent) of children did.

 Given the comparatively low coverage rates among the lowest-income families, it is

unlikely that the initial effects of the CTC match the potential effects if coverage were greater, or

the future effects assuming that coverage does, indeed, expand. As such, the results below should

be interpreted as the immediate effects with imperfect coverage. Presumably, any effects

observed in the results below will increase as more families receive the benefit in subsequent

months.

Descriptive Findings
 Figure 2 presents descriptive trends in each of the outcomes for childless households

(dashed gray line) and households with children (solid black line) from April 2021 through July

2021. The red vertical line in each figure marks the first payment of the expanded CTC.

 Food insufficiency (left panel) is consistently higher for households with children relative

to childless households for the entire period considered. From April through to the end of June,

both groups see slight increases in food hardship, with childless households reaching 7.2 percent

in June compared to 13.4 percent for households with children. After the first payment of the

CTC, however, food insufficiency remains relatively stable (7.1 percent) for childless

households, but declines to 9.4 percent for households with children. The change from late June

to late July marks a 4 percentage point, or 30 percent, decline in food insufficiency for

households with children.

 The middle panel shows that households with children tend to face much higher rates of

difficulty with expenses relative to childless households (in late June 2021, 34.6 percent to 21.6

percent, respectively). After the first payment of the CTC, however, the share of childless

povertycenter.columbia.edu 13
POVERTY AND SOCIAL POLICY WORKING PAPER August 30, 2021

households (which do not receive the CTC) reporting difficulty with expenses increases to 23.8

percent, while the share of households with children reporting the same declines to 33.4 percent.

Here, however, the decline is more modest relative to food insufficiency: for households with

children, the change from late June to late July represents a 1.2 percentage point (3.4 percent)

decline.

Figure 2: Trends in hardship for households with and without children (April 14 to August 2,
2021)

Note: Red vertical line represents the date of the first payment of expanded Child Tax Credit. See Table 1
for definition of each outcome.

 Households with children are also more likely to have missed rent or mortgage payments

(right panel) over the entire period considered. But for households with children, missed rent or

povertycenter.columbia.edu 14
POVERTY AND SOCIAL POLICY WORKING PAPER August 30, 2021

mortgage payments declined from 11.4 percent to 10.8 percent from late June to late July, while

the rate remained stable at 5.2 percent for childless households.

Estimation Results
 Table 2 presents the results from our difference-in-differences estimates using our binary

treatment (which, as described in the prior section, is set to a value of one for households with

children) among our subsample of households with pre-tax income of $35,000 or less in 2019.

Table 2: Difference-in-differences estimate of effect of expanded CTC on hardship and wellbeing among
households with 2019 total pre-tax income below $35,000; binary treatment
 Including Treated & Untreated Only Including Treated
 Households w/ Children Households with Children
 1: Food 2: Difficulty 3: Missed 4: Food 5: Difficulty 6: Missed
 Insufficiency w/ Expenses Rent or Insufficiency w/ Expenses Rent or
 Mortgage Mortgage
 Household with 0.06*** 0.11*** 0.07*** 0.06*** 0.11*** 0.07***
 Children (0.01) (0.01) (0.01) (0.01) (0.01) (0.01)

 Post-July 15 0.05*** 0.09*** 0.01 0.05*** 0.09*** 0.01
 (0.01) (0.02) (0.01) (0.01) (0.02) (0.01)

 Household with -0.08*** -0.04ⵜ 0.01 -0.12*** -0.05ⵜ 0.02
 Children X (0.02) (0.02) (0.02) (0.02) (0.03) (0.02)
 Post-July 15

 Pre-Treatment
 Mean among HH
 w/ Children in 0.276 0.594 0.192 0.276 0.594 0.192
 Subsample

 Reported CTC
 Receipt among HH
 53.6% 53.7% 54.0% 100% 100% 100%
 w/ Children in
 Subsample

 Observations 66,401 66,438 66,020 65,305 65,338 64,933
Note: ‘Treated’ households refer to households with children who report in the Pulse as having received the CTC.
All models control for age, education, sex of household head, and wave dummies. Sample limited to respondents in
Pulse reporting 2019 pre-tax income of below $35,000. Standard errors in parentheses. ⵜ p < 0.10, * p < 0.05, ** p <
0.01, *** p < 0.001

povertycenter.columbia.edu 15
POVERTY AND SOCIAL POLICY WORKING PAPER August 30, 2021

 Our initial analysis, presented in Columns 1 through 3 of Table 2, assumes that all

households with children under the $35,000 threshold are eligible to receive the CTC (regardless

of whether they actually report receiving the benefit). The secondary analysis, presented in

Columns 4 through 6 of Table 2, only considers the households with children who report in the

Pulse as having received the first CTC payment (in addition to our control group, childless

households). The secondary estimates more accurately represent our treatment effects among the

treated.

 Consistent with the descriptive trends, our results suggest a significant decline in food

insufficiency for households with children relative to childless households pre- versus post-

rollout of the monthly CTC (see Column 1, Table 2). Specifically, the results suggest that the

intent-to-treat effect amounts to an 8-percentage point decline in food hardship for households

with children relative to childless households after the treatment. For context, this effect size is

around one-third the pre-treatment mean of food insufficiency among households with children

in the sample (pre-treatment mean of 27.6 percent). The effect of the CTC among the treated

(families who report receiving the benefit), as shown in Column 4 of Table 2, is a 12-percentage

point decline, or 43 percent of the pre-treatment mean of food insufficiency for households with

children in the sample. Put simply, the first payment is associated with a substantial decline in

food insufficiency among low-income households with children.

 Households with children also appear to experience a decline in difficulty with expenses

relative to childless households (see Columns 2 and 5 of Table 2); however, the effects are only

significant at the 10 percent confidence level. The effect size is also smaller than that of food

insufficiency, consistent with the descriptive trends. Specifically, the results suggest that the

intent-to-treat effect amounts to a 4-percentage point decline in inability to meet expenses,

povertycenter.columbia.edu 16
POVERTY AND SOCIAL POLICY WORKING PAPER August 30, 2021

roughly 7 percent of the pre-treatment mean (59.4 percent) for this sample. The treatment effect

among families reported receipt of the CTC (Column 5, Table 2) is slightly larger at 5 percentage

points, or roughly 8 percent of the pre-treatment mean. Though these results are modest in

magnitude, it is worth remembering that our analyses follow only one CTC payment.

 In contrast, our results suggest that the CTC does not have immediate effects on missed

rent or mortgage payments among low-income households with children. This null effect is

perhaps unsurprising given evidence that families receiving the benefit are more likely to have

spent their payments on food items (Perez-Lopez, 2021), and that as of this writing our results

estimate the effects of only one payment.

povertycenter.columbia.edu 17
POVERTY AND SOCIAL POLICY WORKING PAPER August 30, 2021

Table 3: Difference-in-differences estimate of effect of expanded CTC on hardship and wellbeing among
households with 2019 total pre-tax income below $35,000; continuous indicator of treatment intensity
 Including Treated & Untreated Only Including Treated
 Households w/ Children Households with Children
 1: Food 2: Difficulty 3: Missed 4: Food 5: Difficulty 6: Missed
 Insufficiency w/ Expenses Rent or Insufficiency w/ Expenses Rent or
 Mortgage Mortgage
 Net Gain from CTC 0.03*** 0.06*** 0.04*** 0.03*** 0.06*** 0.04***
 (0.00) (0.01) (0.00) (0.00) (0.01) (0.00)

 Post-July 15 0.04** 0.09*** 0.01 0.04** 0.09*** 0.01
 (0.01) (0.02) (0.01) (0.01) (0.02) (0.01)

 Net Gain from CTC -0.04*** -0.02ⵜ 0.00 -0.07*** -0.03ⵜ -0.00
 X Post-July 15 (0.01) (0.01) (0.01) (0.01) (0.01) (0.01)

 Pre-Treatment
 Mean among HH
 w/ Children in 0.276 0.594 0.192 0.276 0.594 0.192
 Subsample

 Reported CTC
 Receipt among HH
 53.6% 53.7% 54.0% 100% 100% 100%
 w/ Children in
 Subsample

 Observations 66,401 66,438 66,020 65,305 65,338 64,933
Note: Treatment intensity indicators are divided by 100 for easier interpretation of coefficients. ‘Treated’ households
refer to households with children who report in the Pulse as having received the CTC. All models control for age,
education, sex of household head, and wave dummies. Sample limited to respondents in Pulse reporting 2019 pre-
tax income of below $35,000. Standard errors in parentheses. ⵜ p < 0.10, * p < 0.05, ** p < 0.01, *** p < 0.001.

 Table 3 now applies our continuous indicator of treatment intensity for the CTC

specifically among households with children. Recall that the treatment intensity indicator

captures variation based on pre-tax income and household size (see Appendix B for more

details). The findings are consistent with those from Table 2. Looking at food insufficiency, the

results suggest that a $100 increase in CTC treatment intensity is associated with a 4-percentage

point decline in food insufficiency among families with children (Column 1, Table 3). The effect

size grows to 7 percentage points when examining the effect of the CTC on those families who

report actually receiving the CTC (Column 4, Table 3). Put differently, a $100 net increase in

povertycenter.columbia.edu 18
POVERTY AND SOCIAL POLICY WORKING PAPER August 30, 2021

CTC benefits (adjusted for family size) is associated with a 7-percentage point, or roughly 25

percent, decline in food insufficiency for low-income families with children who report receiving

the CTC.

 The effects are again smaller for difficulty with expenses and missed rent or mortgage

payments. The intent-to-treat effects suggest that a $100 net increase in CTC benefits is

associated with a 2-percentage point (roughly 3 percent) decline in difficulty with expenses

(Column 2, Table 3), while the effect among the treated rises to 3 percentage points (roughly 5

percent decline) (Column 5, Table 3).

povertycenter.columbia.edu 19
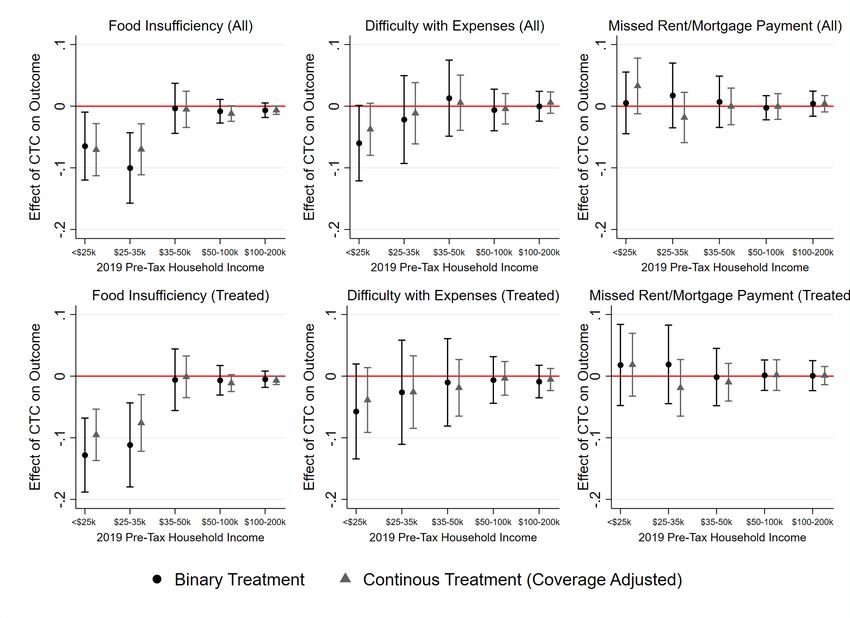
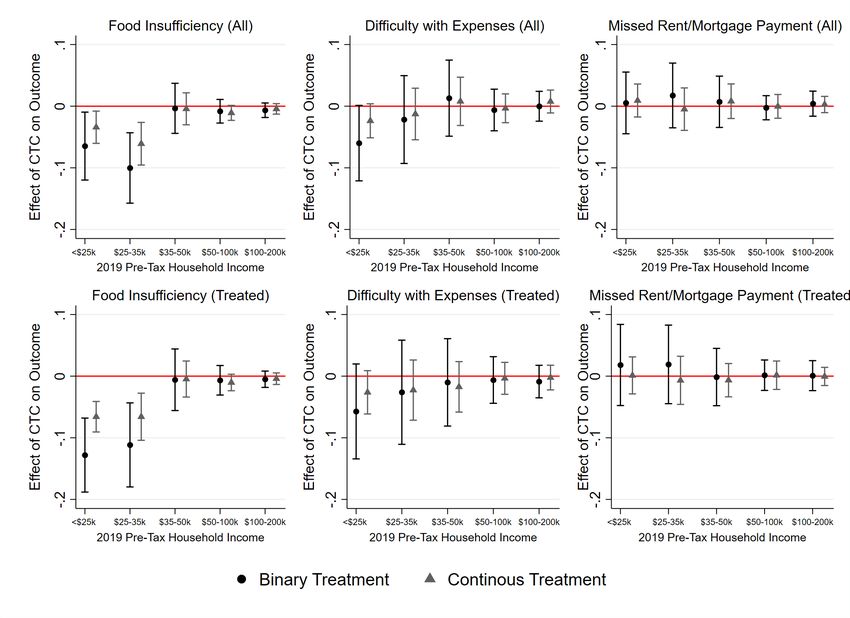
POVERTY AND SOCIAL POLICY WORKING PAPER August 30, 2021

Figure 3: Estimated effect of CTC on outcome by 2019 pre-tax household income cutoff and treatment
specification

Note: Y-axis plots coefficients from interaction of treatment indicator and post-treatment dummy, similar to results
from Tables 1 and 2. All models include age, education, sex, and wave dummies. Separate estimates run for each
income group displayed on Y-axes.

 Recall that the sample in our primary analyses was limited to households with 2019

incomes under $35,000. Figure 3 relaxes that condition and instead visualizes the effect of the

CTC across the income distribution. Each point in Figure 3 represents the coefficient from the

interaction terms for our binary treatment (black circle) and continuous treatment (gray triangle)

when including households with 2019 incomes under $25,000, then between $25,000 to $35,000,

$35,000 to $50,000, $50,000 to $100,000, and $100,000 to $200,000. The upper row presents the

povertycenter.columbia.edu 20
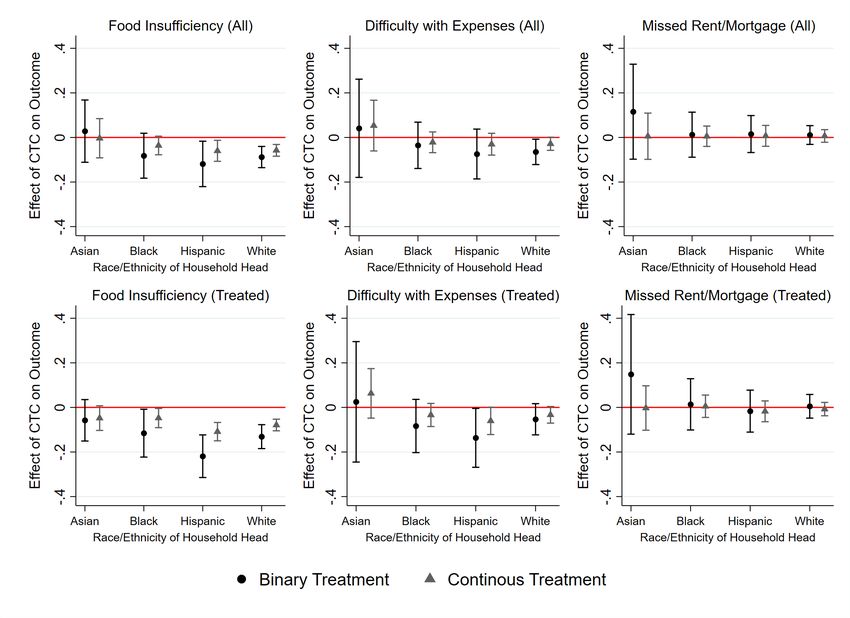
POVERTY AND SOCIAL POLICY WORKING PAPER August 30, 2021

intent-to-treat effects, while the lower row presents the effects among families reporting receipt

of the CTC.

 The findings, in short, demonstrate that the CTC is particularly effective at reducing food

insufficiency for households with children with 2019 pre-tax incomes below $25,000 and

between $25,000 to $35,000. At higher income bins, the policy has no statistically significant

effect. The results are relatively consistent with examining the effects among the treated. These

patterns emphasize that the CTC is particularly effective at reducing food hardship among lower-

income families.

 The middle panels of Figure 3 show a negative point estimate with respect to difficulty in

meeting expenses, suggesting the initial CTC payment may reduce this hardship indicator as

well. Consistent with the regression estimates, however, the effects are not statistically

significant at the 95 percent confidence level. Meanwhile, the null effects of the CTC on missed

rent or mortgage payments is consistent across the income distribution.

 Figure 4 presents the results by race and ethnicity. We again limit the sample the

household heads of the specified race and ethnicity, and then apply the same treatment

conditions as in our primary analysis. The upper-left panel suggests that the intent-to-treat effects

of the CTC on food insufficiency are primarily channeled among Hispanic and White families.

The lower-left panel, however, also finds negative and significant effects for Black families

when examining the effects among the treated. This pattern points to two important observations:

imperfect receipt among low-income Black families prevented the first payment of the CTC

from having stronger effects on Black families in general; however, among Black families who

povertycenter.columbia.edu 21
POVERTY AND SOCIAL POLICY WORKING PAPER August 30, 2021

did receive the benefit, the CTC was effective at reducing food insufficiency. 6 Early evidence

from the subsequent round of the Pulse survey suggest that food insufficiency among Black

families declines more after the second payment of the CTC relative to the first payment; thus,

the effect size may continue to grow as more data become available. 7

Figure 4: Estimated effect of CTC on outcome by race and ethnicity and treatment specification

Note: Y-axis plots coefficients from interaction of treatment indicator and post-treatment dummy, similar to results
from Tables 1 and 2. Sample limited to households with 2019 income under $35,000. All models include age,
education, sex, and wave dummies. Separate estimates run for each group displayed on Y-axes.

6
 Black families report receiving the CTC at a similar rate as other families (see Figure 1) and the effect of the CTC
on food hardship among Black families is not significantly different from that of other families. The evidence here
nonetheless suggests the effect of the CTC would have been stronger for Black families if more received the CTC.
7
 This evidence is from the summary statistics from Wave 35 of the Pulse survey, which the Census Bureau released
on August 25, 2021. The microdata featuring this data are not available at time of writing.

povertycenter.columbia.edu 22
POVERTY AND SOCIAL POLICY WORKING PAPER August 30, 2021

 The middle panels of Figure 4 suggest that the first CTC payment may have contributed

to small reductions in difficulty with expenses among families with children; however, the

results are generally not statistically significant. The strongest negative point estimate is

observed for Hispanic families who received the CTC benefits, but all differences in the

estimated effects among racial and ethnic groups are likewise not statistically significant. Finally,

the right panels suggest that across race and ethnicity, the first CTC payment did not have

immediate effects on missed rent or mortgage payments.

 Our results across race and ethnicity suggest that first CTC payment was broadly

effective at reducing food insufficiency among low-income Black, Hispanic, and White families

who report receiving the CTC. The results also suggest that the reduction effects will continue to

grow as more low-income families gain access to the benefits in subsequent months.

Sensitivity Tests
 A potential threat to our analysis is the effect of seasonality on differential hardship and

wellbeing outcomes for households with children relative to childless households. For example,

general conditions in July, such as summer vacation for many school-age children, may shape

hardship in a way that affects our conclusions. Our read of the evidence suggests that this is

unlikely: prior findings suggest that summer vacations tend to worsen food hardship for

households with children, given the absence of school meals (Huang, Barnidge, and Kim, 2015).

Nonetheless, to test for the effects of seasonality and to add a placebo test to our analysis, we

replicate our results using the same months (April through early August) but using the 2020

version of the Pulse. We designate July 15, 2020, as the timing of our treatment and otherwise

apply the same treatment specifications as in our primary analysis. The results, presented in

Appendix D, show insignificant effects of either treatment for families of any income level

povertycenter.columbia.edu 23
POVERTY AND SOCIAL POLICY WORKING PAPER August 30, 2021

(Figure D1) and for families of any race and ethnicity (Figure D2). These findings rule out that

seasonality is driving our findings and strengthen the likelihood that the expanded CTC is,

indeed, responsible for the improved economic conditions of households with children after July

15, 2021.

DISCUSSION & CONCLUSION

 The transformation of the Child Tax Credit into a more generous and inclusive monthly

payment marks a historic, albeit temporary, shift in the treatment of low-income families with

children within the U.S. welfare state. To identify the early impacts of the monthly payments on

material hardship, this study applied a series of difference-in-differences estimates using microdata

from the Census Household Pulse Survey (Pulse). The findings represent only the initial effects of

the first monthly CTC payment delivered mid-July 2021; thus, they should not be interpreted as

the final effects of the CTC, particularly given that coverage of the program will likely expand in

subsequent months. Nonetheless, our findings from the first payment lead to three primary

conclusions.

 First, we find that the July 2021 CTC payment strongly reduced food insufficiency among

low-income families with children. Specifically, we found that the initial CTC payment was

associated with a 12-percentage point, or roughly 43 percent, decline in food insufficiency among

low-income families with children (those with 2019 pre-tax incomes of less than $35,000) who

received the first CTC payment. Estimates from our treatment intensity indicator suggest that a

$100 increase in household size-adjusted CTC benefits is associated with a 7-percentage point, or

roughly 25 percent, decline in food insufficiency among this group. These changes mark

substantial declines in food hardship. As a result, the share of all low-income families with children

(regardless of whether they received the first CTC payment) experiencing food insufficiency

povertycenter.columbia.edu 24
POVERTY AND SOCIAL POLICY WORKING PAPER August 30, 2021

dropped from 29.8 percent just before the first CTC payment to 20.8 percent after the first payment.

For all households with children (regardless of income), the rate of food insufficiency fell from

13.4 percent to 9.4 percent. Our results provide evidence that the first CTC payment has slightly

reduced families’ difficulties with affording basic necessities, but the effect size is notably smaller

relative to food insufficiency and our findings were generally only statistically significant at the

90-percent confidence level. The first CTC payment did not appear to reduce the share of families

who missed a rent or mortgage payment. This is perhaps unsurprising: rent arrears make up a much

larger sum than the typical monthly CTC payment (Aurand and Threet, 2021), and most families

receiving the CTC payment report spending the benefits on food items (Perez-Lopez, 2021).

 Second, we find the effects of the first CTC payment on food insufficiency are concentrated

among families with 2019 pre-tax incomes below $35,000; perhaps unsurprisingly, the first

payment had little effect on food insufficiency among higher-income groups, as these income

groups are less likely to face hardship in the first place. Moreover, the effects on food insufficiency

are broadly consistent across low-income White, Black, and Hispanic families with children who

received the benefit, though the effects on low-income Asian families were not statistically

significant. Notably, the intent-to-treat effects were not statistically significant for low-income

Black families, though the treatment effects on the treated were large and significant.

 This points to a third important finding in the study: increasing the coverage rate of the

CTC is critical for further reducing material hardship. Though the Department of Treasury reports

that around 80 percent of children in the U.S. received the first CTC payment, self-reported receipt

from the Pulse is closer to 65 percent of all children (U.S. Department of Treasury, 2021a).

Notably, the lowest-income families in the Pulse (those reporting 2019 pre-tax incomes of under

$25,000) report the lowest receipt rate of the CTC. This aligns with concerns that children in

povertycenter.columbia.edu 25
POVERTY AND SOCIAL POLICY WORKING PAPER August 30, 2021

households who have not filed recent federal taxes – including those in families with very low

incomes, disconnected from work or public supports, and/or other challenges – are at greatest risk

of missing out on the initial rounds of monthly payments (Cox et al., 2021). We acknowledge,

however, that the number of children reached by the monthly payments is likely to increase with

time. The US Treasury has already reported the August payment reached 1.6 million more children

than did the one for July (US Department of Treasury, 2021b).

 As more data are available in future weeks and months, we plan to update our analyses to

continue assessing the effects of the monthly CTC payments on material hardship. We anticipate

the results in the present analysis provide only a preview of the potential consequences of the CTC

expansion. As more children receive the benefit in future months, food hardship, and perhaps other

forms of material hardship, may decline further. From the present analysis, we nonetheless

conclude that the first payment of the CTC was largely effective at reducing food insufficiency

among low-income families with children.

povertycenter.columbia.edu 26
POVERTY AND SOCIAL POLICY WORKING PAPER August 30, 2021

References
Acs, G., & Werner, K. (2021). How a Permanent Expansion of the Child Tax Credit Could Affect
 Poverty. Washington DC: Urban Institute. Available from
 https://www.urban.org/research/publication/how-permanent-expansion-child-tax-credit-could-
 affect-poverty.

Aurand, A., & Threet, D. (2021). The Road Ahead for Low Income Renters. Washington DC: National
 Low Income Housing Coalition. Available from https://nlihc.org/sites/default/files/The-Road-
 Ahead-for-Low-Income-Renters.pdf.

Bauer, L., Schanzenbach, D.W., & Shambaugh, J. (2018). Work Requirements and Safety Net Programs.
 Washington DC: The Hamilton Project, Brookings. Available from
 https://www.brookings.edu/research/work-requirements-and-safety-net-programs/.

Bitler, M., Hoynes, H. W., & Schanzenbach, D. W. (2020). The social safety net in the wake of COVID-
 19 (No. w27796). National Bureau of Economic Research.

Brooks-Gunn, J., & Duncan, G. (1997). The Effects of Poverty on Children. The Future of Children,
 7(2):55-71.

Cai, C., Woolhandler, S., Himmelstein, D. U., & Gaffney, A. (2021). Trends in Anxiety and Depression
 Symptoms During the COVID-19 Pandemic: Results from the US Census Bureau’s Household
 Pulse Survey. Journal of General Internal Medicine, 36(6), 1841-1843.

Center on Poverty and Social Policy. (2021). A Poverty Reduction Analysis of the American Family Act.
 Poverty and Social Policy Fact Sheet. New York: Columbia University.

Chaudry, A., & Wimer, C. (2016). Poverty is Not Just an Indicator: The Relationship Between Income,
 Poverty,and Child Well-Being. Academic Pediatrics, 16(3):S23-S29.

Collyer, S., Harris, D., & Wimer, C (2019). Left Behind: The One-Third of Children in Families Who
 Earn Too Little to Get the Full Child Tax Credit. Poverty & Social Policy Brief, 3(6). New York:
 Columbia University Center on Poverty and Social Policy.

Cox, K., Caines, R., Sherman, A., & Rosenbaum, D. (2021). State and Local Child Tax Credit Outreach
 Needed to Help Lift Hardest-to-Reach Children Out of Poverty. Washington DC: Center on
 Budget and Policy Priorities.

Crandall-Hollick, M.L. (2021). The Child Tax Credit: Proposed Expansion in the American
 Rescue Plan Act of 2021 (ARPA; H.R. 1319). CRS Report IN11613. Washington DC:
 Congressional Research Service.

Crandall-Hollick, M.L. (2018). The Child Tax Credit: Current Law. CRS Report R41873.
 Washington DC: Congressional Research Service.

Curran, M.A. (2015). Catching Up on the Cost of Raising Children: Creating an American Child
 Allowance. Big Ideas: Pioneering Change, Innovative Ideas for Children and Families.
 Washington DC: First Focus.

povertycenter.columbia.edu 27
POVERTY AND SOCIAL POLICY WORKING PAPER August 30, 2021

Curran, M.A., & Collyer, S. (2020). Children Left Behind in Larger Families: The Uneven Receipt of the
 Federal Child Tax Credit by Children’s Family Size. Poverty & Social Policy Brief 4(4). New
 York: Columbia University Center on Poverty and Social Policy.

Duncan, G., Morris, P.A., & Rodrigues, C. (2011). Does Money Really Matter? Estimating Impacts of
 Family Income on Young Children’s Achievement With Data From Random-Assignment
 Experiments. Dev Psychol, 47(5):1263-1279.

Garfinkel, I., Sariscsany, L., Ananat, E., Collyer, S., & Wimer, C. (2021). The Costs and Benefits of a Child
 Allowance. Poverty and Social Policy Discussion Paper (Feb.). New York: Columbia University
 Center on Poverty and Social Policy.

Garfinkel, I., Harris, D., Waldfogel, J., & Wimer, C. (2016). Doing More for Our Children: Modeling a
 Universal Child Allowance or More Generous Child Tax Credit. New York: The Century
 Foundation.

Goldin, J., & Michelmore, K. (2020). Who Benefits From the Child Tax Credit? NBER Working Paper
 27940. Cambridge: National Bureau of Economic Research. Available from
 https://www.nber.org/papers/w27940.

Hoynes, H. (2019). The earned income tax credit. The Annals of the American Academy of Political and
 Social Science, 686(1): 180-203.

Huang, J., Barnidge, E., & Kim, Y. (2015). Children Receiving Free or Reduced-Price School Lunch
 Have Higher Food Insufficiency Rates in Summer. The Journal of Nutrition, 145(9):2161–2168,
 https://doi.org/10.3945/jn.115.214486

Marr, C., Cox, K., Hingtgen, S., & Windham, K. (2021). Congress Should Adopt American Families
 Plan’s Permanent Expansions of Child Tax Credit and EITC, Make Additional Provisions
 Permanent. Washington DC: Center on Budget and Policy Priorities. Available from
 https://www.cbpp.org/research/federal-tax/congress-should-adopt-american-families-
 planspermanent-expansions-of-child.

Morales, D. X., Morales, S. A., & Beltran, T. F. (2020). Racial/ethnic disparities in household food
 insecurity during the COVID-19 pandemic: a nationally representative study. Journal of Racial
 and Ethnic Health Disparities, 1-15.

National Academies of Sciences, Engineering, and Medicine (NAS). (2019). A Roadmap to Reducing
 Child Poverty. Washington DC: The National Academies Press.

Pac, J., Nam, J., Waldfogel, J., & Wimer, C. (2017). Young child poverty in the United States: Analyzing
 trends in poverty and the role of anti-poverty programs using the Supplemental Poverty Measure.
 Child Youth Serv Rev, 74:35-49.

Parolin, Z., Collyer, S., Curran, M.A., & Wimer, C. (2021a). The Potential Poverty Reduction Effect of
 the American Rescue Plan. New York: Columbia University Center on Poverty and Social Policy.
 Available from www.povertycenter.columbia.edu/news-
 internal/2021/presidentialpolicy/bideneconomic-relief-proposal-poverty-impact.

povertycenter.columbia.edu 28
POVERTY AND SOCIAL POLICY WORKING PAPER August 30, 2021

Parolin, Z. Collyer, S., Curran, M.A., & Wimer, C. (2021b). Monthly Poverty Rates among Children after
 the Expansion of the Child Tax Credit. Poverty & Social Policy Brief 5(4). New York: Columbia
 University Center on Poverty and Social Policy.

Perez-Lopez, Daniel. (2021). “Economic Hardship Declined in Households With Children as Child Tax
 Credit Payments Arrived.” U.S. Census Bureau. Accessed at
 https://www.census.gov/library/stories/2021/08/economic-hardship-declined-in-households-with-
 children-as-child-tax-credit-payments-arrived.html in August 2021.
Schanzenbach, D., & Pitts, A. (2020). Food insecurity in the census household Pulse survey data tables.
 Institute for Policy Research, 1-15.

Shaefer, H. L., & Edin, K. (2013). Rising Extreme Poverty in the United States and the Response of
 Federal Means-Tested Transfer Programs. Social Service Review, 87(2):250-268.

Shaefer, H.L., Collyer, C., Duncan, G., Edin, K., Garfinkel, I., Harris, D., Smeeding, T.M., Waldfogel, J.,
 Wimer, C., Yoshikawa, H. (2018). A Universal Child Allowance: A Plan to Reduce Poverty and
 Income Instability Among Children in the United States. RSF: The Russell Sage Journal of the
 Social Sciences, 4(2):22-42.

Twenge, J. M., & Joiner, T. E. (2020). US Census Bureau‐assessed prevalence of anxiety and depressive
 symptoms in 2019 and during the 2020 COVID‐19 pandemic. Depression and anxiety, 37(10),
 954-956.

U.S. Department of Treasury. (2021a). “Treasury and IRS Announce Families of Nearly 60 Million
 Children Receive $15 Billion in First Payments of Expanded and Newly Advanceable Child Tax
 Credit.” Accessed at https://home.treasury.gov/news/press-releases/Treasury-and-IRS-Announce-
 Families-of-Nearly-60-Million-Children-Receive-%2415-Billion-Dollars-in-First-Payments-of-
 Expanded-and-Newly-Advanceable-Child-Tax-Credit in August 2021.
U.S. Deptartment of Treasury. (2021b). Treasury and IRS Disburse Second Month of Advance Child Tax
 Credit Payments (Press Release). Washington DC. Available from
 https://home.treasury.gov/news/press-releases/jy0322.

Wheaton, L., Minton, S., Giannarelli, L., & Dwyer, K. (2021). 2021 Poverty Projections: Assessing Four
 American Rescue Plan Policies. Washington DC: Urban Institute. Available from
 https://www.urban.org/research/publication/2021-poverty-projections-assessing-four-american-
 rescue-plan-policies.

Wimer, C., & Wolf, S. (2020). Family Income and Young Children’s Development. Future of Children,
 30(2):191-211.

Ziliak, J. P. (2021). Food hardship during the COVID‐19 pandemic and Great Recession. Applied
 Economic Perspectives and Policy, 43(1), 132-152.

povertycenter.columbia.edu 29
POVERTY AND SOCIAL POLICY WORKING PAPER August 30, 2021

APPENDICES

APPENDIX A: Descriptive Statistics and Comparison to CPS ASEC

Table A1: Descriptive statistics in Census Household Pulse Survey compared to the Current
Population Survey

 Census Household Pulse Survey Current
 Population
 Survey 2019
 All (April Before July 15, After July 15, Annual,
 to August 2021 2021 2019
 2021)
 Female 52.2% 52.3% 51.5% 51.7%
 No High School Degree 6.6% 6.6% 6.6% 12.0%
 College Degree 34.7% 34.8% 34.2% 30.3%
 Age 50.0 50.0 49.7 47.0
 Married 57.9% 58.0% 57.0% 51.7%
 Children in HH (Binary) 36.4% 36.5% 35.4% 35.4%
 Hispanic 15.2% 15.1% 15.7% 15.5%
 Black 10.9% 11.0% 10.9% 12.4%
 Asian 5.6% 5.5% 6.1% 6.1%
 2019 Income: $0-25,000 14.3% 14.1% 15.4% 16.9%
 2019 Income: $25,000-100,000 54.5% 54.7% 53.5% 52.2%
 2019 Income: $100,000+ 31.2% 31.2% 31.1% 30.9%
Note: Pulse estimates from all survey respondents in specified month(s). CPS estimates from sample of
18 to 88 year old individuals in ASEC survey (matching the age span of respondents in the Pulse).

povertycenter.columbia.edu 30
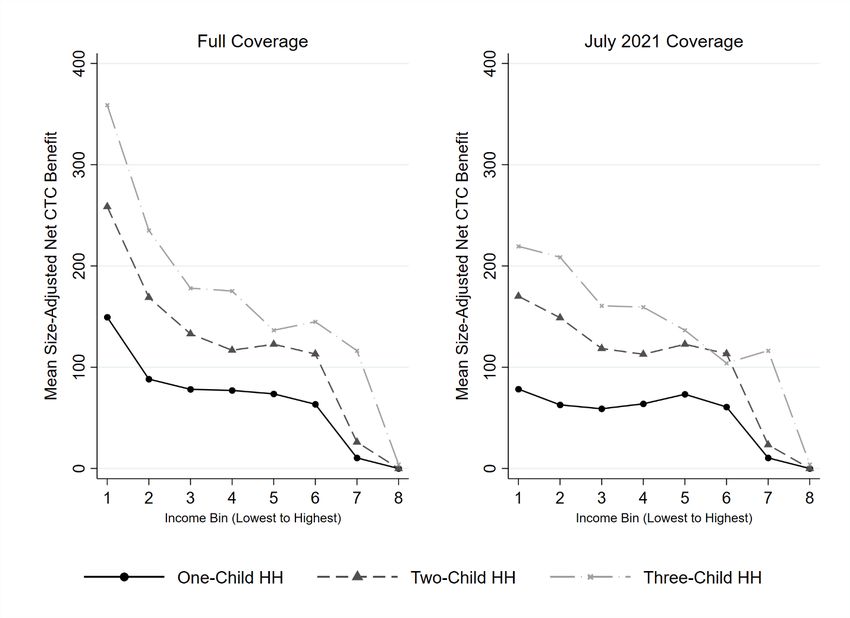
POVERTY AND SOCIAL POLICY WORKING PAPER August 30, 2021

APPENDIX B: Continuous Indicator of Treatment Intensity

 Our continuous indicator of treatment intensity captures variation in expanded CTC

benefits based on age of the children, the number of children in the home, and the relative value

of the new CTC benefits compared to what the family likely earned from the existing CTC prior

to the reform. As detailed in the manuscript, we use data from the 2019 U.S. Current Population

Survey to estimate the mean pre- and post-reform benefit values for bins defined by the number

of adults in the household (ranging from 1 to 10, the number of children in the household

(ranging from 0 to 10), and eight-category pre-tax income bins (from under $25,000 annually

scaling up to more than $200,000 per year). We then import this value into the Pulse, matching

on the number of adults, number of children, and 2019 pre-tax income category of the Pulse

respondents. Below, we visualize the mean size-adjusted net CTC benefits by income bin and

family size.

povertycenter.columbia.edu 31
You can also read