More on the Value of Financial Advisors - RP - Cirano
←
→
Page content transcription
If your browser does not render page correctly, please read the page content below
More on the Value of
Financial Advisors

CLAUDE MONTMARQUETTE
ALEXANDRE PRUD’HOMME

                               2020RP҃04
                       RAPPORT DE PROJET   RP
CIRANO
Le CIRANO est un organisme sans but lucratif constitué en vertu de la Loi des compagnies du Québec.
CIRANO is a private non-profit organization incorporated under the Québec Companies Act.
Les partenaires du CIRANO
Partenaires corporatifs
Autorité des marchés financiers
Banque de développement du Canada
Banque du Canada
Banque Laurentienne
Banque Nationale du Canada
Bell Canada
BMO Groupe financier
Caisse de dépôt et placement du Québec
Canada Manuvie
Énergir
Hydro-Québec
Innovation, Sciences et Développement économique Canada
Intact Corporation Financière
Investissements PSP
Ministère de l'Économie, de la Science et de l'Innovation
Ministère des Finances du Québec
Mouvement Desjardins
Power Corporation du Canada
Rio Tinto
Ville de Montréal
Partenaires universitaires
École de technologie supérieure
École nationale d’administration publique
HEC Montréal
Institut national de la recherche scientifique
Polytechnique Montréal
Université Concordia
Université de Montréal
Université de Sherbrooke
Université du Québec
Université du Québec à Montréal
Université Laval
Université McGill
Le CIRANO collabore avec de nombreux centres et chaires de recherche universitaires dont on peut consulter la liste sur son site
web.
ISSN 1499-8629 (Version en ligne)
© 2020 Claude Montmarquette, Alexandre Prud’Homme. Tous droits réservés. All rights reserved. Reproduction
partielle permise avec citation du document source, incluant la notice ©. Short sections may be quoted without
explicit permission, if full credit, including © notice, is given to the source.Table of Contents
1. Introduction .............................................................................................................................................. 3
2. Updated results ........................................................................................................................................ 6
2.1 Sample description ............................................................................................................................ 6
2.2 Descriptive statistics .......................................................................................................................... 7
2.3 Determinants of having a financial advisor..................................................................................... 10
2.4 Impact of a financial advisor on asset values .................................................................................. 13
3. Types of financial advisors ...................................................................................................................... 25
3.1 Descriptive statistics ........................................................................................................................ 25
3.2 Determinants of having a financial advisor by type of financial advisor ........................................ 27
3.3 Impact of each type of financial advisor on asset values (ln) ......................................................... 35
4. Financial advisors and annual household income .................................................................................. 40
4.1 Descriptive statistics ........................................................................................................................ 40
4.2 Determinants of having a financial advisor by annual household income ..................................... 42
4.3 Impact of a financial advisor on asset values (ln) by annual household income ............................ 45
5. Impact of initial investment (accumulated savings) at the time a household began working with an FA
on its 2018 value of assets ............................................................................................................................. 48
6. Comparison between 2014 and 2018 respondents to both surveys (the survival principal) ................ 52
7. Has increased fee transparency (CRM) in recent years affected the use of a financial advisor? .......... 56
8. Conclusion............................................................................................................................................... 58
21. Introduction
Over the years, inquiring about the role of financial advisors and their value has led to numerous studies
that have somehow produced conflicting results. The industry generally has a more positive viewpoint than
most academic papers do. Along with the increased visibility of advisors’ fees made mandatory by regulatory
authorities, the recent focus on gamma factors rather than the usual alpha and beta benchmarks has,
nonetheless, contributed to a more positive assessment of the profession of financial advisor.
A report from the Investment Funds Institute of Canada highlights that, on average, investors who work
with financial advisors have nearly three times the net worth and four times the investable assets of those
who do not. This observation holds across all age groups and income levels. When asked, 61% of advised
investors strongly agreed that their advisor had a positive impact on the value of their investments and their
investment returns.
An econometric analysis of the data gleaned from a major, original Canadian survey carried out in 2009–
2010 showed that a financial advisor added significant value to a household's financial assets relative to a
comparable household having no financial advisor. Two key elements underlie this positive effect: financial
advisors raise households' savings rates and encourage households to behave in a more disciplined manner
when the stock market drops significantly.
That study has received extensive exposure in general and specialized media. It has been presented at
numerous conferences, and an academic version has been published (see Montmarquette & Viennot-Briot,
2015). 1
A second Canadian survey, conducted in 2013–14, confirmed the previous results. This second survey
avoided the problem of causality in this type of study, that is, determining whether wealth attracts advisers
or whether financial advisors affect the financial wealth of households. As in our previous study, the
discipline imposed by a financial advisor on the financial behavior of households, and the increase in their
savings rates are the dominant factors that help increase the value of their assets relative to comparable
households without an advisor. Also, focusing on a subset of participants in both surveys, we found that the
loss of a financial advisor between 2010 and 2014 was costly: households that retained their advisor saw
the value of their assets increase by 16.4%, versus only 1.7% for the assets of households that abandoned
1
Montmarquette C., & Viennot-Briot N. (2015). “The Value of Financial Advice,” Annals of Economics and Finance, 16(1), p.69–
94.
3their advisor during this period. Thus, the value of financial advice far exceeds the traditional alpha and beta
measurements discussed in the literature. This study has also been widely distributed by the industry and
has been published in the same scientific journal as the previous study: Montmarquette & Viennot-Briot
(2019). 2
In the two previous studies, we emphasized a potential limitation on the estimation of the extent of the
financial advisor’s effect. Although we control for many factors, we have recognized that the positive effect
of a financial advisor's services, notably on additional savings, may be overestimated due to the lack of
measurable characteristics regarding a household’s desire to save and invest.
A third survey, 2017–2018, conducted under similar conditions as the previous ones, afforded us another
opportunity to validate the robustness of our initial results in a new financial and economic context.
Furthermore, new questions helped us to gain a better understanding of the intrinsic willingness of survey
respondents to invest with or without the help of a financial advisor. In short, we hoped to correct any
potential bias described in the previous paragraph.
Associated topics on the use of a financial advisor and its impact were also studied:
1. The determinants of choosing a specific type of advisor and evaluating the impact differentially on
wealth due to the different types of financial advice (advice in a bank branch vs. broker vs. individual
advisor vs. automated advisor, etc.).
2. The determinants of choosing a financial advisor and the impact on the value of assets by the level
(broad category) of annual household income.
3. Does a financial advisor's impact depend on the level of initial financial wealth?
4. From a subset of respondents who replied to both the 2014 and 2018 surveys, how did changing the
household situation concerning the involvement or not of an FA affect the value of the household’s
financial assets (referred to as the survival principle in the 2014 survey). For example, was there a
difference in asset values between households who retained their advisor relative to households
who dropped their advisor over that period?
2Montmarquette C., & Viennot-Briot N. (2019). “The Gamma Factor and the Value of Financial Advice,” Annals of Economics and Finance, 20–
1, p.391–415.
45. Has increased fee transparency (CRM2 - Client-Consumer Relationship Model regulation) in recent
years affected the use of a financial advisor?
We refer readers to our previous studies for an exhaustive review of the literature on the impact of a
financial advisor in general. Further references will be added as we proceed with the current study.
The associated topics mentioned earlier should be regarded as breaking new ground in the literature on
financial advice, as was the case of the survival principle in the second study.
Following the introduction, Section 2 discusses the 2018 survey and presents the updated results (the
determinants of having a financial advisor and the impact of a financial advisor on the value of assets). In
Section 3, we replicate in part the analysis of Section 2 by type of financial advisor. We follow a similar
pattern in Section 4 by examining the impact of a financial advisor by level of annual household income. In
Section 5, we investigate the impact of the initial investment (financial wealth) at the time the household
began working with an FA on the 2018 value of assets held by households. In Section 6, we revisit the
survival principle by looking at household investment behavior and the consequences of respondents’ use
or not of the services of a financial advisor between 2014 and 2018. In Section 7, we explore whether an
increase in fee transparency (client-customer relationship model regulation, or CRM2) in recent years has
affected the use of a financial advisor. Section 8 sets out our conclusions.
In short, households in all income groups benefit from having a financial advisor. The impacts of FA
involvement depend on the economic and financial contexts. Gamma factors continue to play their role.
52. Updated results
2.1 Sample description
The database used for the analysis presented in this document is derived from the data cleaning
performed by a team at the Retirement and Savings Institute (HEC Montréal) using the filters set out
below. The following criteria were used for inclusion in the database:
I. Household with at least $1,000 in financial assets
II. Annual income of less than $250,000
III. Savings rate of under 90%
IV. Retired individuals receiving less than $26,000 from government transfers
Of the 2,675 respondents who were not screened out by the selection filters, 189 individuals who had
been directly approached by a financial advisor were excluded. The final number used for the 2018 data
analysis was therefore 2,486 (2,675 о 189). So, in this report, the term “advised” means “advised but
not approached.”
Figure 1. Proportion of households having a financial advisor (FA), whether they had been
approached or not, 2018
6In the full sample, 48.9% of the households were advised households. 3 To avoid a causality issue, the
proportion of advised households retained in our analyses was 41.8%.
2.2 Descriptive statistics
Table 1. Descriptive statistics on the value of financial assets, 2010, 2014 and 2018
2010 2014 2018
Advised Non-Advised Advised Non-Advised Advised Non-Advised
Observations 1,785 1,825 487 1,097 1,118 1,368
Median ($) 101,000 24,000 135,000 25,000 320,000 169,050
Mean ($) 193,772 93,384 273,091 79,634 531,238 315,804
SD ($) 281,874 264,005 427,866 173,901 748,267 560,240
Table 1 suggests substantial differences among the three surveys. The percentage of advised
households in 2018 is closer to the 2010 survey than the 2014 one.4
In 2018, the median and mean values of respondents’ financial assets were substantially higher for all
the survey participants than in the previous years, with a wider distribution in asset values (standard
deviation: SD). 5
For 2014, the median value of the financial assets of advised respondents was 5.4 times the median
value of the assets of non-advised respondents, compared with 4.21 in 2010. In contrast, the equivalent
factor was only 1.89 times in 2018. Essentially, the relationship was the same for the mean values of
assets between advised and non-advised respondents.
3 A 2017 survey conducted by the Innovative Research Group Inc., estimated that 42% of Canadians have a financial advisor. Investor
Research Group, Inc. (2017), “2017 Investor Index.” Report prepared for the Canadian Securities Administrator, Investor Education
Committee
4 In the 2010 survey, however, there was no way of distinguishing between households who were approached by a financial advisor as
opposed to those that had chosen their own advisor. Also, in 2010, respondents were restricted to the 25-to-65 age group.
5 Financial assets include RRSPs (Registered Retirement Savings Plans) excluding any Group RRSP assets; TFSAs (Tax Free Savings Accounts)
excluding any Group TFSA assets; other registered savings plans (for instance, Registered Education Savings Plan (RESP), Registered
Disability Savings Plan (RDSP), Locked-In Retirement Account (LIRA), Registered Retirement Income Fund (RRIF), Locked-In Retirement
Income Fund (LRIF), Life Income Funds (LIF)); and other savings/investments not included previously (cash, bank accounts, non-registered
investment accounts, etc.)
7There are good grounds for questioning the 2018 sample, in light of the major increases observed in
financial wealth, although the sample was set on the same basis as before and with the same survey
firm (Ipsos Reid). 6
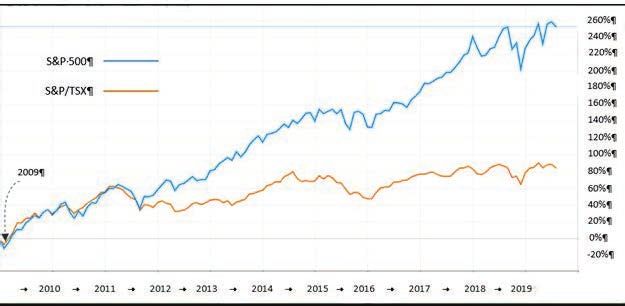
This increase in financial wealth is supported by Figure 2, showing significant rises in the Canadian and
U.S. stock market indices over the last decade.
6 In 2018, many households with or without a financial advisor declared financial assets of more than $3 million. The data filtering and
the sampling procedure used made it impossible to consider the sample to be representative of the Canadian population, even after many
trials with different weightings were run.
8Source: https://tradingeconomics.com
Figure 2. Change in Canadian and U.S. stock market indices, 2009 to 2019
Also, a recent study (Baldwin, 2019) has shown that over the period from 1999 to 2016, the wealth (net
worth and total assets) of Canadians approaching retirement who were in the middle range of the
wealth distribution grew quite strongly in constant dollars. 7 The author points out that the growth in
wealth was notably stronger than income growth over the same period, driven in part by the increasing
value of primary residences. He notes that other forms of wealth also grew strongly, including
retirement wealth.
Figure 3 shows the distribution of the value of assets for 2018 that would prompt a household to seek
financial advice. Households start FA relationships with only modest asset levels (the median initial
investment is $11,000), while non-advised households believe they need more assets to seek advice.
Among the non-advised, almost half (47.1%) feel they need $50,000 plus to qualify, and 46.9% of non-
advised households declared that no amount of assets would make them seek advice. Those statistics
are comparable to 2014.
7
Baldwin B. (2019). The Evolving Wealth of Canadians Approaching Retirement, C.D. Howe Institute, working paper.
9Figure 3. Proportion of households who seek or would be prompted to seek financial advice, based
on asset values, 2018
With a probit regression (with the observed value = 1, if the answer is no amount would make me seek
an FA; 0 otherwise), we find that households with annual savings between $3,000 and $10,000, with
workplace pension, carrying life insurance, being financially literate, and from British Columbia are less
likely to be among this group. However, those who declared being suspicious of individuals and having
a preference for the present are more likely to declare that no amount will make them seek an advisor
(see Table A1 in Appendix).
2.3 Determinants of having a financial advisor
People who have a financial advisor derive a positive utility from this decision, as having an advisor has
a financial cost:
U i* X i E Ki (1)
where
X i is a set of explanatory variables and Ki an error term.
This utility is not directly observed, but the observable counterpart variable of this latent variable comes
from our survey asking respondents to report whether they have an advisor or not. A respondent i
having an advisor is coded as FAi 1 ; FAi 0 , otherwise.
10Assuming that Ki is a standardized normal function, the determinants of having a financial advisor are
estimated by a binary probit.
Table 2. Determinants of having a financial advisor, 2018
Probit model and post-estimation margins
Non-Advised (n = 1,368) vs. Advised (n = 1,118) Coefficient Margins
Household’s annual income before taxes (Ref.: $10,000 0.252*** 0.100***
Wage (Ref.: No wages and salaries)
Has wages and salaries -0.035 -0.015
Workplace pension (Ref.: No workplace pension)
Has workplace pension 0.034 0.012
Work situation (Ref.: Other)
Full time -0.262*** -0.103***
Retirement (Ref.: Not retired)
Fully retired 0.038 0.013
Life insurance (Ref.: No individual life insurance)
Has individual life insurance 0.176*** 0.068***
Mistrust of individuals (Ref.: Is not suspicious of individuals)
Is suspicious of individuals -0.172*** -0.068***
Financial literacy (Ref.: Wrong answer)
Right answer 0.255*** 0.101***
Economic literacy (Ref.: Wrong answer)
Right answer 0.032 0.013
Numeracy (Ref.: No right answer out of 3)
1 right answer out of 3 -0.084 -0.054**
2 right answers out of 3 -0.166** -0.010
3 right answers out of 3 -0.245*** -0.038
Gender (Ref.: Female)
Male -0.181*** -0.072***
Educational level (Ref.: Does not have post-secondary diploma)
Has post-secondary diploma 0.118 0.048
Age (Ref.: Under 45)
45–54 0.346*** 0.135***
55–65 0.608*** 0.239***
65 or over 0.671*** 0.264***
Income earners (Ref.: 1)
2 -0.068 -0.028
3 or more 0.090 0.035
11Table 2 (cont’d)
Coefficient Margins
Family situation (Ref.: Single individual)
Couple with no children -0.061 -0.024
Couple with children -0.145 -0.057
Single parent 0.259* 0.104*
Other family types 0.004 0.002
Regions (Ref.: Atlantic)
Quebec -0.182 -0.071
Ontario -0.100 -0.039
Manitoba and Saskatchewan -0.016 -0.006
Alberta -0.132 -0.051
British Columbia -0.075 -0.030
Constant -0.783*** -
*** p < 0.01 ** p < 0.05 * p < 0.100 Observations 2,486
Pseudo r2 0.067
a) Financial literacy: Do you think that the following statement is true or false? “Buying a single company stock usually provides a safer
return than a stock mutual fund.” True, buying a single company stock usually provides a safer return than a stock mutual fund; False,
buying a stock mutual fund usually provides a safer return than a single company stock; I do not know; I’d rather not answer.
b) Economic literacy: Suppose you had $100 in a savings account, and the interest rate was 2% a year. After 5 years, how much do you
expect your account to contain if you let the money grow during this time?
More than $110; Exactly $110; Less than $110; I do not know; I prefer not to answer.
c) Numeracy: 1) A stick and a ball cost $1.10 in total. The stick costs $1.00 more than the ball. How much does the ball cost? 2) If it takes
5 minutes for 5 machines to make 5 gadgets, how long would it take 100 machines to make 100 gadgets? 3) In a lake, there is a water lily
area. Every day the area doubles in size. If it takes 48 days for the area to cover the entire lake, how many days would it take to cover half
of the lake?
In Table 2, the first numerical column gives the coefficient estimates of the probit model, as done in
our previous papers (Montmarquette & Viennot-Briot, 2015, 2019). The results in terms of the variables
that are statistically significant, and the size of the coefficient estimates are generally similar. However,
the goodness-of-fit measure (pseudo r2 = 0.067) is lower in 2018. In numerical column 2, we have
computed the increase in percentage points on the probability of having an advisor associated with all
the explanatory variables of the model. For example, a household with an annual income before taxes
of greater than $90,000 is 18.3 percentage points more likely to have a financial advisor, relative to a
household with an annual income before taxes of less than $35,000 (the reference income variable).
Better financial literacy increases this probability by 10.1 percentage points and by 10.4 for single
parents. 8 Survey respondents older than age 44 had a significantly higher probability of having a
8Charitha K.L. (2018). “Review of Impact of Financial Literacy and Self-confidence on Customer Decision of Accepting Financial Advisory
Services,” International Journal of Advancements in Research & Technology, 7(7), p.218–224.
In his review paper (Montmarquette and Viennot-Briot, 2015, is quoted), Charitha found that people with higher financial literacy were
more likely to seek financial advice. At the same time, he noted that some studies showed that less literate people also sought financial
advisory services as a substitute for financial literacy. He also observed that most studies showed that less self-confidence in financial
matters (i.e., less self-financial literacy) was a reason for greater demand for financial advice. One important conclusion that Charitha’s
paper draws is that the impact of financial literacy and self-confidence on financial advice is different in different contexts.
12financial advisor: around 25 percentage points higher for those 55 and over relative to respondents
aged 45 or under. In relation to females, males are 7.2 percentage points less likely to declare using the
services of a financial advisor.
2.4 Impact of a financial advisor on asset values
To assess the impact of a financial advisor on the value of assets, consider the linear equation (2) that
follows the probit model of having an advisor or not in a two-equation recursive model:
ln Ai yiT D 0 FAi D1 FA * 4 to 6 years D 2 FA *7to14 years
D 3 FA *15 years or more H i
(2)
In equation (2), the effect of the financial advisor, FA, on the level of assets (expressed in logarithmic
terms), ln A, is also influenced by the length of time a household has had a financial advisor. 9 Positive
and statistically significant parameter estimates for the ɲ coefficients suggest that a financial advisor
adds to a household’s financial assets, depending on the amount of time the household has had a
financial advisor. In the equation, y is a set of other explanatory variables, and ɸ is the error term.
In this configuration, the choice of having an advisor, FA, is endogenous and therefore predicted using
the parameter estimates of the probit regression above. Substituting the predicted value for FA, the
OLS estimation results of equation (2) are given in Table 3 for the three surveys.
9 To be part of the sample, households needed at least $1,000 in assets. To obtain a normal distribution for the error term, a semi-
logarithmic equation is used.
13Table 3. Determinants of the value of assets (ln), 2010, 2014 and 2018
Linear regressionT (Dep.: ln of the value of assets) 2010 2014 2018
T
Using predicted values for FA Coefficient Coefficient Coefficient
Financial advisor (Ref.: Non-Advised)
Advised -0.123 0.468*** 0.583***
Financial advisor X Tenure (Ref.: Advised < 4 years)
Advised X 4 to 6 years 0.456*** 0.837*** 0.073
Advised X 7 to 14 years 0.687*** 0.504** 0.181**
Advised X 15 years or more 1.006*** 0.894*** 0.257***
Household’s annual income before taxes (Ref.:Table 3 (cont’d)
2010 2014 2018
Coefficient Coefficient Coefficient
Income earners (Ref.: 1)
2 -0.216*** -0.090 -0.082
3 or more -0.379*** -0.096 -0.156
Family situation (Ref.: Single individual)
Couple with no children -0.084 0.001 0.075
Couple with children 0.009 -0.052 -0.103
Single parent -0.277* -0.052 -0.180
Other family types -0.057 0.205 0.174
Regions (Ref.: Atlantic)
Quebec 0.030 0.055 -0.128
Ontario 0.295*** 0.272* 0.101
Manitoba and Saskatchewan 0.214* 0.166 -0.068
Alberta 0.424*** 0.048 0.187
British Columbia 0.395*** 0.278 0.116
Constant 8.947*** 9.821*** 10.149***
*** p < 0.01 ** p < 0.05 * p < 0.100. Observations 3,610 1,584 2,486
r2 0.393 0.320 0.268
a: Preference: Suppose you have the choice between an amount of $500 made available to you in a month or a higher amount
made available to you in 4 months. What is the amount of money you would expect in 4 months to compensate for the $500 not
received by the end of the first month? Box: [ENTER NUMBER – RANGE $500 TO $1000] Or: No amount of money later could
compensate for me not getting $500 one month from now. 10
As for the previous surveys, a financial advisor has a positive impact on the value of assets for
households with a financial advisor relative to households without an advisor, after all the other factors
that might affect the respondents’ financial assets have been controlled for.
From the coefficient estimates of Table 4 for all the variables involving FA, we computed the percentage
increase in asset size associated with a financial advisor and compared the results for the three
surveys. 11
10The distribution of answers: 24% would require between $500 and $575; 13% would require between $576 and $750; 14% would
require between $751 and $1,000; 49% declared that no amount would be enough and would take the $500 after 1 month.
11 From the estimated coefficients of equation (2), we predicted the ln of assets of a household that had had a financial advisor for less
than 4 years, that is FA = 1, with the following equation: ln Ai yi T D 0
Without a financial advisor, FA = 0: ln A j y j T .
The difference in the ln of assets for the same household or a comparable household in all respects (same income, age, etc.) except for
the involvement of a financial advisor is:
ln Ai ln A j D 0 . Rising to the exponential on both sides: Ai / Aj exp(D 0 ) . For example, for 2018, with D0 0.583, the expected ratio
of assets is equal to 1.791. In percentage terms, a household with an advisor for less than 4 years
benefited from a 79.0% increase in its asset size relative to a “comparable” household without an advisor. Similar computations were
performed for the other cases.
15Table 4. Percentage increase (%) in asset size associated with a financial advisor, 2010, 2014 and
2018
Tenure with a financial advisor 2010 2014 2018In Table 3, we note that the coefficient estimates of the variable “preference for the present”
significantly explain the higher value of assets for a respondent willing to postpone direct consumption
for a small financial return. However, it does not affect the coefficient estimates of the financial advisor
variables when excluded from the regression: the coefficients of all the financial advisor variables
(including the tenure variables) remain almost the same with or without this “preference for the
present” variable in the regression. 12
Finally, level of education plays a positive role in explaining the higher value of assets among
respondents.
In previous studies, along with the discipline factor, we discussed how the savings rate is a primary
means of increasing assets. We also noted that one strategy for improving portfolio performance is
diversification of financial investments, which are associated with studies of the ratio of non-cash over
total investments. Finally, we conjectured that a strategy that minimizes tax impact could also increase
the value of one’s assets. In this regard, the ratios of RRSP (Registered Retirement Savings Plan) and
TFSA (Tax Free Savings Account) investments over total investments were analysed.
Figure 4 shows respondents’ observed savings rates and asset allocations in the 2014 and 2018 surveys.
Statistically, significant differences emerged between non-advised and advised respondents’ savings
rates and allocation of assets into non-cash investments. When we combined the tax-reduction
strategies of RRSPs and TSFAs, the difference in ratios between advised and non-advised households
was not significant. However, the difference in the savings rates between advised and non-advised
households was lower in 2018, with a difference of only 1.9 percentage points compared with 4.8 in
2014.
12
The negative coefficient estimates for the respondents asking more money to accept waiting 4 months have p-value <
0.01. Also the R2 decreases from 0.268 when included to 0.263 when the “preference for the present” variable is excluded
from the regression.
17Figure 4. Savings discipline and mean asset allocation, 2014 and 2018
The determinants of these ratios were measured with Type II Tobit models. The results are presented
in the first six columns of Table 5. 13 For each ratio, the probit regression concerns the probability of a
positive ratio (point estimates). The regression relates to the determinants of the value of each ratio
conditional on a positive ratio. 14 In all regressions, along with other explanatory variables serving as
controlled variables, the variable of interest is the involvement of advisors. This latter variable is
predicted from the regression of Table 2.
The advisor-predicted variable increases the probability of a positive savings rate, but, contrary to the
previous surveys, the value of the savings rate when positive is unaffected. 15 Also, in 2018, the advisor-
predicted variable increases the probability of a positive ratio of non-cash investments over total
investments. The value of the proportion of tax-related strategic investments over total investments is
insignificant with the involvement of a financial advisor. Given the influence of financial advice on some
13The Tobit model involved censored variables. For all ratios, there was an important mass point of observations at zero.
14Selection bias is therefore accounted for with the inverse Mills ratio in Heckman’s two-step estimation procedure.
15Burke and Hung (2015) raise the issue of the direction of causality between advisors and savings: advisors increase savings, but
individuals with greater savings are more likely to seek out financial advice. Our study accounts for this endogeneity question by
instrumenting the financial advisor variable in the saving equations from the probit model of Table 2, where saving appears as an
explanatory variable.
18of these ratios, the next step was to determine whether the predicted values of these ratios help explain
asset levels.16
The semi-logarithmic regressions reported in the final column of Table 5 indicate positive and
statistically significant elasticity estimates for the savings rate and the non-cash to total investment
ratio. Thus, a one percentage point increase in the savings rate and the non-cash to total investment
ratio increased the level of assets by 2.94% and 5.74% respectively in 2018. 17 Negative but not
statistically significant elasticity estimates were observed for the tax-reduction investments to total
investment ratios.
16 While many variables show their expected coefficients (has wages and salaries, works full time, level of numeracy), it can be seen that
contrary to our hypothesis, the variable “preference for the present” has no impact on the savings rate. A possible explanation for this
variable increasing the value of assets, as seen in Table 3, for the respondents showing more patience, may be associated with them not
rushing their decision when the stock market falls, or the economic situation deteriorated. Possibly, another expression of the discipline
gamma factor discussed before. Other variables yield new results: for example, a household’s income before taxes negatively affects the
savings rate when positive; it was insignificant in the previous surveys.
17This is the most parsimonious regression. The first ratio remains statistically significant, but not the non-cash to total investment ratio
when 31 controlled variables are added. Collinearity issues might account for this result. Note that with the full model, the adjusted R-
squared shifts from 0.153 to 0.227.
19Table 5. Determinants of savings rate, non-cash to total investments ratio, RRSP to total investments ratio
and logarithm of financial assets (Type II Tobit models and conditional least squares)
Non-cash over total RRSP/TFSA over total
Savings rates Assets (In)
investments investments
Non-cash RRSP/TFSA
Savings Has non- ratio over Has ratio over
Has savings
rates cash total RRSP/TFSA total
investment investment
Probit Regression Probit Regression Probit Regression Regression
Savings rate (P) 2.939***
Non-cash over total investments (P) 5.741***
RRSP/TFSA over total investments (P) -0.245
Financial advisor (P) (Ref.: Non-Advised)
Advised 1.272*** -0.018 0.317** -0.024 0.268* -0.038
Household’s annual income before taxes (Ref.:Numeracy (Ref.: No right answer out of 3)
1 right answer out of 3 0.233*** -0.016 -0.011 -0.002 -0.102 -0.019
2 right answers out of 3 0.321*** -0.018 0.148 0.005 -0.083 -0.008
3 right answers out of 3 0.547*** -0.015 0.271** -0.005 0.098 -0.052***
Preference for the present: the amount of money you would
expect in 4 monthsa (Ref.: $500–$575 (0–15%))
$576–$750 (16–50%) -0.092 -0.001 -0.027 0.015 0.087 0.010
$751–$1,000 (51–100%) 0.046 -0.006 -0.031 -0.003 -0.055 0.002
No amount sufficient: Take $500 after 1 month -0.112 -0.001 -0.126 -0.005 -0.054 0.022
Gender (Ref.: Female)
Male 0.237*** -0.004 -0.188** -0.013 0.097 0.006
Educational level (Ref.: Does not have post-secondary diploma)
Has post- secondary diploma -0.209** -0.004 0.015 0.003 0.261** -0.055**
Age (Ref.: Under 45)
45–54 -0.461*** -0.006 0.435*** 0.082*** 0.061 -0.014
55–65 -0.677*** 0.009 0.383*** 0.109*** -0.117 -0.013
65 or over -1.019*** 0.024 0.505*** 0.150*** -0.311 -0.068*
Income earners (Ref.: 1)
2 0.066 -0.012 0.085 -0.014 -0.081 0.027
3 or more -0.295** -0.010 -0.141 -0.001 -0.020 0.050*
Family situation (Ref.: Single individual)
Couple with no children -0.054 -0.009 0.008 -0.014 0.058 0.030
Couple with children 0.079 -0.027 -0.024 -0.027 -0.056 -0.013
Single parent -0.546*** 0.007 -0.455** -0.004 0.122 -0.027
Other family types 0.124 -0.011 -0.128 -0.015 0.267 -0.035
21Regions (Ref.: Atlantic) Quebec 0.134 -0.007 0.007 -0.010 -0.090 0.050 Ontario 0.015 0.014 0.127 -0.030 0.233 -0.005 Manitoba and Saskatchewan 0.059 -0.004 0.241 -0.033 0.048 -0.009 Alberta 0.098 0.020 0.119 -0.058*** 0.477* -0.041 British Columbia -0.127 0.028 0.008 -0.039* 0.408* -0.045 Constant -0.739*** 0.589*** 0.434 0.697*** 0.742** 0.790*** 7.543*** Inverse of Mills ratio -0.152 0.102 -0.313 Observations 2,486 2,486 2,486 2,486 R-Squared 0.152 Standard errors in parentheses *** p < 0.01, ** p < 0.05, * p
From the results of Table 5, the effect of having a financial advisor on the level of financial assets can
be isolated from the predicted values of those ratios. First, consider the savings rate variable. The effect
of having a financial advisor on the predicted expected savings rate can be computed. With P the
probability of a positive savings rate, then the expected value of the savings rate SR is given by:

E SR          P SR ! 0  1  P 0 P SR ! 0 , as the savings rate is either positive or zero. Taken at

mean values, differentiating this last equation (in a discrete form) with respect to the financial advisor
variable, FA, yields equation (3):

' E ( SR)         'P          ' SR ! 0
                      S !0 P          .                                                                           (3)
  ' FA           ' FA           ' FA

Where,

 'P
     is the marginal effect of having a financial advisor on the probability of a positive savings rate;
' FA

                is the mean savings rate of all the respondents;

            is the mean probability of a positive savings rate of all respondents;

' SR ! 0
         is the effect of having a financial advisor on the value of a positive savings rate.
  ' FA

To illustrate, from the probit regression, the marginal effect of having a financial advisor on the
probability of a positive savings rate is estimated to be 47.0 percentage points. Specifically, a
respondent having an advisor increases the probability of having a positive savings rate by 47.0
percentage points above a “comparable” non-advised respondent. 18 However, from Table 5, the effect
of having a financial advisor on the value of a positive savings rate is nil (the coefficient estimate is
statistically not significant).

Solving for equation (3) with S > 0 and a mean value of 19.9% (the second term of the equation is zero,
as the effect of an advisor on the value of a positive savings rate is statistically not different from zero)
indicates that the effect of having an advisor on the expected savings rate (holding everything else

18                                                                                                           f
     Using a probit model to obtain the marginal effect of a variable x, it is necessary to differentiate          1      § 1 · with
                                                                                                             ³G
                                                                                                             xi   2S
                                                                                                                      exp ¨  x 2 ¸ ds
                                                                                                                          © 2 ¹
respect to x. Here x is having a financial advisor.

                                                                                                                                   23
constant) is a 9.35 (= 0.47*19.9%) percentage point increase in the expected savings rate. 19 This impact
is considerably lower than the one found in the 2014 survey (20.04), which was considered unusually
large. Repeating the exercise for the expected non-cash ratio suggests that having an FA increases this
ratio by 3.05 (= 0.036*84.7%) percentage points (it was nil in 2014). 20 Another difference is the effect
of an FA on the expected “Registered Retirement Savings Plan + Tax Free Savings Account” ratio: it was
negligible in 2018, but negative in 2014 (-5.38 percentage points).
From these numbers and using statistically significant coefficient estimates of the last column of
Table 5, it can be inferred that for two “comparable respondents,” the one with a financial advisor will
have on average 57% more financial assets than, or 1.57 times the level of financial assets of, the non-
advised respondent. 21 As far as we can tell, this relatively low percentage from the three surveys
reflects the fact that in 2018, the average savings rate between advised and non-advised narrowed over
that period. Compared with Table 4, this value is lower than the lowest percentage increase in asset
size associated with a financial advisor for 4 years or less in 2018. To explain the difference, we might
examine new gamma factors (tax-related issues will be one area to look at) or show that the advisor
did better in terms of alpha and beta factors.
19 Only the coefficient estimates statistically different from zero are considered.
20 Interestingly, Foerster S., Linnainmaa J., Melzer B., and Previtero A., in their working paper of January 2018 on Financial Advisors and
Risk-Taking, found using the Canadian Financial Monitor (CFM) survey of households (2010, but this date in not directly specified in their
paper) that advisors facilitate greater stock market participation and risk-taking. Specifically according to the authors: “Advisors’ influence
on stock market participation largely accounts for the increase in the share of risky assets. A household’s likelihood of owning any risky
assets (stocks and mutual funds) increases by 59 percentage points by having an advisor. The likelihood of having investments in chequing,
savings and money market accounts falls by 28 percentage points.” These 28 percentage points are large compared with our observed
data: on average, the difference is 8.8 percentage points between advised and non-advised households.
21 For identical households, i with a financial advisor and j without, the difference in the logarithms of assets is a function of the
incremental values of the savings and non-cash ratios due to having an advisor (non-statistically significant coefficient estimates of the
§A ·
RRSP ratio were not considered). Thus: ln Ai ln Aj ln ¨ i ¸¸ 2.939*0.0935 5.741*0.0305 0.45
¨A
© j ¹
Raising to the exponential on both sides: Ai 1.57 .
Aj
243. Types of financial advisors
In this section, five questions are investigated: (1) What type of financial advisor was chosen by the
survey respondents who reported having a financial advisor? (2) What were the determinants of
choosing each specific type of advisor relative to those who did not choose any? (3) When an advisor
was chosen, what factors distinguished a household choosing one type relative to others? (4) Were
investors better off with any type of financial advisor relative to those survey respondents who
preferred not to have an advisor? (5) What type of financial advisor was more efficient in terms of
positively impacting the value of investors’ assets?
3.1 Descriptive statistics
Table 6 lists the 13 types of advisors reported by our respondents who said they used the services of a
financial advisor. However, bank branch advisor, bank affiliated broker and an FA not affiliated with a
bank or insurance company accounted for 78.5% of all types of financial advisors identified by the 1,118
advised participants in the 2018 survey.
Table 6. Distribution of respondents by specific type of financial advisor, 2018
n %
Total 1,118 100.0
1. Bank branch advisor 257 23.0
2. Bank affiliated broker 320 28.6
3. Private banking* 45 4.0
4. FA affiliated with an insurance company 85 7.6
5. FA not affiliated with a bank or an insurance company 301 26.9
6. Private investment advisor* 29 2.6
7. Robot advisor* 1 0.1
8. Discount brokerage* 11 1.0
9. Employer/Workplace pension provider* 5 0.4
10. Accountant* 6 0.5
12. Family and friends* 43 3.8
13. Other type of advisor* 15 1.3
*Groups with less than 5% of observations
25For analytical purposes, some of the categories were regrouped, as shown in Table 7.
Table 7. Distribution of respondents by type of financial advisor (regrouped), 2018
n %
Total 1,118 100.0
1. Bank branch advisor (1) 257 23.0
2. Bank affiliated broker (2) 320 28.6
3. Private banking (3) or private investment advisor (6) 74 6.6
4. FA affiliated with an insurance company (4) 85 7.6
5. FA not affiliated with a bank or an insurance company (5) 301 26.9
6. Other types of advisors (7, 8, 9, 10, 12, 13) 81 7.2
26Table 8 presents descriptive statistics on the value of assets by type of FA, and for respondents without
an FA.
Table 8. Descriptive statistics on value of financial assets by type of FA, and for respondents without
an FA, 2018
Observations Median ($) Mean ($) SD ($)
Non-advised 1,368 169,050 315,804 560,240
Advised 1,118 320,000 531,237 748,267
Bank branch advisor 257 225,000 386,968 764,766
Bank affiliated broker 320 412,500 681,155 926,829
Private banking or private investment advisor 74 342,500 636,891 605,447
FA affiliated with an insurance company 85 280,000 406,345 449,692
FA not affiliated with a bank or an insurance company 301 312,500 532,193 653,746
Other types of advisor 81 300,000 427,697 420,389
Respondents associated with a bank affiliated broker stood out with higher assets in dollar terms
(median and mean). The distribution of asset values was also higher relative to the other types of FA.
In contrast , respondents with a bank branch advisor had lower asset values, though with a wide range
of values.
3.2 Determinants of having a financial advisor by type of financial advisor
Table 9 replicates the probit model of Table 2, examining the determinants of having an FA or not (with
the full sample) but for each type of FA (as regrouped in the previous section). The question of interest
here is: What are the determinants of choosing a specific type of advisor relative to those not choosing
any FA? The results should be interpreted with caution, as for certain specific types of financial advisor,
the proportion of advised respondents over all non-advised respondents was less than 6%; namely, this
was the situation for private banking or private investment advisors, for FAs affiliated with an insurance
company and for other types of financial advisors.
The results of Table 9 show that the determinants vary among the different types of advisors, and
identify which types drive the aggregate results of Table 2. For example, annual household income
influences the probability of having a bank affiliated broker, a private banking or private investment
27advisor or an FA not affiliated with a bank or an insurance company. Households with an annual income
of $90,000 or more have a 14.8% percentage point likelihood of choosing a bank affiliated broker
relative to not having any advisor. There is no income effect from choosing a bank branch advisor, an
FA affiliated with an insurance company or other types of advisors. Annual savings of $10,000 or more
slightly increase the probability of choosing only three types of advisors. Mistrust of individuals
decreases the probability of choosing a bank affiliated broker or an FA not affiliated with a bank or an
insurance company. Financial literacy plays a positive role in choosing a bank affiliated broker or an FA
not affiliated with a bank or an insurance company. Respondents with a very good level of numeracy
are not interested in using any financial advisor. Respondents with a post-secondary diploma are more
likely to choose a private banking or private investment advisor, or an FA not affiliated with a bank or
an insurance company. Older respondents are more likely to have an FA, in particular a bank affiliated
broker or an FA not affiliated with a bank or an insurance company.
28Table 9. Determinants of having a specific type of financial advisor, 2018*
*Probit model (post-estimation margins)
Private banking FA not
FA affiliated
Bank branch Bank affiliated or private affiliated with a
Type of FA ( = 1) vs. Non-Advised (n = 1,368) = 0 with an Other type
advisor broker investment bank or an
insurance co.
advisor insurance co.
Margins Margins Margins Margins Margins Margins
Household’s annual income before taxes (Ref.: $10,000 0.047** 0.045* 0.018 0.035*** 0.066*** 0.021
Wage (Ref.: No wages and salaries)
Has wages and salaries 0.045 -0.037 -0.001 0.015 -0.060* 0.020
Workplace pension (Ref.: No workplace pension)
Has workplace pension -0.003 0.021 0.007 -0.045 0.015 -0.022
Work situation (Ref.: Other)
Full time -0.057* -0.058* -0.038*** 0.002 -0.073** -0.020
Retirement (Ref.: Not retired)
Fully retired 0.019 0.019 0.022 0.042 -0.020 -0.032
Life insurance (Ref.: No individual life insurance)
Has individual life insurance 0.038** 0.031 -0.009 0.017* 0.040** 0.028**
Mistrust of individuals (Ref.: Is not suspicious of individuals)
Is suspicious of individuals 0.004 -0.075*** -0.010 -0.012 -0.051*** 0.002
Financial literacy (Ref.: Wrong answer)
Right answer 0.011 0.051** 0.009 0.026** 0.103*** 0.008
Economic literacy (Ref.: Wrong answer)
Right answer -0.049* 0.061* 0.024 0.005 0.019 -0.012
29Table 9 (cont’d)
FA not
Private banking or FA affiliated
Bank branch Bank affiliated affiliated with
private investment with an Other types
advisor broker an insurance
advisor insurance co.
co.
Margins Margins Margins Margins Margins Margins
Numeracy (Ref.: No right answer out of 3)
1 right answer out of 3 -0.047** -0.015 0.001 -0.017 -0.028 0.028*
2 right answers out of 3 -0.061** -0.039 -0.016 -0.019 -0.010 0.002
3 right answers out of 3 -0.054** -0.065** -0.011 -0.030** -0.050* -0.0005
Gender (Ref.: Female)
Male -0.006 -0.061*** 0.001 -0.018* -0.055*** -0.010
Educational level (Ref.: Does not have post-sec. diploma)
Has post-secondary diploma 0.016 0.031 0.053*** -0.015 0.058** 0.002
Age (Ref.: Under 45)
45–54 0.046** 0.093*** -0.002 0.032*** 0.054** 0.017
55–65 0.109*** 0.150*** 0.025* 0.052*** 0.122*** 0.017
65 or over 0.107*** 0.186*** 0.032 0.044* 0.113*** 0.063**
Income earners (Ref.: 1)
2 -0.043 -0.014 -0.015 0.016 -0.008 -0.001
3 or more -0.043 0.001 -0.006 0.030 0.074 0.013
Family situation (Ref.: Single individual)
Couple with no children 0.033 -0.045 -0.011 0.017 -0.062* -0.006
Couple with children 0.020 -0.058 -0.019 0.028 -0.092*** -0.014
Single parent 0.023 0.013 0.060 0.065* 0.062 0.043
Other family types 0.031 0.004 - 0.025 -0.052 -0.007
Regions (Ref.: Atlantic)
Quebec -0.055 0.002 -0.014 0.018 -0.096** 0.001
Ontario -0.089** -0.010 0.010 0.020 -0.037 0.030
Manitoba and Saskatchewan -0.078 -0.022 0.025 0.023 0.027 0.028
Alberta -0.082* -0.036 0.009 0.020 -0.025 0.020
British Columbia -0.104** -0.004 0.012 0.004 0.008 0.022
*** p < 0.01 ** p < 0.05 * p < 0.100 Observations 1,625 1,688 1,396 1,453 1,669 1,449
Pseudo R2 0.051 0.090 0.112 0.124 0.101 0.059
30In Table 9A, we address the question: When an advisor was chosen, what factors distinguished a household
choosing one type relative to others? We used a multinomial logit model restricted to the sample of 1,118
respondents with an FA. Having an FA not affiliated with a bank or an insurance company was the reference
to the other choices of an FA. 22 The results are presented in terms of the relative risk ratio, RRR (the relative
risk is a ratio of two probabilities).
For example, households with an annual income of $60,000 or over have about one third the probability of
choosing a bank branch advisor relative to an FA not affiliated with a bank or an insurance company.
Respondents with good financial and economic literacy have a significantly higher probability of choosing
the reference FA than a bank branch advisor (RRR of 0.473 and 0. 535, respectively). However, respondents
that in general mistrust individuals have a 1.479 times greater probability of choosing a bank branch advisor
than an FA not affiliated with a bank or an insurance company; the probability is twice as great for
respondents with wages and salaries, and 1.496 times greater for males relative to female respondents.
Bank affiliated brokers attract respondents between 45 and 54 substantially more than the reference FA
does (RRR = 1.799). This is also the case for respondents from Quebec (RRR = 2.308). Private banking or
private investment advisors are only half as likely to recruit respondents with life insurance. Respondents
aged between 45 and 54, couples with children, respondents from other family types and those living in
Quebec have a substantially higher probability of choosing an FA affiliated with an insurance company than
an FA not affiliated with a bank or an insurance company. The situation is the reverse for respondents with
a post-secondary diploma. Respondents with good financial literacy avoid the other types of FA relative to
the reference FA.
22 One well-known restriction of the multinomial logit model is the independent irrelevant alternatives assumption. The IIA property holds that
for a specific individual, the ratio of the choice probabilities of any two alternatives is entirely unaffected by the systematic utilities of any other
alternatives. This could be restrictive in our situation. The multinomial probit model (MNP) with correlated error terms among alternatives
avoids this restriction, but its implementation is difficult.
31Table 9A. Determinants of choosing a specific type of financial advisor relative to choosing an FA not affiliated with an insurance
company, 2018*
* Multinomial logit regression (excluding resp. without an FA) /
RRR = relative risk ratio
FA not affiliated with a bank or an insurance co. Bank branch Bank affiliated Private banking or FA affiliated with
Other types of FA
(n = 301) vs. Each type of FA advisor broker private inv. advisor an insurance co.
RRR RRR RRR RRR RRR
Household’s annual income before taxes (Ref.: $10,000 0.957 0.824 0.886 1.580 0.930
Wage (Ref.: No wages and salaries)
Has wages and salaries 2.099** 1.198 1.684 2.334 2.118
Workplace pension (Ref.: No workplace pension)
Has workplace pension 0.996 1.128 1.425 0.268 0.611
Work situation (Ref.: Other)
Full time 0.911 1.166 0.755 1.319 0.955
Retirement (Ref.: Not retired)
Fully retired 1.288 1.173 1.922 3.344 0.432
Life insurance (Ref.: No individual life insurance)
Has individual life insurance 0.970 0.810 0.501** 1.213 1.189
Mistrust of individuals (Ref.: Is not suspicious of individuals)
Is suspicious of individuals 1.479** 0.862 1.065 1.012 1.497
Financial literacy (Ref.: Wrong answer)
Right answer 0.473*** 0.693* 0.602 0.854 0.557**
Economic literacy (Ref.: Wrong answer)
Right answer 0.535** 1.265 1.831 0.914 0.640
32Table 9A (cont’d)
Bank branch Bank affiliated Private banking or FA affiliated with
Other type of FA
advisor broker private inv. advisor an insurance co.
RRR RRR RRR RRR RRR
Numeracy (Ref.: No right answer out of 3)
1 right answer out of 3 0.830 1.039 1.243 0.829 2.012**
2 right answers out of 3 0.614* 0.789 0.652 0.616 1.075
3 right answers out of 3 0.837 0.824 1.205 0.650 1.581
Gender (Ref.: Female)
Male 1.496** 1.091 1.624 1.026 1.210
Educational level (Ref.: Does not have post-secondary
diploma)
Has post-secondary diploma 0.738 0.849 3.165* 0.456** 0.726
Age (Ref.: Under 45)
45–54 1.237 1.799** 0.599 2.431** 1.075
55–65 1.107 1.532 0.767 1.997 0.701
65 or over 1.002 1.910* 0.918 1.782 1.203
Income earners (Ref.: 1)
2 0.770 0.912 0.813 1.717 1.073
3 or more 0.362 0.526* 0.602 1.139 0.861
Family situation (Ref.: Single individual)
Couple with no children 1.634 1.111 1.333 2.153 1.171
Couple with children 1.903* 1.354 1.227 3.596** 1.140
Single parent 0.710 0.713 2.249 2.427 1.282
Other family types 2.110 2.072 0.000 4.743** 1.006
Regions (Ref.: Atlantic)
Quebec 1.670 2.308** 1.416 3.412* 2.043
Ontario 0.562* 1.066 2.159 1.580 2.146
Manitoba and Saskatchewan 0.435* 0.829 2.219 1.411 1.143
Alberta 0.609 0.862 1.902 1.637 1.920
British Columbia 0.374 0.798 1.595 0.841 1.337
Constant 3.868 0.682 0.019 0.044 0.217
*** p < 0.01 ** p < 0.05 * p < 0.100 Observations 1 118
Pseudo R2 0.069
33In Table A2 in the Appendix, the same analysis is repeated with an FA associated with an insurance company as the reference category. Few
coefficient estimates are statistically significant, and it is unclear how some (such as family situation) should be interpreted. There are two
notable exceptions when comparing with private banking or private investment advisors: respondents with life insurance have a lower
probability of choosing this type of FA relative to an FA associated with an insurance company (RRR = 0.413), while respondents with post-
secondary education are seven times more likely to choose a PB/PIA than the reference FA category (RRR = 6.945).
343.3 Impact of each type of financial advisor on asset values (ln)
In this section, we address the question: Are investors better off with any type of financial advisor
relative to those survey respondents who chose not to have a financial advisor?
There are some econometric difficulties here owing to the small number of observations for some types
of advisors. For example, the endogeneity issue cannot be resolved, and the use of the tenure variable
by type of advisor is problematic: With a lower proportion of observations for each type of FA, the
predictions of the probit model yield too few positive observations of households with an FA.
Table 10 presents two specifications. In the first column, results are distinguished by type of advisor,
but the tenure variable is aggregated. In other words, tenure is not associated with each type of advisor.
The column 1 results indicate that the largest impact of having an advisor occurs with a bank affiliated
broker or a private banking or private investment advisor. It seems that for a bank branch advisor or an
FA affiliated with an insurance company to have a positive impact, more time is needed than for other
types of advisors. The regression of column 2, when the tenure variable is ignored, confirms those
results. It can be seen that all types of advisors increase the value of their clients’ assets relative to a
“comparable” household without an advisor. Again, advice from a bank affiliated broker or a private
banking or private investment advisor leads the way.
Table 10. Determinants of asset values (ln) by type of financial advisor, 2018
Linear regressionT (Dep.: ln of asset values)
T Tenure
Using non-predicted values for FA¥ Tenure included
excluded
Coefficient Coefficient
Type of financial advisor (Ref.: Non-Advised)
Advised by bank branch advisor 0.152 0.473***
Advised by bank affiliated broker 0.498*** 0.867***
Advised by private banking or private inv. advisor 0.430*** 0.773***
Advised by FA affiliated with an insurance company 0.165 0.522***
Advised by FA not affiliated with a bank or an
0.270** 0.656***
insurance company
Advised by other type of FA 0.272* 0.573***
Financial advisor X Tenure (Ref.: Advised < 4 years)
Advised X 4 to 6 years 0.153 -
Advised X 7 to 14 years 0.380*** -
Advised X 15 years or more 0.528*** -
35You can also read