Women and Men in the Informal Economy: A Statistical Brief - Florence Bonnet, Joann Vanek and Martha Chen - WIEGO
←
→
Page content transcription
If your browser does not render page correctly, please read the page content below
Women and Men in the Informal
Economy: A Statistical Brief
Florence Bonnet, Joann Vanek and Martha Chen

                                           January 2019
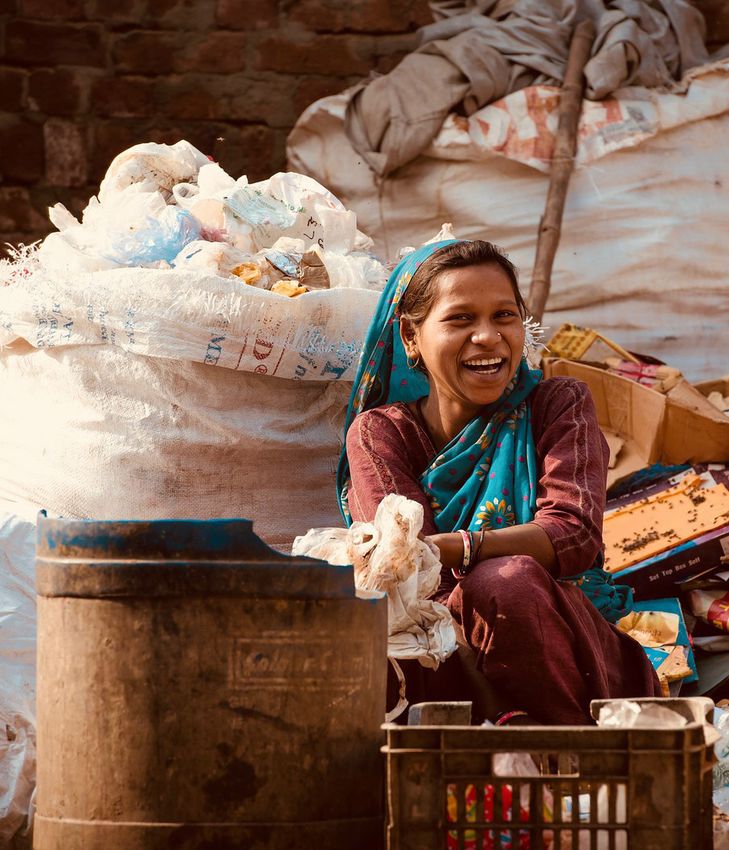
Women and Men in the Informal
Economy: A Statistical Brief

Publication date: January, 2019
ISBN number: 978-92-95106-42-0
Please cite this publication as: Bonnet, Florence, Joann Vanek and Martha Chen. 2019. Women and Men in the
Informal Economy – A Statistical Brief. Manchester, UK: WIEGO.

Layout: Julian Luckham of Luckham Creative
Cover photo: Waste pickers in Delhi are defining a plan of action to drive their advocacy around the implementation of
new solid waste management rules. Rashmi Choudhary.

Published by Women in Informal Employment: Globalizing and Organizing (WIEGO)
A Charitable Company Limited by Guarantee – Company No. 6273538, Registered Charity No. 1143510

WIEGO Limited
521 Royal Exchange
Manchester, M2 7EN
United Kingdom
www.wiego.org

Copyright © WIEGO.

This report can be replicated for educational, organizing and policy purposes as long as the source is acknowledged.
Women and Men in the Informal Economy – A Statistical Brief

Contents
1. Measuring the Informal Economy............................................................................................................ 1

2. Statistical Overview – Global.................................................................................................................. 4
    Size and Composition......................................................................................................................... 4
    Women and Men................................................................................................................................ 5
    Self-Employment and Wage Employment............................................................................................ 5
    Rural-Urban and Branch of Industry................................................................................................... 7

3. Statistical Overview – Geographic Regions............................................................................................ 10
    Size and Composition....................................................................................................................... 10
    Women and Men.............................................................................................................................. 11
    Self-Employment and Wage employment.......................................................................................... 11
    Rural-Urban and Branch of Industry................................................................................................. 13

4. Informality and Key Social Indicators.................................................................................................... 15
     Poverty............................................................................................................................................. 15
     Age.................................................................................................................................................. 18
     Education......................................................................................................................................... 18

5. Future Directions................................................................................................................................. 19

Annex I. National Sources: List of Household Surveys................................................................................ 21

Annex II. Income and Regional Groupings.................................................................................................. 25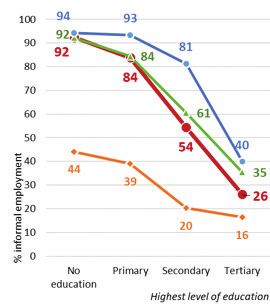
Women and Men in the Informal Economy – A Statistical Brief
List of Tables
Table 2.1 Per Cent of Informal Employment and its Components in Total and Non-Agricultural
Employment by Sex and Country Income Group, 2016........................................................... 4
Table 2.2 Distribution of Total, Informal and Formal Employment by Status in Employment,
Non-Agricultural Employment, Sex and Country Income Group, 2016 (per cent).................... 6
Table 2.3 Per Cent of Informal Employment in each Status in Employment by Total Employment,
Non-Agricultural Employment, Sex and Country Income Group, 2016.................................... 7
Table 2.4 Per Cent of Informal Employment in Branch of Industry: Total, Rural, Urban and
Non-Agricultural Employment and Country Income Groups, 2016.......................................... 8
Table 3.1 Per Cent Informal Employment in Total and Non-Agricultural Employment by
Sex and Geographic Region, excluding Developed Countries, 2016...................................... 10
Table 3.2 Distribution of Total, Informal and Formal Employment by Status in Employment,
Sex and Geographic Region, excluding Developed Countries, 2016 (per cent)..................... 12
Table 3.3 Per Cent of Informal Employment in Total, Rural and Urban Employment by
Branch of Industry and Geographic Region, excluding Developed Countries, 2016............... 13
Table 3.4 Distribution of Total, Informal and Formal Employment by Branch of Industry,
Sex and Geographic Region, excluding Developed Countries, 2016 (per cent)...................... 14
Table 4.1 Per Cent of Workers in Informal and Formal Employment from Poor Households
by Country Income Groups (latest year available)................................................................. 16
Table 4.2 Per Cent of Workers in Informal Employment among Workers from Poor and
Non-poor Households by Country Income Groups (latest year available)............................... 17
Table 4.3 Share of Informal Employment in Total Employment by Age and Sex, 2016 (per cent).......... 18
List of Box and Figures
Box 1 Operational Definitions of Employment in the Informal Sector and Informal Employment
Used to Generate these Harmonized Estimates...................................................................... 2
Figure 2.1 Distribution of Total, Informal and Formal Employment, by Branch of Industry,
Sex and Country Income Group, 2016 (per cent)................................................................... 9
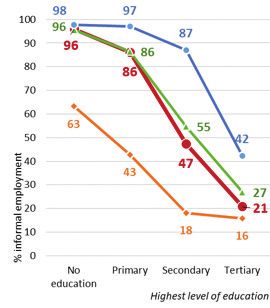
Figure 4.1 Share of Informal employment in Total Employment by Education and Sex, 2016 (per cent). 18Women and Men in the Informal Economy – A Statistical Brief
Preface
The 3rd edition of Women and Men in the Informal Economy: A Statistical Picture published recently by
the ILO represents a major advance in the development of data on informal employment for it shows the
feasibility of producing world-wide statistical estimates of this key component of the labour force. This is
possible because over 100 countries – both developed and developing – now collect the relevant data and
share their micro-datasets with the ILO. Although the definitions of informal employment and the informal
sector allow for national flexibility, a harmonized set of estimates was produced.
The United Nations’ Sustainable Development Goals and the International Labour Organization’s
Recommendation (No. 204) on the Transition from the Informal to the Formal Economy, both adopted in
2015, highlight the importance of statistics on the informal economy in the development of policies and
programmes to promote decent work and productive employment.
This Brief summarizes the main findings of the 3rd edition in a user-friendly format to give a wide audience
of users an understanding of the size, components and characteristics of the informal economy worldwide.
The tables are simplified to include fewer variables than in the full report. The global data are shown in four
main groups of countries — world, developed (high-income), emerging (middle-income) and developing
countries (low-income). For the geographic regions and sub-regions, key dimensions of employment are
compared across all of the geographic regions rather than presented by individual regions as in the full
report.
This Brief was prepared as a collaborative effort of the ILO – specifically the INWORK Branch, the Statistics
and Employment Departments – and Women in Informal Employment: Globalizing and Organizing
(WIEGO). WIEGO is a global network focused on securing livelihoods for the working poor, especially
women, in the informal economy. It has partnered with the ILO Departments of Statistics and Employment
in the development, analysis and promotion of statistics on the informal economy, including on the two
earlier editions of Women and Men in the Informal Economy: A Statistical Picture.
Florence Bonnet Joann Vanek Martha Chen
Informal Economy Specialist, ILO Advisor, WIEGO Statistics Senior Advisor, WIEGO
ProgrammeWomen and Men in the Informal Economy – A Statistical Brief
Women and Men in the Informal Economy – A Statistical Brief

1. Measuring the Informal Economy
The 3rd edition of Women and Men in the Informal Economy: A Statistical Picture estimates that two billion
(61 per cent) of the global employed population earn their living in the informal economy (ILO, 2018).
It shows that informality exists in countries at all levels of socio-economic development. Although it is
more prevalent in developing countries than developed countries, informality encompasses a wide range
of jobs and economic activities with no work-based social protection: from street vending, home-based
work in global and domestic value chains, waste-picking and domestic work to short-term contract work.
Evidence shows that most informal workers do not work informally by choice but in the absence of other
means of livelihood. Informal workers face multiple problems and are usually poorer and more vulnerable
than workers in the formal employment. Generally, the existing legal and regulatory frameworks tend to be
irrelevant for — or punitive towards — the informally employed and their livelihood activities.

Two recent global milestones call attention to the centrality of the informal economy to achieving decent
work and social protection for all and equitable development more broadly. These two milestones are the
UN 2030 Agenda for Sustainable Development and ILO Recommendation 204 concerning the Transition
from the Informal to the Formal Economy. Both call for the collection, analysis and dissemination of
statistical data and indicators on the informal economy as essential to formulating and monitoring policies
and programmes that can improve the lives of the working poor. An important step in the development
of these data is a statistical picture of the size, composition and characteristics of workers in the informal
economy worldwide, as in this publication.

This publication is a brief version of the 3rd edition of Women and Men (ILO, 2018). For this edition, the
ILO processed micro-data for more than 100 countries representing more than 90 per cent of the world’s
employed population aged 15 years and older. The estimates are based on a common set of operational
criteria used to determine informal employment and employment in the informal sector for a person’s
main job (Box 1). The resulting statistics are comparable across countries and regions. Not all of the
countries whose data were used in preparing the estimates publish statistics on informal employment and
employment in the informal sector. However, the ILO was able to include these countries because the
required data were collected in recent national surveys. Among countries that publish data on informal
employment and employment in the informal sector, national estimates may not be consistent with the
estimates produced by the ILO using harmonized criteria. The definitions of informal sector employment
and informal employment are formulated with flexibility to adjust to national contexts and circumstances,
while ensuring international harmonization. The objective of ILO’s harmonized estimates is not to provide
better country-specific estimates of the informal economy but primarily to ensure the best comparable
cross-country estimates.

The micro-data used as a basis for the estimates span a number of years from mid-2000 to 2016. For
90 per cent of the countries considered, the data are from 2010 onwards and for more than half of the
countries the data are from 2013 onwards. The national data sources and years are listed in Annex I. The
regional and global estimates are weighted by the denominator of the indicator using 2016 data from the
ILO Trends Econometric Models. Similarly, the absolute numbers in the report refer to 2016 by multiplying
the estimated regional or global estimate by absolute numbers for 2016 from the ILO Trends Econometric
Models.1

Section 2 presents the harmonized estimates at the World level and in three country income groupings –
Developing (low-income), Emerging (middle-income) and Developed (high-income). Section 3 shows the
estimates by geographical regions and sub-regions with a focus on developing and emerging countries.
The regional and income groupings are listed in Annex II. Section 4 presents estimates of the links between
informal employment and key social indicators – poverty, age and education – at the world level and across
the three country income groups.
1
    ILOSTAT, ILO Trends Econometric Model. See ILO estimates and projections methodological note, available at: https://
    www.ilo.org/empelm/projects/WCMS_114246/lang--en/index.htm

                                                               1
Women and Men in the Informal Economy – A Statistical Brief
Box 1 Operational Definitions of Employment in the Informal Sector and Informal Employment Used to
Generate these Harmonized Estimates
International statistical standards distinguish between employment in the informal sector and informal
employment. Employment in the informal sector is an enterprise-based concept and is defined by the
characteristics of the enterprise in which workers are engaged. By contrast, informal employment is an
employment-based concept and it is defined in terms of the employment relationship and protections
associated with the worker’s job.
Employment in the Informal Sector
According to the international statistical standards adopted by the 15th International Conference of
Labour Statisticians (ICLS), the informal sector consists of a subset of unincorporated enterprises (i.e.
not constituted as separate legal entities independent of their owners) that are also not registered with
a national government authority (ILO, 1993). Most informal enterprises are single-person operations
or family firms/farms; very few are owned or operated by employers with hired workers. Typically, they
operate at a low level of organization, on a small scale and with little or no division between labour and
capital as factors of production. Households with persons working in a farm or private business in which
the destination of production is wholly for own final use are excluded from the scope of the informal
sector but included as part of the household sector.
Criteria used to identify the informal sector and employment in the informal sector:
Registration of the economic unit at the national level: registration can be with social security, sales or
income tax authorities. If registered, the economic unit is considered part of the formal sector. If not
registered or in the process of registering or the information is missing or not collected, then there is a
need to consider the next criteria.
Bookkeeping: this criterion assesses whether the economic unit maintains a set of accounts required by
law (e.g. balance sheets) or keeps some official accounts. If the unit maintains formal bookkeeping so
defined, it is considered formal. If the unit does not maintain formal bookkeeping or if the respondent
does not know or does not provide information or if the information has not been collected, then one or
other of the following alternative criteria are used.
Alternative Criteria applied only if information about registration and bookkeeping is missing (no question,
no answer or don’t know).
Employer contribution criterion (for employees): If the employer contributes to social security on behalf
of employee, then the unit is formal.
Economic unit size and fixed visible location criteria (for all with missing or don’t know for previous
alternative criterion, i.e. enterprise in which employer contributes to social security): if the unit has more
than five workers and is located in a fixed visible premise then it is formal; units with five or less workers
or not in fixed premises are informal.
2Women and Men in the Informal Economy – A Statistical Brief
Informal Employment
In contrast to the concept of the informal sector that refers to production units as the unit of observation,
the concept of informal employment refers to the job or worker as the unit of observation (ILO, 2003;
Hussmanns, 2004). However, in the case of own-account workers and employers, whether they are
considered informal is determined by whether their enterprise is informal.
In the case of employees, informal employment is defined in terms of the employment relationship.
According to international statistical standards, for a job held by an employee to be considered as
informal, the employment relationship should not be, in law or in practice, subject to national labour
legislation, income taxation, social protection or entitlement to certain employment benefits (advance
notice of dismissal, severance pay, paid annual or sick leave, etc.). In practice, the formal or informal
nature of a job held by an employee is determined on the basis of operational criteria, notably social
security contributions by the employer (on behalf of the employee), but also entitlement to and effective
benefit from paid sick leave as well as paid annual leave. Criteria used in the harmonized approach to
identify informal employment are detailed below.
The starting point is the employment status of the respondent.
1. If the respondent is a contributing family worker, the person is classified as having an informal job.
2. If the respondent is recorded as an employer, own-account worker or member of a producer
cooperative, the formal or informal nature of the job is determined according to the formal or informal
nature of the economic unit of the person’s job.
3. The statistical treatment of employees depends on the criteria of social security contributions by the
employer or, alternatively, entitlements to and benefit from paid annual leave and sick leave.
– Contributions to social security scheme (ideally pension) by the employer on behalf of the employee, and
usually complementing an employee contribution, is the option most commonly used in countries and
the one applied by the ILO. If such a contribution is made then the employee is considered to be formally
employed. If no contribution is made, then the employee is considered to be informally employed.
For a number of countries where there is a lack of information regarding contributions made by
employers, if a contribution to the social security scheme was made by the employee, then the employee
is considered as formal. If the survey respondent does not know or does not answer, then two other
criteria are considered.
– Entitlement to and benefit from paid annual leave and sick leave: If the employee is not only entitled
to but effectively benefits from paid annual leave (or compensation instead of it) and paid sick leave,
then he/she is considered as having a formal job. Otherwise he/she is considered as being informally
employed.
3Women and Men in the Informal Economy – A Statistical Brief
2. Statistical Overview – Global
Size and Composition
The majority of the world’s global employment aged 15 and above — 61 per cent — are informally
employed: a total of 2 billion workers (table 2.1). Informality is highest in countries with the lowest levels
of income.2 Informality is 90 per cent of employment in developing (low-income) countries, 67 per cent in
emerging (upper-middle and lower-middle) countries and 18 per cent in developed (high income) countries.
Excluding agriculture the level of informal employment falls globally and in each country income group
but remains at one half of global employment. Informal employment is 73 per cent of non-agricultural
employment in developing countries, 59 per cent in emerging countries and 17 per cent in developed
countries.
Table 2.1 Per Cent of Informal Employment and its Components in Total and Non-Agricultural
Employment by Sex and Country Income Group, 2016
Total employment Non-Agricultural employment
Developing
Developing
Developed
Developed
Emerging
Emerging
World
Informal employment 61 18 67 90 World
51 17 59 73
Men 63 19 69 87 53 18 61 70
Women 58 18 64 92 46 17 55 78
In the informal sector 52 15 57 81 41 13 48 59
Men 54 16 59 78 44 15 51 53
Women 48 13 52 85 36 12 42 66
In the formal sector 7 3 8 5 8 3 9 10
Men 7 3 7 6 8 3 9 13
Women 7 4 8 3 8 4 9 6
In households* 2 0 3 3 2 0 2 5
Men 2 0 2 3 1 0 1 3
Women 3 0 4 4 3 0 3 6
Note: Due to rounding, some totals may not correspond with the sum of the separate figures (informal employment in the informal
sector, in the formal sector, in households).
* Includes paid domestic workers employed by households and producers of goods for own consumption.
Source: ILO calculations based on household survey micro datasets.
The components of informal employment are informal employment in the informal sector, in the formal
sector and in households. Employment in the informal sector (i.e., informal enterprises) is comprised of
employers, employees, own-account workers and contributing family workers. Informal employment in the
formal sector includes employees and contributing family workers in formal enterprises who do not receive
social protection contributions by their employer or, in the absence of information on social protection,
do not receive paid annual and paid sick leave. Informal employment in households consists of domestic
workers employed by households who do not receive social protection contributions from their employers
2
Following the World Bank definition for 2018 fiscal year, countries are grouped into developing (low-income),
emerging (lower-middle and upper-middle income) and developed (high-income). See income groupings in Annex II.
This annex also shows the countries grouped by geographic region.
4Women and Men in the Informal Economy – A Statistical Brief
or, alternatively, do not receive paid annual and paid sick leave. And in some countries also includes
producers of good wholly for own final consumption.3
Employment in the informal sector follows the same general pattern as informal employment as a whole.
It is highest in developing countries where it accounts for 81 per cent of total employment and almost all
of informal employment. Employment in the informal sector represents 57 per cent of total employment in
emerging countries but only 15 per cent of total employment in developed countries. The share of informal
sector employment in non-agricultural employment drops to 59 per cent in developing counties but
remains the largest share of non-agricultural employment globally and in all income groups. Informal sector
employment represents just under half of non-agricultural employment in emerging countries and only 13
per cent in developed countries.
Women and Men
Informal employment is a greater source of employment for men than for women at the world level (63 vs
58 per cent), in developed countries (19 vs 18 per cent) and in emerging countries (69 vs 64 per cent).
However in developing countries the percentage of women workers who are informally employed (92 per
cent) is substantially higher than the percentage of men workers (87 per cent). Further, in a majority of
countries (56 per cent), the percentage of women workers in informal employment exceeds the percentage
of men workers. This does not result in higher global averages due to higher shares of informal employment
for men relative to women in emerging countries with large populations such as Russia and China as well
as most countries of the Middle East and Northern Africa. Further, although more women workers than
men workers, are informally employed in India and Pakistan and in some other countries of Southern Asia,
low female labour force participation rates limit the effect of high female informal employment rates in the
global and regional estimates.
Self-Employment4 and Wage Employment
Globally, 56 percent of all workers are employees/wage workers and 44 percent are self-employed5 (table
2.2). However, there are significant differences across the country groupings. In developing countries,
an overwhelming 72 per cent of all workers are self-employed. The reverse is true in developed countries
where 86 per cent of all workers are wage employed. In emerging countries, just over half (51 per cent) are
wage employed.
In non-agricultural employment, as in total employment, wage employment represents a higher percentage
of all workers globally (72 per cent) with significant differences across the country groupings. The
percentage of wage workers in non-agricultural employment is lowest in developing countries (42 per cent),
increases to 69 per cent in emerging countries and reaches a high of 87 percent in developed countries.
3
The 19th ICLS (2013) excluded production exclusively for own final use from the definition of employment. However
most of the surveys on which these estimates are based relied on the definition of employment from the 13th ICLS
which included production exclusively for own final use.
4
Self-employment includes own-account workers, employers, and contributing family workers.
5
ILOSTAT, 2016 data from ILO’s Trends Econometric Models
5Women and Men in the Informal Economy – A Statistical Brief
Table 2.2 Distribution of Total, Informal and Formal Employment by Status in Employment, Non-
Agricultural Employment, Sex and Country Income Group, 2016 (per cent)
Total employment Non-Agricultural employment
World Developed Emerging Developing World Developed Emerging Developing
Women
Women
Women
Women
Women
Women
Women
Women
Total
Total
Total
Total
Total
Total
Total
Total
Men
Men
Men
Men
Men
Men
Men
Men
Composition of total employment
Employees 56 55 57 86 84 89 51 51 53 28 33 23 72 70 75 87 84 90 69 67 73 42 49 31
Employers 3 4 2 6 5 2 3 4 2 2 4 2 3 4 2 7 4 2 3 4 2 3 5 2
Own-account
32 36 25 9 10 7 35 41 35 50 51 48 22 24 18 9 11 7 24 27 20 47 41 56
workers
Contributing
10 5 16 1 1 2 11 6 19 19 12 27 3 2 4 1 1 1 3 2 5 7 5 10
family workers
Composition of informal employment
Employees 36 37 34 51 47 57 37 38 36 21 25 17 55 55 55 52 46 59 57 56 58 29 38 18
Employers 3 3 1 6 8 4 3 3 1 2 3 1 3 4 2 7 9 5 3 3 2 3 5 2
Own-account
45 50 36 36 42 28 44 50 34 54 57 51 36 38 33 35 40 28 35 37 30 57 50 66
workers
Contributing
16 9 28 6 3 10 16 8 29 22 14 31 6 4 10 6 4 9 6 4 10 10 7 13
family workers
Composition of formal employment*
Employees 76 83 90 94 93 96 76 78 86 69 70 67 82 80 85 94 92 95 82 80 86 71 72 68
Employers 4 5 2 2 3 1 4 6 2 5 9 8 4 4 2 3 3 2 4 4 2 5 6 5
Own-account
20 12 8 4 4 2 20 16 12 26 21 24 14 15 12 4 4 3 15 16 12 24 22 27
workers
Note: Due to rounding, the totals of proportions by status may not sum to 100. The distribution of total employment is based on
national micro-datasets used for the estimates of informal and formal employment. Global and regional estimates might slightly differ
from those presented in ILOSTAT Employment by Sector -- ILO modelled estimates, May 2018.
* Contributing family workers are by definition all in informal employment and not displayed here.
Source: ILO calculations based on household survey micro datasets.
In informal employment, unlike total employment, self-employment predominates except in developed
countries. Self-employment is 64 per cent of informal employment at the world level, 79 per cent in
developing countries, 63 per cent in emerging countries and 49 per cent in developed countries. The
predominance of self-employment in agriculture contributes to this pattern. Globally, excluding agriculture,
self-employment represents 45 per cent of informal employment. Self-employment is the majority of non-
agricultural informal employment only in the developing countries where it is 71 per cent of non-agricultural
informal employment.
By contrast, in formal employment, wage employment predominates across the country income groups
and in both total and non-agricultural employment. Employees are 76 per cent of formal employment at the
world level and range from 94 per cent in developed countries to 69 per cent in developing countries. Even
in emerging and developing countries where only a small share of total employment is formal and self-
employment predominates, employee is the dominant category in formal employment.
Self-employment can be further disaggregated into employers, own-account workers and contributing
family workers. Across all levels of economic development, employers are by far the smallest status
category in total employment, non-agricultural employment and informal employment. Globally,
employers represent 3 per cent of total employment and of informal employment and 4 per cent of
formal employment. Also, employers represent a smaller per cent of women’s than men’s employment
everywhere, in total, formal and informal employment.
6Women and Men in the Informal Economy – A Statistical Brief
Own-account and contributing family workers are important components of self-employment. Globally,
these two categories, which are considered vulnerable statuses of employment, together comprise 42
per cent of total employment and 61 per cent of informal employment. Among non-agricultural workers,
these statuses comprise a smaller percentage of all workers (25 per cent), of informal workers (42 per
cent) and of formal workers (14 per cent). In developing countries, most women are employed as own-
account or contributing family workers, representing 82 per cent of all women in informal employment.
Working as a contributing family worker is especially significant for women in developing and emerging
countries where they represent 27 and 19 per cent, respectively, of all women workers and 31 and 29
per cent, respectively, of women informal workers. The comparable percentages for men workers are far
lower in both developing and emerging countries: contributing family workers represent 12 and 6 per cent,
respectively, of all men workers and 14 and 8 per cent, respectively, of men informal workers.
Table 2.3 Per Cent of Informal Employment in each Status in Employment by Total Employment, Non-
Agricultural Employment, Sex and Country Income Group, 2016
Total employment Non-Agricultural employment
Developing
Developing
Developed
Developed
Emerging
Emerging
World
World
Employees 40 10 49 63 38 10 47 51
Men 42 10 51 63 41 10 50 54
Women 35 11 45 63 33 11 43 46
Employers 51 29 55 66 49 41 50 67
Men 51 28 55 67 49 39 50 66
Women 49 31 53 64 50 44 50 69
Own-account workers 86 69 86 93 82 67 83 88
Men 87 68 87 93 82 66 84 85
Women 85 70 84 93 82 69 82 92
Note: All contributing family workers are classified as having informal employment, irrespective of whether they work in formal or
informal sector enterprises. They are not displayed here.
Source: ILO calculations based on household survey micro-datasets.
Another approach to analysing the relationship between informality and status in employment is to consider
the share of each status category that is informal (table 2.3). Apart from contributing family workers, all
of whom are considered as informally employed by statistical definition, the category with the highest
share of informal employment is own-account workers, both globally and in all of the country income
groupings. Globally, 86 per cent of own-account workers are informal and the share ranges from 93 per
cent in developing countries, to 86 per cent in emerging to 69 per cent in developed. By contrast globally,
40 per cent of employees are informal with 63 in developing, 49 per cent in emerging and 10 per cent
in developed countries. Globally, among wage workers, the share of women workers who are informally
employed (35 per cent) is lower than the share of men (42 per cent): with emerging countries accounting
for most of that difference. However, among own-account workers, the share who are informal are roughly
equal for women (85 per cent) and men (87 per cent).
Rural-Urban and Branch of Industry
Globally, 80 per cent of rural employment compared to 44 per cent of urban employment is informal (table
2.4). The majority of agricultural workers everywhere are informal: 98 per cent in developing countries, 93
per cent in emerging and 59 per cent in developed countries. Considering only non-agricultural workers,
7Women and Men in the Informal Economy – A Statistical Brief
61 per cent in rural areas and 44 per cent in urban areas are informal. While employment in the industry
sector is also largely informal in developing (73 per cent) and emerging (67 per cent) countries, only 16
per cent of workers in industry are informal in developed countries. Comparable shares of employment
in services are informal: with developing countries (74 per cent), emerging countries (55 per cent) and
developed countries (18 per cent).
Table 2.4 Per Cent of Informal Employment in Branch of Industry: Total, Rural, Urban and Non-
Agricultural Employment and Country Income Groups, 2016
World Developed Emerging Developing
Total Employment 61 18 67 90*
Rural 80 22 83 90
Urban 44 17 51 79
Agriculture 94 59 93 98
Rural 95 64 95 98
Urban 87 49 82 98
Industry 57 16 67 73
Rural 69 17 75 87
Urban 49 15 61 65
Services 47 18 55 74
Rural 65 19 71 79
Urban 39 17 47 70
Non-agricultural employment 51 17 59 73
Rural 61 18 72 74
Urban 44 16 50 71
Source: ILO calculations based on household survey micro-datasets.
As country incomes rise, the proportion of the employed working in agriculture decreases, the proportion
working in industry increases and the proportion working in services increases even more (figure 2.1).
Agriculture comprises 62 per cent of employment in developing countries, 26 per cent in emerging and
3 per cent in developed. By contrast the service sector comprises only 26 per cent of employment in
developing countries, 55 per cent in emerging countries and 75 per cent in developed countries.
In the more developed countries, informal employment is dominated by service activities such as trade and
transportation. Services account for 71 per cent of informal employment in developed countries, 46 per
cent in emerging countries and only 21 per cent in developing countries. Industry comprises 10 per cent of
informal employment in developing countries and 19 per cent in both emerging and developed countries.
* For developing countries, the estimate of informal employment in rural and urban areas are based on a smaller
number of countries (with available data) than the estimates for total employment. This accounts for the same
estimate for total and rural in developing countries.
8Women and Men in the Informal Economy – A Statistical Brief
Figure 2.1 Distribution of Total, Informal and Formal Employment, by Branch of Industry, Sex and
Country Income Group, 2016 (per cent)
Total Men Women
Agriculture Total 25 19 56 Agriculture Total 24 24 52 Agriculture Total 26 11 63
World
World
World
Informal 38 18 44 Informal 36 22 42 Informal 42 11 47
Industry Industry Industry
Formal 6 23 71 Formal 5 28 66 Formal 6 14 80
Services Services Services
Developing
Developing
Developing
Total 62 12 26 Total 62 13 25 Total 62 11 27
Informal 69 10 21 Informal 69 11 19 Informal 68 8 24
Formal 13 17 70 Formal 15 19 66 Formal 13 12 75
Emerging
Emerging
Emerging
Total 26 19 55 Total 24 24 52 Total 28 11 61
Informal 36 19 46 Informal 33 23 44 Informal 40 12 48
Formal 5 24 71 Formal 5 29 66 Formal 5 14 81
Developed
Developed
Developed
Total 3 22 75 Total 4 32 64 Total 2 11 87
Informal 10 19 71 Informal 11 27 61 Informal 8 9 83
Formal 2 24 75 Formal 2 33 64 Formal 1 12 87
% 0 20 40 60 80 100 % 0 20 40 60 80 100 % 0 20 40 60 80 100
Note: Industry is composed of manufacturing; mining and quarrying; electricity, gas, steam and air conditioning supply; water supply;
sewerage, waste management and remediation activities; and construction. The distribution of total employment is based on national
micro-datasets used for the estimates of informal and formal employment. Global and regional estimates might slightly differ from
those presented in ILOSTAT Employment by Sector -- ILO modelled estimates, May 2018.
Source: ILO calculations based on household survey micro datasets.
There is clear evidence of gender segmentation in informal employment across the sectors. However, the
differences are less sharp in developing countries than in emerging and developed. Agriculture represents
a large proportion of work for both women and men in developing countries (two thirds of informal
employment). And there is only a 5 percentage point gap between women’s and men’s employment
in services and a 3 percentage point gap in industry. However in emerging and, especially, developed
countries, gender segmentation is greater. In emerging countries, services is the dominant sector of
informal employment for both women and men with 48 per cent of women employed in this sector
compared to 44 per cent of men. In emerging countries, a higher percentage of men workers (23 per
cent) than women workers (12 per cent) are in industry. In developed countries, services again dominate
informal employment for both women and men but the gender differences are very large: 83 percent
of women informal workers are in services compared to 61 per cent of men informal workers. Also, in
developed countries, industry comprises only 9 per cent of women’s informal employment but 27 per cent
of men’s.
The evidence for gender segmentation is even stronger in formal employment across the sectors and again
the gap is largest in the developed countries. Globally and in all regions employment in services dominates
formal employment: representing at least 75 per cent of women’s employment and at least 64 per cent of
men’s. The gap between women’s and men’s formal employment in services ranges from 23 percentage
points in developed countries to 15 in emerging and 8 in developing. Industry comprises less than 15
per cent of women’s employment for all levels of economic development but ranges from 33 per cent of
men’s formal employment in developed countries to 29 per cent in emerging countries and 19 per cent in
developing countries.
9Women and Men in the Informal Economy – A Statistical Brief
3. Statistical Overview – Geographic Regions
Size and Composition
In this section, the data for emerging and developing countries are analysed according to geographical
regions and sub-regions. The countries in each geographical region are shown in Annex II. Countries
classified as developed (high-income) in these regions are not included in the estimates presented in this
section, as they are presented in the previous section.
Informal employment as a share of total employment is highest, at 92 per cent, in the countries of sub-
Saharan Africa (excluding Southern Africa) (table 3.1). In sub-Saharan Africa (including Southern Africa),
89 per cent of employment is informal. Southern Asia is next highest with 88 per cent of employment as
informal followed by East and South-Eastern Asia (excluding China) at 77 per cent. In the Middle East and
North Africa 68 per cent of employment is informal and in Latin America and the Caribbean 54 per cent is
informal. Only in Eastern Europe and Central Asia does informal employment represent less than half (at 37
per cent) of total employment.
The share of informal employment in non-agricultural employment is lower than in total employment but
follows the same general pattern. Sub-Saharan African countries (excluding Southern Africa) remain
highest (82 per cent) followed by all of sub-Saharan Africa, Southern Asia and East and South-Eastern
Asia (excluding China). All have rates of informal employment slightly higher than three-quarters of non-
agricultural employment. Informal employment is 59 per cent of non-agricultural employment in the Middle
East and North Africa, 50 per cent in Latin America and the Caribbean and 30 per cent in Eastern Europe
and Central Asia.
Table 3.1 Per Cent Informal Employment in Total and Non-Agricultural Employment by Sex and
Geographic Region, excluding Developed Countries 2016*
Total employment Non-Agricultural employment
Total Men Women Total Men Women
Asia and the Pacific 71 74 67 63 65 58
Southern Asia 88 87 91 78 78 77
East and South-Eastern Asia (including China) 61 63 59 56 58 54
East and South-Eastern Asia (excluding China) 77 77 77 66 67 65
Sub-Saharan Africa 89 86 92 77 72 83
Southern Africa 40 38 42 36 34 38
Rest of sub-Saharan Africa 92 89 95 82 76 88
Latin America and the Caribbean 54 53 55 50 47 52
Middle East and North Africa 68 69 62 59 62 44
Eastern Europe and Central Asia 37 38 36 30 32 27
Note: Due to rounding, some totals may not correspond with the sum of the separate figures (informal employment in the informal
sector, in the formal sector, in households).
Source: ILO calculations based on household survey micro datasets.
* These data are for emerging and developing countries only, not developed countries, in the regions.
10Women and Men in the Informal Economy – A Statistical Brief
Women and Men
As discussed in the previous section, differences in women’s and men’s participation in the informal
economy are affected by differences in the employment rates of women and men. The employment to
working age population ratio is lower for women than for men across all regions: ranging from 15 per cent
in the Middle East and North Africa to 61 per cent in sub-Saharan Africa (excluding Southern Africa).6 The
ratios of men’s employment to the working age population are less varied across regions: ranging from 48
per cent in Southern Africa to 76 per cent in Southern Asia. The gap between women’s and men’s ratios
are high in the group of emerging countries especially in Southern Asia and in the Middle East and North
Africa. These differences are reflected in the relatively lower global percentage of women than men in
informal employment (58 per cent versus 63 per cent). Although informal employment is a greater source
of employment for women than for men in Southern Asia, women’s lower employment to population ratios
limits the effect of their high rates of informality on the estimates at the global level and among emerging
countries. Another factor explaining the gap is the type of employment that women have in the Middle East
and North Africa. While women in these regions have low labour force participation rates, a substantial
portion of their employment is in public sector jobs, which are mainly formal. Another factor is the low rates
of women’s informal employment relative to men’s in China and Russia, countries with large populations
which therefore have an impact on the global average.
In many of the geographic regions, women have higher rates of informal employment than men (table
3.1). For example, in sub-Saharan Africa (excluding Southern Africa), 95 per cent of women workers are
informally employed compared to 89 per cent of men workers. In Southern Asia, 91 per cent of women
workers are informally employed compared to 87 per cent of men workers. And in Latin America and
the Caribbean 55 per cent of women workers are informally employed compared to 53 per cent of men
workers. However in the Middle East and North Africa, Eastern Europe and Central Asia and East and
South-Eastern Asia (excluding China) rates of informal employment are higher for men than for women.
If agriculture is excluded, the rates of informal employment for women and for men decrease in all regions.
In Asia and the Pacific, the Middle East and North Africa and Eastern Europe and Central Asia, men have
higher rates of non-agricultural informal employment than women. In sub-Saharan Africa women have
substantially higher rates of non-agricultural informal employment than men and in Latin America and the
Caribbean women have slightly higher rates than men.
Self-Employment and Wage Employment
There are considerable differences across the sub-regions in the percentage of wage workers in total
employment (table 3.2). In emerging and developing countries, employees/wage workers are 26 per cent of
total employment in Southern Asia, 35 per cent in sub-Saharan Africa (excluding Southern Africa), 46 per
cent in East and South-Eastern Asia (excluding China), 60 per cent in the Middle East and North Africa, 63
per cent in Latin America and the Caribbean, 79 per cent in Eastern Europe and Central Asia and 84 per
cent in Southern Africa.
Employers represent less than 4 per cent of total employment and less than 3 per cent of informal
employment. Own-account workers are a more important component of both total and informal
employment in the sub-regions of Asia (excluding China) and in sub-Saharan Africa (excluding Southern
Africa) than in the other sub-regions in which wage workers are the more important component. Own-
account workers are 58 per cent of total employment and 62 per cent of informal employment in Southern
Asia and just under one half of total employment (47 per cent) and just over one half of informal
employment (53 per cent) in sub-Saharan Africa (excluding Southern Africa). In all sub-regions except in
sub-Saharan Africa, own-account work is a larger source of total employment and of informal employment
for men than for women.
6
ILOSTAT, Employment-to-population ratio 2016 data from ILO’s Trends Econometric Models
11Women and Men in the Informal Economy – A Statistical Brief
Table 3.2 Distribution of Total, Informal and Formal Employment by Status in Employment, Sex and
Geographic Region, excluding Developed Countries, 2016 (per cent)*
Employees Employers Own-Account Contributing
workers family workers
Women
Women
Women
Women
Total
Total
Total
Total
Men
Men
Men
Men
Composition of total employment
Asia and the Pacific 46 45 47 3 4 2 38 45 27 13 6 24
Southern Asia 26 28 21 1 2 0 58 62 45 15 9 34
East and South-Eastern Asia (including China) 58 59 57 4 6 2 27 30 21 11 5 20
East and South-Eastern Asia (excluding China) 46 48 43 4 6 2 35 39 30 15 8 25
Sub-Saharan Africa 37 43 30 2 3 1 46 45 47 15 10 22
Southern Africa 84 83 86 5 7 2 10 9 10 1 1 1
Rest of sub-Saharan Africa 35 40 27 2 3 1 47 47 49 16 10 23
Latin America and the Caribbean 63 62 64 5 6 3 28 29 26 4 3 6
Middle East and North Africa 60 61 55 6 8 2 25 26 18 9 5 25
Eastern Europe and Central Asia 79 78 81 2 3 1 14 16 12 4 3 6
Composition of informal employment
Asia and the Pacific 34 35 32 2 3 1 46 53 32 18 9 34
Southern Asia 20 21 177 1 1 0 62 68 45 17 10 38
East and South-Eastern Asia (including China) 47 51 41 3 4 2 32 36 25 18 8 32
East and South-Eastern Asia (excluding China) 39 43 33 3 4 1 36 40 30 23 13 36
Sub-Saharan Africa 28 34 22 2 2 1 52 52 52 18 12 25
Southern Africa 70 68 72 5 7 2 22 22 23 3 3 3
Rest of sub-Saharan Africa 27 33 21 2 2 1 53 53 53 18 12 25
Latin America and the Caribbean 45 44 46 4 5 2 43 45 40 8 5 11
Middle East and North Africa 44 47 31 9 11 2 36 36 34 11 6 33
Eastern Europe and Central Asia 65 65 64 2 3 1 23 26 18 11 6 16
Composition of formal employment
Asia and the Pacific 73 74 84 4 7 2 23 20 14
Southern Asia 71 72 70 1 2 0 28 26 30
East and South-Eastern Asia (including China) 74 75 85 7 8 3 19 18 12
East and South-Eastern Asia (excluding China) 63 63 72 9 10 5 28 27 23
Sub-Saharan Africa 76 80 79 3 4 3 21 15 18
Southern Africa 94 92 96 4 6 2 2 2 2
Rest of sub-Saharan Africa 75 77 70 3 4 3 22 19 27
Latin America and the Caribbean 84 81 88 5 7 4 10 12 8
Middle East and North Africa 94 95 97 2 2 1 4 3 2
Eastern Europe and Central Asia 89 85 91 2 4 1 9 11 8
Note: The distribution of total employment is based on national micro-datasets used for the estimates of informal and formal
employment. Global and regional estimates might slightly differ from those presented in ILOSTAT Employment by status — ILO
modelled estimates, May 2018.
Source: ILO calculations based on household survey micro datasets.
* These data are for emerging and developing countries only, not developed countries, in the regions.
In the case of contributing family workers, there are marked differences between women and men. In the
sub-regions of Asia, in sub-Saharan Africa (excluding Southern Africa) and in the Middle East and North
12Women and Men in the Informal Economy – A Statistical Brief
Africa contributing family workers represent one quarter to one third of women’s employment but a far
lower percentage of men’s employment. Among informal workers, the percentage of women working as
contributing family workers is even higher. In Southern Asia contributing family workers increase from 34
per cent of women’s total employment to 38 per cent of women’s informal employment, in East and South-
Eastern Asia, excluding China from 25 per cent to 36 per cent, including China from 20 per cent to 32 per
cent and in the Middle East and Northern Africa from 25 to 33 per cent.
Rural-Urban and Branch of Industry
In developing and emerging countries, except in Eastern Europe and Central Asia where a little less than half
of rural employment is informal, the majority of rural workers are informal (table 3.3). In Southern Asia and in
sub-Saharan Africa (excluding Southern Africa) over 90 percent of rural employment is informal, 93 and 92
per cent respectively. In rural employment, in East and South-Eastern Asia 80 per cent including China and
78 per cent excluding China is informal, and in the Middle East and North Africa 74 per cent is informal.
Table 3.3 Per Cent of Informal Employment in Total, Rural and Urban Employment by Branch of
Industry and Geographic Region, excluding Developed Countries, 2016*
Total Agriculture Industry Services
Urban
Urban
Urban
Urban
Rural
Rural
Rural
Rural
Total
Total
Total
Total
Asia and the Pacific 71 86 51 95 97 80 73 81 66 57 78 46
Southern Asia 88 93 75 99 99 97 82 85 79 76 80 71
East and South-Eastern Asia (including China) 61 80 42 88 92 76 63 76 50 52 76 41
East and South-Eastern Asia (excluding China) 77 78 58 92 92 92 67 69 65 64 63 65
Sub-Saharan Africa 89 90 81 98 98 98 73 86 72 76 81 72
Southern Africa 40 57 33 74 77 59 34 46 30 38 56 33
Rest of sub-Saharan Africa 92 92 85 98 99 98 87 89 85 80 82 79
Latin America and the Caribbean 54 69 48 80 80 79 50 51 49 50 53 48
Middle East and North Africa 68 74 60 95 96 94 73 77 70 52 49 52
Eastern Europe and Central Asia 37 47 29 76 78 57 33 46 32 28 32 27
Note: The category “not classified” for missing data on an industrial sector is not displayed in this table.
Source: ILO calculations based on household survey micro-datasets
* These data are for emerging and developing countries only, not developed countries, in the regions.
Urban employment is less informal than rural employment in all of the regions: but the rate of informal
employment in urban areas is high in sub-Saharan Africa (excluding Southern Africa) (85 per cent) and
in Southern Asia (75 per cent). The rate of urban informality drops to 60 per cent in the Middle East and
North Africa, 48 per cent in Latin America and the Caribbean, 42 per cent in East and South-Eastern Asia
(including China) and 29 percent in Eastern Europe and Central Asia.
Agriculture predominates in both total and informal employment in sub-Saharan Africa (excluding southern
Africa) at 60 and 65 percent respectively and in Southern Asia at 43 and 48 per cent respectively (table
3.4). In the other regions and sub-regions, including Southern Africa, the service sector is predominant
in total employment (41 to 68 per cent) and in informal employment (35 to 64 per cent). In formal
employment, services is the predominant sector in all regions and agriculture comprises less than 10 per
cent except in East and South-Eastern Asia (excluding China) and sub-Saharan Africa (excluding Southern
Africa) at 11 and 12 percent, respectively.
In Asia as a whole (excluding China) and in sub-Saharan Africa (excluding Southern Africa) agriculture is a
major source of employment for both women and men. However, there are significant differences between
13Women and Men in the Informal Economy – A Statistical Brief
women and men in some regions. In Southern Asia, agriculture is the primary source of employment for
women (57 per cent of total employment and 62 per cent of informal employment) but a less important
source of employment for men (38 percent and 44 per cent, respectively).
Table 3.4 Distribution of Total, Informal and Formal Employment by Branch of Industry, Sex and
Geographic Region, 2016, excluding Developed Countries (per cent)*
Agriculture Industry Services
Total Men Women Total Men Women Total Men Women
Composition of total employment
Asia and the Pacific 27 25 31 18 22 12 55 53 57
Southern Asia 43 38 57 26 27 21 32 35 22
East and South-Eastern Asia (including China) 17 14 22 14 18 8 69 68 70
East and South-Eastern Asia (excluding China) 36 37 36 23 24 21 41 40 43
Sub-Saharan Africa 58 58 57 10 12 7 33 29 37
Southern Africa 10 11 8 22 31 11 68 59 81
Rest of sub-Saharan Africa 60 61 59 9 11 6 31 28 35
Latin America and the Caribbean 16 20 9 22 29 12 62 51 79
Middle East and North Africa 24 21 37 23 27 9 52 52 54
Eastern Europe and Central Asia 16 16 16 26 34 16 58 50 68
Composition of informal employment
Asia and the Pacific 36 33 43 19 23 13 45 45 44
Southern Asia 48 44 62 24 25 21 27 31 17
East and South-Eastern Asia (including China) 26 20 33 15 20 9 60 60 58
East and South-Eastern Asia (excluding China) 45 44 46 20 22 18 35 34 36
Sub-Saharan Africa 64 66 61 9 11 6 28 24 32
Southern Africa 17 19 15 19 28 8 64 53 77
Rest of sub-Saharan Africa 65 67 62 8 10 6 27 23 31
Latin America and the Caribbean 23 29 14 20 27 11 57 44 75
Middle East and North Africa 34 29 51 25 29 12 41 42 38
Eastern Europe and Central Asia 33 29 38 24 33 12 43 38 50
Composition of formal employment
Asia and the Pacific 5 4 5 25 30 15 70 66 79
Southern Asia 2 2 4 37 42 24 61 56 73
East and South-Eastern Asia (including China) 7 6 6 14 17 11 79 77 83
East and South-Eastern Asia (excluding China) 11 13 7 24 24 23 65 63 70
Sub-Saharan Africa 12 13 11 14 17 9 74 70 80
Southern Africa 5 7 4 23 31 13 71 62 84
Rest of sub-Saharan Africa 12 13 11 14 16 9 75 71 80
Latin America and the Caribbean 7 9 2 24 30 15 69 61 83
Middle East and North Africa 5 4 6 19 22 9 76 74 85
Eastern Europe and Central Asia 8 9 6 27 35 17 65 55 77
Note: The distribution of total employment is based on national micro-datasets used for the estimates of informal and formal
employment. Global and regional estimates might slightly differ from those presented in ILOSTAT Employment by sector -- ILO
modelled estimates, May 2018.
Source: ILO calculations based on household survey micro-datasets.
* These data are for emerging and developing countries only, not developed countries, in the regions.
14Women and Men in the Informal Economy – A Statistical Brief
Across most geographic regions and in each type of employment — total and informal — the service
sector is a greater source of employment for women than for men, with the exception of Southern Asia,
East and South-Eastern Asia (including China) and the Middle East and North Africa. However in these
three regions as well as in all regions, the rates of formal employment in services are higher for women
than for men. For example, in the Middle East and North Africa, 85 per cent of women formal workers are
in services in comparison to 74 per cent of men formal workers. By contrast, industry is a greater source
of employment for men than for women. in each type of employment— total, formal and informal —
across the geographic regions.
4. Informality and Key Social Indicators
This section examines the relationship of informal employment with poverty, age and education. In so
doing, the section does not seek to determine causality between informal employment and these social
indicators but, rather, to report the co-relationship between them.
The relationship between informality and income per capita of countries — a key economic indicator —
has been detailed in Section 2. In presenting the linkages with social indicators, it is important to recall
that the share of informal employment is highest among low-income countries and lowest among high-
income countries. Specifically, the share of informal employment in total employment is 18 per cent in
developed countries, 67 per cent in emerging countries, and 90 per cent in developing economies. It is
also important to highlight that developing countries have the highest rates of self-employment, especially
own-account workers and contributing family workers; while developed countries have the lowest rates of
self-employment and the highest rates of wage employment.
Poverty
Not all informal workers are from poor households and not all formal workers are from non-poor
households. However, there is significant overlap between being informally employed and being poor.
Higher percentages of informal workers than formal workers are from poor households in developed,
emerging and developing countries (table 4.1). Out of 28 developing and emerging countries, the poverty
rate of informal workers is at least twice that of formal workers in 19 countries, five times or more in eight
of those countries and over 10 times as much in three countries (Bulgaria, Colombia and Romania). Out of
27 developed countries, the poverty rate of informal workers is twice that of formal workers in 22 countries
and five times as much in one country (Slovenia).
The close relationship between poverty and informality is also shown when comparing the percentage of
workers from poor and non-poor households who are informally employed (table 4.2). In all of the developing
and emerging countries, among workers from poor households, anywhere from just over 50 per cent to as
high as 98 per cent (in Cameroon and Rwanda) are informally employed. More than 80 per cent of workers
from poor households are informally employed in 21 out of 28 countries. Among workers from non-poor
households, half or more are informally employed in 19 countries. In nine of these countries 80 per cent
or more are informally employed. But in another nine less than half are informally employed. In developed
countries, the percent of informally employed ranged from 14 per cent to 62 per cent among workers from
poor households and from 4 per cent to 34 per cent among workers from non-poor households.
15You can also read