Investor Presentation - March 2021 - IDFC Bank

Page created by Curtis Molina
 
CONTINUE READING
Investor Presentation - March 2021 - IDFC Bank
Investor Presentation – March 2021
Investor Presentation - March 2021 - IDFC Bank
Disclaimer
This presentation has been prepared by and is the sole responsibility of IDFC FIRST Bank Limited (the "Bank" or "IDFC Bank") (together with its subsidiaries, referred to as the “Group”). By accessing this presentation, you are agreeing to be bound
by the trailing restrictions.
This presentation does not constitute or form part of any offer or invitation or inducement to sell or issue, or any solicitation of any offer or recommendation to purchase or subscribe for, any securities of the Group, nor shall it or any part of it or
the fact of its distribution form the basis of, or be relied on in connection with, any contractor commitment therefore. In particular, this presentation is not intended to be a prospectus or offer document under the applicable laws of any
jurisdiction, including India. No representation or warranty, express or implied, is made as to, and no reliance should be placed on, the fairness, accuracy, completeness or correctness of the information or opinions contained in this presentation.
Such information and opinions are in all events not current after the date of this presentation. There is no obligation to update, modify or amend this communication or to otherwise notify the recipient if information, opinion, projection, forecast
or estimate set forth herein, changes or subsequently becomes inaccurate.
Certain statements contained in this presentation that are not statements of historical fact constitute “forward-looking statements.” You can generally identify forward-looking statements by terminology such as “aim”, “anticipate”, “believe”,
“continue”, “could”, “estimate”, “expect”, “intend”, “may”, “objective”, “goal”, “plan”, “potential”, “proforma”, “project”, “pursue”, “shall”, “should”, “will”, “would”, or other words or phrases of similar import. These forward-looking statements
involve known and unknown risks, uncertainties, assumptions and other factors that may cause the Group’s actual results, performance or achievements to be materially different from any future results, performance or achievements expressed
or implied by such forward-looking statements or other projections. Important factors that could cause actual results, performance or achievements to differ materially include, among others: (a) material changes in the regulations governing our
businesses; (b) the Group's inability to comply with the capital adequacy norms prescribed by the RBI; (c) decrease in the value of the Group's collateral or delays in enforcing the Group's collateral upon default by borrowers on their obligations to
the Group; (d) the Group's inability to control the level of NPAs in the Group's portfolio effectively; (e) certain failures, including internal or external fraud, operational errors, systems malfunctions, or cyber security incidents; (f) volatility in
interest rates and other market conditions; and(g) any adverse changes to the Indian economy.
This presentation is being communicated to selected persons who have professional experience in matters relating to investments for information purposes only and does not constitute a recommendation regarding any securities of the Group.
Other persons should not rely or act upon this presentation or any of its contents.
The contents of this presentation are strictly confidential. By viewing or accessing the presentation, you acknowledge and agree that (i) the information contained herein is strictly confidential and (ii) the information is intended for the recipient
only and, except with the prior written consent of the Bank (a) the information shall not be disclosed, reproduced or distributed in any way to anyone else and (b) no part of these materials may be retained and taken away following this
presentation and the participants must return this presentation and all other materials provided in connection herewith to the Bank at the completion of the presentation. The distribution of this presentation in certain jurisdictions may be
restricted by law and recipients should inform themselves about and observe any such restrictions.
This presentation has been prepared by the Bank based on information and data which the Bank considers reliable, but the Bank does not make any representation or warranty, express or implied, as to and no reliance should be placed on, the
fairness, accuracy, completeness or correctness of the information contained herein or any statement made in this presentation. The presentation has not been independently verified. The Bank, each member of the Group and their respective
affiliates, directors, employees, advisers and representatives do not accept any liability for any facts made in or omitted from this presentation. To the maximum extent permitted by law, the Bank, each member of the Group and their respective
affiliates, directors, employees, advisers and representatives disclaim all liability and responsibility (including without limitation any liability arising from negligence or otherwise) for any direct or indirect loss or damage, howsoever arising, which
may be suffered by any recipient through use of or reliance on anything contained in or omitted from or otherwise arising in connection with this presentation.
The information contained in, and the statements made in, this presentation should be considered in the context of the circumstances prevailing at the time. There is no obligation to update, modify or amend such information or statements or to
otherwise notify any recipient if any information or statement set forth herein, changes or subsequently becomes inaccurate or outdated. The information contained in this document is provided as at the date of this document and is subject to
change without notice.
No one has been authorised to give any information or to make any representations other than those contained in this presentation, and if given or made, such information or representations must not be relied upon as having been authorised by
the Bank or their respective affiliates. The information in this presentation does not constitute financial advice (nor investment, tax, accounting or legal advice) and does not take into account an investor’s individual investment objectives,
including the merits and risks involved in an investment in the Bank or its securities, or an investor’s financial situation, tax position or particular needs.
This presentation contains data sourced from and the views of independent third parties. In replicating such data in this document, the Bank does not make any representation, whether express or implied, as to the accuracy of such data. The
replication of any third party views in this document should not necessarily be treated as an indication that the Bank agrees with or concurs with such views.
This presentation is for general information purposes only, without regard to any specific objectives, financial situations or informational needs of any particular person. The Group may alter, modify, regroup figures wherever necessary or
otherwise change in any manner the content of this presentation, without obligation to notify any person of such change or changes.

                                                                                                                                                                                                                             2
Investor Presentation - March 2021 - IDFC Bank
Executive summary
1
1.    FOUNDING OF IDFC FIRST BANK – Merger between erstwhile IDFC Bank and erstwhile Capital First in December 2018
2
2.    ERSTWHILE IDFC BANK HISTORY AND TRACK RECORD – Demerged infrastructure portfolio from IDFC Limited into IDFC Bank
3
3.    ERSTWHILE CAPITAL FIRST HISTORY AND TRACK RECORD – NBFC with specialization of financing consumers and MSMEs
4
4.    EMINENT BOARD AND MANAGEMENT TEAM
5
5.    PROGRESS SINCE MERGER IN DEC-18 : BUILT A STRONG FOUNDATION
         a A culture of customer first, innovation, collaboration, action oriented, empowered, integrity, trust and transparency
         b Bouquet of loans, savings accounts , fixed deposits, insurance, investments, wealth management, forex services, credit cards products
         c Built a strong branch network (576 branches, 541 ATMs) (1)
         d Built a stable liabilities platform (CASA ratio: 48% (2), retail deposits: INR584bn, retail deposits (
Investor Presentation - March 2021 - IDFC Bank
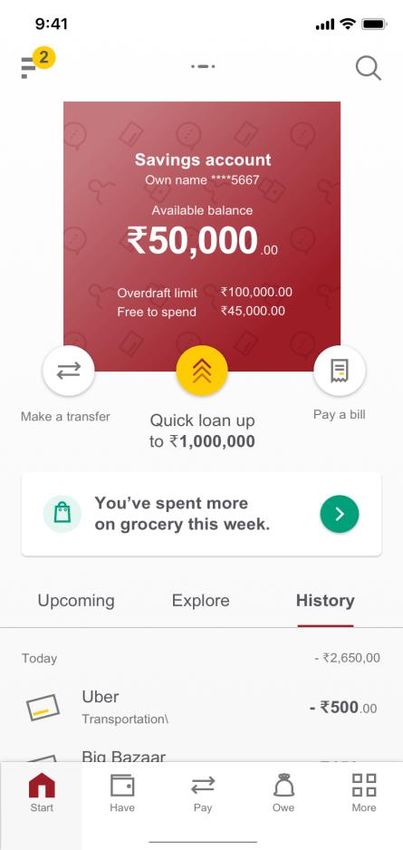
1. Founding of IDFC First Bank
        IDFC FIRST Bank was founded by the merger of Erstwhile IDFC Bank and Erstwhile Capital First on December 18, 2018
                            ▪        IDFC Bank was created by demerger of infrastructure lending business of IDFC
                                     Limited to IDFC Bank in 2015
                            ▪        IDFC Limited was set up in 1997 to finance infrastructure, focusing primarily on
                                     project finance and mobilization of capital for private sector infrastructure
                                     development
                            ▪        The Bank launched corporate banking, treasury solutions, retail and rural business
                                     and achieved CASA of INR 64 bn (1)
                            ▪        As a part of its strategy to diversify its loan book, IDFC Bank was looking for a merger                                                  ▪   Retail lending business model with

                                                                                                                                                                 Post-merger
                                     with a retail finance institution with adequate scale, profitability and specialized skills                                                   vintage of 8 years

                                                                                                                                                                               ▪   Gross funded assets of INR 1,047bn
                                                                                                                                                                                   at merger, out of which 35% of
                                ▪     Mr. Vaidyanathan concluded a leveraged management buyout in 2012 to form
                                                                                                                                                                                   loans were in the retail segment (3)
                                      Capital First
                                ▪     Company built unique ways of financing MSMEs and Indian consumers in niche                                                               ▪   NIM increased to 2.9% on merger (4)
                                      segments using analytics-driven technology platform
                                                                                                                                                                               ▪   Banking platform to grow retail
                                ▪     Built a AUM of INR 326bn (1)                                                                                                                 deposits and CASA
                                ▪     Strong credit skills, maintained low NPA levels
                                                                                                                                                                               ▪   Large retail customer base
                                ▪     High NIM, profitable growth engine with 5-year profit grew by 5.2x in 5 years (2)
                                ▪     Consistently rising RoE with pre-merger quarterly annualized ROE at 14.5% (1)
                                ▪     Company was on the lookout for a commercial banking license in order to access
                                      stable and low cost deposits

 1.
 2.
      As on Sep 30, 2018
      From FY13 to FY18
                           3.
                           4.
                                    As on Dec 31, 2018
                                    NIM computed as annualized Net Interest Income divided by average interest earning assets, including Capital First metrics
                                                                                                                                                                                                 4
Investor Presentation - March 2021 - IDFC Bank
2. Erstwhile IDFC Bank history and track record (pre-merger)
Post becoming a bank, IDFC Bank took early steps to diversify away from infrastructure
              Gross Funded Assets (INR bn)                                                   CASA Deposits (INR bn)              Gross Funded Assets mix (1)
                                                                     753                                                64
                                                                                                               57                          INR 753bn
                            702                  709

                                                                                                                                 Others                Retail
                                                                                                                                  11%                   15%
        524                                                                                       21

                                                                                      4
                                                                                                                                                         Wholesale
                                                                                                                                                           74%
     Mar-16               Mar-17              Mar-18               Sep-18           Mar-16       Mar-17       Mar-18   Sep-18

                      Net Worth (INR bn)                                                            NIM (%)                      Borrowings + Deposits (1) (2)
                                                153                                              2.1%                                      INR 1,012bn
                            147                                      148            2.0%                               1.9%
                                                                                                              1.7%                                  Retail Deposits
        136                                                                                                                                                9%

                                                                                                                                                           Wholesale
                                                                                                                                Others
                                                                                                                                     (2)                   Deposits
                                                                                                                                 64%
                                                                                                                                                             27%
     Mar-16              Mar-17               Mar-18               Sep-18           FY16         FY17         FY18      H1
                                                                                                                       FY19
 Erstwhile IDFC Bank was focused on infrastructure financing in India, but after becoming a bank began to diversify into corporate banking and retail
 banking
1. As on Sep 30, 2018
2. Others include borrowings, money market borrowings and Certificate of Deposits                                                              5
Source: Annual Reports, Investor Presentations of IDFC Bank
Investor Presentation - March 2021 - IDFC Bank
3. Erstwhile Capital First – history and track record (pre-merger)
Strong track record of loan growth, PAT growth, ROE growth, market cap growth and robust asset quality
                           AUM (INR bn)                                                                    Profit after tax (INR bn)                                                              AUM mix (1)
                                                                       326                 7.4           13.8           18.2           25.6           33.3                                            INR 326bn
                                                           270                                                                                        3.3
                                                                                                                                                                                       Wholesale
                                             198                                                                                        2.4
                                160                                                                                                                                    2.1               9%
                  120                                                                                                    1.7
     97                                                                                                   1.1
                                                                                            0.5
                                                                                                                                                                                                                  Retail
                                                                                                                                                                                                                   91%
  Mar-14 Mar-15 Mar-16 Mar-17 Mar-18                                  Sep-18              FY14           FY15           FY16          FY17           FY18               H1
                                                                                                                         EPS                                           FY19

                         Asset Quality (2)                                                                       Return on equity                                                            Market cap (INR bn) (3)
                                      1.7%                                                                                                                                                                             Share Price
                                                     1.7%             1.6%                                                                                             14.5%                                             Rs. 836
                                                                                                                                                     13.3%
                                                                                                                                      11.9%
                                                                                                                                                                               Share Price
                                      1.2%                                                                             10.1%                                                     Rs. 121
                                                      1.0%           1.0%                                8.3%                                                                                                     76       83
                     0.7%                                                                                                                                                                                                       61
                                                                                          4.9%                                                                                                               39
     0.5%                                                                                                                                                                                               36
                     0.2%                                                                                                                                                                12      15
       0.1%                                                                                                                                                                       8

   Mar-14          Mar-15   Mar-16                 Mar-17            Mar-18               FY14           FY15           FY16           FY17           FY18              H1      Mar- Mar- Mar- Mar- Mar- Mar- Jan- Mar-
                       GNPA                       NNPA                                                                                                                 FY19      12 13 14 15 16 17 18 18

1. As on 30-Sep-2018                                                    3.    Share price of Rs. 121 as of Mar 30, 2012 and Rs. 835 as of Jan 11, 2018 (Source: BSE)
2. NPA recognition norms migrated to 90 dpd effective Apr 01, 2017                                                                                                                                           6
Source: Annual Reports, Investor Presentations of Capital First
Investor Presentation - March 2021 - IDFC Bank
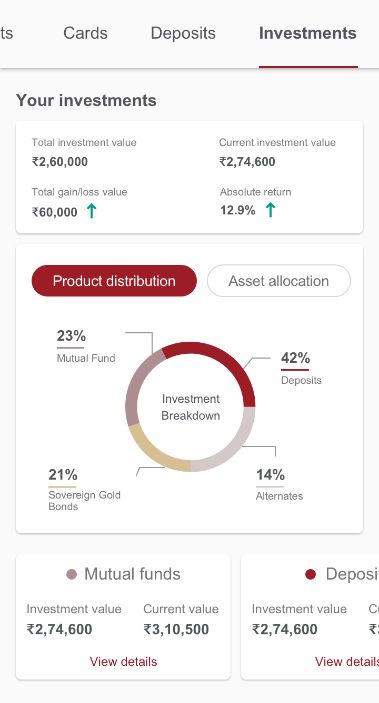
4. Driven by strong corporate governance and excellence and led by an experienced
management team with oversight from an eminent Board
Experienced management team

                                                                                                     Sudhanshu Jain             17+                    Madhivanan Balakrishnan         27+
                                                                                                     CFO                                               COO
                                                                                                     Last role: Dy. CFO - PAYTM e-commerce,            Last role: Chief Technology Officer -
                                                                                                     CFO - PAYTM Payments Bank                         ICICI Bank

                             V. Vaidyanathan        28+
                                MD & CEO
▪ Founded Capital First by acquiring a stake in a wholesale focused NBFC,
  and successfully transformed it into a technology driven consumer and
  MSME financing company, delivering attractive growth and profitability                              Satish Gaikwad           20+                     Saptarshi Bapari                17+
  metrics. Merged Capital First with IDFC bank in 2018 and took over as MD                            Head – Legal and Company Secretary               Head – Investor Relations
  and CEO of IDFC First Bank.                                                                         Prior organisation: Bombay Dyeing                Prior organisation: KPMG
▪ Worked with Citibank Consumer Banking division 1990-2000. Set up ICICI
  Group’s retail banking from 2000-2009. Joined Board of ICICI Bank in
  2006. MD & CEO of ICICI Prudential Life Insurance from 2009-2010

Eminent board of directors
         Dr. Sanjay Kumar                                   Sunil Kakar                                           Hemang Raja                           Sanjeeb Chaudhuri
         Non-Executive & Non                                Non-Executive & Non                                   Independent Director                  Independent Director
         Independent Director                               Independent Director                                  (Earlier Association: MD and Head,    (Former Regional Business Head,
         (Representing Govt. of India)                      (Director – IDFC Limited)                             India – Credit Suisse PE Asia)        India and South Asia, SCB)

         Dr. Brinda Jagirdar                                 Pravir Vohra                                           Aashish Kamat                        Vishal Mahadevia
         Independent Director                                Independent Director                                   Independent Director                 Non-Executive &
         (Earlier Association:                               (Earlier Association:                                  (Earlier Association:                Non Independent Director
         GM and Chief Economist – SBI)                       President and Group CTO – ICICI Bank)                  Country Head – UBS India)            (Warburg Pincus)

                                                                                                                                                                   7
Investor Presentation - March 2021 - IDFC Bank
Executive summary
1
1.    FOUNDING OF IDFC FIRST BANK – Merger between erstwhile IDFC Bank and erstwhile Capital First in December 2018
2
2.    ERSTWHILE IDFC BANK HISTORY AND TRACK RECORD – Demerged infrastructure portfolio from IDFC Limited into IDFC Bank
3
3.    ERSTWHILE CAPITAL FIRST HISTORY AND TRACK RECORD – NBFC with specialization of financing consumers and MSMEs
4
4.    EMINENT BOARD AND MANAGEMENT TEAM
5
5.    BUILT A STRONG FOUNDATION
         a A culture of customer first, innovation, collaboration, action oriented, empowered, integrity, trust and transparency
         b Bouquet of loans, savings accounts , fixed deposits, insurance, investments, wealth management, forex services, credit cards products
         c Built a strong branch network (576 branches, 541 ATMs) (1)
         d Built a stable liabilities platform (CASA ratio: 48% (2), retail deposits: INR584bn, retail deposits (
Foundation
5a. Building the right culture of trust, transparency and customer first is a
foundation block for the bank
                                                           Customer focused
                                  We put the customer’s interest first by putting ourselves in the
                                  customers’ situation and viewing things from their perspective

                       Collaborative                                                                 Innovative
           We develop, maintain and                                                                  We constantly strive to innovate
                                                                                                     in the customer’s interest
                                                                                                                                                  Our Mission
  strengthen relationships with both
    internal and external stakeholder
                                                                                                                                        We want to touch the lives of
                                                                Values
                                                          Our Cultural Tenets                                                           millions of Indians in a positive
                                                            to guide every
                         Empowered                          action we take                           Decisive
   We trust our employees’ ability to                                                                We exercise best judgement by      way by providing high-quality
          be successful, especially at                                                               making sound and well-informed
   challenging new tasks; delegating                                                                 decisions                          banking products and services to
         responsibility and authority
                                                                                                                                        them, with particular focus on
                                                                                                                                        aspiring consumers and
                                                          Action oriented
                                                          We consistently demonstrate focus, initiative and                             entrepreneurs of our new India,
                                                          energy to deliver our promise of delighting customers
                                                                                                                                        using contemporary technologies
                                         When IDFC First Bank was formed with the merger between erstwhile Capital First and
                                         erstwhile IDFC Bank, we deliberated a lot on what our founding theme should be and
                                         finalized on the theme ‘Always You First’ – where ‘You’ refers to our customer. This
                                         theme cuts across the entire organization and binds the bank to a single theme

                                                                                                                                                              9
Foundation

5b. The Bank offers a wide bouquet of loan products that have seasoned over the years
            Products offered across varied customer segments including consumers and MSMEs in different parts of India

 Loan Against Property              Small Business Loans                Consumer Durable Loans           Home Loans                      Vehicle Loans
 Long term loans to MSMEs           Unsecured loans to the self-        Financing to individuals for     To salaried and self-employed   To salaried and self-employed
 after proper evaluation of cash    employed individual or entity       purchasing of LCD/LED panels,    customers for purchasing        customers for purchasing two
 flows; against residential or      against business cashflows          Laptops, Air-conditioners etc.   house property                  wheelers
 commercial property

 Micro Enterprises Loans            Commercial Vehicle                  Joint Liability Group            Personal Loans                  To salaried and self-employed
 Loan solutions to small business                                                                        Unsecured Loans to the          customers for purchasing a new
                                    Loans                               Loans                                                            car or a pre-owned car
 owners                             Term Loans for individuals and      Loans for livelihood and micro   salaried and self-employed
                                    firms for purchasing new and pre-   enterprises for women in rural   customers for financial needs
                                    owned CVs                           areas                            such as medical emergency

▪ Apart from these products, IDFC FIRST Bank also offers working capital loans, corporate loans for business banking and corporate customers in India

                                                                                                                                              10
Foundation

5b. (contd): Wide product range for deposits, investments and insurance
    IDFC First Bank provides wide range of products and services along with savings accounts, term deposit accounts, current
 accounts, wealth management, forex services, cash management services and insurance products (distribution) to its customers

                                    Deposits                           Insurance distribution                  Credit cards
         ✓      Savings account                                    ✓ Life insurance solutions from   ✓ Dynamic interest rate
         ✓      Current account                                      well known insurers             ✓ Attractive rewarding
         ✓      Corporate salary account                           ✓ Health and general insurance      programs
         ✓      Fixed deposit                                        solutions                       ✓ Interest-free cash
         ✓      Recurring deposit                                                                      withdrawal (1)

                   Wealth management                                Payments and online services                Forex services
      ✓ Investment solutions                                      ✓ Debit cards and prepaid cards    ✓   Import and export solutions
      ✓ Mutual funds distribution                                 ✓ NACH and BHIM UPI                ✓   Domestic trade finance
      ✓ Life, health and general insurance                                                           ✓   Forex solutions and remittances
        distribution                                                                                 ✓   Overseas investments and capital
                                                                                                         account transactions

 1.   Up to next billing cycle or 48 days, whichever is earlier                                                           11
Foundation
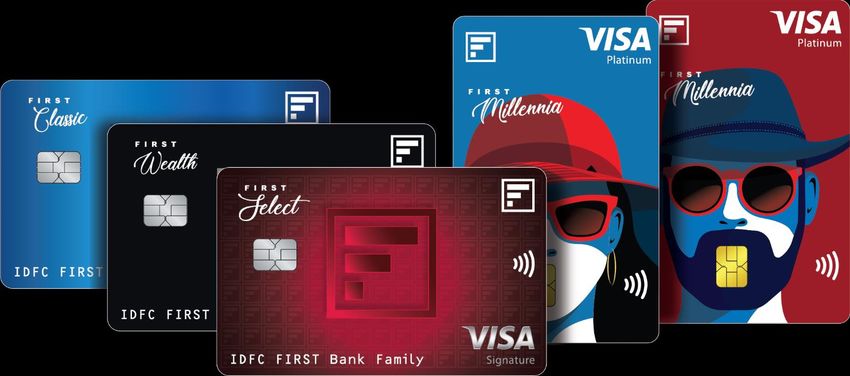
5b. (contd.) In keeping with our philosophy of customer first, a highly
customer friendly credit card launched in January 2021

                                                                                                                      A Credit Card with a differentiated proposition
      IDFC First Bank Credit Cards customer friendly initiatives
                                                                                                                 Customer friendly card launched by the Bank, keeping in line with the ethos of
                                                                                                                                             always customer first
▪ Dynamic Interest Rate (9% to 36% APR) (1)

▪ No charges for over spends upto 10% (2)
▪ Bank will remind customers on going over limit

▪ Lifetime Free (No annual fees)

▪ Simple scheme, upto 10x reward points
▪ No expiry
▪ Easy online redemption

▪ Interest-free cash withdrawal (up to next billing cycle or 48 days,                                                     Lifetime free                   Super rewarding                         Super saver interest         Interest free
  whichever is earlier)                                                                                                   credit card                     program                                 rate (APR starting           cash
                                                                                                                                                                                                  from 9%)                     withdrawal (3)

 1.   Customer rates depending on algorithm, factoring in credentials, relationship with the Bank and many other parameters
 2.   Spending over limit is usually inadvertent by customers. Hence as a customer friendly measure, the Bank will intimate the customers if their spends are going above limit to avoid any charges incurred by them    12
 3.   Up to next billing cycle or 48 days, whichever is earlier
Foundation

5c. Expanding our pan-India footprint
                                                                                                                                          Widespread distribution network (1)

                                                                                                                                                                                     Branch
                                                                                                                                                                                     Branch network
                                                                                                                                                                                            network
                                         Jammu & Kashmir

                                                                                                                                                                                                        576
                                    Punjab
                                                                                                                                                                                               464
                                        Chandigarh       Uttarakhand
                                           Haryana
                                                       Delhi
                                                                                                                                                                                  242
                                 Rajasthan
                                                         Uttar Pradesh                                                                                    150
                                                                                  Bihar               Assam
                                                                                                   Meghalaya   Nagaland

                                                                            Jharkhand
                              Gujarat             Madhya Pradesh                                     Tripura
                                                                                          West                                                          Mar-18                  Mar-19        Mar-20   Dec-20
                                                                    Chattisgarh           Bengal
                                                                             Odisha

                                        Maharashtra

                                                        Telangana                                                                                                                     ATM network
                                                                         Puducherry

                                  Goa                 Andhra Pradesh
                                                                                                                                                                                                        541
                                         Karnataka
                                                                                                                                                                                               356
                                                      Tamil Nadu
                                             Kerala
                                                                                                                                                                                   113
                                                                                                                                                            55

                                                                                                                                                        Mar-18                  Mar-19        Mar-20   Dec-20

Note: Metrics for FY18, FY19 and FY20 are not comparable due to the merger effective Dec 18, 2018. Illustrative representation of branch footprint as on Dec 31, 2020, picture not to scale
1.    Metrics for FY18, FY19 and FY20 are not comparable due to the merger effective Dec 18, 2018
                                                                                                                                                                                                        13
Foundation
5d. Built a diversified & stable liabilities platform; proven ability to raise
retail deposits at scale
        Increased retail deposits (INRbn) (1)                                              Reduced wholesale deposits (INR bn) (2)                           Reduced certificate of deposits (INR bn)
                                                                                                                 273                                                      288
                                                                  584                                                                238
                                                                                             227
                                                                                                                                                     189      197
                                              339

                          132                                                                                                                                                         71             67
       57

   Mar 18              Mar 19              Mar 20               Dec 20                     Mar 18             Mar 19              Mar 20            Dec 20   Mar 18     Mar 19      Mar 20      Dec 20

            CASA as a % of total deposits (2)                                                           Deposits
Foundation
5e. Built a diversified and strong retail lending book, top 10 borrowers’
concentration down to 6.3% of total funded assets

         Retail gross funded assets (INR bn)                                                Wholesale (excl. infra) loan assets (INR bn)                Infrastructure loan assets (INR bn)

                                                                   667                                              322
                                                                                                                                                      268
                                               573
                                                                                                270                                                               215
                          408                                                                                                   245          232                              148
                                                                                                                                                                                          116

       70

   Mar-18              Mar-19              Mar-20               Dec-20                       Mar-18               Mar-19       Mar-20      Dec-20    Mar-18     Mar-19      Mar-20       Dec-20

   Contribution to total gross funded assets                                                           Retail gross funded assets mix                   Reduction in Top 10 Borrowers (1)
                                                                                                                                                     18.8%
                                                                   60%
                                               54%                                                                   11%        12%         11%
                                                                                                43%                  17%        18%         17%
  37%                      37%                                                                                                                                   9.8%
  37%                         29%              23%                                                                   36%        35%         35%                              7.2%
                                                                   21%                          19%                                                                                       6.3%
                             19%                  14%                                            6%
 16%                                                      11%                                                        35%        35%         37%
 10%                      15%                                                                   32%
                                             9%            8%
    Mar-18              Mar-19               Mar-20      Dec-20                               Mar-18    Mar-19                 Mar-20       Dec-20   Mar 18      Mar 19      Mar 20      Dec 20
    Retail                                    Wholesale (excl. infra)                          Mortgage                         Consumer
                                                     (2)
    Infra                                     Others                                           MSME/SME                         Rural MFI and KCC
                   Pre-merger in erstwhile IDFC Bank                           Post-merger in the merged entity, IDFC FIRST Bank
 Note: Metrics for FY18, FY19 and FY20 are not comparable due to the merger effective Dec 18, 2018. KCC - Kisaan credit card
 1. As a % of total funded assets                                                                                                                                           15
 2. Others include Inorganic PSL buyout, Security receipts and Loan converted to equity
Foundation

5f. Building digital capabilities for retail offering

                                               PORTFOLIO
                                                                   REVENUE
                                              MANAGEMEN
                                                                 ACCELERATION                    ▪   Cross sell/up-sell framework
 ▪ Behavioral scorecard                            T
                                                Portfolio         Revenue
                                                                                                 ▪   Propensity scorecard
 ▪ Portfolio review                           management         acceleration                    ▪   Hyper-personalization
 ▪ Retention calculator
                                                                                                 ▪   Next best offer and action

                                   FRAUD
                                      Fraud                                       DISTRIBUTION
                                                                                Customer
                                                                                 Service       ▪ Channel performance analysis
 ▪ Multiple fraud scorecards                                                                     ▪ Online query resolution for
                                                                                                   improved customer experience

 ▪ Application scorecards with       Acquisition                                Collection     ▪ Cheque bounce
   demographics, bureau and      ACQUISITION                                       COLLECTIONS ▪ Resolution analysis
   Banking information
                                                                                                 ▪ Flow analysis
 ▪ Risk based pricing
                                                                                                 ▪ Vintage analysis
 ▪ Instant dedupe capabilities
                                                   Robust credit decisions
                                                                                                                 16
Foundation
5f. (contd.) Recently launched new banking application with an
enhanced UI UX – in Test & Learn Stage

                                          Dashboard               Personal Finance Management              Acquisition journeys              Payments
                                     • Easy navigation – all      • Curated narrations and             • 2 click deposits            • 3 click payment with auto-
                                       features in 2-3 clicks       categorization                                                     selection of rail road
                                                                                                       • Loan application
                                     • One view of all            • Search across transactions by                                    • Search based payments
                                                                                                       • Credit card pre-
                                       accounts (savings,           name, category, rail-road                                        • 2 step payee addition
                                                                                                         approved cross-sell
                                       current, working                                                                                without IFSC code
                                                                  • Smart filters
                                       capital. deposits,                                              • 1 click overdraft
                                                                                                                                     • Auto-pay for bill payment
                                       credit cards)              • Income and expense                   against FD
                                                                    dashboard                                                        • QR scan for payments
                                     • Universal search
                                     • Personalized offers                     Service                      Business Solutions
                                                                  • STP service requests e.g. debit    •     Bulk payments
                                                                    card services, profile update,
                                                                                                       •     Door step collections
                                                                    etc.
                                                                                                       •     Remittances
                                                                  • Credit card payments, convert
                                                                    to EMI, rewards                    •     cash management
                                                                                                            services
                                                                  • Chat, video call & call back (in
                                                                    early stage of launch)             •     Trade services

                                                                Investments
                                     • Consolidated dashboard across          • Select schemes               Integrated unified
                                       MFs and deposit products                                            communication across
                                                                                                           voice, video and chat
                                     • Digital MF KYC in 2 clicks        • Choose portfolio
                                     • Perpetual, step-up and edit         recommendations                  within banking app
                                       SIP                                 based on risk profile

                                                                                                                                     17                             17
Executive summary
1
1.    FOUNDING OF IDFC FIRST BANK – Merger between erstwhile IDFC Bank and erstwhile Capital First in December 2018
2
2.    ERSTWHILE IDFC BANK HISTORY AND TRACK RECORD – Demerged infrastructure portfolio from IDFC Limited into IDFC Bank
3
3.    ERSTWHILE CAPITAL FIRST HISTORY AND TRACK RECORD – NBFC with specialization of financing consumers and MSMEs
4
4.    EMINENT BOARD AND MANAGEMENT TEAM
5
5.    PROGRESS SINCE MERGER IN DEC-18 : BUILT A STRONG FOUNDATION
         a A culture of customer first, innovation, collaboration, action oriented, empowered, integrity, trust and transparency
         b Bouquet of loans, savings accounts , fixed deposits, insurance, investments, wealth management, forex services, credit cards products
         c Built a strong branch network (576 branches, 541 ATMs) (1)
         d Built a stable liabilities platform (CASA ratio: 48% (2), retail deposits: INR584bn, retail deposits (
6a. Overall Bank - Gross and Net NPA, impact of COVID 19
                                                                                                                                                                               Long term
                                                                                                                                                                                             Proforma        Change
                                                                 Mar-19                       Jun-19                      Sep-19                      Dec-19                   pre COVID
                                                                                                                                                                                Average
                                                                                                                                                                                              Dec-20       (bps) Dec-20

    Gross NPA - Bank                                             2.43%                        2.66%                       2.62%                       2.83%                       2.63%       4.18%            155

    Net NPA - Bank                                               1.27%                        1.35%                       1.17%                       1.23%                       1.25%       2.04%            78

    Provision Coverage Ratio (%)                                   48%                         50%                          56%                         57%                            53%     52%              -

▪       For the analysis, we submit that the reported NPAs in the last 3 quarters including quarter ending Dec 31, 2020 were lower than actual and not
        representative of the real situation due to Supreme Court’s order on not declaring accounts as NPAs until further orders. Hence the bank draws
        attention to the pre-COVID NPA levels (1) of the bank, and comparing the same with the proforma (effectively actual) NPA post-COVID (2)
▪       As a result of the COVID, the Gross NPA for the bank as of Dec 31, 2020 has increased by 155 bps as compared to Pre-COVID average. Similarly the
        Net NPA for the bank as of Dec 31, 2020 has increased by 78 bps
▪       Provision Coverage including the general provision, COVID19 provision, specific provisions on NPAs was 309% on reported NPA and 99% on
        Proforma NPA (2)

    Note: Long term COVID average indicates average GNPA/NNPA of last 4 quarters prior to COVID-19
    1. The period Mar-2019 to Dec-2019                                                                                                                                                                19
    2. As of Dec 31, 2020; Proforma GNPA/NNPA indicates the numbers without considering the impact of the Supreme Court notification to stop NPA classification post August 31, 2020
6b. The Bank has identified the stressed accounts (not yet NPA) and has provided for them

              Exposure to stressed assets (INR bn)                                Client Description (INR bn) (31-Dec-20)        O/S Exposure       Provision      PCR%
                                                                                  Toll Road Projects in MH                            9.0               1.5           17%
  PCR %         23%              49%                 51%                          Thermal Power Project in Orissa                     5.5               5.5         100%
                                                                                  Toll Road (BOT) project in MH                       2.5               0.1            5%
                                                                                  Financial Conglomerate in Mumbai                    2.2               2.2         100%
                41                                                                                                                    1.6               0.9
                                                                                  Wind Power Projects in AP, GJ, KN, RJ                                               57%
                                                                                  Logistics Company in Karnataka                      1.0               1.0         100%
                                   32
                                                                                  Financial Institution in MH                         0.9               0.9         100%
                                                      25
                                                                                  Solar Projects in RJ                                0.9                -             0%
                                                                                  Thermal power in Chattisgarh                        0.8               0.2           20%
                                                                                  Toll Road Projects in TN                            0.4               0.1           23%
                                                                                  Wind Power Projects in KN and RJ                    0.2               0.2           95%
                                                                                  Microfinance Institution in Orissa                  0.2               0.2         100%
                                                                                  Toll Road Project in Punjab                         0.2               0.2         100%
              Mar-19            Mar-20              Dec-20
                                                                                  Total Stressed Pool Identified                      25.3              12.9         51%

▪ Apart from the above identified accounts, the Bank had also marked one large telecom account as stressed and provisioned 25% against the total outstanding of INR 32.4bn
  (Funded – INR 20bn and Non-funded – INR 12.4bn). The said account is current and has no overdues as of Dec 31 2020.

                                                                                                                                                   20
6c. Retail Loans - Gross and Net NPA trends, impact of COVID 19
                                                                                                                                                                              Long term
                                                                                                                                                                                           Proforma        Change
                                                                Mar-19                       Jun-19                      Sep-19                     Dec-19                    pre COVID
                                                                                                                                                                               Average
                                                                                                                                                                                            Dec-20       (bps) Dec-20

    Gross NPA - Bank                                             2.18%                       2.32%                       2.31%                       2.26%                       2.27%      3.88%            161

    Net NPA - Bank                                               1.24%                       1.14%                       1.08%                       1.06%                       1.14%      2.35%            121

    Provision Coverage Ratio (%)                                  43%                          51%                        54%                         54%                            51%     41%              -

▪       Thus as per analysis, as a result of the COVID, the Gross NPA of the retail assets for the bank as of Dec 31, 2020 has increased by 161 bps as
        compared to pre-COVID average
▪       Similarly the Net NPA of the retail assets for the bank as of Dec 31, 2020 has increased by 121 bps

    Note: Long term COVID average indicates average GNPA/NNPA of last 4 quarters prior to COVID-19. Proforma GNPA/NNPA indicates the numbers without considering the impact of the
    Supreme Court notification to stop NPA classification post August 31, 2020
                                                                                                                                                                                                    21
6d. The Bank underwrites retail loans with lot of due diligence and rigour, drawing on
experience and has built effective monitoring and collection capabilities

  6a - Robust Underwriting Process                       6b - Strong Monitoring Framework                       6c - Efficient Collection Machinery
           (As applicable product wise)

 • Integrated decision support system for                •   Cheque bounce analysis and monitoring              •   Robust mechanism exists for calling, online
   underwriting                                              monthly: product wise, segment wise,                   collections, digital collections, field collections
 • Instant de-duplication capability                         geography wise, channel wise                           monitoring
 • Financials analysis including net worth, liquidity,   •   Early delinquency analysis: Non- starter (quick    •   Focus on reducing cheque bounces, through
   leverage, turnover, working capital cycle, GST            mortality) analysis, 1st payment, 2nd payment,         better underwriting, interventions and test &
   return                                                    3rd Payment default rates analysis                     learn process
 • Banking analysis: the Bank statements of the
   customer is analyzed and correlated to the            •   Fraud incidence monitoring                         •   Segmentation to drive differentiated collections
                                                                                                                    action basis propensity to flow
   financials                                            •   Collection efficiency analysis for every mode
 • Consumer and commercial Credit Bureau check               and channels across delinquency buckets            •   Constant monitoring of call quality and
   for variables including enquiries, repayment                                                                     customer interface quality for improving
                                                         •   Vintage analysis of the portfolio performance
   record, vintage analysis etc.                                                                                    collection experience for customers
 • Demographic and bureau credit scorecards              •   Delinquency flow analysis: Normalization, roll
                                                                                                                •   Bucket wise, delinquency and resolution % for
                                                             forward, roll back for every delinquency buckets
 • Fraud check: Hunter checks fraud score                                                                           every product at granular level
                                                             for each product
 • Field verifications                                                                                          •   Granular monitoring of portfolio
 • Personal discussions with customer at customer        •   Scorecard monitoring
   premises                                              •   Early warning checks for MSME products
 • CRILC (RBI) checks for verification on financials,
   legal cases, directors
 • Collateral valuation: legal and technical checks;
   external valuers

                                                                                                                                               22
Executive summary
1
1.    FOUNDING OF IDFC FIRST BANK – Merger between erstwhile IDFC Bank and erstwhile Capital First in December 2018
2
2.    ERSTWHILE IDFC BANK HISTORY AND TRACK RECORD – Demerged infrastructure portfolio from IDFC Limited into IDFC Bank
3
3.    ERSTWHILE CAPITAL FIRST HISTORY AND TRACK RECORD – NBFC with specialization of financing consumers and MSMEs
4
4.    EMINENT BOARD AND MANAGEMENT TEAM
5
5.    PROGRESS SINCE MERGER IN DEC-18 : BUILT A STRONG FOUNDATION
         a A culture of customer first, innovation, collaboration, action oriented, empowered, integrity, trust and transparency
         b Bouquet of loans, savings accounts , fixed deposits, insurance, investments, wealth management, forex services, credit cards products
         c Built a strong branch network (576 branches, 541 ATMs) (1)
         d Built a stable liabilities platform (CASA ratio: 48% (2), retail deposits: INR584bn, retail deposits (
7. Balance sheet
                                                                                                              As at            As at            As at               As at
Particulars (INR bn)
                                                                                                     March 31, 2018   March 31, 2019   March 31, 2020   December 31, 2020
CAPITAL AND LIABILITIES
Capital                                                                                                         34               48               48                  57
Reserves and surplus                                                                                           119              134              105                 120
Deposits                                                                                                       482              705              651                 843
Borrowings                                                                                                     573              700              574                 408
Other liabilities and provisions                                                                                58               86              114                 129
TOTAL                                                                                                         1,265            1,672            1,492               1,557
ASSETS
Cash and balances with Reserve Bank of India                                                                    31               41               34                  38
Balances with banks and money at call and short notice                                                          18               54                8                  34
Investments                                                                                                    612              585              454                 418
Advances                                                                                                       522              863              856                 949
Fixed assets                                                                                                     8               10               10                  12
Other assets                                                                                                    75              119              130                 106
TOTAL                                                                                                         1,265            1,672            1,492               1,557

 Note: Metrics for FY18, FY19 and FY20 are not comparable due to the merger effective Dec 18, 2018
                                                                                                                                                        24
7. Income statement
Particulars (INR bn)                                                                              FY18                             FY19           FY20       9M FY20            9M FY21

Gross Interest Income                                                                                   89                            119          159           119                116

Interest Expense                                                                                        71                              87         102            78                 66

Net Interest Income                                                                                     18                              32          56            41                 50

Other Income                                                                                            11                                 9        17            12                 14

Operating Income                                                                                        29                              41          74            53                 64

Operating Expense                                                                                       17                              33          54            39                 45

Operating Profit                                                                                        13                                 8        19            14                 19
Provisions (Other than Tax) & Contingencies
                                                                                                          2                             15          43            39                 15
(Net)
Exceptional Items (Goodwill at merger)                                                                     -                            26               -             -                  -

Profit Before Tax                                                                                       10                            (33)         (24)          (25)                     4

Tax                                                                                                       2                           (14)               5             4                  1

Profit After Tax                                                                                          9                           (19)         (29)          (29)                     3

Note: Metrics for FY18, FY19 and FY20 are not comparable due to the merger effective Dec 18, 2018. Metrics for 9MFY20 and 9MFY21 are comparable
                                                                                                                                                                           25
7. Profitability trend in the last 8 quarters

                                                               Profit after Tax (INR bn)

                                                                                 0.7              0.9              1.0               1.3

          (2.2)

                           (6.2)             (6.8)

                                                              (16.4)
        Q4FY19            Q1FY20           Q2FY20            Q3FY20            Q4FY20           Q1FY21           Q2FY21            Q3FY21

▪   The Bank took provisions against the identified legacy wholesale accounts such as a housing finance company, a financial conglomerate and some
    infrastructure accounts during the initial periods post-merger, and such provisions reduced the net-worth. This coupled with low yield
    infrastructure loans kept earnings suppressed post merger. During the last 8 quarters post merger, the bank has increased the NIM to a healthy
    4.65% (Q3 FY21) and PPOP of the bank has registered an increase, resulting in positive PAT over the last 4 quarters

                                                                                                                              26
7. Growth in higher yield retail assets coupled with increasing contribution from low cost
retail deposits driving an accelerated NIM expansion

Yield accretion driven by retail…                                                        …CASA growth driving down cost of funds…                              …resulting in accelerated NIM expansion

                              Yields (%)                                                    Cost of deposits (%) and cost of funds (%)                                   Net interest margin (%) (1)

                                                                                                                                                                                                       4.6%
       17.0%
                       16.3%          16.3%           16.3%         15.9%                                                                                                           3.6%
                                                                                                                                                                                              3.4%

                                                              13.1%                      7.3%            7.6%            7.4%            7.4%7.1%
                               12.5%           12.3%                                            6.4%             7.0%           7.0%                6.8%6.4%
                                                                                                                                                                           2.4%
               10.6%
 9.2%                                                                                                                                                             1.6%

     FY18           FY19            FY20         9MFY20         9MFY21                       FY18           FY19            FY20          9MFY20    9MFY21        FY18     FY19     FY20     9MFY20 9MFY21

                    Yield on overall funded assets                                                         Cost of funds             Cost of deposits
                    Yield on retail funded assets

 Note: Metrics for FY18, FY19 and FY20 are not comparable due to the merger effective Dec 18, 2018. Metrics for 9MFY20 and 9MFY21 are comparable
 1. On average interest earning assets
                                                                                                                                                                                        27
7. High cost borrowing – cost and maturity profile
Potential to be replaced with low cost deposits as and when they mature

                                                       Long Term
Particulars (INR bn)                  Infra Bonds                  Other Bonds   Refinance        Total
                                                    Legacy Bonds

Upto Mar-21                                     -            16             4           1           21

FY 21-22                                        -            11            11          23           45

FY 22-23                                      15               -           19          31           65

FY 23-24                                      14             17             8          19           58

FY 24-25                                      57             13             2           9           81

Beyond FY 25                                   9             38             7            -          54

Total                                         95             95            50          83          323

RoI (%)                                    8.87%          8.98%         8.76%       7.77%         8.60%

Wtd. Res. Tenor (Yrs)                       3.36            3.97          7.32        1.72         3.74

 Note: Positions as of Dec 31, 2020                                                          28
7. Strong capital position and liquidity buffers provide a stable platform for growth going
forward

   Net Worth (Shareholders’ Funds) (INR bn)                                                          Capital Adequacy Ratio (%)                  Avg. Liquidity coverage Ratio (1)

                                                                                             CET 1             Regulatory requirement of CRAR
                                                        Because of Profits during
                                                          the last quarters and              Tier II CAR       Regulatory requirement of CET-1
                                                         Capital Raise in Jun-20
                                                                                             18.0%
                           182                                    177                                                                                                      132%
                                                                                              0.3%
        153                                     153                                                        15.5%
                                                                                                           0.2%                     14.3%
                                                                                                                       13.4%
                                                                                                                                     0.5%
                                                                                                                        0.1%
                                                                                             17.7%
                                                                                                           15.3%       13.3%        13.8%
                                                                                                                                                   111%
                                                                                                                                   10.875%

                                                                                                                                    7.375%

     Mar-18             Mar-19              Mar-20              Dec-20                      Mar-18         Mar-19     Mar-20       Dec-20         Mar-20                  Dec-20

 Note: Metrics for FY18, FY19 and FY20 are not comparable due to the merger effective Dec 18, 2018
 1. For corresponding quarter
                                                                                                                                                                     29
8. In summary

                       Established brand with growing presence across India

                                  Led by an experienced professional management team backed by an eminent Board

Building a
                                       Retail lending model with experience of growth and profitability
profitable, scalable
and world class
retail bank on the
                                         Strong liability franchise; proven ability to raise retail liabilities
platform of new
emerging
technologies with                      NIM expansion driven by increasing contribution from high yielding retail assets and reducing exposure to low yielding
                                       wholesale assets along with replacing high cost legacy liabilities with low cost retail deposits
high levels of
corporate
governance                        Stable asset quality in retail financing through advanced origination, credit underwriting, monitoring, and collection capability

                       Strong foundations established; well positioned for growth

                                                                                                                                                  30
You can also read