Fourth Quarter Earnings Conference Call - Occidental Petroleum Corporation February 23, 2021

Page created by Ernest Robbins
 
CONTINUE READING
Fourth Quarter Earnings Conference Call - Occidental Petroleum Corporation February 23, 2021
Fourth Quarter
Earnings Conference Call
Occidental Petroleum Corporation
February 23, 2021
Fourth Quarter Earnings Conference Call - Occidental Petroleum Corporation February 23, 2021
Cautionary Statements
 Forward-Looking Statements
 This presentation contains “forward-looking statements” within the meaning of the “safe harbor” provisions of the Private Securities Litigation Reform Act of 1995, including but not limited to statements about Occidental
 Petroleum Corporation’s (“Occidental”) expectations, beliefs, plans or forecasts. Forward-looking statements involve estimates, expectations, projections, goals, forecasts, assumptions, risks and uncertainties, many of
 which involve factors or circumstances that are beyond Occidental’s control. Actual results may differ from anticipated results, sometimes materially, and reported or expected results should not be considered an indication
 of future performance. Factors that could cause actual results to differ include, but are not limited to: the scope and duration of the COVID-19 pandemic and actions taken by governmental authorities and other third
 parties in response to the pandemic; Occidental’s indebtedness and other payment obligations, including the need to generate sufficient cash flows to fund operations; Occidental’s ability to successfully monetize select
 assets, repay or refinance debt and the impact of changes in Occidental’s credit ratings; assumptions about energy markets; global and local commodity and commodity-futures pricing fluctuations, such as the sharp
 decline in crude oil prices that occurred in the first half of 2020; supply and demand considerations for, and the prices of, Occidental’s products and services; actions by members of the Organization of the Petroleum
 Exporting Countries (OPEC) and non-OPEC oil producing countries; results from operations and competitive conditions; future impairments of our proved and unproved oil and gas properties or equity investments, or write-
 downs of productive assets, causing charges to earnings; unexpected changes in costs; availability of capital resources, levels of capital expenditures and contractual obligations; the regulatory approval environment,
 including Occidental's ability to timely obtain or maintain permits or other governmental approvals, including those necessary for drilling and/or development projects; Occidental's ability to successfully complete, or any
 material delay of, field developments, expansion projects, capital expenditures, efficiency projects, acquisitions or dispositions; risks associated with acquisitions, mergers and joint ventures, such as difficulties integrating
 businesses, uncertainty associated with financial projections, projected synergies, restructuring, increased costs and adverse tax consequences; uncertainties and liabilities associated with acquired and divested properties
 and businesses; uncertainties about the estimated quantities of oil, natural gas and natural gas liquids reserves; lower-than-expected production from development projects or acquisitions; Occidental’s ability to realize the
 anticipated benefits from prior or future streamlining actions to reduce fixed costs, simplify or improve processes and improve Occidental’s competitiveness; exploration, drilling and other operational risks; disruptions to,
 capacity constraints in, or other limitations on the pipeline systems that deliver Occidental’s oil and natural gas and other processing and transportation considerations; general economic conditions, including slowdowns,
 domestically or internationally, and volatility in the securities, capital or credit markets; uncertainty from the expected discontinuance of LIBOR and transition to any other interest rate benchmark; governmental actions and
 political conditions and events; legislative or regulatory changes, including changes relating to hydraulic fracturing or other oil and natural gas operations, retroactive royalty or production tax regimes, deepwater and
 onshore drilling and permitting regulations and environmental regulation (including regulations related to climate change); environmental risks and liability under international, provincial, federal, regional, state, tribal, local
 and foreign environmental laws and regulations (including remedial actions); potential liability resulting from pending or future litigation; disruption or interruption of production or manufacturing or facility damage due to
 accidents, chemical releases, labor unrest, weather, natural disasters, cyber-attacks or insurgent activity; the creditworthiness and performance of Occidental’s counterparties, including financial institutions, operating
 partners and other parties; failure of risk management; Occidental’s ability to retain and hire key personnel; reorganization or restructuring of Occidental’s operations; changes in state, federal or foreign tax rates; and
 actions by third parties that are beyond Occidental's control. Words such as “estimate,” “project,” “predict,” “will,” “would,” “should,” “could,” “may,” “might,” “anticipate,” “plan,” “intend,” “believe,” “expect,” “aim,” “goal,”
 “target,” “objective,” “likely” or similar expressions that convey the prospective nature of events or outcomes generally indicate forward-looking statements. You should not place undue reliance on these forward-looking
 statements, which speak only as of the date of this presentation. Unless legally required, Occidental does not undertake any obligation to update, modify or withdraw any forward-looking statement, as a result of new
 information, future events or otherwise. Other factors that could cause actual results to differ from those described in any forward-looking statement appear in Part I, Item 1A “Risk Factors” of Occidental’s Annual Report on
 Form 10-K for the year ended December 31, 2020 (“2020 Form 10-K”), and in Occidental’s other filings with the U.S. Securities and Exchange Commission (the “SEC”).

 Use of non-GAAP Financial Information
 This presentation includes non-GAAP financial measures. Where available, reconciliations to comparable GAAP financial measures can be found on the Investor Relations section of Occidental's website at www.oxy.com.

 Cautionary Note to U.S. Investors
 The SEC permits oil and gas companies, in their filings with the SEC, to disclose only proved, probable and possible reserves. Any reserve estimates provided in this presentation that are not specifically designated as being
 estimates of proved reserves may include "potential" reserves and/or other estimated reserves not necessarily calculated in accordance with, or contemplated by, the SEC’s latest reserve reporting guidelines. U.S. investors
 are urged to consider closely the oil and gas disclosures in our 2020 Form 10-K and other reports and filings with the SEC. Copies are available from the SEC and through our website, www.oxy.com.

                                                                                                                                                                                                                                          2
Fourth Quarter Earnings Conference Call - Occidental Petroleum Corporation February 23, 2021
Occidental   •
             •
                 Fourth Quarter Highlights
                 Financial Results and Guidance

                                                  3
Fourth Quarter Earnings Conference Call - Occidental Petroleum Corporation February 23, 2021
Fourth Quarter 2020 Highlights

             $0.8 B                                                                 $2.4 B         $2.0 B
      Free Cash Flow                                                             Divestitures     Refinancing
        Generation                                                                 Closed         Completed

  Strong Operational                                                        Land Grant             Near-Term
    Excellence and                                                      Colombia Onshore        Maturities Moved
      Efficiency                                                        Non-Core Acreage         to Later Years

   Note: See the reconciliations to comparable GAAP financial measures on our website
                                                                                                                   4
Fourth Quarter Earnings Conference Call - Occidental Petroleum Corporation February 23, 2021
Transitioned into 2021 with Improved Financial Position

2020 Success Supports 2021 Financial Position

                      $
                                           $2.4 B                                                  $   $7.0 B
                                           Debt reduced in 2020                                        Near-term debt extended
                                                                                                       through 2025+

                                            $1.8 B                                                     22%
                                                                           1

                                            Reduced overhead budget                                    2021 Base declined lowered
                                            continues into 2021

                                           $2.9 B                                                      $2-3 B         2

                                           2021 Capital budget                                         Remaining divestitures
                                           prioritizes FCF
   12021     overhead is defined as SG&A and other operating and non-operating expenses
   2.Net   of expected taxes, post Colombia which includes ~$350 MM of divested non-core acreage
                                                                                                                                    5
Fourth Quarter Earnings Conference Call - Occidental Petroleum Corporation February 23, 2021
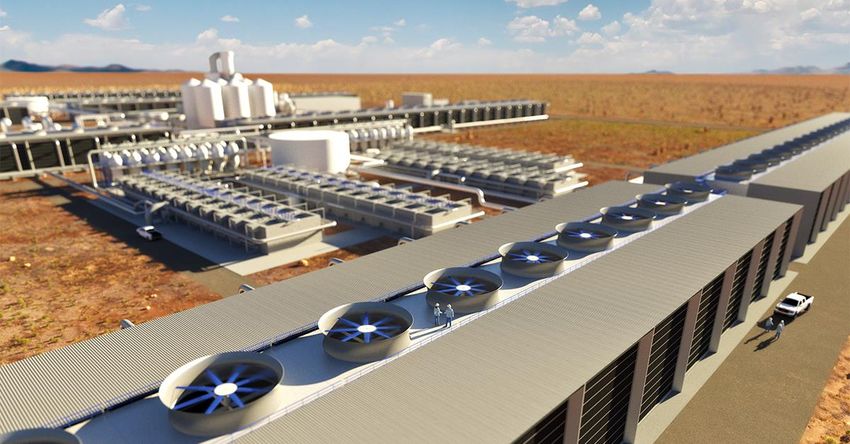
Best-in-Class Sustaining Capital

 $2.9 B of Capital Stabilizes Full Year Production at ~1,140 Mboed
                          Leading Capital Intensity: Capital intensity continues to improve
                          •    World-class assets with low breakevens and subsurface expertise to maximize value
                          •    Efficient execution accelerates time to market and lowers cost per well
                          •    Innovative design optimizations drive intensity lower
                               >     Permian Resources capital intensity improves to $15 MM / 1,000 boed in 2021
                          •    Re-use of existing facilities lowers development costs and improves returns

                      Shallower Base Decline: Operability improvements enhance base production
                      with lower operating costs
                      •       Mitigating base decline and maximizing existing production reduces wedge required to sustain production
                      •       2021 Corporate base decline improved from 25% to 22%
                              >     Onshore unconventional base decline improved from 37% to 33%
                      •       Relentless focus on operability to minimize downtime and maximize cash flow
                              >     Total opex reduction over $900 MM in 2020
                              >     DJ Basin average monthly downtime reduced from 41 Mboed in 2019 to 17 Mboed in 2020

   Note: Capital intensity defined as total net annual capex over total net annual average wedge ($ MM/Mboed).
                                                                                                                                        6
Fourth Quarter Earnings Conference Call - Occidental Petroleum Corporation February 23, 2021
Divestiture Progress Continues
                               12
                               11
                               10                      $8.2 B Divestitures
Cumulative Asset Sales ($ B)

                                9                                                                                                                                                                                    $2-3 B
                                                                                                                                                                                                $350 MM
                                                                                                                                                                                $700 MM
                                8
                                                                                                                                                                   $1.3 B
                                7
                                                                                                                                                                                                                     $2.4 B
                                6                                                                  $565 MM          $90 MM         $70 MM $260 MM

                                5                                  $750 MM $200 MM
                                                      $3.3 B
                                4
                                                                                                                                                                 Remaining Divestiture Target
                                3
                                                                                                                                                                                                                     $5.5 B
                                2                                                                                                                                2020 Divestitures
                                1    $650 MM                                                                                                                     2019 Divestitures
                                0
                                         Plains     Mozambique        Midland        Non-Core     Houston Real South Africa          Greater       WES Units      Land Grant      Colombia        Non-Core         Total
                                       Interests                      Basin JV        Asset          Estate                          Natural                                                      Acreage       Divestitures
                                                                                                                                     Buttes

                                Note: Net of taxes before economic adjustments due to timing and excludes $19 MM Greater Natural Buttes, $125 MM Colombia, and $45 MM Non-Core Acreage potential earn-out proceeds             7
Fourth Quarter Earnings Conference Call - Occidental Petroleum Corporation February 23, 2021
Fourth Quarter Oil & Gas Highlights

                         Record-Setting Efficiency: Continued to lower drilling and completion times
                         improving time to market
                         •    GoM – Record cycle time of 68 days from spud to first production on Lucius platform
                         •    Permian – Record 296 stages pumped in one month by one completion crew in New Mexico
                         •    Rockies – 4.3 days average drill duration during 4Q20, 23% below previous best quarter

                         Capital Synergies Achieved: Exceeded capital synergy target with over $900
                         MM of annual savings realized1
                         •    Permian – Exceeded 2021 capital synergy targets in Tx Delaware with ~$3.5 MM savings per well
                         •    Rockies – Exceeded 2021 capital synergy targets with ~$700 M savings per well

                         International Success: Strong exploration and operational achievements
                         •     U.A.E. – Multi-reservoir discovery in Onshore Block 3, new concession for Onshore Block 5 with ~1 MM gross
                               acres adjacent to prolific fields
                         •     Oman – Piloting extended reach dual laterals up to 20,000’, new completion methods increasing initial
                               production

   1.Based   on activity level associated with original synergy target announced prior to acquisition close                                 8
Fourth Quarter Earnings Conference Call - Occidental Petroleum Corporation February 23, 2021
Cash Flow                         Maintain Production Base

                        Current
                         Focus
Priorities
                                          Debt Reduction
Near-term, excess
cash flow and
divestiture proceeds
                                    Sustainable Dividend

                        Medium
to be allocated to

                         Term
debt reduction

Dividend increases                         Growth Capital
and growth capital to
follow substantial
reduction in debt                   Repurchase Shares
                        Longer
                         Term

                                       Retire Preferred Equity
                                                                 9
Fourth Quarter Earnings Conference Call - Occidental Petroleum Corporation February 23, 2021
Occidental
             •   Fourth Quarter Highlights
             •   Financial Results and Guidance

                                                  10
Fourth Quarter 2020 Results
                                                                                        Reported

Adjusted EPS                                                                            ($0.78)    4Q20 Reported versus Guidance Midpoint
                                                                                                                                                      Mboed
                                                                                                   Reconciliation

Reported diluted EPS                                                                    ($1.41)    Permian Resources: improved new well
                                                                                                   performance, better uptime and ethane recovery      +12
                                                                                                   rates, and high OBO volumes
4Q20 CFFO before working capital                                                         $1.4 B
                                                                                                   Rockies: improved ethane recovery rates and high
                                                                                                                                                       +6
                                                                                                   OBO and royalty volumes
4Q20 Capital expenditures1                                                               $0.6 B
                                                                                                   International: unplanned downtime and PSC
                                                                                                                                                       (5)
Unrestricted cash balance as of 12/31/2020                                               $2.0 B    impacts

Continuing operations production (Mboed)2                                                1,170     Colombia: not included in guidance due to sale      +27

Permian Resources production (Mboed)                                                      382                                                          +40

   1Excludes discontinued operations (Ghana)
   2IncludesColombia, excludes discontinued operations (Ghana)
   Note: See the reconciliations to comparable GAAP financial measures on our website                                                                         11
1Q and Full-Year 2021 Guidance Estimates

    Oil & Gas                                                            OxyChem                                                                Corporate
    1Q21 Production                                                      1Q21 Pre-tax income: ~$225 MM                                          FY 2021 Domestic tax rate: 22%
    •   Total Company: 1,085 – 1,115 Mboed                               FY 2021 pre-tax income: $775 - $825 MM                                 FY 2021 International tax rate: 45%
    •   Permian: 450 – 460 Mboed1                                        Midstream & Marketing2                                                 FY 2021 Overhead expense: ~$1.8 B3
    •   Rockies & Other: 285 - 291 Mboed                                                                                                        FY 2021 Interest expense: ~$1.6 B4
                                                                         1Q21
    •   GoM: 136 - 144 Mboed
                                                                         • Pre-tax income: $(135) – $(185) MM
    •   International: 214 - 220 Mboed
                                                                         • Midland - MEH spread of $0.45 - $0.55 / bbl                          Exploration Expense5
    FY 2021 Production                                                   FY 2021                                                                ~$35 MM in 1Q21
    • Total Company ~1,140 Mboed                                         • Pre-tax income: $(650) – $(750) MM                                   ~$210 MM in FY 2021
      > Oil / Gas %: ~53.4 / ~26.0                                       • Midland - MEH spread of $0.45 - $0.55 / bbl
    • Permian: ~485 Mboed
    • Rockies & Other: ~278 Mboed
                                                                                                                                                DD&A – FY 2021
    • GoM: ~141 Mboed                                                                                                                           Oil & Gas: ~$19.85 / boe
    • International: ~236 Mboed                                                                                                                 OxyChem and Midstream: ~$700 MM
    Domestic Operating Costs – FY 2021
    • Oil & Gas Production: ~$6.70 / boe
    • Transportation: ~$3.80 / boe

1Includes  ~25 Mboed of downtime related to Winter Storm Uri 2Midstream excludes WES results    3Overhead   is defined as SG&A and other operating and non-operating expenses
4Interest expense excludes interest income 5Exploration Expense includes exploration overhead                                                                                         12
                                                                                                                                                                                      12
Notes: All guidance excludes discontinued operations (Ghana)
2021 Capital Plan
   $2.9 B Capital Program by Asset                                                                                 Capital Program by Type
                                                                                                                                          Facilities 23%
  $0.1                                        Midstream & Marketing
  $0.2
                                              Exploration & Corporate                             D,C&E 56%
                   $0.3
                                                                                                                           Oil & Gas
                   $0.3                       OxyChem
                                                                                                                                             Base Maintenance 10%

                   $0.4                       GoM                                                                                          Exploration 6%
                                                                                                                                       OBO & Other 5%
                                              International
                   $0.4

                                              Rockies & Other                                 Capital Program Highlights
                                                                                              • 4Q20 production sustained with budget of $2.9 B
                                              Permian
                   $1.2                                                                       • Maintain capital allocation flexibility
                                                                                              • Value-based development
                                                                                              • Best-in-class capital intensity
                                                                                              • Includes $250 MM to support future year projects
           2021 Budget
                                                                                                 > Exploration, Al Hosn expansion, etc.
   Note: Capital program based on a $40 WTI price environment. Capital spending excludes discontinued operations (Ghana)                                            13
Appendix
•   2021 Activity
•   Financial Information
•   Oil and Gas Update
•   Asset Overview
•   Environmental, Social, and Governance
•   WES

                                            14
2021 Activity – Domestic Onshore Assets

                                             Permian                                                                                 Rockies
              $1.2 B                ~11 Gross                 ~5 Net                175 – 205                  $0.4 B         ~2 Gross         ~2 Net         145 – 175
              Capex                   Rigs                     Rigs                Wells Online
                                                                                  Appraisal
                                                                                                               Capex            Rigs            Rigs          Wells Online
100%                                                                                                   100%                                                       Powder
                                                                                                                                                  OBO
                                                                                                              Base Maint                                        River Basin
              Base Maint                                          OBO                                                           Powder
                                                                                                                 OBO                            Powder
                  Facilities                                                                                                     River
                 OBO                   Growth
                                       Midland                  Midland
                                                                TX                                                                               River
                                                                                        Midland                                  Basin
75%                                     Capex             Delaware                                     75%     Facilities                        Basin
                                      Growth                TX Mexico
               Facilities             Capex                 New
                                                         Delaware
                                     New Mexico
                                                   DJ Basin                          New Mexico
50%               Drilling                                                     Development             50%
                                     Sustaining
                 Drilland               Capex                New                                                  Drill
                Drilling                 TX                      TX         Development TX
              Complete
                Completion          Sustaining              Mexico                                             Complete        DJ Basin         DJ Basin         DJ Basin
                  and
               & Equip                Delaware               Delaware
                                                            New                     Delaware
                                      Capex                                                                     & Equip
              Completion                                   Mexico
25%                                                                                                    25%

 0%                                                                                                     0%
                                                                              1                    2
          Net Capex              Gross Operated           Total Net Rigs            Wells Online              Net Capex     Gross Operated   Total Net Rigs   Wells Online 2
           by Type                    Rigs                                                                     by Type           Rigs

       1Net   rigs shown by working interest (Midland Basin includes JV carry impact)
       2Gross    company operated wells online                                                                                                                                15
Int’l + GOM Milestones - 2021

                         2020                                2021                               2022                                  2023
                                              • Lucius, N Hadrian, Holstein
                                                                                   •   HMW (3 wells), Lucius             •   Caesar-Tonga (CTE), Lucius
            • Holstein, Blind Faith (OBO)     • Yellowfin, Fiesta, Cactus
                                                                                   •   Exploration wells                 •   SS pumping online
            • Lucius OBN                      • HMW umbilical, riser, platform
GOM         • Horn Mountain West (HMW)          mods
                                                                                   •   Sanction CTE, SS pumping          •   Exploration wells
                                                                                   •   Lucius expansion                  •   Lucius expansion
              flowlines installed             • Engineering for CTE, Subsea (SS)
                                                                                   •   Exploration development           •   Exploration development
                                                pumping, Lucius expansion
                                              •   Exploration wells
            • Exploration success             •   Block 30 exploration seismic
Oman        • Seismic processing completion   •   Block 62 FDP approval
                                                                                   • Development plan execution          • New blocks first production
                                              •   Block 53 optimization
                                                                                   • Seismic ON-5
                                              • Seismic ON-5
                                                                                   • ON-3 development                    • ON-3 development
            • Seismic ON-3                    • Exploration and appraisal wells
                                                                                   • Exploration and appraisal wells     • Exploration and appraisal wells
Abu Dhabi   • Exploration well                  ON-3
                                                                                     ON-3                                  ON-3 and ON-5
            • Al Hosn debottlenecking FEED    • Al Hosn debottlenecking final
                                                                                   • Al Hosn debottlenecking             • Al Hosn debottlenecking on-line
                                                investment decision
                                                                                     execution
                                                                                   • Seismic permitting
                                              • New contract                                                             • Seismic acquisition
            • Asset Integration                                                    • Additional facilities
Algeria     • New organization rollout
                                              • Resumption of development
                                                                                     FEED/concept
                                                                                                                         • Additional facilities EPC/award
                                                drilling and workover program                                            • Continued development drilling
                                                                                   • Continued development drilling

                                                                                                                  1st Production        Seismic
                                                                                                                  Exploration           Project Update
                                                                                                                                                             16
Appendix
•   2021 Activity
•   Financial Information
•   Oil and Gas Update
•   Asset Overview
•   Environmental, Social, and Governance
•   WES

                                            17
Midstream & Marketing Guidance Reconciliation
                                  $100                                                      4Q20 Guide               4Q20 Actual               1Q21 Guide                                                            Physical Midstream Business
                                                                                                                                                                                                                     • 4Q20 above guidance due to improved
                                                                                                                                                                                                                       commodity pricing and lower operating
                                   $50
                                                                                                                                                                                                                       costs. 1Q21 guidance reflects Dolphin
                                                                                                                                                                                                                       turn-around

                                                                                                                                                                                                                     Crude Exports from Gulf Coast
Quarterly Pre-Tax Income ($ MM)

                                     $0                                                                                                                                                                              • 4Q20 income higher than guidance due
                                                                                                                                                                                                                       to improvements in Asian refiner
                                                                                                                                                                                                                       demand. 1Q21 guidance includes
                                   ($50)                                                                                                                                                                               demand reduction from Covid impacts in
                                                                                                                                                                                                                       Europe and China

                                  ($100)                                                                                                                                                                             All Other Marketing
                                                                                                                                                                                                                     • 4Q20 income higher due to improved
                                                                                                                                                                                                                       Natural Gas spreads. 1Q21 guidance
                                  ($150)                                                                                                                                                                               reflects lower transportation spreads
                                                                                                                                                                                                                       related to Permian Highway Pipeline and
                                                                                                                                                                                                                       lower NGL transport volumes
                                  ($200)                                                                                                                                                                             Mark to Market
                                                                                                                                                                                                                     • MTM loss relates to price hedging on
                                                                                                                                                                                                                       crude cargoes. At 12/31/20 Oxy had
                                  ($250)                                                                                                                                                                               ~16MM bbls on the water with price delta
                                                 Physical             Permian to Gulf            Crude Exports           Gas & NGL               All Other          Mark to Market6       Total Midstream &
                                                Midstream             Coast Shipping           from Gulf Coast3          Deficiency             Marketing5                                 Marketing EBIT7
                                                                                                                                                                                                                       of ~$10/bbl from when cargoes were
                                                Business1           (MID–MEH Spread)2                                    Payments4                                                                                     hedged in October/November

                                           Note: All guidance shown represents midpoint 1Physical Midstream business is primarily comprised of the Dolphin Pipeline, Al Hosn, and Permian EOR gas processing plants 2Permian to Gulf Coast Shipping includes Oxy’s
                                           contracted capacity on several 3rd party pipelines. Current capacity is ~800 Mbod with primary destinations of Corpus Christi and Houston 3Crude Exports from the Gulf Coast include terminal fees of ~$50 MM per quarter.
                                           Other earnings drivers include the delta between our realized price of exported crude compared to MEH pricing less the cost of shipping, as well as crude price volatility and timing impacts 4Gas & NGL deficiency payments
                                           are with 3rd parties (excluding WES) in the Rockies 5All Other Marketing includes Gas and NGL marketing as well as the timing impacts of international crude 6Mark to market is not included in guidance 7Excludes WES         18
Cash Flow Sensitivities

 Oil & Gas                                                                 Midstream & Marketing                   OxyChem
•   Annualized cash flow changes                                       •    Annualized cash flow changes       •   Annualized cash flow changes
    ~$215 MM per $1.00 / bbl                                                ~$65 MM per $0.25 / bbl                ~$30 MM per $10 / ton change
    change in oil prices                                                    change in Midland to MEH               in realized caustic soda prices
    – ~$185 MM per $1.00 / bbl
                                                                            spread
      change in WTI prices                                                  – ~35 day lag due to trade month
    – ~$30 MM per $1.00 / bbl
      change in Brent prices

•   Annualized cash flow changes
    ~$175 MM per $0.50 / MMBtu
    change in natural gas prices
•   Production changes ~550 boed
    per $1.00 / bbl change in Brent
    prices1

     Note: All cash flow sensitivities relate expected 2021 production and operating levels
     1Based on $43 Brent                                                                                                                             19
2021 Natural Gas Hedges

                                          Two-Way Costless Collar                                                                   Secures Natural Gas Price Floor of
                                                                       Short Call
                                                                                                                                         $2.50 For 530 MMcfd
                         $4.00                                          $3.64
                                                                                                                                                  530 MMcfd Hedge Details
                         $3.50
                                               Long Put
                                                                                                                           Summary 2021
                                                $2.50                                                                      2021 Settlement
Realized Price ($/Mcf)

                         $3.00                                                                                             Natural Gas collar (millions of MMBtu)           177.0
                                                                                                                                 Average price per MMBtu (NYMEX)
                         $2.50                                                                                                                 Ceiling sold price (call)    $3.64
                                                                                                                                               Floor purchase price (put)   $2.50

                         $2.00

                         $1.50
                                          Realized                  Realized                  Realized
                                           $2.50                   NYMEX HH                    $3.64
                         $1.00
                             $1.00    $1.50     $2.00     $2.50      $3.00     $3.50     $4.00     $4.50     $5.00
                                                      NYMEX HH Natural Gas ($/Mcf)

                            Note: As of 12/31/2020; contracts written in MMBtu and assumes a 1 MMBtu = 1 Mcf conversion; settlement price based on VWAP of contracts
                                                                                                                                                                                    20
Appendix
•   2021 Activity
•   Financial Information
•   Oil and Gas Update
•   Asset Overview
•   Environmental, Social, and Governance
•   WES

                                            21
Leading Delaware Basin Well Performance
                                                 6 Month Cumulative Oil Top 100 Wells1                                                                                                                  12 Month Cumulative Oil Top 100 Wells2
                      Oxy’s subsurface expertise delivers Basin leading wells for less cost:                                                                                                      Oxy has 39% of the best wells, while completing less than 9% of
                                Competitors use 18% more proppant: ~$500 M                                                                                                                                          total Delaware Basin wells
                                           45                                                                                                                                                      45

                                           40                                                                                                                                                      40

                                                                                                                                                       # of Top 100 Wells in the Delaware Basin
# of Top 100 Wells in the Delaware Basin

                                           35                                                                                                                                                      35

                                           30                                                                                                                                                      30

                                           25                                                                                                                                                      25

                                           20                                                                                                                                                      20

                                           15                                                                                                                                                      15

                                           10                                                                                                                                                      10

                                           5                                                                                                                                                        5

                                           0                                                                                                                                                        0

                                                                                                                                                                                                         OXY

                                                                                                                                                                                                               Peer 1

                                                                                                                                                                                                                        Peer 2

                                                                                                                                                                                                                                 Peer 3

                                                                                                                                                                                                                                          Peer 4

                                                                                                                                                                                                                                                   Peer 5

                                                                                                                                                                                                                                                            Peer 6

                                                                                                                                                                                                                                                                     Peer 7

                                                                                                                                                                                                                                                                              Peer 8

                                                                                                                                                                                                                                                                                       Peer 9

                                                                                                                                                                                                                                                                                                Peer 10

                                                                                                                                                                                                                                                                                                          Peer 11

                                                                                                                                                                                                                                                                                                                    Peer 12
                                                                                                                                             Peer 10
                                                                                       Peer 4

                                                                                                                  Peer 7
                                                 OXY

                                                            Peer 1

                                                                     Peer 2

                                                                              Peer 3

                                                                                                Peer 5

                                                                                                         Peer 6

                                                                                                                           Peer 8

                                                                                                                                    Peer 9

                                                1 Source: IHS Enerdeq as of 02/02/2021, horizontals >500ft online since January 2019 with 6 month oil production available. Peers in Top 100 include: Ameredev, COP, CVX, DVN,
                                                EOG, FANG, MRO, RDS, XEC, XOM
                                                2 Source: IHS Enerdeq as of 02/02/2021, horizontals >500ft online since January 2019 with 12 month oil production available. Peers in Top 100 include: Ameredev, APA, BP, CVX,

                                                DVN, EOG, FANG, Mewbourne, MTDR, PXD, XEC, XOM
                                                                                                                                                                                                                                                                                                                              22
Appendix
•   2021 Activity
•   Financial Information
•   Oil and Gas Update
•   Asset Overview
•   Environmental, Social, and Governance
•   WES

                                            23
Oxy’s Combined Integrated Portfolio
                            Oil & Gas                                                     OxyChem                                               Oxy Midstream and WES
                              Focused in world class                                       Leading manufacturer of                              Integrated infrastructure and
                              basins with a history of                                     basic chemicals and                                  marketing provides access to
                              maximizing recovery                                          significant cash generator                           global markets
                                                                                                                                                 28                       1.2 MMboed
                                                                                                          Rockies
                                                                                              • Leading position in the DJ Basin
                                                                                                                                                                          Production1
 Permian Unconventional                                                                                                                23%
                                                                                                > 0.7 MM net acres including                                                Permian
• 1.6 MM net acres including
  premier Delaware Basin position                               Gulf of Mexico                    vast minerals position                  242                               Rockies & Other
                                                        • 10 Active operated platforms          > Largest producer in Colorado                               517
• Strategic infrastructure and                                                                                                                                              Gulf of Mexico
                                                                                                  with significant free cash flow
  logistics hub in place                                • Significant free cash flow                                                   105                                  MENA
                                                          generation                          • Emerging Powder River Basin
• EOR advancements                                                                                                                                                          Latin America
                                                        • Sizeable inventory of remaining       > 0.4 MM net acres
                                                                                                                                              278                           Domestic
                                                          tie-back opportunities                                                                             77%
                                                                                                                                                                            International

                                                                                                                                                          MENA
            Permian Conventional
                                                                         Latin America                                              • High return opportunities in Oman
       • 1.4 MM net acres
                                                                 • Deepwater exploration                                              > 6 MM gross acres, 17 identified horizons
       • Significant scale, technical capability,                  opportunities                                                    • Developing Blocks ON-3 and ON-5 in U.A.E
         and low-decline production
                                                                                                                                      > 2.5 MM gross acres
       • CCUS potential for economic growth
         and carbon reduction strategy                                                                                              • World class reservoirs in Algeria
                                                                                                                                      > 0.5 MM gross acres in the Berkine Basin
          14Q20  Production excludes discontinued operations (Ghana), includes Colombia                                             • Al Hosn and Dolphin provide steady cash flow with
          Note: Map information as of 12/31/2020
                                                                                                                                                                                            24
                                                                                                                                      low sustaining capex
One of the Largest U.S. Acreage Holders

                                                                   9.5 MM Net Total U.S. Acres
           Rockies                                                                                                                                                     Permian
        1.1 MM Acres                                                                                                                                                3.0 MM Acres
   Powder River Basin – 0.4 MM                                                                                                                            Permian Unconventional – 1.6 MM

         DJ Basin – 0.7 MM
Excludes acreage outside of active operating                                                                                                              Permian Conventional – 1.4 MM
                  areas

       Other Onshore                                                                                                                                                Gulf of Mexico
       4.6 MM Acres                                                                                                                                                 0.8 MM Acres
Other Onshore US consists of acreage and
    fee minerals outside of Oxy's core
             operated areas

      Note: As 12/31/2020. Acreage totals only include oil and gas minerals. Oxy has 0.8 MM onshore and 0.8 MM offshore net acres on federal land. Onshore federal acreage comprised of 0.27 MM Permian
      Resources, 0.004 MM DJ Basin, and Powder River Basin, CO2 Source Fields, and Other of 0.49 MM.                                                                                                      25
U.S. Onshore Overview

                                                                              Rockies                     Permian
                                                                           1.1 MM Acres                3.0 MM Acres

                                                                                 4Q20 Net Production
                                                                                      Oil     NGLs         Gas       Total
                                                                                    (Mbod)   (Mbbld)     (MMcfd)   (Mboed)
                                                                Permian Resources    201       89         550       382
                                                                Permian EOR          102       28          29       135
                                                                DJ Basin             75        82         618       260
                                                                Other Domestic       10        2           38        18
                                                                Total                388      201         1,235     795

  Note: Acreage amounts presented on this slide are net acres
                                                                                                                             26
Gulf of Mexico Overview

                                                                                                  Gulf of Mexico
                                                                                                  0.8 MM Acres
                                                                           MARLIN

                                                                  HORN MOUNTAIN
                                                                                        4Q20 Net Production
           NANSEN                            HOLSTEIN
   BOOMVANG
                              CONSTITUTION                                                                         Total
                              CAESAR/TONGA        MARCO POLO
                       GUNNISON                                                     Oil (Mbod)                      89
                                        HEIDELBERG
                                        LUCIUS                                      NGLs (Mbbld)                    7
                                                                                    Gas (MMcfd)                     54
                                                                                    Total (Mboed)                  105

    Note: Acreage amounts presented on this slide are net acres
                                                                                                                           27
International Overview

                                                                                                            U.A.E.
                      4Q20 Net Production1
                                                                                                        2.5 MM Acres
                                     Oil            NGLs             Gas         Total
                                   (Mbod)          (Mbbld)         (MMcfd)     (Mboed)
 Latin America                        27                -                7       28
 Algeria                              37                1                 -      38
 Al Hosn                              14               25                240     79
 Dolphin                               7                8                167     43
 Oman                                 66                -                98      82
 Total                               151               34                512    270
                                                                                            Algeria         Oman
                                                                                         0.5 MM Acres   6.0 MM Acres

         1Excludes production from discontinued operations (Ghana)
         Note: Acreage amounts presented on this slide are gross acres
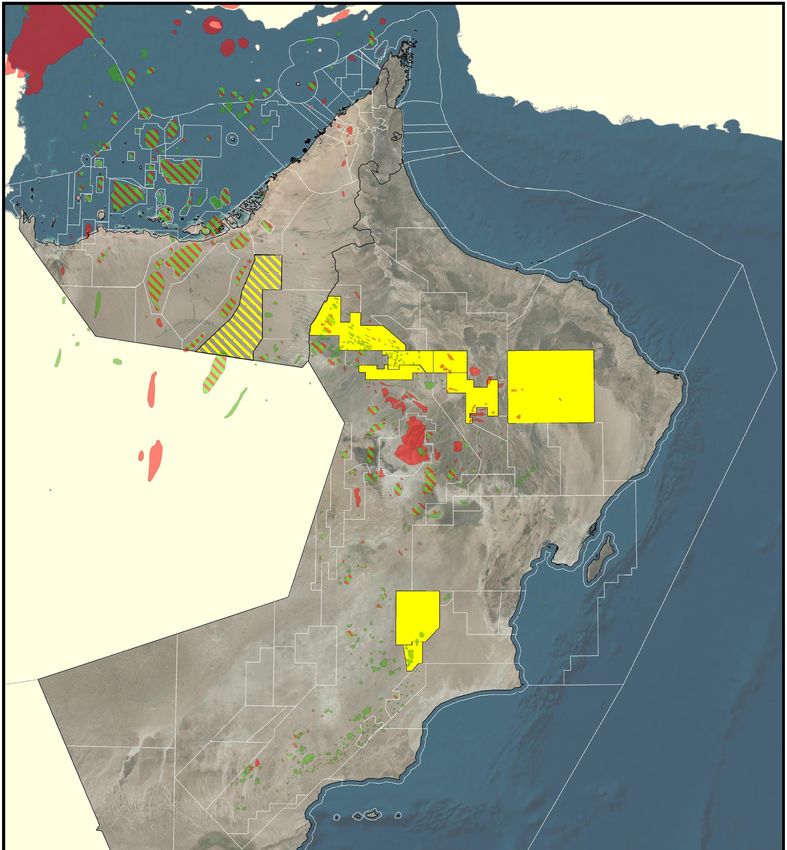
                                                                                                                       28
Abu Dhabi                               United Arab
                                         Emirates
                                                                          BLOCK 9

Block ON-3
                                                        ON-5                         BLOCK 27
                              AL HOSN
                                                                                                 BLOCK 30

& ON-5
                                                       ON-3

• 2.5 million gross acres                                      BLOCK 65
                                                                                                                    BLOCK 51

                                                                                    BLOCK 62

• Multi-reservoir discovery in Block ON-3
• High potential location
   > Prolific fields nearby
   > ON-3 adjacent to Oxy’s Al Hosn Field
   > Leverage Oxy’s regional technical knowledge and
     operational excellence                                                         Sultanate
                                                                                        of
• Low initial exploration expenditures                                                Oman
   > Seismic acquisition and interpretation
   > Exploration work ongoing                                                                     BLOCK 72
                                                                                                             Duqm

                                                                                                BLOCK 53
                                                                                                                               29
OxyChem: Market Leading Position

                     OxyChem at a Glance                                                                                        Earnings Highlights
              •      Major global exporter of all core products                                                                 •    Positive cash flow generation
              •      Top tier global producer in every product produced                                                              throughout cycle
                     >    Largest merchant caustic soda seller in the world                                                     •    Integrated assets capture
                     >    Largest VCM exporter in the world                                                                          benefits of favorable market
                                                                                                                                     conditions
                     >    2nd largest chlor-alkali producer in the world
                     >    2nd largest caustic potash producer in the world                                                      •    Global export portfolio
              •      Recent growth projects delivered on time and on budget, increasing earnings base                                leverages low domestic
                                                                                                                                     natural gas prices
              •      Only 4-time winner of the American Chemistry Council (ACC) Sustained Excellence Award
              •      Winner of 2020 ACC Sustainability Leadership – External Collaboration Award
                     >    Recognized OxyChem’s innovative partnership with Water Mission to address global water crisis             Market Overview
                                                                                                                                •    Strong PVC demand as global
                                                                                                                                     population expands and
                                                        OxyChem Pre-Tax Earnings (EBIT)1                                             standard of living improves
                     1,200

                      900                                                                                                       •    Caustic supply and demand
                                                                                                                                     balance is favorable long-term
              $ MM

                      600
                                                                                                                                •    No major global capacity
                      300                                                                                                            expansions
4CPe Plant

                          0                                                                                                     •    Core caustic demand driven
                                2010        2011       2012        2013        2014   2015   2016   2017   2018   2019   2020        by Aluminum and Pulp and
              1 OxyChem   pre-tax earnings excluding affecting comparability
                                                                                                                                     Paper                   30
Appendix
•   2021 Activity
•   Financial Information
•   Oil and Gas Update
•   Asset Overview
•   Environmental, Social, and Governance
•   WES

                                            31
Leader in Lower Permian Emissions Intensity

                                                                      Strategically Focused on Greenhouse Gas Emissions Reduction
                                                        Low Emission Intensity with Leading Basin Production                                                                                                                                  Low Emission Intensity with More Producing Wells
                                                       60                                                                             800                                                                                            60
                                                                                                                                                                                                                                                                     Size by Gross Permian Production (Mboed)

                                                                                                                                                                               Permian Greenhouse Gas Intensity (mt CO2e per MBOE)
 Permian Greenhouse Gas Intensity (mt CO2e per Mboe)

                                                                                                                                      700
                                                       50                                                                                                                                                                            50

                                                                                                                                            Gross Permian Production (Mboed)
                                                                                                                                      600

                                                       40                                                                                                                                                                            40
                                                                                                                                      500

                                                       30                                                                             400                                                                                            30

                                                                                                                                      300
                                                       20                                                                                                                                                                            20

                                                                                                                                      200

                                                       10                                                                                                                                                                            10
                                                                                                                                      100

                                                        0                                                                             0                                                                                              0
                                                                                                                                                                                                                                          0            4,000              8,000                12,000     16,000
                                                                                                                                                                                                                                                               Permian Producing Well Count1

                                                       Note: Includes emissions from Permian production and gathering & boosting, excludes plant emissions
                                                       1Producing wells reported to the EPA, excluding “Out of Production” or “Divested”

                                                       Source: Gross Production sourced from Enverus, accessed 02/02/2021, Well Counts and Emissions sourced from EPA Flight tool, last updated 09/26/2020
                                                       Operators include APA, COP, CVX, DVN, EOG, FANG, MRO, OXY, PXD, RDS, XOM
                                                                                                                                                                                                                                                                                                                   32
                                                       Emissions are combined for all M&A transactions announced and closed as of 02/02/2021
New Mexico Water Recycling Program

Water infrastructure drives value and                                                               New Mexico Recycled Water Usage1
environmental benefits                                                                       100%
• Continue to increase the percentage of                                                     90%
  recycled water used in operations                                                          80%

Demonstrating water environmental                                                            70%

stewardship                                                                                  60%

• Partnership support with New Mexico                                                        50%
  Produced Water Research Consortium                                                         40%
• Independently pursuing desalination                                                        30%
  technologies targeting socially beneficial                                                 20%
  applications                                                                               10%
Expanding water recycling technology to                                                       0%
                                                                                                2017         2018        2019          2020
Texas operations

    1Percentage   of total water used in Oxy New Mexico Drilling and Completion operations
                                                                                                                                         33
Continued Focus on Employee Safety

       Employee + Contractor IIR1
                                                                                                    ✓ Safety remains top priority during the
                                                                                                           pandemic
   2017                 2018                    2019                  20202
    .39                  .39                     .29                     .193                       ✓ Safety improved in 2020 despite historically
                                                                                                           active GoM storm season and the pandemic
Best safety performance ever in 20204✓ Expanding process safety/risk programs

                                                                                                    ✓ Enhancing systems and tools to identify and
                                                                                                           mitigate risks

    1 Recordable  Illnesses or Injuries (IIR) combines historical data for Oxy and Legacy Anadarko and is defined as the rate of IIR per 200,000 work hours
    2 Asof 12/31/2020
    3 Does not include COVID-19 cases
    4 Record low IIR for Oxy and Legacy Anadarko individually and combined                                                                                    34
TCFD-Aligned Climate Report Highlights

                                         35
Decarbonizing
Operations
and Reducing
GHG
Emissions

                36
Reducing Operational Emissions

                                 37
Pathway to Achieve Net-Zero

                              38
Oxy Low Carbon Ventures
                                                                         MAJOR INITATIVES

 Oxy is using our long-standing, industry-leading                        01
 expertise in carbon management to lower our own                         CCUS Project Development
 emissions and accelerate a global low-carbon economy                    Commercializing new capture and
                                                                         use technologies, providing CCUS
 through:                                                                advisory services, utilizing CO2 to
                                                                         create low-carbon products

 •   Commercializing carbon capture, utilization and storage
     technologies to accelerate our own organization                     02
     and others toward achieving net-zero emissions                      Reducing Direct Emissions
                                                                         Creating operational efficiencies,
                                                                         upgrading equipment
 •   Producing net-zero products, including net-zero oil and gas

 •   Partnering with other like-minded organizations to accelerate the   03
     reduction of global emissions and low-carbon product development    Energy Efficiency
                                                                         Apply technology to reduce energy
                                                                         consumption, investing and
                                                                         deploying renewable energy

                                                                                                               39
Occidental Carbon Management Timeline

  1972                        1983                        2000                       2008                         2010                       2015                        2017
  CO2-EOR initiated in        Denver Unit begins CO2-     Acquired Altura            Original 45Q tax credit      CO2 Century Plant came     Denver Unit CO2 field       Hobbs CO2 field
  Crane/Upton Counties,       EOR operations              Energy, a leading          for carbon storage and       online with the capacity   MRV approved, the first     MRV approved, the
  TX                                                      CO2-EOR operator           use established              to capture 8+ Mtpa         by the US EPA               second by US EPA
                                                          in the Permian

   2018
   •   Expanded 45Q (Future Act) changes
                                                  2019
                                                   •    Invested in Carbon Engineering
                                                                                                      2020
                                                                                                      •   Carbon Finance Labs formed
                                                                                                                                                           2021
                                                                                                                                                            •   Obtained third MRV with West
       approved by Congress, incentivizing         •    Invested in XCHG to create global             •   1PointFive development company created to             Seminole San Andres Unit
       carbon capture                                   marketplace for carbon credits                    deploy Carbon Engineering’s DAC technology        •   First ever Carbon-Neutral Oil
   •   Established Low Carbon Ventures             •    Board created Sustainability and              •   Sequestration business formed to finance,             shipment
       group                                            Shareholder Engagement Committee                  develop, operate, and maintain CO2
   •   Joined Oil and Gas Climate Initiative       •    Goldsmith Solar Facility successful startup       sequestration hubs in the US
   •   White Energy capture project                •    Invested in Cemvita, a biotech startup        •   45Q extended by 2-years to 2026; USE-IT act
       feasibility study announced                      focused on bioengineered pathways for CO2         approved
   •   Goldsmith Solar and Oman projects                utilization                                   •   Announced 2050 net-zero ambition and
       announced                                   •    Formed TerraLithium JV                            strategy for Scope 1, 2, 3 in climate report
   •   Invested in NET Power                       •    OLCV forms Technical Advisory Services to     •   OLCV awarded Project Tundra carbon storage
   •   Published first climate report                   support CCUS projects around the world            consulting services contract
                                                   •    CARB applications for fuel pathways and       •   First US Oil & Gas Company to endorse the
                                                        permanence submitted                              World Bank’s zero-flaring by 2030 initiative

                                                                                                                                                                                                40
Producing a Lower Carbon Barrel of Oil
First look at the world’s largest
Direct Air Capture plant
Oxy Low Carbon Ventures and the management team
from Rusheen Capital formed development company
1PointFive
1PointFive licensed technology from Carbon
Engineering to develop the DAC facilities
Announced first project to build the world’s largest
DAC facility
• Expects to capture up to 1,000,000 metric
   tons of atmospheric CO2 annually
•   Front-End Engineering Design to begin 1Q21
•   Construction expected to begin in 2022
•   Supply low-cost CO2 to Permian EOR and
    expand margins
•   Captured CO2 to be permanently, safely, and
    securely stored in Oxy’s geological formations
    under CARB CCS Protocol and US EPA
    greenhouse gas reporting program subpart RR

                                                       *Rendering of DAC facility

                                                                                    41
Climate-Related Commitments and Targets

Net-zero for our operational and energy use
emissions (Scope 1 and 2) before 2040,
with ambition to achieve before 2035

Net-zero for our total emissions inventory
including product use (Scope 1, 2, and 3),
with ambition to achieve before 2050

Total carbon impact through carbon
removal and storage technology and
development past 2050

      *Total GHG (Scope 1 + Scope 2) and Methane Emission Intensity targets are aligned with Oil and Gas Climate Initiative (OGCI) targets.
         Net-zero for our operational and energy use emissions (Scope 1 and 2) before 2040, with ambition to achieve
      Methane
         before emissions
                 2035      intensity refers to the amount of methane emissions from Occidental's operated oil and gas assets as a percentage of
      the total gas produced and marketed.                                                                                                        42
Diversity, Inclusion, and Belonging

Occidental’s culture of Diversity, Inclusion, and
Belonging creates an environment where
differences are appreciated, all employees are
included and everyone feels that they belong. As
part of our commitment to support this culture, we
conducted a robust survey across our
organization. The results were reviewed with our
Board of Directors and are a basis for our
company’s core values.

                                                     43
Appendix
•   2021 Activity
•   Financial Information
•   Oil and Gas Update
•   Asset Overview
•   Environmental, Social, and Governance
•   WES

                                            44
WES Operating as an Independent Company

 Relationship at a Glance
• Effective Dec. 2019, WES’s management team transferred from Oxy to WES; the remaining WES employees transferred in 2020
• Rights of WES unitholders to replace WES’s general partner were significantly expanded in 2020
• Oxy accounts for WES using the Equity Method of Accounting, WES is not consolidated in Oxy’s financial statements
• Oxy intends to continue an operational relationship with WES and expects to maintain a significant economic interest in WES
• Ownership to be reduced below 50%

 Oxy Ownership Position at December 31, 2020
• 2% of WES Operating (non-voting)
• 51.5% of WES limited partner units
• 2% GP unit interest in WES (non-voting)

                                                                                                                                45
You can also read