Asymmetry and Leverage with News Impact Curve Perspective in Australian Stock Returns' Volatility during COVID-19

Page created by Janice Jackson
 
CONTINUE READING
Asymmetry and Leverage with News Impact Curve Perspective in Australian Stock Returns' Volatility during COVID-19
Journal of
               Risk and Financial
               Management

Article
Asymmetry and Leverage with News Impact Curve Perspective
in Australian Stock Returns’ Volatility during COVID-19
Najam Iqbal              , Muhammad Saqib Manzoor and Muhammad Ishaq Bhatti *

                                          La Trobe Business School, La Trobe University, Melbourne 3108, Australia; n.iqbal@latrobe.edu.au (N.I.);
                                          m.manzoor@latrobe.edu.au (M.S.M.)
                                          * Correspondence: i.bhatti@latrobe.edu.au; Tel.: +61-3-9479-2715

                                          Abstract: This paper studies the effect of COVID-19 on the volatility of Australian stock returns
                                          and the effect of negative and positive news (shocks) by investigating the asymmetric nature of the
                                          shocks and leverage impact on volatility. We employ a generalised autoregressive conditional het-
                                          eroskedasticity (GARCH) model and extend the analysis using the exponential GARCH (EGARCH)
                                          model to capture asymmetry and allegedly leverage. We proxy the news related to the negative
                                          effect of COVID-19 on the Australian health system and its economy as bad news, and on the other
                                          hand, measures taken by government economic stimulus packages through their monetary and fiscal
                                          policies as good news. The S&P ASX200 (ASX-200) index is used as a proxy to the Australian stock
                                          market, and we use value-weighted returns of the stocks listed on ASX-200 for the period 27 January
                                2020 to 29 December 2020. The empirical results suggest the EGARCH model fits better in capturing
         
                                          asymmetry and leverage than the GARCH model in estimating the volatility of the Australian stock
Citation: Iqbal, Najam, Muhammad          returns. However, another interesting finding is that the EGARCH model with volatility equation
Saqib Manzoor, and Muhammad               without news demonstrates a larger (smaller) leverage effect of the negative (positive) shocks on the
Ishaq Bhatti. 2021. Asymmetry and         conditional volatility compared to its variant with the news.
Leverage with News Impact Curve
Perspective in Australian Stock
                                          Keywords: Australian stock market; volatility; COVID-19; GARCH; EGARCH; news impact curve
Returns’ Volatility during COVID-19.
Journal of Risk and Financial
Management 14: 314. https://
doi.org/10.3390/jrfm14070314
                                          1. Introduction
Academic Editors: Robert Brooks and             The outbreak of COVID-19 in December 2019 and the consequent increase in uncer-
Thanasis Stengos                          tainty has had a massive financial effect on the real economy (Bakas and Triantafyllou 2020).
                                          The hike in uncertainty due to COVID-19 is typically associated with falling aggregate
Received: 28 May 2021                     demand and, as a result, disrupting economic activity. The World Industrial Production
Accepted: 6 July 2021                     Index fell by 4.5% in the first quarter of 2020 (Baumeister and Hamilton 2019). The IMF,
Published: 8 July 2021                    in its world economic outlook (Gopinath 2020), documented that it was expected that the
                                          world economy would experience the worst COVID-19-related recession since the 1930s
Publisher’s Note: MDPI stays neutral      Great Depression1 . This unprecedented outcome not only upon human lives but also on
with regard to jurisdictional claims in   the global economy was due to many governments implementing drastic measures to
published maps and institutional affil-
                                          prevent the spread of COVID-19. They instituted lockdowns, strict quarantine policies,
iations.
                                          social distancing (Rahman et al. 2021) and travel bans both inward and outward.
                                                On the other hand, to combat the above adversaries, governments also put huge
                                          economic stimulus packages through their monetary and fiscal policies. Since this study
                                          relates to Australian stock returns and their volatility, it would be pertinent to briefly
Copyright: © 2021 by the authors.         describe how the monetary and fiscal tools used by the Australian federal government to
Licensee MDPI, Basel, Switzerland.        support the economy. On the fiscal side, some of the major actions2 taken by the Australian
This article is an open access article
                                          government which are listed below in Table 1.
distributed under the terms and
                                                On the other hand, Australia adopted an expansionary monetary policy by reduc-
conditions of the Creative Commons
                                          ing interest rates and simultaneously expansionary fiscal policy by increasing transfer
Attribution (CC BY) license (https://
                                          payments. The Reserve Bank of Australia’s (RBA) cash rate, which influences the market
creativecommons.org/licenses/by/
                                          interest rate, was 0.75% in January 2020. However, to save the COVID-19 smashed economy,
4.0/).

J. Risk Financial Manag. 2021, 14, 314. https://doi.org/10.3390/jrfm14070314                                      https://www.mdpi.com/journal/jrfm
Asymmetry and Leverage with News Impact Curve Perspective in Australian Stock Returns' Volatility during COVID-19
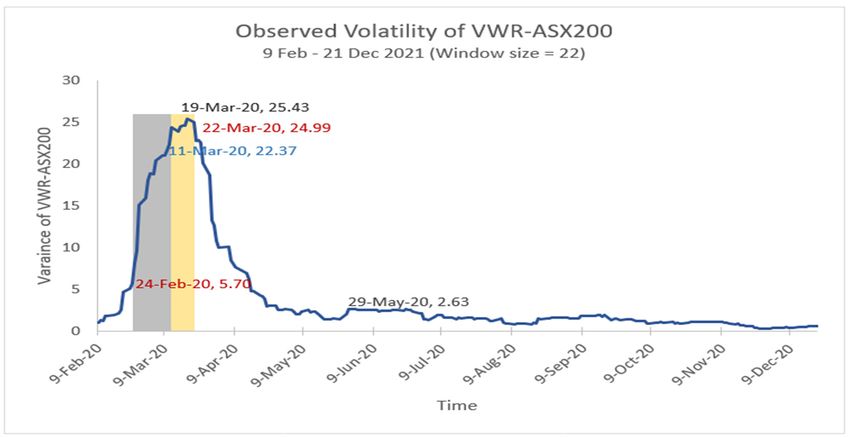
J. Risk Financial Manag. 2021, 14, 314                                                                                             2 of 15

                                         the RBA slashed its official cash rate three times in 2020 and, in February 2021, decided to
                                         let it stay at its current level of 0.10%3 .

                                         Table 1. Australian government’s economic stimulus in chronological order.

                                                  Date                         Australian Government’s Fiscal Response
                                                                  This date marks the day the Australian federal government announced
                                             12 March 2020
                                                                               its first economic package of $17.60 billion.
                                                                   This date features the Australian government’s announcement of its
                                              3 March 2020          second economic package of $130 billion, including Jobseeker and
                                                                                Jobkeeper payments to eligible applicants.
                                               4 June 2020        The Australian government announces its Home Builder Grant scheme.
                                              21 July 2020               This date marks the extension of the Jobkeeper payment.

                                               Our study relates to the strand of literature that examines the effect of COVID-19 on
                                         stock market performance in terms of returns and returns’ volatility. Given the time frame
                                         of our study, limited studies have examined the effect of the COVID-19 pandemic on stock
                                         market performance. Zhang et al. (2020), using a minimum spanning tree analysis, on top
                                         ten countries provide general patterns of risks associated with specific countries having
                                         the highest number of COVID-19 cases as of 27 March 2020. Their results suggest that
                                         stock market risks significantly rose in the sample countries. Also, the rise in the uncer-
                                         tainty of COVID-19 and its negative effect on the real economy has increased financial
                                         markets’ volatility. Al-Awadhi et al. (2020) implement panel data analysis to examine the
                                         effect of COVID-19 on Chinese stock markets for the period 10 January 2020 to 16 March
                                         2020. Their results suggest that COVID-19 has a significant negative effect on Chinese
                                         stock returns. Mazur et al. (2021) examine the performance of the US stock market (evi-
                                         dence from S&P 500) and provide evidence that the stocks of natural gas, food, healthcare
                                         and software stocks earn higher positive returns, while on the other hand, stock prices of
                                         petroleum, real estate, entertainment and hospitality sectors fall dramatically because of
                                         COVID-19. This paper investigates the effect of COVID-19 on the volatility of Australian
                                         stock returns and further analyses the effect of both negative and positive news (shocks)
                                         on the volatility of Australian stock returns by investigating the presence of asymmetry
                                         and purportedly leverage.
                                               In addition to the above, choosing the Australian stock market is motivated by several
                                         factors. Firstly, although Australia was not among the most affected nations in terms of
                                         human cost (death, physical effect of COVID-19 infection and mental trauma)4 , its stock
                                         market was one of the most affected in the world, making it an interesting candidate for
                                         analysis. The benchmark Australian stock price index-S&P/ASX 2005 -declined more than
                                         27%, which was the most compared to top world stock price indices (see Table 2). Although
                                         the stock market seemed to be decoupled from the GFC, which originated in the USA in
                                         2008, the reaction of the Australian stock market to the COVID-19 pandemic again makes
                                         it a strong point for our study. Our study aims to fill this gap by examining the effect
                                         of COVID-19 on the volatility of Australian stock returns using the top 200 Australian
                                         stocks by market capitalisation listed on S&P/ASX200. We also analyse the impact of both
                                         negative and positive news (shocks) on the stock returns’ volatility and investigate the
                                         asymmetric nature of the shocks’ impact and the possible presence of leverage as a special
                                         case of asymmetry.
Asymmetry and Leverage with News Impact Curve Perspective in Australian Stock Returns' Volatility during COVID-19
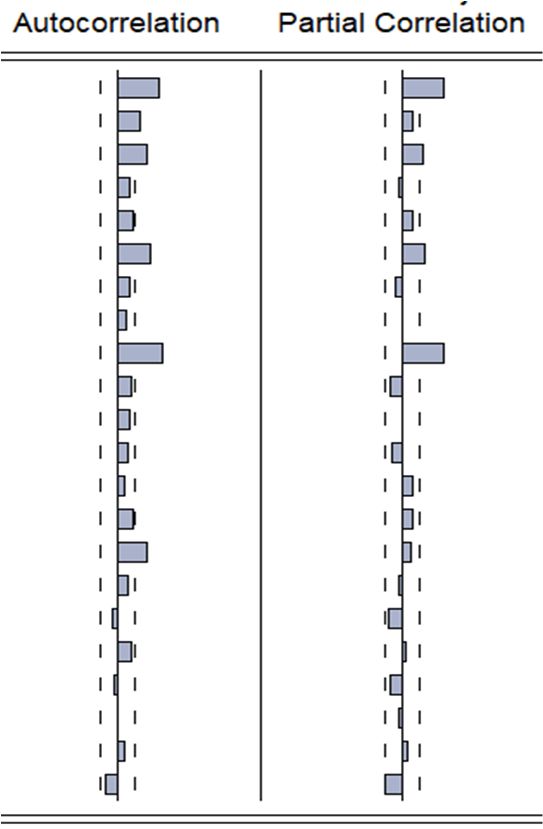
J. Risk Financial Manag. 2021, 14, 314                                                                                             3 of 15

                                         Table 2. This table compares the percentage change in index values of top world indices over the
                                         period 31 January 2020 to 31 March 2020. The S&P/ASX200 Index, shaded in grey, declines the most
                                         in comparison to top world indices.

                                                                                    Index Value
                                                  Index                                                               % Age Change
                                                                     31 January 2020          31 March 2020
                                            EURO Stoxx 50                3639.00                   2747.00               −24.51%
                                              FTSE 100                   7286.01                   5671.96               −22.15%
                                          NASDAQ Composite               9150.94                   7700.10               −15.85%
                                              Nikkei 225                23,205.18                 18,917.01              −18.48%
                                               S&P 500                   3225.52                   2584.59               −19.87%
                                             S&P ASX200                  7017.20                   5076.80               −27.65%

                                              We employ the GARCHX model, which makes it possible to include variables of
                                         interest in both the mean and conditional variance specification. We use three proxies for
                                         COVID-19, namely: total number of confirmed cases due to COVID-19; the total number of
                                         deaths due to COVID-19; and a dummy variable indicating negative news for the period
                                         between 24 February 2020 to 22 March 2020. To capture the asymmetric effects of the
                                         random shocks, we utilise exponential GARCH (EGARCH), which capture asymmetry
                                         and leverage as a special case of asymmetry with appropriate restrictions imposed on the
                                         model’s parameters. Asymmetry arises when the positive and negative shocks of the same
                                         magnitude have an unequal impact on returns volatility. On the other hand, according to
                                         McAleer and Hafner (2014), leverage as a special case of asymmetry is related to increased
                                         volatility. This is due to negative shocks to returns and a decline in volatility due to positive
                                         shocks to returns, so what it means that leverage captures the negative correlation between
                                         returns shocks and subsequent shocks to volatility.
                                              The findings provide evidence that infectious diseases like COVID-19 can seriously
                                         impact stock market returns and their volatility. The findings could be of substantial
                                         interest to specific stakeholders, such as market participants, portfolio and hedge man-
                                         agers, regulators, and policymakers. The rest of the paper is organised as follows. In the
                                         subsequent sections, data and descriptive statistics are presented. In Section 3, we briefly
                                         elaborated on the choice of our model, while Section 4 presents an empirical study related
                                         to asymmetry, leverage and NIC for four models and monitor the impact of shocks on the
                                         conditional volatility of returns and forecasts evaluation in Section 5. Section 6 contains
                                         some concluding remarks.

                                         2. Data & Descriptive Statistics
                                               We examine the effect of COVID-19 on the value-weighted returns (VWR) of Aus-
                                         tralian stock prices and their volatility. As our sample, we consider daily Australian stocks
                                         (close) prices data of 200 stocks listed on S&P/ASX200 (ASX-200) taken from Yahoo Finance
                                         and covers the period 27 January 2020 to 29 December 20206 . We choose 27 January 2020
                                         as the start of our period because the very first case of COVID-19 infection was reported
                                         on 26 January 2020 for Australia. Due to the non-availability of stocks data for Caltex
                                         Australia and TPG Telecom Ltd for the period of our interest and missing values of United
                                         Malt Group from 27 January 2020 to 22 March 2020, we use stock prices of 197 stocks of
                                         ASX-200 in our study. Following Apergis and Apergis (2020), we employ the total number
                                         of confirmed cases of COVID-19 (COVID-19A) and the number of deaths due to COVID-19
                                         (COVID-19B) as proxies for COVID-19’s effect on the VWR of the stocks of ASX-200 and
                                         their volatility7 . The data for COVID-19A and COVID-19B are obtained from Our World in
                                         Data.
Asymmetry and Leverage with News Impact Curve Perspective in Australian Stock Returns' Volatility during COVID-19
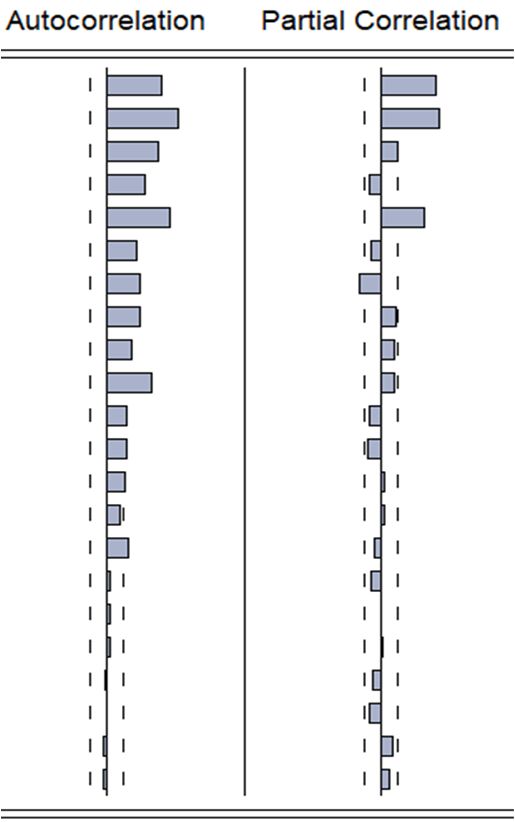
J. Risk Financial Manag. 2021, 14, 314                                                                                         4 of 15

                                               Additionally, to capture the effect of negative news, following Rahman et al. (2021),
                                         we also introduce a dummy variable in our model representing negative news (COVID-
                                         19C) as a proxy for the COVID-19 effect on the VWR of the stocks of ASX-200 and their
                                         volatility. However, the use of the dummy variable differs from Rahman et al. (2021) in
                                         that instead of being only a specific date, we use this dummy variable for 24 February
                                         2020 to 22 March 2020. The date 24 February 2020 is the day on which the Australian
                                         Health Protection Principal Committee (AHPPC) issued a statement on COVID-198 , stating
                                         that if COVID-19 develops as a pandemic, then its widespread community transmission
                                         would almost be impossible to prevent. Hence a significant local outbreak would place
                                         enormous pressure on the healthcare system. Then on 11 March 2020, WHO did declare
                                         that COVID-19 a pandemic by saying that “we are deeply concerned both by the alarming
                                         levels of spread and severity and by the alarming levels of inaction. We have therefore
                                         made the assessment that COVID-19 can be characterised as a pandemic”9 . Such a situation
                                         could be a blow to the economy without adequate financial support from the government.
                                         Thus, the impact of the negative news was likely to persist until the Government intervenes
                                         to save the economy substantially. We consider 22nd March 2020 as the date that features
                                         the Australian federal government’s economic response to COVID-19 by announcing its
                                         second economic stimulus package of $130 billion.
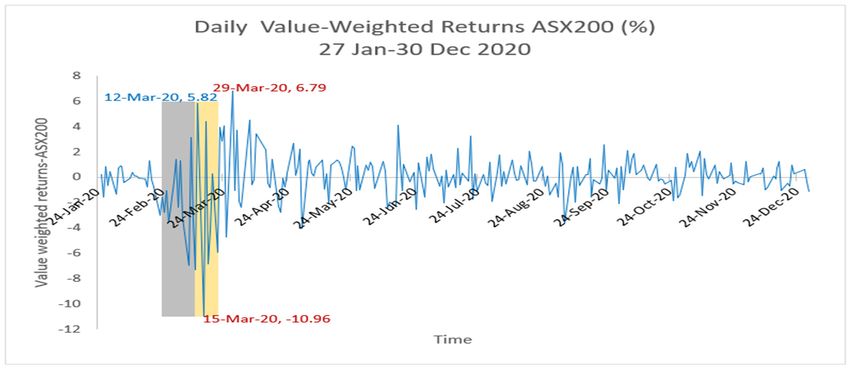
                                               Thus, our selected period from 24 February 2020 to 22 March 2020 signifies the time
                                         of negative news due to COVID-19’s effect on the VWR of ASX-200 stocks and their
                                         volatility (see panel A of Figure 1). To better visualise the returns volatility, we compute
                                         the variance of returns using a rolling window having a length of 22 days and present the
                                         information in Panel B of Figure 1. We find there is a significant rise in the variance from
                                         5.7 to 22.37 on the dates when the first news (AHPPC’s statement) and the first economic
                                         package of AUD 17.6 billion was announced. However, we observe the volatility continues
                                         to rise and reaches the maximum of 25.43 on 19 March 2020 and only drops to 24.99,
                                         indicating the first economic response was not very effective in terms of reducing stock
                                         market volatility. However, what is notable is a significant and rapid decline in volatility
                                         after the second economic package of AUD 130 billion was announced, incorporating the
                                         Jobseeker and Jobkeeper payments to eligible individuals and businesses. We observe that
                                         from the beginning of May 2020, the volatility has been consistently below 2.63. Thus,
                                         the visualisation provides insights that both positive and negative news affect volatility;
                                         a negative news increases volatility and vice-versa, albeit with asymmetric effects.
                                               For this reason, we intend to explore the impact of news together with the effects
                                         caused by changes in both interest rate and the relative oil price on the VWR-ASX200
                                         volatility. Hence, following Apergis and Apergis (2020), this paper employs daily data
                                         of a 1-month interbank interest rateto proxy for short-term interest rates and crude oil
                                         prices. The data on interest rates and crude oil prices are obtained from the Reserve Bank
                                         of Australia and Yahoo Finance, respectively. We do not have missing values in our final
                                         dataset. Summary statistics and correlation matrix on these variables are presented in
                                         Table 3.
J. Risk Financial Manag. 2021, 14, x FOR PEER REVIEW                                                                                                       5 of 14

J. Risk Financial Manag. 2021, 14, 314                                                                                                                     5 of 15
                                                  Note that * represents significance at the 10% level.

        Panel A

        Panel B

       Figure1.1.Panel
      Figure      PanelAAshows
                             showsthe thedaily
                                          dailyrealised
                                                  realisedVWRVWRofofS&P/ASX200
                                                                        S&P/ASX200 from from 27 27January
                                                                                                   January2020
                                                                                                             2020to  to30
                                                                                                                        30December
                                                                                                                           December2020.2020.ItItillustrates
                                                                                                                                                  illustrates
       specifically the   rise in the  volatility   of daily  realised   VWR    between    12  March    2020 and    29 March   2020.
      specifically the rise in the volatility of daily realised VWR between 12 March 2020 and 29 March 2020. Panel B depicts the      Panel   B  depicts  the
       observed   volatility   of VWR    of S&P/ASX200        from   27 January    2020 to 31  December     2020   with  a
      observed volatility of VWR of S&P/ASX200 from 27 January 2020 to 31 December 2020 with a specific spike from 12 Marchspecific spike   from   12 March
       2020 to 29 March 2020. VWR-ASX200 is the value-weighted return of 197 stocks listed in S&P/ASX200 at levels. In panels
      2020 to 29 March 2020. VWR-ASX200 is the value-weighted return of 197 stocks listed in S&P/ASX200 at levels. In panels A
       A and B, we use data of 197 stocks listed on S&P/ASX200 from 27 January 2020 to 30 December 2020 to examine the effect
      and B, we use data of 197 stocks listed on S&P/ASX200 from 27 January 2020 to 30 December 2020 to examine the effect of
       of COVID-19 on Australian stock returns and their volatility. VWR-ASX200 is the value-weighted return of 197 stocks
      COVID-19     on Australian
       listed in S&P/ASX200       at stock
                                     level,returns
                                            Oil Price  and  theirinternational
                                                         is the    volatility. VWR-ASX200
                                                                                 crude oil priceis the  value-weighted
                                                                                                    to the                 returnrate
                                                                                                           order I(1), Interest    of 197  stocks listed
                                                                                                                                        is Australian      in
                                                                                                                                                        one-
      S&P/ASX200       at  level, Oil  Price is the   international    crude   oil price to  the  order  I(1), Interest  rate
       month interbank interest rate to the order I(1), COVID-19A represents the total number of confirmed cases in Australia is Australian    one-month
      interbank   interest rate
       due to COVID-19       to thetoorder
                                      the order    I(1), COVID-19A
                                            I(1), COVID-19B              represents
                                                                   represents          thenumber
                                                                                the total   total number     of confirmed
                                                                                                      of deaths   in Australiacases
                                                                                                                                 dueintoAustralia
                                                                                                                                         COVID-19due       to
                                                                                                                                                       to the
      COVID-19     to the
       order I(1) and       order I(1), COVID-19B
                        COVID-19C       is a dummy represents          the totalthe
                                                          variable depicting      number     of deaths
                                                                                      negative   news,in    Australia
                                                                                                          and  it takes due  to COVID-19
                                                                                                                         a value  of 1 from to 24the  order
                                                                                                                                                   February
       2020
      I(1)   to 22
           and     March 2020
                COVID-19C       is otherwise    0.
                                   a dummy variable         depicting the negative news, and it takes a value of 1 from 24 February 2020 to
      22 March 2020 otherwise 0.
                                         3. Methodology and Empirical Design
                                              To model volatility and its forecasting in time series, the GARCH (generalised auto-
                                         regressive conditional heteroskedasticity) model proposed by Bollerslev (1986) is very
J. Risk Financial Manag. 2021, 14, 314                                                                                                  6 of 15

      Table 3. Panel A shows the summary statistics for the variables used in the specifications. We use data of 197 stocks listed
      on S&P/ASX200 from 27 January 2020 to 30 December 2020 to examine the effect of COVID-19 on Australian stock returns
      and their volatility. VWR-ASX200 is the value-weighted return of 197 stocks listed in S&P/ASX200 at level, Oil Price is the
      international crude oil price to the order I(1), Interest rate is Australian one-month interbank interest rate to the order I(1),
      COVID-19A represents the total number of confirmed COVID-19 cases in Australia to the order I(1), COVID-19B represents
      the total number of deaths in Australia due to COVID-19 to the order I(1). Meanwhile, COVID-19C is a dummy variable
      depicting the negative news, and it takes a value of 1 from 24 February 2020 to 22 March 2020, otherwise 0.

        Panel A
                              Order of                                  Std.
       Variables                                 N       Mean                       Median           Min       Max       Kurtosis   Skewness
                             Integration                                Dev.
    VWR-ASX200                    I(0)          238     −0.029         1.959          0.107        −10.956      6.791      8.905    −1.056
      Oil Price                   I(1)          238     −0.030         1.696          0.000        −13.400      5.010     20.372    −2.342
    Interest Rate                 I(1)          238     −0.004         0.018          0.000        −0.142       0.073     18.367    −1.964
     COVID-19A                    I(1)          238     119.332       224.916        23.500         0.000     1450.000    14.964    3.209
     COVID-19B                    I(1)          238      3.819         8.972          0.000         0.000      59.000     23.178    4.175
      Panel B
                                                                                                   Interest   COVID-
       Variables                                           VWR-ASX200               Oil Price                               COVID-19B
                                                                                                     Rate      19A
    VWR-ASX200                           1                     1.0000
      Oil Price                          2                    0.2448 *              1.0000
    Interest Rate                        3                    −0.3001 *             −0.1599        1.0000
     COVID-19A                           4                     0.0807               −0.0338        −0.0926     1.0000
     COVID-19B                           5                     0.0546               0.0166         0.0244     0.5016 *         1.0000
                                                  Note that * represents significance at the 10% level.

                                         3. Methodology and Empirical Design
                                               To model volatility and its forecasting in time series, the GARCH (generalised au-
                                         toregressive conditional heteroskedasticity) model proposed by Bollerslev (1986) is very
                                         popular in the scientific community. Since Bollerslev (1986), several variants of GARCH
                                         models have been presented, which include integrated GARCH-IGARCH (Engle and
                                         Bollerslev 1986), exponential GARCH–EGARCH (Nelson 1991) and GARCHX that was
                                         promoted by Engle et al. (1990), Apergis (1998) and Connor et al. (2006).
                                               This paper considers GARCHX and EGARCH models to examine the effect of COVID-
                                         19 on value-weighted returns of Australian stock prices. The motivation to select these
                                         models comes from prior studies discussing the correlation between stock returns and their
                                         volatility (Al-Awadhi et al. 2020; Zhang et al. 2020; Mazur et al. 2021). The EGARCH model
                                         is particularly useful for measuring the asymmetric effects of news and the consequent
                                         leverage if it exists. Both these volatility models are introduced with additional covariates
                                         that can affect the mean of stock returns in the GARCH equation. Since we are specifically
                                         interested in examining the impact of the COVID-19 shock on the average and conditional
                                         volatility of stock returns, we include this factor in both the conditional mean and variance
                                         equations. GARCH models are preferable over the ARCH models because (1) we do not
                                         require non-negativity constraint in parameters (2) GARCH (1,1) and EGARCH(1,1) models
                                         are capable of capturing higher order ARCH (p,q) models.
                                               Moreover, it is well established in the literature that oil prices (Cologni and Manera
                                         2008; Kilian 2009; Nguyen and Bhatti 2012; Reboredo and Rivera-Castro 2014) and interest
                                         rates (Laopodis 2013; Huang et al. 2016; Assefa et al. 2017) are useful in determining the
                                         stock prices and stock returns. For this reason, we also include both percentage changes in
                                         oil prices and the changes in the short-term interest rates as covariates in the mean equation
                                         of both the volatility models. The mean equation of our volatility models takes a common
                                         form as shown below in Equation (1); nonetheless, the conditional variances of the two
                                         models are presented in Equations (2) and (3) below.
J. Risk Financial Manag. 2021, 14, 314                                                                                              7 of 15

                                              Mean Equation:
                                                       p              q
                                          Rt = µ0 + ∑ φi Rt−i +      ∑ ψj ε t− j + ϕ1 COV ID19t + ϕ2 ∆ln(Oilt ) + ϕ3 ∆IntRatet + ε t ,   (1)
                                                      i =1           j =1

                                         where Rt represents the value-weighted return of 197 stocks listed on S&P ASX-200. The
                                         first sum is the autoregressive (AR) component, with µ0 and ε t− j being a constant and
                                         the error term, respectively. Since we are using the GARCHX variant of the GARCH
                                         family, so we have added COV ID19t which is composed of COVID19-A, COVID19-B and
                                         COVID19-C (see Section 2). Moreover, literature has established a role of oil prices (Cologni
                                         and Manera 2008; Kilian 2009; Nguyen and Bhatti 2012; Reboredo and Rivera-Castro 2014)
                                         and interests rates (Laopodis 2013; Huang et al. 2016, Assefa et al. 2017) in determining
                                         the stock prices and stock returns, so Equation (1) also includes both oil prices as Oilt and
                                         short-term interest as IntRatet .
                                               Conditional Volatility or Variance Equation:

                                                           GARCHX (1, 1) : ht = ω1 + α1 ε2 t−1 + β 1 ht−1 + δ1 COV ID19t ,               (2)

                                                  EGARCH (1, 1) : ln(ht ) = ω + βln(ht−1 ) + α|ηt−1 | + γηt−1 + δCOV ID19t ,        (3)
                                                                                                                      √
                                         where ht represents conditional volatility and the variable, ηt = ε t / ht denotes the
                                         standardised errors.
                                               Throughout, we assume that the random shocks, ε t follow Generalized Error Distri-
                                         bution (GED) such that ε t ∼ GED (0, Ht , v), where v is the shape parameter that would
                                         also be estimated along with the other parameters.10 To estimate these models, we will
                                         apply the Quasi-Maximum Likelihood Estimation (QMLE) method using EVIEWS 11. Note
                                         that by setting δ1 = 0 in Equation (2), the GARCHX model reduces to a simple GARCH
                                         model. Following Bollerslev (1986), we require the constraints, ω1 > 0, α1 ≥ 0, β 1 ≥ 0 and
                                         α1 + β 1 < 1 such that the conditional variances or the GARCH term, ht , are postive and
                                         stationary. Furthermore, the restriction α1 + β 1 < 1 is a sufficient condition to ensure that
                                         the QMLE of GARCH(1,1) model in Equation (2) are consistent and asymptotically normal
                                         (Chang and McAleer 2017). Likewise, as stated in He et al. (2002) and McAleer and Hafner
                                         (2014), the EGARCH model will be stable only if | β| < 1, whereas the asymmetry holds if
                                         γ 6= 0. Meanwhile, leverage exists when we observe γ < 0 and γ < α < −γ. This justifies
                                         the choice of our model(s) to conduct empirical analysis which is done in the next section.

                                         4. Empirical Analysis
                                               Our empirical analysis in this section begins with the identification of an optimal
                                         ARIMA (ARIMAX) model and then followed by estimating ARCH/GARCH specification.
                                         In the diagnostic part, firstly, we execute a graphical plot of all the time series used in our
                                         study. A visual analysis indicates that the variables do not show a trend and that the fluc-
                                         tuations in each series are around its mean but with a larger variability (refer to Figure 2).
                                         Secondly, we apply the Box-Jenkins methodology and obtain ARMA (1,11) with covariates
                                         as a parsimonious model for our mean equation. To identify the possible presence of het-
                                         eroskedasticity and the ARCH effects, we construct correlograms of the squared residuals
                                         in Figure 3 below. This qualitative analysis reveals significant ARCH effects in both the
                                         initial model (with constant only) and ARMA (1,11) model. The outcome is also confirmed
                                         by the Breusch-Pagan test of heteroskedasticity and the LM test, respectively (see panel B
                                         of Table 2. The results in panel B of Table 4 confirms the presence of heteroskedasticity and
                                         (G)ARCH effect, also evident from the correlogram of residuals squared from the mean
                                         equation with constant only and ARMA (1,11) models (see Figure 3).
                                               We estimate the parameters of the GARCHX model using Equations (2) and (3); for
                                         brevity, results are not presented here. The findings concerning three alternative model
                                         specifications correspond to three alternative proxies of COVID-19 variables. Column 1
                                         corresponds to COVID-19A, i.e., the total number of confirmed cases of COVID-19, column
J. Risk Financial Manag. 2021, 14, 314                                                                                                                     8 of 15

J. Risk Financial Manag. 2021, 14, x FOR PEER REVIEW                                                                                                     8 of 14
                                         2 relates to COVID-19B, i.e., the total number of deaths due to COVID-19 and column 3
                                         parallels to COVID-19C. It is a dummy variable that depicts the negative news, and it takes
                                         a value
                                         the        of 1 from
                                               coefficients   of 24   February 2020
                                                                  VWR-ASX200            to 22
                                                                                  t−1 are     Marchand
                                                                                           negative   2020overwhelmingly
                                                                                                            otherwise 0. In the     mean equation,
                                                                                                                                statistically  signifi-
                                         while
                                         cant.    the coefficients     of COVID-19A       and  COVID-19B     are  positive   and  insignificant,    the
                                         coefficient   of  COVID-19C       provides   evidence   that COVID-19     has a  negative  and
                                                Similarly, in the conditional volatility equation, the results show that the dummy for    statistically
                                         significant when
                                         COVID-19,      effect included
                                                                 on Australian     stock returns.
                                                                           in the variance   equation,Surprisingly,
                                                                                                        has a positivethe
                                                                                                                        andcoefficients
                                                                                                                             statisticallyofsignificant
                                                                                                                                              COVID-
                                         19A    and  COVID-19B         are insignificant.   However,    a negative    and  statistically
                                         effect on tomorrow’s volatility of stock returns. The impact of COVID-19 is more pronounced      significant
                                         coefficient
                                         for COVID-19C, of COVID-19C        implies
                                                              i.e., the negative news  that the stock
                                                                                         relating      market has
                                                                                                  to COVID-19.        already taken
                                                                                                                 Additionally,    among thetheeffect of
                                                                                                                                               drivers
                                         negative    news    and    may   explain  why    the coefficients of COVID-19A        and  COVID-19B
                                         of stock returns, crude oil prices have the expected, i.e., positive and significant effect on stock       are
                                         insignificant.
                                         returns            Most
                                                   for all the       importantly,
                                                                specifications.      the model
                                                                                In contrast,      provides
                                                                                               while         evidence
                                                                                                     the interest rate is across  all specifications,
                                                                                                                          insignificant  for the spec-
                                         i.e.,  from  column      1  to column   3,  to  predict  negative  stock   returns   for
                                         ifications in columns 1 and 2, it has the expected sign (negative) with a statistically  tomorrow      as the
                                                                                                                                           significant
                                         coefficients of VWR-ASX200t −1 are negative and overwhelmingly statistically significant.
                                         effect on stock returns for the specification in column 3.

                                         Panel A                                                              Panel B

                                         Panel C                                                              Panel D

      Figure 2.
      Figure   2. Panel
                  Panel (A)  shows the
                         (A) shows    the first  difference of
                                           first difference  of Oil   Price, Panel
                                                                Oil Price,   Panel (B)(B) depicts
                                                                                           depicts the
                                                                                                    the first
                                                                                                         first difference
                                                                                                               difference of
                                                                                                                           of Interest
                                                                                                                               Interest rates,
                                                                                                                                          rates, Panel
                                                                                                                                                 Panel (C)
                                                                                                                                                        (C)
      presents the first difference of the number of confirmed cases from COVID-19, while Panel (D) is the first difference of the
      presents the first difference of the number of confirmed cases from COVID-19, while Panel (D) is the first difference of the
      number of deaths due to COVID-19. We use data of 197 stocks listed on S&P/ASX200 from 27 January 2020 to 30 December
      number of deaths due to COVID-19. We use data of 197 stocks listed on S&P/ASX200 from 27 January 2020 to 30 December
      2020 to examine the effect of COVID-19 on Australian stock returns and their volatility. VWR-ASX200 is the value-
      2020  to examine
      weighted    returnthe   effect
                          of 197     of COVID-19
                                  stocks              on Australianat
                                           listed in S&P/ASX200        stock  returns
                                                                         level,          andistheir
                                                                                 Oil Price      the volatility. VWR-ASX200
                                                                                                    international                 is thetovalue-weighted
                                                                                                                     crude oil price       the order I(1),
      return  of 197  stocks listed  in S&P/ASX200       at level, Oil  Price  is the   international  crude   oil
      the Interest rate is Australian one-month interbank interest rate to the order I(1), COVID-19A represents theprice to  the order   I(1), the number
                                                                                                                                            total  Interest
      rate is Australian
      of confirmed         one-month
                       cases in Australiainterbank
                                              due to interest
                                                      COVID-19 rateto
                                                                    tothe
                                                                        the order
                                                                            order I(1),
                                                                                    I(1), COVID-19B
                                                                                           COVID-19A represents the    the total
                                                                                                                            total number
                                                                                                                                   numberof   ofconfirmed
                                                                                                                                                 deaths in
      Australia
      cases       due to COVID-19
             in Australia               to the order
                           due to COVID-19        to theI(1) and
                                                         order     COVID-19C
                                                                I(1), COVID-19B     is represents
                                                                                        a dummy the variable    depicting
                                                                                                        total number    of the
                                                                                                                           deathsnegative    news, due
                                                                                                                                     in Australia    and to
                                                                                                                                                          it
      takes a value
      COVID-19        of 1order
                   to the  from I(1)
                                  24 February     2020 to is
                                      and COVID-19C       22aMarch
                                                               dummy   2020  otherwise
                                                                          variable          0. the negative news, and it takes a value of 1 from
                                                                                     depicting
      24 February 2020 to 22 March 2020 otherwise 0.
                                         4.1. Analysis of GARCH and EGARCH Models
                                              Table 5 provides the estimation results of the GARCH and EGARCH models with
                                         and without news. From the results under the mean equation, we observe that the
                                         constant term is not statistically significantly different from zero in all the models. This
                                         outcome is not unexpected based on the mean value or the observed returns from the
                                         descriptive statistics. We also observe negative but statistically significant autocorrelation
                                         of the current period returns with its own one-period (day) lag values, VWR-ASX200t−1.
                                         Similarly, the individual coefficients of both the percentage change in oil price and the
significant in the EGARCH-with News specification. A potential explanation of this weak
                                         significance is the strong stance of the RBA to keep the target cash rate low with changes
                                         from 0.75% to 0.5% to 0.25% on the 4th and 20th March, respectively, and 0.1% on 4th
                                         November 2020. We observe that the first two changes correspond to the period where
J. Risk Financial Manag. 2021, 14, 314   the returns were extremely volatile as can be seen in Figure 2. Overall, we observe   9 ofthe
                                                                                                                                    15
                                         consistency in the signs of the covariates with only minor variation in the sizes across the
                                         models in the mean equation.

            Mean Equation:         =       +                                              =     +             +           +             19

            l = 22 lags                                                                                   +       ∆ (    )+     ∆            +

      Figure 3.
      Figure  3. The
                 The diagram      shows the
                      diagram shows       the correlograms
                                              correlograms of of squared
                                                                 squared residuals.
                                                                          residuals. We
                                                                                     Weuse
                                                                                         usedata
                                                                                            dataofof197
                                                                                                    197stocks
                                                                                                         stockslisted
                                                                                                                 listedon
                                                                                                                        onS&P/ASX200
                                                                                                                           S&P/ASX200 fromfrom
      27 January 2020 to 30 December 2020 to examine the effect of COVID-19 on Australian stock returns and their volatility.
      27 January 2020 to 30 December 2020 to examine the effect of COVID-19 on Australian stock returns and their volatility.
      VWR-ASX200 is the value-weighted return of 197 stocks listed in S&P/ASX200 at level, Oil Price is the international crude
      VWR-ASX200 is the value-weighted return of 197 stocks listed in S&P/ASX200 at level, Oil Price is the international crude
      oil price to the order I(1), the Interest rate is Australian one-month interbank interest rate to the order I(1), COVID-19A
      oil price to the
      represents    the total
                         ordernumber
                                I(1), theofInterest ratecases
                                            confirmed    is Australian  one-month
                                                              in Australia           interbankto
                                                                            due to COVID-19    interest rateI(1),
                                                                                                 the order    to the  order I(1),represents
                                                                                                                  COVID-19B        COVID-19Athe
      represents
      total number of deaths in Australia due to COVID-19 to the order I(1) and COVID-19C is a dummy variable depicting the
                  the  total  number    of  confirmed   cases in  Australia due to COVID-19   to the order  I(1), COVID-19B     represents  the
      total number
      negative   news,of and
                          deaths  in Australia
                              it takes  a value due   to COVID-19
                                                 of 1 from           to the
                                                            24 February     order
                                                                          2020    I(1)March
                                                                               to 22   and COVID-19C    is a dummy
                                                                                            2020 otherwise   0.        variable depicting the
      negative news, and it takes a value of 1 from 24 February 2020 to 22 March 2020 otherwise 0.
                                                When analysing the GARCH(1,1) without news specification, we observe that the
                                         Table  4. Panelestimates
                                         coefficient        A shows thesatisfy
                                                                            values oftheR2 taken                 = 0.0942
                                                                                                   from regression
                                                                                            constraints               output >   0, Durbin-Watson
                                                                                                                               and      = 0.2002 > statistic
                                                                                                                                                         0, =
                                         0.7688 > 0, and
                                         (DW)    fetched   after     + = 0.97 < 1 (where this condition implies that the QMLE of> the
                                                                  running    the regression.    A   comparison     of these  shows   that   DW    statistic   R2 .
                                         Panel B presents
                                         GARCH        model is  theconsistent
                                                                     Breusch test
                                                                                with forapproximately
                                                                                          heteroskedasticity    and the
                                                                                                            normal         LM Test to However,
                                                                                                                       distribution).    observe thewe    ARCH
                                                                                                                                                            note
                                         Effect.
                                         that the Inconstant     term, ω istest,
                                                     the heteroskedasticity           the null hypothesis
                                                                                 statistically               for homoskedasticity
                                                                                                 insignificant.    In the case of the is rejected
                                                                                                                                         GARCH(1,1) in favour  of
                                                                                                                                                            with
                                         heteroskedasticity.
                                         the  News model,Inwe       the ARCH
                                                                         observe  effect,
                                                                                     thatthe  null
                                                                                            the     hypothesis for no
                                                                                                  coefficient,         of ARCH    effect ist rejected
                                                                                                                           COVID-19C                   in favour
                                                                                                                                             is positive    and
                                         of the presence
                                         statistically       of ARCH effects.
                                                          significant,    implyingWe usethatdata  of 197 stocks
                                                                                              positive    news listed
                                                                                                                  impactson S&P/ASX200
                                                                                                                              the returns from       27-01-2020
                                                                                                                                               positively    and
                                         to 30-12-2020     to examine     the effect  of  COVID-19      on Australian
                                         vice-versa. In contrast to the model with no news, the results reveal that      stock  returns   and   their        ≥0
                                                                                                                                                       volatility.
                                         VWR-ASX200
                                         constraint is is     the value-weighted
                                                            statistically              return of 197while
                                                                            highly significant,                   > 1in implies
                                                                                                       stocks listed     S&P/ASX200a long at level,
                                                                                                                                              memory Oil Price is
                                                                                                                                                          of the
                                         the international
                                         volatility    (which crude   oil price to in
                                                                  is explosive      thenature).
                                                                                        order I(1),Also,
                                                                                                     the Interest  rate is Australian
                                                                                                           the GARCH                   one-month
                                                                                                                            model assumes             interbank
                                                                                                                                                    symmetric
                                         interest rate
                                         effects        to the positive
                                                    of both     order I(1),and
                                                                             COVID-19A
                                                                                  negative  represents
                                                                                               shocks the ontotal  number For
                                                                                                              volatility.   of confirmed     cases in Australia
                                                                                                                                  these reasons,        we pay
                                         due to COVID-19
                                         attention              to the order I(1),
                                                      to the asymmetric              COVID-19B
                                                                               or EGARCH             represents the total number of deaths in Australia
                                                                                                  model.
                                         due to COVID-19 to the order I(1) and COVID-19C is a dummy variable depicting the negative news,
                                         and it takes a value of 1 from 24-02-2020 to 22-03-2020 otherwise 0.

                                                        Panel-A
                                                        R2                                       0.2491
                                               Durbin-Watson Statistic                            2.84
                                                        Panel-B
                                               LM Test of ARCH effects                          75.6858                                  0.0000

                                              Similarly, in the conditional volatility equation, the results show that the dummy
                                         for COVID-19, when included in the variance equation, has a positive and statistically
                                         significant effect on tomorrow’s volatility of stock returns. The impact of COVID-19 is more
                                         pronounced for COVID-19C, i.e., the negative news relating to COVID-19. Additionally,
J. Risk Financial Manag. 2021, 14, 314                                                                                               10 of 15

                                         among the drivers of stock returns, crude oil prices have the expected, i.e., positive and
                                         significant effect on stock returns for all the specifications. In contrast, while the interest rate
                                         is insignificant for the specifications in columns 1 and 2, it has the expected sign (negative)
                                         with a statistically significant effect on stock returns for the specification in column 3.

                                         4.1. Analysis of GARCH and EGARCH Models
                                               Table 5 provides the estimation results of the GARCH and EGARCH models with and
                                         without news. From the results under the mean equation, we observe that the constant
                                         term is not statistically significantly different from zero in all the models. This outcome
                                         is not unexpected based on the mean value or the observed returns from the descriptive
                                         statistics. We also observe negative but statistically significant autocorrelation of the current
                                         period returns with its own one-period (day) lag values, VWR-ASX200t −1 . Similarly,
                                         the individual coefficients of both the percentage change in oil price and the moving
                                         average term, MA(11), are positive and statistically significant. In contrast, the interest rate
                                         changes wield a negative impact which is insignificant in the GARCH(1,1)-without News
                                         specification, but significant in GARCH(1,1)-with News, EGARCH(1,1)-with News and
                                         EGARCH(1,1)-without News models. However, the coefficient is weakly significant in the
                                         EGARCH-with News specification. A potential explanation of this weak significance is
                                         the strong stance of the RBA to keep the target cash rate low with changes from 0.75% to
                                         0.5% to 0.25% on the 4th and 20th March, respectively, and 0.1% on 4th November 2020.
                                         We observe that the first two changes correspond to the period where the returns were
                                         extremely volatile as can be seen in Figure 2. Overall, we observe the consistency in the
                                         signs of the covariates with only minor variation in the sizes across the models in the mean
                                         equation.
                                               When analysing the GARCH(1,1) without news specification, we observe that the
                                         coefficient estimates satisfy the constraints ω̂1 = 0.0942 > 0, α̂1 = 0.2002 > 0, β̂ 1 =
                                         0.7688 > 0, and α̂1 + β̂ 1 = 0.97 < 1 (where this condition implies that the QMLE of the
                                         GARCH model is consistent with approximately normal distribution). However, we note
                                         that the constant term, ω1 is statistically insignificant. In the case of the GARCH(1,1)
                                         with the News model, we observe that the coefficient, δ1 of COVID-19Ct is positive and
                                         statistically significant, implying that positive news impacts the returns positively and
                                         vice-versa. In contrast to the model with no news, the results reveal that α1 ≥ 0 constraint
                                         is statistically highly significant, while β̂ 1 > 1 implies a long memory of the volatility
                                         (which is explosive in nature). Also, the GARCH model assumes symmetric effects of
                                         both positive and negative shocks on volatility. For these reasons, we pay attention to the
                                         asymmetric or EGARCH model.
                                               We observe all the coefficients in the conditional variance equation of the EGARCH
                                         models without and with news are statistically significant, including the intercept term
                                         (that has weak significance). We also observe that the stability condition β < 1 is also
                                                                                                                  Resid t−1
                                         satisfied. Furthermore, the negative estimates of the coefficient α of √                   implies
                                                                                                                       GARCH t−1
                                         the asymmetric effect of negative news than the positive news of the same magnitude.
                                                                           Resid t−1
                                         Meanwhile, the coefficient γ of √           has a negative estimated value and is highly
                                                                               GARCH t−1
                                         significant, thus indicating the existence of the leverage effect. That is, positive shocks
                                         cause volatility to decrease and vice-versa. Also, in the EGARCH model with news, the
                                         statistically significant coefficient of the news dummy variable with positive value indicates
                                         that positive news will diminish volatility and vice-versa. The results not shown here;
                                         however, GARCH(1,1), EGARCH(1,1) models are still preferable to higher order variants
                                         based on the AIC.
J. Risk Financial Manag. 2021, 14, 314                                                                                                                  11 of 15

                                         Table 5. This table shows GARCHX estimates to show the effect of COVID-19 on the VWR of
                                         ASX200 and their volatility. We use data of 197 stocks listed on S&P/ASX200 from 27 January 2020 to
                                         30 December 2020 to examine the effect of COVID-19 on Australian stock returns and their volatility.
                                         VWR-ASX200 is the value-weighted return of 197 stocks listed in S&P/ASX200 at level, Oil Price is
                                         the international crude oil price to the order I(1), the Interest rate is Australian one-month interbank
                                         interest rate to the order I(1), COVID-19A represents the total number of confirmed cases in Australia
                                         due to COVID-19 to the order I(1), COVID-19B represents the total number of deaths in Australia
                                         due to COVID-19 to the order I(1) and COVID-19C is a dummy variable depicting the negative news,
                                         and it takes a value of 1 from 24 February 2020 to 22 March 2020 otherwise 0.

                                                                        GARCH(1,1)              GARCH(1,1)           EGARCH                  EGARCH
                                                                        without News            with News            without News            with News
                                          Mean Equation
                                          COVID-19Ct                                            −2.5263 ***           −1.277 ***             −2.428 ***
                                                                                                [0.559]              [0.452]                 [0.607]
                                          VWR-ASX200t −1                −0.2080 ***             −0.2734 ***           −0.260 ***             −0.279 ***
                                                                        [0.072]                 [0.056]              [0.053]                 [0.055]
                                          ∆ln(Oil Pricet )              3.9184 ***              4.881 ***            4.152 ***               4.1313 **
                                                                        [1.6164]                [1.695]              [1.533]                 [1.678]
                                          ∆(Interest Ratet )            −5.5980                 −9.4148 **            −12.534 ***            −9.3966 *
                                                                        [4.995]                 [4.779]              [4.477]                 [5.186]
                                          MA(11)                        0.1404 **               0.1276 **            0.1780 ***              0.1550 **
                                                                        [0.063]                 [0.064]              [0.057]                 [0.061]
                                          Constant                      0.0921                  0.0842                −0.0401                0.033
                                                                        [0.087]                 [0.090]              [0.074]                 [0.087]
                                          COVID-19Ct                                            0.5925 ***                                   0.1260 ***
                                                                                                [0.159]                                      [0.0402]
                                          ARCHt− 1                      0.2002 **               −0.0417 ***
                                                                        [0.079]                 [0.011]
                                          (ln)GARCHt− 1                 0.7688 ***              1.0165 ***           0.9905 ***              0.9865 ***
                                                                        [0.084]                 [0.0002]             [0.000]                 [0.000]
                                            √ Resid t−1                                                               −0.0823 **             −0.0950 **
                                             GARCH t−1

                                                                                                                     [0.0412]                [0.0478]
                                           √ Resid t−1                                                                −0.231 ***             −0.1424 **
                                            GARCH t−1

                                                                                                                     [0.054]                 [0.067]
                                          Constant                      0.0942                  0.0186               0.0710 *                0.0723 *
                                                                        [0.074]                 [0.014]              [0.036]                 [0.037]
                                          Log Likelihood                −412.3250               −395.2095             −395.4455              −390.9372
                                          R-Squared                     0.1736                  0.3471               0.3153                  0.3356
                                          Adjusted R-Squared            0.1593                  0.3329               0.3005                  0.3012
                                          Durbin-Watson Stat            2.0760                  2.3343               2.195                   2.2960
                                         Note that * represents significance at the 10% level, ** at the 5% level and *** at the 1% level.

                                         4.2. News Impact Curve
                                              To further support the presence of asymmetry and leverage, we plot the news impact
                                         curves (NIC) using the parameters’ estimates from all four models and monitor the impact
                                         of shocks on the conditional volatility of returns. Details on various specifications of
J. Risk Financial Manag. 2021, 14, x FOR PEER REVIEW                                                                                                      11 of 14

J. Risk Financial Manag. 2021, 14, 314                  To further support the presence of asymmetry and leverage, we plot the news impact                  12 of 15
                                                  curves (NIC) using the parameters’ estimates from all four models and monitor the impact
                                                  of shocks on the conditional volatility of returns. Details on various specifications of the
                                                  NIC corresponding to variants of the GARCH model can be found in Caporin and Costola
                                                  the NICAsymmetry
                                                  (2019).     corresponding  of theto variants
                                                                                      GARCH of      the GARCH
                                                                                                  model   requiresmodel
                                                                                                                      that thecanpast
                                                                                                                                   be found
                                                                                                                                       positivein and
                                                                                                                                                    Caporin    and
                                                                                                                                                         negative
                                                  shocks of the same magnitude have different effects on the conditional volatility, thatand
                                                  Costola    (2019).    Asymmetry        of  the  GARCH      model    requires    that  the past    positive     is,
                                                  negative
                                                       (|     shocks
                                                               |) ≠ of(−|  the same |). magnitude    have different
                                                                                        As stated earlier,              effectseffect
                                                                                                              the leverage       on the  conditional
                                                                                                                                       holds   when avolatility,
                                                                                                                                                          positive
                                                  shock               t−1 |) 6 = Nbut
                                                            N IC (|evolatility,
                                                  that is,reduces                   IC (−| et−1 |). As
                                                                                        a negative      stated
                                                                                                     shock      earlier,
                                                                                                             leads to anthe    leverage
                                                                                                                            increase      effect
                                                                                                                                      in the      holds when
                                                                                                                                              conditional    vola- a
                                                  positive
                                                  tility.   shock    reduces     volatility, but a negative   shock  leads   to an increase  in  the  conditional
                                                  volatility.
                                                        From Figure 4 below, we find that the GARCHX (1,1)-Without News is a symmetric
                                                        From Figure
                                                  and U-shaped       curve4 below,    we that
                                                                               implying   find the
                                                                                                thatpast
                                                                                                     the positive
                                                                                                          GARCHX   and (1,1)-Without
                                                                                                                          negative shocksNews of is
                                                                                                                                                 thea same
                                                                                                                                                      symmetric
                                                                                                                                                             mag-
                                                  nitude have the same effect on the conditional volatility. Also, we find the largerthe
                                                  and   U-shaped       curve    implying     that the  past  positive    and   negative   shocks     of  the same
                                                                                                                                                             mag-
                                                  magnitude
                                                  nitude   of the have  the the
                                                                    shock,     same  effectthe
                                                                                   larger     onimpact
                                                                                                 the conditional   volatility.
                                                                                                         there is on             Also, we
                                                                                                                       the volatility.      find the GARCHX
                                                                                                                                         However,       larger the
                                                  magnitude      of the  shock,   the  larger
                                                  (1,1) model-With News is unstable since      the impact   there is on   the volatility. However,
                                                                                                             > 1 and provides negative volatilities for GARCHX
                                                  (1,1) model-With News is unstable since β̂ 1 > 1 and provides negative volatilities for larger
                                                  larger   shocks which is not possible. For this reason, we do not interpret this unstable
                                                  shocks which is not possible. For this reason, we do not interpret this unstable model.
                                                  model.

                                                News Impact Curves- GARCH(1,1) VS EGARCH(1,1)
                                                                                    5                     GARCH_News
                                                                                                          EGARCH-News
                                                                                  4.5
                                                                                                          EGARCH-Without News
                                                                                    4                     GARCH_Without News
               Conditional Variance (ht)

                                                                                  3.5
                                                                                    3
                                                                                  2.5
                                                                                    2
                                                                                  1.5
                                                                                    1
                                                                                  0.5
                                                                                    0
                              -5           -4       -3          -2         -1            0         1           2           3          4           5
                                                                                  -0.5
                                                                                  Past shocks (εt-1)
      Figure 4.
      Figure  4. This
                 This figure  shows the
                       figure shows     the news
                                            news impact
                                                   impact curve
                                                           curve in
                                                                 in the
                                                                    the GARCHX
                                                                        GARCHX modelmodel with
                                                                                            with &
                                                                                                 & without
                                                                                                     without news
                                                                                                              news and
                                                                                                                     and the
                                                                                                                          the EGARCH
                                                                                                                              EGARCH model.
                                                                                                                                         model.
      We use data of 197 stocks listed on S&P/ASX200 from 27 January 2020 to 30 December 2020 to examine the effect of COVID-
      We use data of 197 stocks listed on S&P/ASX200 from 27 January 2020 to 30 December 2020 to examine the effect of
      19 on Australian stock returns and their volatility. VWR-ASX200 is the value-weighted return of 197 stocks listed in
      COVID-19 on Australian stock returns and their volatility. VWR-ASX200 is the value-weighted return of 197 stocks listed in
      S&P/ASX200 at level; Oil Price is the international crude oil price to the order I(1), the Interest rate is Australian one-month
      S&P/ASX200      at level;
      interbank interest    rateOil
                                  to Price is theI(1),
                                     the order    international
                                                       COVID-19Acrude  oil price the
                                                                    represents   to the order
                                                                                     total    I(1), the
                                                                                           number    of Interest
                                                                                                        confirmedratecases
                                                                                                                      is Australian one-month
                                                                                                                            in Australia due to
      interbank
      COVID-19 to the order I(1), COVID-19B represents the total number of deaths in Australia due to COVID-19 to thedue
                  interest  rate  to the  order  I(1), COVID-19A    represents   the total number    of confirmed    cases in  Australia     to
                                                                                                                                          order
      COVID-19     to the  order  I(1), COVID-19B      represents the total number    of deaths in  Australia  due  to COVID-19
      I(1), and COVID-19C is a dummy variable depicting the negative news, and it takes a value of 1 from 24 February 2020 to      to the order
      22 March
      I(1),      2020 otherwise
            and COVID-19C       is a 0.
                                     dummy variable depicting the negative news, and it takes a value of 1 from 24 February 2020 to
      22 March 2020 otherwise 0.
                                                       In the case of the asymmetric model-EGARCH with and without news, we observe
                                                       In the case
                                                  asymmetry          of the
                                                                 and the     asymmetric
                                                                         leverage           model-EGARCH
                                                                                    effect of                      with and
                                                                                               shocks in the volatility        without returns.
                                                                                                                           of ASX-200    news, we   observe
                                                                                                                                                  However,
                                                  asymmetry
                                                  another        and the leverage
                                                            interesting  finding iseffect
                                                                                       that of
                                                                                            theshocks
                                                                                                  EGARCHin themodel
                                                                                                                volatility
                                                                                                                       withof volatility
                                                                                                                               ASX-200 returns.
                                                                                                                                          equationHowever,
                                                                                                                                                    without
                                                  another
                                                  news      interesting finding
                                                        demonstrates      a larger is  that theleverage
                                                                                    (smaller)     EGARCH       model
                                                                                                            effect     with
                                                                                                                   of the     volatility
                                                                                                                           negative      equation
                                                                                                                                      (positive)    without
                                                                                                                                                  shocks  on
                                                  news   demonstrates      a larger  (smaller)     leverage   effect of  the  negative    (positive)
                                                  the conditional volatility compared to its variant with the news. This outcome is obvious          shocks
                                                  on the
                                                  from  theconditional    volatility
                                                              larger magnitude     of compared
                                                                                          from thetomodel
                                                                                                        its variant  with
                                                                                                               without      the compared
                                                                                                                         news    news. This   to outcome   is
                                                                                                                                                 the estima-
                                                  obvious    from  the larger  magnitude       of γ̂ from  the  model    without   news
                                                  tion from the model with news in the volatility equation. So, the EGARCH model con-      compared   to the
                                                  estimation
                                                  forms         from the model
                                                         to asymmetry             with news
                                                                           and leverage,         in thethe
                                                                                            whether      volatility
                                                                                                            dummyequation.
                                                                                                                      for news So,   the EGARCH
                                                                                                                                 is included   in the model
                                                                                                                                                      condi-
                                                  conforms     to asymmetry     and   leverage,    whether    the  dummy     for news
                                                  tional volatility equation. When the announcement of negative news by AHPPC that       is included  in the
                                                                                                                                                         the
                                                  conditional volatility equation. When the announcement of negative news by AHPPC
                                                  COVID-19 developing into a pandemic and that a local outbreak would place enormous
                                                  that the COVID-19 developing into a pandemic and that a local outbreak would place
                                                  enormous pressure on the healthcare system (see Section 2), stocks of companies in S&P
                                                  ASX 200 decreased substantially, causing the leverage to increase. The higher level of
                                                  leverage led the perception of the risk associated with the companies in S&P ASX 200 to
J. Risk Financial Manag. 2021, 14, 314                                                                                                13 of 15

                                         increase with the volatility of their stocks. Therefore, we observe higher volatility on the
                                         release of negative news versus when the positive news arrives on the market. On the
                                         other hand, this unequal impact on volatility corresponds to the asymmetry effect.

                                         5. Forecast Evaluation
                                               Finally, we evaluate the EGARCH models with and without news using the out-
                                         of-sample forecast for the next seven days. The results are reported in Table 6 below,
                                         where we do not observe any significant difference between the Root Mean Square Errors
                                         (RMSE), Mean Absolute Error (MAE) and Theil U2 coefficients. For each model, the value
                                         of the Theil U2 coefficient indicates the underlying model is superior to the naïve model.
                                         However, the Mean Absolute Percentage Error (MAPE) is slightly lower for the model with
                                         the news. We also perform the Diebold-Mariano (DM) forecast evaluation test and observe
                                         that the test fails to reject the null of equal forecast accuracy (using absolute or squared loss
                                         functions). Hence both models are equally preferable in terms of their forecast evaluation.

                                         Table 6. Out-of-Sample (7 days) Forecast Evaluation. Value in the square bracket denotes the p-value
                                         of the DM test using the MAE loss function. The same results hold if we use the MSE as the error
                                         criterion.

                                                                                                      EGARCH
                                                    Measures                       Without News                       With News
                                                      RMSE                              0.7411                           0.7427
                                                      MAE                               0.6362                           0.6328
                                                      MAPE                             94.6095                          87.5828
                                                     Theil U2                           0.7749                           0.7606
                                                                                        0.3107
                                                     DM Test
                                                                                       [0.7560]

                                         6. Concluding Remarks
                                              This paper examines the impact of COVID-19 on the volatility of Australian stock
                                         returns. It further examines the presence of asymmetry and suspected leverage due to
                                         both negative and positive news (shocks) on the volatility of Australian stock returns by
                                         employing GARCHX (1,1), EGARCH(1,1) and News impact curve (NIC). We observe some
                                         of the following important findings.
                                         (i)   COVID-19 has a negative effect on Australian stock returns in both GARCHX (1,1)
                                               and EGARCH(1,1) specifications.
                                         (ii) We also find that the negative news has increased the volatility of Australian stock
                                               returns for both GARCHX (1,1) and EGARCH(1,1) with News (negative news) speci-
                                               fications.
                                         (iii) We further find that the GARCHX (1,1)-with News model and GARCHX (1,1)-without
                                               News model exhibit symmetry. However, EGARCH(1,1) with the News model
                                               and EGARCH(1,1) without News model indicates the presence of asymmetry and
                                               leverage.
                                               To further validate the presence of symmetry in GARCHX (1,1) without News and
                                         GARCHX (1,1) with News models and the presence of asymmetry and purported leverage
                                         in EGARCH(1,1)-without News and EGARCH(1,1)-with News models, we employ NIC. It
                                         is also observed that NIC shows that GARCHX (1,1)-without News is symmetric, implying
                                         that the past positive and negative shocks of the same magnitude have the same effect
                                         on the conditional volatility. On the other hand, NIC shows that GARCHX (1,1) with
                                         News is unstable. In terms of both the models of EGARCH(1,1), the NIC confirms the
                                         presence of asymmetry and leverage. NIC provides another interesting finding that the
                                         EGARCH model with volatility equation without news demonstrates a larger (smaller)
                                         leverage effect of the negative (positive) shocks on the conditional volatility compared
                                         to its variant with the news. The findings suggest that EGARCH(1,1) can represent the
J. Risk Financial Manag. 2021, 14, 314                                                                                                 14 of 15

                                              asymmetric conditional volatility process for daily returns time series of ASX-200. The
                                              forecast evaluation of both the specifications of EGARCH(1,1) suggest that both the models
                                              are preferable; however, EGARCH is superior to a naïve model.

                                              Author Contributions: Conceptualization and validation, all three authors; methodology, software
                                              & formal analysis N.I. and M.S.M.; original draft preparation, N.I.; writing—review and editing, N.I.,
                                              M.S.M. & M.I.B.; supervision and project administration, M.I.B. All authors have read and agreed to
                                              the published version of the manuscript.
                                              Funding: This research received no external funding.
                                              Institutional Review Board Statement: Not applicable.
                                              Informed Consent Statement: Not applicable.
                                              Data Availability Statement: Not applicable.
                                              Acknowledgments: We are thankful to the four anonymous reviewers, handling special issue editor
                                              Robert Brooks and the Editor of the JRFM for their constructive comments which have improved the
                                              quality of the papers. However, the authors take sole responsibility for all remaining errors.
                                              Conflicts of Interest: The authors declare no conflict of interest.

 Notes
1       The IMF in its report stated: “This is a crisis like no other, and there is substantial uncertainty about its impact on people’s lives and
        livelihoods. A lot depends on the epidemiology of the virus, the effectiveness of containment measures, and the development of
        therapeutics and vaccines, all of which are hard to predict. In addition, many countries now face multiple crises—a health crisis, a
        financial crisis, and a collapse in commodity prices, which interact in complex ways. Policymakers are providing unprecedented
        support to households, firms, and financial markets, and, while this is crucial for a strong recovery, there is considerable uncertainty
        about what the economic landscape will look like when we emerge from this lockdown” (World Economic Outlook, April 2020).
2       The Australian government provided financial support to individuals and businesses in the form of Jobkeeper payment, Jobseeker
        and other income support payments, reduced drawdown and deeming rates for retirees, home builder grant, COVID-19 support on
        state level basis, financial support for business and emergency, crisis, and legal support. (https://moneysmart.gov.au/covid-19
        /financial-assistance, accessed on 20 February 2021).
3       https://rba.gov.au/statistics/cash-rate/ (accessed on 20 February 2021).
4       https://www.who.int/docs/default-source/coronaviruse/situation-reports/20200505covid-19-sitrep-106.pdf?sfvrsn=47090f63_2
        (accessed on 27 January 2020).
5       The routine was developed in Python 3 to download the entire sample set.
6       Since this data is either steady and incremental the difference could either be 0 or positive, but it can never be negative. For this
        reason data is adjusted from 2 June 2020 to 22 June 2020 by increasing 1 number i.e., from 102 to 103 to bring it equal to the level of 1
        June 2020. The number of deaths on 23 June 2020 is also 103.
7       www.health.gov.au/news/australian-health-protection-principal-committee-ahppc-statement-on-coronavirus-covid-19-24-february-
        2020 (accessed on 13 February 2021).
8       https://www.who.int/director-general/speeches/detail/who-director-general-s-opening-remarks-at-the-media-briefing-on-covid-
        19---11-march-2020 (accessed on 7 July 2021).
9       v < (>)2 implies that GED has thicker (thinner) tails compared to the normal distribution, but GED is identical to the normal
        distribution when v = 2. Given the high kurtosis values of the returns, it is plausible to assume a thick-tailed distribution of the
        errors.
10      https://www.rba.gov.au/statistics/cash-rate/ (accessed on 7 July 2021).

     References
     Al-Awadhi, Abdullah M., Khaled Alsaifi, Ahmad Al-Awadhi, and Salah Alhammadi. 2020. Death and contagious infectious diseases:
         Impact of the COVID-19 virus on stock market returns. Journal of Behavioral and Experimental Finance 27: 100326. [CrossRef]
         [PubMed]
     Apergis, Nicholas. 1998. Stock market volatility and deviations from macroeconomic fundamentals: Evidence from GARCH and
         GARCH-X models. Kredit und Kapital 31: 400–12.
     Apergis, Nicholas, and Emmanuel Apergis. 2020. The role of Covid-19 for Chinese stock returns: Evidence from a GARCHX model.
         Asia-Pacific Journal of Accounting & Economics 2020: 1–9.
J. Risk Financial Manag. 2021, 14, 314                                                                                           15 of 15

Assefa, Tibebe A., Omar A. Esqueda, and André Varella Mollick. 2017. Stock returns and interest rates around the World: A panel data
      approach. Journal of Economics and Business 89: 20–35. [CrossRef]
Bakas, Dimitrios, and Athanasios Triantafyllou. 2020. Commodity price volatility and the economic uncertainty of pandemics.
     Economics Letters 193: 109283. [CrossRef]
Baumeister, Christiane, and James D. Hamilton. 2019. Structural interpretation of vector autoregressions with incomplete identification:
      Revisiting the role of oil supply and demand shocks. American Economic Review 109: 1873–910. [CrossRef]
Bollerslev, Tim. 1986. Generalised autoregressive conditional heteroskedasticity. Journal of Econometrics 31: 307–27. [CrossRef]
Caporin, Massimiliano, and Michele Costola. 2019. Asymmetry and leverage in GARCH models: A News Impact Curve perspective.
     Applied Economics 51: 3345–64. [CrossRef]
Chang, Chia-Lin, and Michael McAleer. 2017. The correct regularity condition and interpretation of asymmetry in EGARCH. Economics
     Letters 161: 52–55. [CrossRef]
Cologni, Alessandro, and Matteo Manera. 2008. Oil prices, inflation and interest rates in a structural cointegrated VAR model for the
      G-7 countries. Energy Economics 30: 856–88. [CrossRef]
Connor, Gregory, Robert A. Korajczyk, and Oliver Linton. 2006. The common and specific components of dynamic volatility. Journal of
     Econometrics 132: 231–55. [CrossRef]
Engle, Robert F., and Tim Bollerslev. 1986. Modelling the persistence of conditional variances. Econometric Reviews 5: 1–50. [CrossRef]
Engle, Robert F., Victor K. Ng, and Michael Rothschild. 1990. Asset pricing with a factor-ARCH covariance structure: Empirical
      estimates for treasury bills. Journal of Econometrics 45: 213–37. [CrossRef]
Gopinath, Gita. 2020. The great lockdown: Worst economic downturn since the great depression. IMF Blog 14: 2020.
He, Changli, Timo Teräsvirta, and Hans Malmsten. 2002. Moment structure of a family of first-order exponential GARCH models.
     Econometric Theory 18: 868–85. [CrossRef]
Huang, Wanling, André Varella Mollick, and Khoa Huu Nguyen. 2016. US stock markets and the role of real interest rates. The
     Quarterly Review of Economics and Finance 59: 231–42. [CrossRef]
Kilian, Lutz. 2009. Not all oil price shocks are alike: Disentangling demand and supply shocks in the crude oil market. American
     Economic Review 99: 1053–69. [CrossRef]
Laopodis, Nikiforos T. 2013. Monetary policy and stock market dynamics across monetary regimes. Journal of International Money and
     Finance 33: 381–406. [CrossRef]
Mazur, Mieszko, Man Dang, and Miguel Vega. 2021. COVID-19 and the march 2020 stock market crash. Evidence from S&P1500.
     Finance Research Letters 38: 101690. [PubMed]
McAleer, Michael, and Christian M. Hafner. 2014. A one line derivation of EGARCH. Econometrics 2: 92–97. [CrossRef]
Nelson, Daniel B. 1991. Conditional heteroskedasticity in asset returns: A new approach. Econometrica: Journal of the Econometric Society
     1991: 347–70. [CrossRef]
Nguyen, Cuong C., and M. Ishaq Bhatti. 2012. Copula model dependency between oil prices and stock markets: Evidence from China
      and Vietnam. Journal of International Financial Markets, Institutions and Money 22: 758–73. [CrossRef]
Rahman, Md Lutfur, Abu Amin, and Mohammed Abdullah Al Mamun. 2021. The COVID-19 outbreak and stock market reactions:
      Evidence from Australia. Finance Research Letters 38: 101832. [CrossRef]
Reboredo, Juan C., and Miguel A. Rivera-Castro. 2014. Wavelet-based evidence of the impact of oil prices on stock returns. International
     Review of Economics & Finance 29: 145–76.
Zhang, Dayong, Min Hu, and Qiang Ji. 2020. Financial markets under the global pandemic of COVID-19. Finance Research Letters 36:
     101528. [CrossRef] [PubMed]
You can also read