COVID19-HPSMP: COVID-19 Adopted Hybrid and Parallel Deep Information Fusion Framework for Stock Price Movement Prediction
←
→
Page content transcription
If your browser does not render page correctly, please read the page content below

COVID19-HPSMP: COVID-19 Adopted Hybrid and Parallel Deep
                                               Information Fusion Framework for Stock Price Movement Prediction

                                            Farnoush Ronaghi†, Mohammad Salimibeni†, Farnoosh Naderkhani†, and Arash Mohammadi†
                                                            †Concordia Institute for Information Systems Engineering, Concordia University,
                                               Emails:’ {f ronagh, m alimib}@encs.concordia.ca; {farnoosh.naderkhani, arash.mohammadi}@concordia.ca
                                            Coresponding Author: Arash Moohammadi; Email: arash.mohammadi@concordia.ca; Tel: (+1) 514-848-2424 Ext.
                                                    2712; Address: 1455 De Maisonneuve Blv. W., EV-009.187, Montreal, QC, Canada, H3G-1M8.
arXiv:2101.02287v1 [q-fin.ST] 2 Jan 2021

                                           Abstract

                                           The novel of coronavirus (COVID-19) has suddenly and abruptly changed the world as we knew
                                           at the start of the 3rd decade of the 21st century. Particularly, COVID-19 pandemic has negatively
                                           affected financial econometrics and stock markets across the globe. Artificial Intelligence (AI) and
                                           Machine Learning (ML)-based prediction models, especially Deep Neural Network (DNN) archi-
                                           tectures, have the potential to act as a key enabling factor to reduce the adverse effects of the
                                           COVID-19 pandemic and future possible ones on financial markets. In this regard, first, a unique
                                           COVID-19 related PRIce MOvement prediction (COVID19 PRIMO) dataset is introduced in this
                                           paper, which incorporates effects of social media trends related to COVID-19 on stock market price
                                           movements. Afterwards, a novel hybrid and parallel DNN-based framework is proposed that inte-
                                           grates different and diversified learning architectures. Referred to as the COVID-19 adopted Hybrid
                                           and Parallel deep fusion framework for Stock price Movement Prediction (COVID19-HPSMP), in-
                                           novative fusion strategies are used to combine scattered social media news related to COVID-19
                                           with historical mark data. The proposed COVID19-HPSMP consists of two parallel paths (hence
                                           hybrid), one based on Convolutional Neural Network (CNN) with Local/Global Attention modules,
                                           and one integrated CNN and Bi-directional Long Short term Memory (BLSTM) path. The two
                                           parallel paths are followed by a multilayer fusion layer acting as a fusion centre that combines local-
                                           ized features. Performance evaluations are performed based on the introduced COVID19 PRIMO
                                           dataset illustrating superior performance of the proposed framework.
                                           Keywords: COVID-19 Pandemic, Deep Neural Networks, Hybrid Models, Information Fusion,
                                           Stock Movement Prediction.

                                                                                                                                     January 8, 2021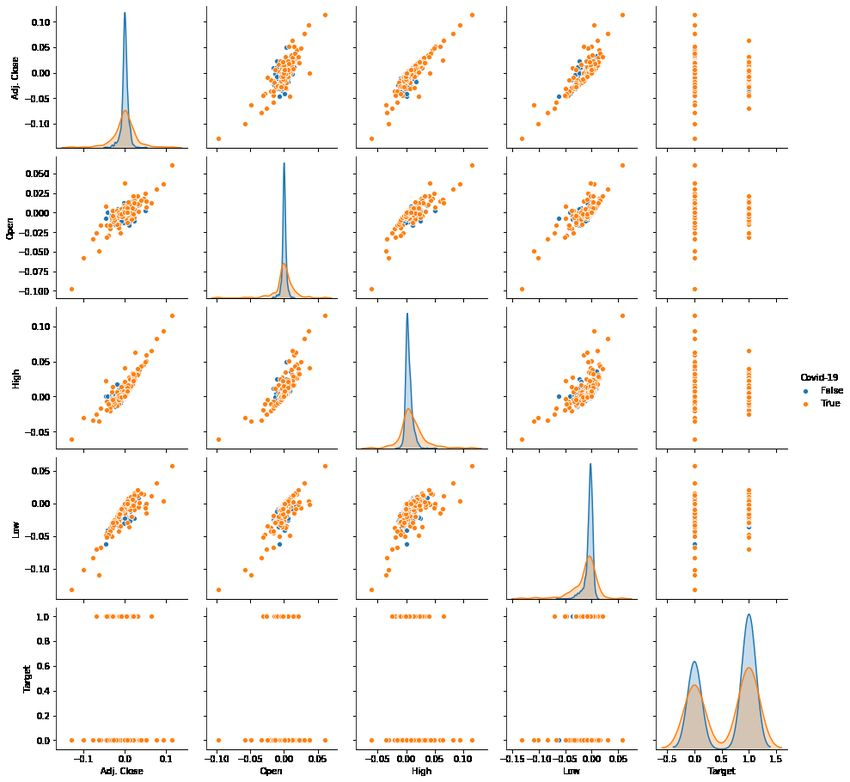
1. Introduction

   The novel of coronavirus (COVID-19) has suddenly and abruptly changed the world as we
knew at the end of the 2nd decade of the 21st century. The global COVID-19 pandemic caused
market volatility (Mazur et al., 2020; Baek et al., 2020) rocketing upward around the world. In
particular, the pandemic has negatively triggered several sectors including but not limited to stock
markets, global supply chains, labor markets, and consumption behaviors. Disruptions of such
sectors, especially the stock markets (Bustos & Pomares-Quimbaya, 2020; Al-Awadhi et al., 2020;
Saleh Ahmar & Boj del Val, 2020), can adversely affect the global economy. The United States
volatility levels in the mid-March of 2020 are similar to those last seen during October 1987; after
1929 to 1939, and; during in 2008. In September 2008, the Dow Jones Industrial Average fell 777.68
points in intraday trading. During the recent pandemic, in the latter part of March 2020, volatility
began to retreat and, by late April, fell sharply but remained well above pre-pandemic levels. It
is expected that the emerging markets, the ones with restricted resources to cope with negative
impacts of the COVID-19, more substantially feel the COVID-19 pressure due to having slower
economic growth and not having sufficient capital inflows. In these sad and unfortunate pandemic
times, Artificial Intelligence (AI) and Machine Learning (ML)-based (Radojicic & Kredatus, 2020;
Rezaei et al., 2020; Hoseinzade & Haratizadeh, 2019; Chong et al., 2019; Seong & Nam, 2021; Zhang
et al., 2020) stock market movement prediction solutions can potentially prevent the pandemic crisis
that negatively affecting the market across the world causing unexpected havocs.

Literature Review: Stock market movement prediction is a key and challenging problem in
financial econometrics as such has attracted extensive recent research focus (Frankel, 1995; Ronaghi
et al., 2017; Mohammadi et al., 2017; Edwards et al., 2007; Bollen & H. Mao, 2011; Jiang, 2020;
Hu et al., 2019; Koshiyama et al., 2020; Schumaker & Chen, 2009). It is widely acknowledged that
investors need high-quality data to make informed and accurate decisions. Particularly, in times of
market crisis, specifically during the recent COVID-19 pandemic, investors need advanced Big-Data
Analytic and Information Technologies to acquire timely and accurate data. Using high-quality
data, investors can perform fast analysis and decision making in the market volatility and react
quickly to the fast changing conditions. Any positive or negative news related to the stock market
crisis can have a ripple effect on the investors’ decision-making process within the stock markets.
During the pandemic area, typically, stock movement prediction becomes significantly challenging
                                                 2
as stock markets tend to face high fluctuations. Consequently, it is of paramount importance to
develop innovative and advanced processing and learning solutions to accurately predict stock
movements for achieving maximum potential profit. This has resulted in a recent surge of interest
in ML/AI-based prediction techniques (Hu et al., 2019; Anik et al., 2019) and fusion of multi-
modal information sources. In the context of stock price movement prediction, historical stock
prices are typically fused with information obtained from media news. For the latter, in addition
to the conventional news platforms, recently, extensive interest is shown towards utilization of
Internet-based news resources, such as social media for development of ML/AI predictive models.
The manuscript focuses on this topic and examines the role of COVID-19 related social media news
on behavior of Dow Jones market.
Recent advancements and developments in the field of ML and AI, in particular, Deep Neural
Networks (DNNs), have motivated different research works to incorporate such advanced modeling
techniques for prediction and forecasting tasks in stock markets (Tetlock, 2007). DNN-based solu-
tions are data-driven techniques that learn the underlying dynamics of the stock price movements
through processing of a large amount of data. DNN-based methodologies are, typically, data hungry
and will not perform well in absence of a large and diversified set of data resources. Availability
of public news media, Internet-based news channels, and social media can pave the way to bet-
ter train DNN models and further increase utilization of AI within stock markets. This research
field, however, is still in its infancy due to its high dependence on the reliability and quality of
the information available through Internet-based news channels and social media resources (Hu
et al., 2019). Furthermore, such data sources can not be directly used for prediction tasks (Luss
& D’Aspremont, 2015) due to the highly correlated nature of stock market price movements. To
tackle the aforementioned issues, there is an unmet and timely quest to develop and design: (i)
Hybrid processing/learning models based on different and diversified learning architectures to cap-
ture underlying correlations and variabilities of the data sources, and; (ii) Smart fusion strategies
to combine scattered social media news with historical mark data. The paper aims to take the first
step towards addressing this gap.
Contributions: The main objective of the proposed DNN-based predictive model is to construct
a new information fusion framework to analyses and interpret ever-changing trends during the
COVID-19 pandemic area. In this regard, first, a unique and real COVID-19 related PRIce MOve-
3ment prediction (COVID19 PRIMO) dataset (Ronaghi et al.)1 ” is constructed to incorporate effects
of internet-based and social media trends related to COVID-19 on stock market price movements.
The main component of the constructed COVID19 PRIMO dataset is based on Twitter messages.
It is well known that news and media move stock prices (Fama, 1998; Huang & Li, 2020; Yun
et al., 2019). Nowadays, information reaches out to the public via different news platforms ranging
from newspaper, radio and television to social media and Internet-based venues. In this area, social
media, especially Twitter, is a popular and widely used platform to share personalized opinion on
different topics. Twitter is also used extensively by politicians who potentially have high impact
on stock price movements. Based on a survey on Statista (Clement, 2020), from the first quarter
of 2017 to 2020, Twitter had 186 million active users worldwide.
Based on the constructed COVID19 PRIMO dataset, the paper proposes a data-driven (DNN-
based) COVID-19 adopted Hybrid and Parallel deep fusion framework for Stock price Movement
Prediction (COVID19-HPSMP) that uses information fusion to combine COVID-19 related Twitter
data with extended horizon market historical data. More specifically, in contrary to the existing
data-driven movement prediction models, where a single DL model is used (Ronaghi et al., 2017),
the proposed COVID19-HPSMP is a hybrid framework with two parallel paths, i.e., one based on
Convolutional Neural Network (CNN) with Local/Global Attention modules, and one integrated
CNN and Bi-directional Long Short term Memory (BLSTM). The former path is incorporated
within the COVID19-HPSMP framework to extract temporal features, while the latter path is used
to extract spatial features. The two parallel paths are followed by a multilayer fusion layer acting
as a fusion centre that combines localized features extracted in each of the two parallel paths. The
COVID19 PRIMO dataset is used to evaluate the performance of the proposed COVID19-HPSMP
framework, which illustrates its superior performance compared to its stand-alone (non-hybrid)
counterparts.
The remainder of the paper is organized as follows: Section 2 introduces the COVID19 PRIMO
dataset and formulates the stock movement prediction task. The COVID19-HPSMP hybrid frame-
work is presented in Section 3. The implementation study and results are presented in Section 4.
Finally, Section 5 concludes the paper.
1
The COVID19 PRIMO dataset is accessible through the following page:
https://github.com/MSBeni/COVID19 PRIMO#COVID19-PRIMO.
42. Problem Definition and COVID19 PRIMO
In this section, first, the COVID19 PRIMO dataset is introduced, which is constructed based on
the Dow Jones stock market index and its associated Twitter messages for the period of 01/01/2016
to 30/07/2020. The focus is on the problem of stock price movement prediction as close observation
of market movements can reveal presence of a significant amount of trading targets with minor
movement ratios. More specifically, the paper focuses on investigating effects of COVID-19 pan-
demic on stock price movement prediction. In this paper, stock movement prediction is modeled as
a two-class classification problem based on the adjusted closing price of the underlying stocks. The
adjusted closing price is commonly utilized to compute the associated stock dividends and earn-
ings (Xie et al., 2013). Furthermore, the adjusted closing price is beneficial to learn and predict
fluctuations in the stock market (Li et al., 2014; Rekabsaz & et al., 2017).
We have prepared a new dataset for the aforementioned prediction problem, which can facilitate
analysis and evaluation of potential impacts of a pandemic on stock market and can provide priceless
insights to combat future possible pandemic. The constructed COVID19 PRIMO dataset consists of
two components, i.e., historical prices and Twitter messages. The first component, historical data, is
obtained from Dow Jones stock market. With the ticker of DJI. Dow Jones is a stock market index
that measures the performance of 30 large companies like Apple, Boeing, and Microsoft. Historical
stock market prices are obtained from the Yahoo finance. For this task, we used the Yahoo finance
library in Python2 to collect the data from the Yahoo API. For some of the stocks, we also used
Alpha Vantage APIs3 . The data is prepared based on three different temporal resolutions, i.e.,
daily; weekly, and; monthly. The daily prices are used in our model described later for the task of
stock movement prediction.
Capitalizing on the facts identified in Section 1, for the news component of the COVID-19
price movement prediction dataset, we focused on Twitter. Fig. 1 shows the block diagram of the
approach followed to collect and analyze Twitter messages. Web scraping from the Twitter search
engine is utilized to build the Twitter dataset. The official API of the Twitter has some limitations
that restricts the extent of text that can be extracted. Additionally, the official API of the Twitter
cuts the tweets at times, which in turn results in items with missing data. We have developed a
2
http:https://pypi.org/project/yahoo-finance/
3
http:https://pypi.org/project/alpha-vantage/
5Figure 1: Block diagram of the procedure designed to collect and prepare Tweet component of the COVID19 PRIMO.
localized API to address the aforementioned issues. The localized API uses Twitter search engine
and directly collects the required dataset from Twitter. We set up our data collection platform based
on scraping the twitter website. The twitter web scraping returns the Tweet text content with a
range of useful attributes, for example, T weet − ID, Tweet Created at, Retweet, Text, Favorite
Count, Hashtag Text, User ID, Followers Count, Friends Count, Statuses Count, User Created at,
and Location. To collect informative public Tweets, we added a constraint to our implementation
to collect tweets retweeted more than once. Many other unnecessary attributes regarding a tweet
were also removed from the data gathering session to focus on the essential information such as
date, tweet text, and number of retweets. Fig. 2 illustrates an illustrative example of raw tweets
collected by web scraping.
A critical challenge is scraping the raw content of Twitter data. Such a process takes exten-
sive time and needs manual and cumbersome pre-processing procedures. We retrieved Dow Jones
and COV ID − 19 tweets by querying symbols $DJI, #DOW , Covid19, #Covid19, #Covid − 19
and CoronaV irus. Additionally, the corresponding data associated with historical prices are col-
lected. The constructed dataset includes related tweets from 01/01/2016 to 30/07/2020 for the
Dow Jones stock index. Not every day is considered as a trading day, i.e., weekends and holidays
are not among the trading dates and ought to be out of the analysis scope. To better organize
and use the input, we subtract the number of days in a year from the number of weekends, the
6Figure 2: Illustrative raw Tweets samples in the COVID19 PRIMO datatest before the pre-processing step.
number of half trading days, and the number of market holidays. More specifically, our dataframe
is created by combining historical prices and Tweet corpora and matching them to the trading
days. Consequently, we considered 1, 152 trading days from January 2016 to July 2020 to build our
dataset. The COVID19 PRIMO dataset is then divided into a training set from January 2016 to
January 2020, and a validation set from January 2020 to February 2020. Data from 01/03/2020 to
30/07/2020 is kept to be used for test purposes.
2.1. Data Visualization
In this sub-section, we visualize the existing relations between different parameters of the
COVID19 PRIMO dataste, particularly that of COVID-19 tweets with other parameters. As stated
above, the introduced dataset is constructed based on the Dow Jones stock market index and its
associated Twitter messages for the period of 01/01/2016 to 30/07/2020. The COVID-19 pandemic
crisis covers a fraction of the data represented in the COVID19 PRIMO dataset but plays an essen-
tial role in predicting the pandemic’s effects on the stock market movements. The COVID-19 related
tweets appeared in 2020 (from February to July), specifically starting to show up from the end of
February. The dates containing the COVID-19 are stamped with True, making it possible to con-
sider its distribution in the whole frame. Fig. 3 visualizes different aspects of the COVID19 PRIMO
dataset and illustrates relation of COVID-19 with other parameters of the dataset. Violin plot is
shown in Fig. 3(a), where the distribution of COVID-19 tweets and the market movements are
illustrated. As shown in Fig. 3(b), the COVID-19 tweets are less than 200 days, which is expected
7(a) (b)
(c)
Figure 3: (a) The Distribution of The COVID-19 Tweets and Target. (b) The Number of COVID-19 Tweets. (c)
Correlation matrix between different variables.
given the recent emergence of the pandemic. Fig. 3(c) shows the correlation between several dif-
ferent variables affecting the COVID19 PRIMO dataset. Market prices, including Adjusted close
price (Adj. Close); Open price (Open); High price (High); Low price (Low); calculated target (Tar-
get), and; Presence of COVID-19 in tweets are depicted in this figure. For example, the correlation
between normalized adjusted close price and normalized high price is 0.83. Finally, Fig. 4 is a grid
of scatter plot used to visualize bivariate relationships between combinations of variables. Fig. 4
is included to have a big picture of the distribution of the data and better understand existing
relations between different parameters in the dataset. Fig. 4 shows the relationship for a different
combination of variables in a DataFrame as a matrix of plots. The orange dots, show the COVID-
819 related data in the dataset, while the blue dots, represent the lack of COVID-19 related data.
Fig. 4 can potentially depict the bivariate relationships between different market price data and
COVID-19 together with the relation between the Target recognized in this period of time with
the pandemic data.
Figure 4: Grid of scatter plots. The orange dots show COVID-19 related data points, while the blue dots represent
lack of COVID-19 related data.
9Figure 5: The proposed COVID19-HPSMP framework.
3. Proposed COVID19-HPSMP Framework
In this section, we describe the constituent components used in the development of the proposed
COVID19-HPSMP framework. As stated previously, the main architecture of the COVID19-HPSMP
is developed based on DNNs. The prominent advantage of DNNs is their ability to extract meaning-
ful patterns from raw data through multiple non-linear transformations and approximation of com-
plex non-linear functions (Al-Dulaimi et al., 2019). More specifically, the proposed COVID19-HPSMP
is a data-driven (deep learning model) designed based on hybrid or multiple-model strategies. The
COVID19-HPSMP framework extracts and interprets the available news corpus via temporal at-
tention modeling based two key principles, i.e., “Diverse Influence” and “Sequential Context De-
pendency”. To achieve these objectives, the COVID19-HPSMP is designed as a hybrid multi-modal
fusion framework that integrates information obtained from stock market historical data and so-
cial media (Twitter data). The proposed hybrid framework consists of three paths, two parallel
paths, i.e., the CNN Local/Glocal path, and; the CNN-LSTM path, together with a fusion path.
Fig. 5 illustrates the overall structure of the proposed framework. The fusion path composed of
fully connected layers that combine extracted features from each of the two parallel paths. Each
of the two parallel paths within the COVID19-HPSMP framework are constructed based on the
following two main components:
(i) Word Embedding Module: This module is used to calculate embedded vectors for Twitter
data. For this purpose, Glove (Pennington et al., 2014), as a pre-trained unsupervised model,
is used within the word embedding module of each of the two parallel paths within the
proposed COVID19-HPSMP framework.
10Figure 6: The CNN Local/Global path of the COVID19-HPSMP framework.
(ii) Attention Module: The main objective of this module is to extract specific words with highest
attention weight. The COVID19-HPSMP is a hybrid model where each of the two parallel
paths (i.e., the CNN Local/Glocal path, and; the CNN-LSTM path) is a unique attention
module extracting different related features. The rationale behind such a hybrid and parallel
structure is the significance of the attention network and the intuition that extracting different
attention-related features would improve the overall performance of the model.
In what follows, we present each of the three constituent paths of the proposed COVID19-HPSMP
framework.
3.1. The CNN Local/Global Path
The first parallel path of the proposed COVID19-HPSMP framework is a CNN-based lo-
cal/global attention model designed to capture and extract spatial features from the input data.
11More specifically, the CNN-based path consists of Local and Global attention layers, which are
described in details below.
3.1.1. Local Attention Layer (LAL)
Intuitively speaking, a word embedding model produces representations for each word in the
Twitter corpus. Let us denote the lth Tweet among the available set of NT Tweets with T (l) ,
(l)
for (1 ≤ l ≤ NT ). Furthermore, consider that Tweet T (l) contains NW number of words. The
embedding can be thought of as a linear operator (function) that takes as an input a one-hot
(l) (l)
vector ei ∈ RNW corresponding to the ith word of Tweet T (l) , for (1 ≤ i ≤ NW ). Note that,
here NW denotes the number of words in the overall vocabulary. The embedding then maps the
(l) (l) (l)
one-hot vector into a dense feature vector xi = [xi,1 , . . . , xi,NF ]T ∈ RNF , which consists of NF
(l)
scalar features for the ith word of the lth Tweet within the Twitter corpus. The feature vector xi
is obtained based on a trainable weighting matrix (to be learned) of the embedding layer as follows
(l) (l)
xi = W (Emb) ei . (1)
The embedding layer’s output together with price values are provided as a concatenated input to
the Local Attention Layer (LAL). The LAL focuses on the words, which are more informative within
(l)
a localized window. More specifically, let the lth Tweet be represented by NW word embedding as
(l) (l) (l) (l)
(x1 , . . . , xm , . . . , x (l) ), where xm is the middle (center) word within the embedding sequence of
NW
the lth Tweet. Local attention process is achieved via a sliding window of length W rolling over the
(l)
word embedding sequence of T (l) . Attention score si for the ith word of T (l) is computed based on
(l,LA) (l)
an attention weighting score Wi ∈ RW ×NF , for (1 ≤ i ≤ NW ), and its associated bias vector
(l,LA)
bi as follows
(l,LA) (l,LA) (l,LA) (l,LA)
si = σ Xi ◦ Wi + bi , (2)
where ◦ denotes the Hadamard product (element-wise multiplication), σ· is the sigmoid activation
function, and
(l,LA) (l) (l) (l)
Xi , xm+ −W +1 , . . . xi , . . . xm+ W +1 ]T , (3)
2 2
(l)
where superscript T denotes transpose operator. The attention score si is used as a weight for
(l,LA) (l,LA) (l)
the words to form localized word embedding as follows x̂i = si xi . A higher attention
12score can be interpreted as higher importance associated with that specific word than the others.
The weighted sequences then go through a Convolutional layer with a kernel size of 15, which is
designed to avoid overfitting. A Max-Pooling layer is then implemented after the convolution one
to creates position invariance over larger local regions and down-sample the input. Addition of the
Max-Pooling layer also leads to a faster convergence rate by selecting superior invariant features,
which in turn improves generalization performance.
3.1.2. Global Attention Layer (GAL)
The output of the LAL is the provided as input to a Global Attention layer (GAL). This scoring
process of the GAL is similar in nature to that of the LAL (Eqs. (2)-(3)). However, the attention
(l,GA)
score, now denoted by si , is computed through the entire input, i.e.,
(l,GA) (l,GA) (l,GA)
si = σ X (l,GA) ◦ Wi + bi , (4)
(l,GA) (l)
where Wi ∈ RNW ×NF , and
T
X (G,Att) , x1 , . . . , xN (l) .
(5)
W
By applying global attention, the effect of uninformative words will be diminished, and the global
semantic meaning will be captured more precisely through the CNN path. This completes de-
scription of the CNN Local/Global path of the proposed COVID19-HPSMPf ramework. Next, we
present the CNN-BLSTM path.
3.2. CNN-LSTM Attention based Model
The second parallel path of the proposed COVID19-HPSMP is a hybrid CNN and BLSTM
attention model, referred to as the CNN-BLSTM path. Similar to the CNN Local/Global path,
in the first step, the Twitter messages are provided as input to a “Word Embedding layer”. As
stated previously, a pre-trained unsupervised Glove model (Pennington et al., 2014) is used as
the word embedding layer within the COVID19-HPSMP framework. Afterwards, the corpus and
prices are encoded by a CNN layer to extract general contextual features. An attention layer is
assigned across all the vectors to calculate the weighted corpus. At the next step, a second CNN
layer is implemented to capture and learn more fine-tuned features. The first CNN layer has 50
number of filters with a window size of 25. The second CNN layer has 100 filters with a window
13Figure 7: The CNN-LSTM path of the COVID19-HPSMP framework.
size of 25. The first Attention layer is used to capture essential and unique features to provide
insight into the vector of the data including tweets and prices. The second Attention layer acts
on each vector and calculates the weighted mean of these encoded corpus vectors to represent the
overall sequential context information. A global Max-Pooling layer is then applied to capture the
essential features and reduce the framework’s complexity. Global Max-Pooling is similar to the
regular version but with pool size equals to the size of the input. At the next stage, an attention-
based BLSTM layer is designed to remember what has previously learned to better understand the
input. The attention-based BLSTM layer is described next.
3.2.1. Attention-based Bidirectional LSTM:
To encode temporal information based on the available set of news corpus and financial time-
series data, BLSTM is incorporated within the COVID19-HPSMP hybrid framework. Learning
based on financial time-series data is a sequence learning task for which BLSTMs are considered as
the state-of-the-art DNN architectures. The LSTM architecture is initially developed by Hochreiter
and Schmidhuber (Hochreiter & Schmidhuber, 1997) to address the vanishing and exploding gra-
dient problem of conventional Recurrent Neural Networks (RNNs). Since then, LSTM models have
gained significant popularity owing to their extensions, advancements and successful applications
in different domains. Generally speaking, LSTM is a memory-based architecture that uses different
gating functions and a memory state to manage process if information through time (Di et al.,
142018). LSTM works based on the following update model at each time step (denoted by t)
it = σ(Wi xt + Ui ht−1 + bi ) (6)
ft = σ(Wf xt + Uf ht−1 + bf ) (7)
gt = tanh(Wc xt + Uc ht−1 + bc ) (8)
ct = ft ◦ ct−1 + it gt (9)
ot = σ(Wo xt + Uo ht−1 + bo ) (10)
ht = ot ◦ tanh(ct ) (11)
where Wi , Wo , Wf , Wc , and Ui , Uo , Uf , Uc are weight matrices; Terms bi , bo , bf , bc are bias
vectors, and; tan(·) represents element-wise hyperbolic tangent activation function. Furthermore,
ht and ht−1 represent the current and previous hidden states, respectively. In the context of the
proposed COVID19-HPSMP and to encode the temporal layer, we adopt Bidirectional version of
the LSTM (BDLSTM) to feed the ith word embedding. BLSTM can access both the preceding
and succeeding contexts. It separates the hidden layer into two parts, forward state sequence and
backward state sequence based on an iterative process.
3.3. Fusion Path
The final component of the proposed COVID19-HPSMP framework is the Fusion Path with
three fully connected layers for fusing features extracted from each of the two underlying parallel
paths and performing the final price movement prediction task. The first fusion layer has 100
number of neurons and uses “tan” activation function, while the second fusion layer has 50 number
of neurons with the same activation function. The final layer of the Fusion Path, has 1 neuron
and uses Rectified Linear Unit (ReLU) as its activation function to produce the price movement
predictions. The input to the Fusion Path is constructed by concatenating the output of the CNN
Local/Global path, which is a flattened 1-Dimensional feature vector, with that of the CNN-BLSTM
path.
4. Experiments
Experimental results and comparisons are presented in this section to evaluate the proposed
hybrid COVID19-HPSMP framework for the task of stock movement prediction. As stated previ-
ously, the problem at hand is a classification one with the following expected outputs: (i) On one
15Table 1: Accuracy comparisons.
Model Variations Accuracy
The COVID19-HPSMP Framework 66.48
Standalone CNN Local/Global Model 64.65
Standalone CNN-LSTM Model 62.06
hand, within a 5 days prediction horizon, if the adjusted stock price of a specific day is more than
that of the previous day, the output of that specific day would be 1. Then, the sum of the output
values is computed over the 5 days horizon and if the sum is greater than a pre-defined threshold
of 3, we consider the final output for that 5 day horizon to be 1, denoting a rise, and; (ii) On the
other hand, when the adjusted stock price associated with a specific day is less than its previous
day, value 0 is assigned as the output of that specific day. When the number of such 0 output
values within the 5 days window is more than 3, we consider the final output to be 0, representing
the fall prediction/state.
4.1. COVID19-HPSMP LSTM-based hybrid attention Model
To perform the evaluations, the available Twitter news corpora is tokenized and words occurring
less than 5 times are removed to construct the vocabulary. It is worth noting that removing words
with limited usage will reduce the associated memory cost of the DNN models. As stated above,
we consider a five day horizon and used a batch size of 64 within 15 epoch. In addition, Glove,
which is an unsupervised word embedding algorithm, is used within the embedding modules of the
two parallel paths of the COVID19-HPSMP. For comparison purposes, three different models are
implemented as follows:
(ii) The proposed COVID19-HPSMP Framework : The proposed hybrid COVID19-HPSMP frame-
work developed in Section 3 is the first implemented stock movement prediction model. The
COVID19-HPSMP consists of 2 parallel paths and a fusion path integrating extracted fea-
tures of each of the two parallel paths.
(ii) Stand-Alone CNN Local/Global Model : The second implemented movement prediction model
is the CNN Local/Global path implemented independently (stand alone as a single model). To
implement the stand alone version of the CNN Global/Local model, initialization is performed
16following the guideline provided in Reference (Seo et al., 2017). A pre-trained Glove (Pen-
nington et al., 2014) is used for weighting corpus within the word embedding layer. In the
LAL, we use window of size 5 with a sigmoid function (σ). Total of 80 filters are implemented
within the LAL. In the GAL, we used 50 filters of length 2 and 3. Finally, a fully connected
layer with 0.5 dropout is designed to form the output.
(iii) Stand-Alone CNN-BLSTM Model : The third implemented movement prediction model is the
CNN-BLSTM path implemented independently as a single model. Similar to the stand-alone
CNN Global/Local model, a pre-trained Glove (Pennington et al., 2014) is used for weighting
corpus within the embedding layer. A convolutional layer with a 64 number of filters and a
window size of 25 is followed by an attention layer. To extract essential features and reduce
the framework’s complexity, a max-pooling layer is designed. The output of max-pooling
layer is the input of next layer which is attention-based Bidirectional LSTM with 250 hidden
layers. Finally, two fully connected layers are considered with 300 and 1 number of hidden
neurons, respectively, to form the price movement prediction results.
These three implemented models are trained with Adam optimizer (Kingma & Ba, 2014) with a
learning rate of 0.001. To reduce the training times of the implemented models, Batch Normaliza-
tion (Ioffe & Szegedy, 2015) is utilized to normalize the underlying layers. Furthermore, to avoid
overfitting issues and improve the overall robustness of the implementations, 0.5 dropout is used
within the fully connected layers. Finally, the computational graphs of the implemented models
are constructed via Tensorflow (Abadi & et al., 2016) to fine tune different hyper-parameters.
4.2. Performance Evaluation/Results
In this sub-section, we represent different experimental results to evaluate the performance of
the proposed COVID19-HPSMP framework for the stock movement prediction. The accuracy of the
proposed models areas follows: 64.65% for the stand-alone CNN-based local/global; 62.06% for the
stand-alone CNN-LSTM, and 66.48% for the hybrid attention model, i.e., the COVID19-HPSMP
framework. The accuracy of all three implemented models are shown in Fig. 8(a). The accuracy is a
fraction of correct predictions to the total number of predictions. The loss function associated with
the evaluated models is illustrated Fig. 8(b). Loss function demonstrates the distinction between
the output of the model and the target value in order to show the probability of misclassification.
17(a) (b)
Figure 8: (a) Accuracy of the Models. (b) Loss of the Models.
Figure 9: Accuracy and loss contrast of the different price movement prediction models.
We demonstrate the performance of the baseline models in Table 1 comparing performance of
the three implemented models. As it can be observed, the hybrid model (the COVID19-HPSMP)
outperforms its counterparts. It is worth mentioning that the achieved accuracy of 66.48% is
significant, although in absolute terms it seems to be low. First, please note that average accuracies
18achieved in the literature for the task of price movement prediction is around 50%. Second, these
lower accuracies are obtained based on a much wider window of information compared to the
limited duration of the introduced COVID19 PRIMO dataset. The limited duration of the dataset
is due to recent emergence of the COVID-19 pandemic.
5. Conclusion
Motivated by abrupt, sudden, and negative effects of COVID-19 pandemic on stock markets,
first, the paper introduced a unique COVID-19 related PRIce MOvement prediction (COVID19 PRIMO)
dataset. The constructed dataset incorporates effects of social media trends related to COVID-19
on stock market price movements. Based on the constructed COVID19 PRIMO dataset, the pa-
per then proposed a novel data-driven (DNN-based) COVID-19 adopted Hybrid and Parallel deep
fusion framework for Stock price Movement Prediction (COVID19-HPSMP). The proposed frame-
work uses information fusion to combine COVID-19 related Twitter data with extended horizon
market historical data. More specifically, in contrary to the existing data-driven stock price move-
ment prediction models, where a single DNN model is used, the COVID19-HPSMP framework is
a hybrid model consisting of two parallel paths (i.e., the CNN Local/Glocal path, and; the CNN-
LSTM path) and a fusion path that combines localized features. Each of the two parallel paths is a
unique attention module extracting different attention related features. The rationale behind such
a hybrid and parallel structure is the significance of the attention network and the intuition that
extracting different attention-related features would improve the overall performance of the model.
The proposed COVID19-HPSMP architecture can predict the stock price movements during the
pandemic crisis to forecast sudden sharp movements (fall or rise) in the stock market. Based on the
results of the COVID19-HPSMP architecture, we can predict the stock market’s fluctuations with
more than 66% accuracy, which will hopefully be a metric to be more prepared for the unexpected
havocs.
References
Abadi, M., & et al. (2016). Tensorflow: Large-scale machine learning on heterogeneous distributed systems.
ArXiv:1603.04467.
Al-Awadhi, A., Alsaifi, K., Al-Awadhi, A., & Alhammadi, S. (2020). Death and contagious infectious diseases: Impact
of the covid-19 virus on stock market returns. Journal of Behavioral and Experimental Finance.
19Al-Dulaimi, A., Zabihi, S., Asif, A., & Mohammadi, A. (2019). A multimodal and hybrid deep neural network model
for remaining useful life estimation. Computers in Industry, 108 , 186–196.
Anik, M., Arefin, M., & Dewan, M. (2019). An intelligent technique for stock market prediction. International Joint
Conference on Computational Intelligence. Algorithms for Intelligent Systems.
Baek, S., Mohanty, S., & Glambosky, M. (2020). Covid-19 and stock market volatility: An industry level analysis.
Finance Research Letters.
Bollen, J., & H. Mao, H. (2011). Twitter mood as a stock market predictor. Computer , 44 , 91–94.
Bustos, O., & Pomares-Quimbaya, A. (2020). Stock market movement forecast: A systematic review. Expert Systems
with Applications, 156 .
Chong, E., Han, C., & Park, F. (2019). Deep learning networks for stock market analysis and prediction: Methodology,
data representations, and case studies. Expert Systems with Applications, 83 .
Clement, J. (2020). Number of monetizable daily active twitter users (mdau) worldwide from 1st quarter 2017 to 1st
quarter 2020. Https://www.statista.com/statistics/970920/monetizable-daily-active-twitter-users-worldwide/.
Di, W., Bhardwaj, A., & Wei, J. (2018). Deep Learning Essentials: your Hands-on Guide to the Fundamentals of
Deep Learning and Neural Network Modeling. Packt Publishing - ebooks Account.
Edwards, R., Bassetti, W., & Magee, J. (2007). Technical Analysis of Stock Trends. CRC Press.
Fama, E. (1998). Market efficiency, long-term returns, and behavioral finance. Journal of Financial Economics, (pp.
283–306).
Frankel, J. (1995). Financial Markets And Monetary Policy. MIT Press.
Hochreiter, S., & Schmidhuber, J. (1997). Long short-term memory. Neural Computation, 9 , 1735–1780.
Hoseinzade, E., & Haratizadeh, S. (2019). Cnnpred: Cnn-based stock market prediction using a diverse set of
variables. Expert Systems with Applications, 129 .
Hu, Z., Liu, W., Bian, J., & Liu, X. (2019). Listening to chaotic whispers: A deep learning framework for news-oriented
stock trend prediction. ACM International Conference on Web Search and Data Mining.
Huang, J., & Li, J. (2020). Using social media mining technology to improve stock price forecast accuracy. Journal
of Forcasting, (pp. 104–116).
Ioffe, S., & Szegedy, C. (2015). Batch normalization: Accelerating deep network training by reducing internal covariate
shift. ArXiv:1502.03167.
Jiang, W. (2020). Applications of deep learning in stock market prediction: Recent progress. ArXiv:2003.01859.
Kingma, D., & Ba, J. (2014). Adam: A method for stochastic optimization. ArXiv:1412.6980.
Koshiyama, S., Firoozye, N., & Treleaven, P. (2020). Algorithms in future capital markets. SSRN .
Li, X., Xie, H., Chen, L., Wang, J., & Deng, X. (2014). News impact on stock price return via sentiment analysis.
Knowledge-Based Systems, 69 , 14–23.
Luss, R., & D’Aspremont, A. (2015). Predicting abnormal returns from news using text classification. Quantitative
Finance, 15 , 999–1012.
Mazur, M., Dang, M., & Vega, M. (2020). Covid-19 and the march 2020 stock market crash. evidence from s&p1500.
Finance Research Letters.
Mohammadi, A., Zhang, X., & Plataniotis, K. (2017). Interactive gaussian-sum filtering for estimating systematic
20risk in financial econometrics. IEEE Global Conference on Signal and Information Processing (GlobalSIP), (pp.
903–907).
Pennington, J., Socher, R., & Manning, C. (2014). Glove: Glove vector of word representation. Empirical Methods
in Natural Language Processing (EMNLP).
Radojicic, D., & Kredatus, S. (2020). The impact of stock market price fourier transform analysis on the gated
recurrent unit classifier model. Expert Systems with Applications, 159 .
Rekabsaz, N., & et al. (2017). Volatility prediction using financial disclosures sentiments with word embedding-based
ir models. Association for Computational Linguistics, (pp. 1712–1721).
Rezaei, H., Faaljou, H., & Mansourfar, G. (2020). Stock price prediction using deep learning and frequency decom-
position. Expert Systems with Applications.
Ronaghi, F., Salimibeni, M., Naderkhani, F., & Mohammadi, A. (2020). Covid19 primo dataset.
https://github.com/MSBeni/COVID19 PRIMO#COVID19-PRIMO.
Ronaghi, F., Salimibeni, M., Naderkhani, F., & Mohammadi, A. (2017). Ndsmpf: A noisy deep neural network
fusion framework for stock price movement prediction. IEEE International Conference on Information Fusion
(FUSION), (pp. 1–7).
Saleh Ahmar, A., & Boj del Val, E. (2020). Suttearima: Short-term forecasting method, a case: Covid-19 and stock
market in spain. Science of the Total Environment.
Schumaker, R., & Chen, H. (2009). Textual analysis of stock market prediction using breaking financial news: The
azfin text system. ACM Transactions on Information Systems.
Seo, S., Huang, J., Yang, H., & Liu, Y. (2017). Interpretable convolutional neural networks with dual local and
global attention for review rating prediction. Proceedings of the Recsys, (pp. 297–305).
Seong, N., & Nam, K. (2021). Predicting stock movements based on financial news with segmentation. Expert
Systems with Applications, 64 .
Tetlock, P. (2007). Giving content to investor sentiment: The role of media in the stock market. Journal of Finance,
62 , 1139–1168.
Xie, B., Passonneau, R., Wu, L., & Creamer, G. (2013). Semantic frames to predict stock price movement. Association
for Computational Linguistics, (pp. 873–883).
Yun, H., Sim, G., & Seok, J. (2019). Stock prices prediction using the title of newspaper articles with korean nat-
ural language processing. International Conference on Artificial Intelligence in Information and Communication
(ICAIIC), (pp. 019–021).
Zhang, Y., Chu, G., & Shen, D. (2020). The role of investor attention in predicting stock prices: The long short-term
memory networks perspective. Finance Research Letters.
21You can also read