Euro-Par 2019: Parallel Processing - Ramin Yahyapour (Ed.) 25th International Conference on Parallel and Distributed Computing Göttingen, Germany ...
←
→
Page content transcription
If your browser does not render page correctly, please read the page content below
ARCoSS
LNCS 11725   Ramin Yahyapour (Ed.)

             Euro-Par 2019:
             Parallel Processing
             25th International Conference
             on Parallel and Distributed Computing
             Göttingen, Germany, August 26–30, 2019
             Proceedings

             123
Lecture Notes in Computer Science                                11725
Commenced Publication in 1973
Founding and Former Series Editors:
Gerhard Goos, Juris Hartmanis, and Jan van Leeuwen

Editorial Board Members
David Hutchison, UK                   Takeo Kanade, USA
Josef Kittler, UK                     Jon M. Kleinberg, USA
Friedemann Mattern, Switzerland       John C. Mitchell, USA
Moni Naor, Israel                     C. Pandu Rangan, India
Bernhard Steffen, Germany             Demetri Terzopoulos, USA
Doug Tygar, USA

Advanced Research in Computing and Software Science
Subline of Lecture Notes in Computer Science

Subline Series Editors
Giorgio Ausiello, University of Rome ‘La Sapienza’, Italy
Vladimiro Sassone, University of Southampton, UK

Subline Advisory Board
Susanne Albers, TU Munich, Germany
Benjamin C. Pierce, University of Pennsylvania, USA
Bernhard Steffen, University of Dortmund, Germany
Deng Xiaotie, Peking University, Beijing, China
Jeannette M. Wing, Microsoft Research, Redmond, WA, USA

                             ozalp.babaoglu@unibo.it
Online Fault Classification in HPC
Systems Through Machine Learning
Alessio Netti1,2(B) , Zeynep Kiziltan1 , Ozalp Babaoglu1 , Alina Sˆırbu3 ,
Andrea Bartolini4 , and Andrea Borghesi4
1
Department of Computer Science and Engineering, University of Bologna,
Bologna, Italy
{alessio.netti,zeynep.kiziltan,ozalp.babaoglu}@unibo.it
2
Leibniz Supercomputing Centre, Garching bei München, Germany
alessio.netti@lrz.de
3
Department of Computer Science, University of Pisa, Pisa, Italy
alina.sirbu@unipi.it
4
Department of Electrical, Electronic and Information Engineering,
University of Bologna, Bologna, Italy
{a.bartolini,andrea.borghesi3}@unibo.it
Abstract. As High-Performance Computing (HPC) systems strive
towards the exascale goal, studies suggest that they will experience exces-
sive failure rates. For this reason, detecting and classifying faults in HPC
systems as they occur and initiating corrective actions before they can
transform into failures will be essential for continued operation. In this
paper, we propose a fault classification method for HPC systems based
on machine learning that has been designed specifically to operate with
live streamed data. We cast the problem and its solution within realistic
operating constraints of online use. Our results show that almost perfect
classification accuracy can be reached for different fault types with low
computational overhead and minimal delay. We have based our study on
a local dataset, which we make publicly available, that was acquired by
injecting faults to an in-house experimental HPC system.
Keywords: High-performance computing · Exascale systems ·
Resiliency · Monitoring · Fault detection · Machine learning
1 Introduction
Motivation. Modern scientific discovery is increasingly being driven by compu-
tation [18]. As such, HPC systems have become fundamental “instruments” for
driving scientific discovery and industrial competitiveness. Exascale (1018 oper-
ations per second) is the moonshot for HPC systems and reaching this goal is
bound to produce significant advances in science and technology. Future HPC
systems will achieve exascale performance through a combination of faster pro-
cessors and massive parallelism. With Moore’s Law reaching its limit, the only
⃝c Springer Nature Switzerland AG 2019
R. Yahyapour (Ed.): Euro-Par 2019, LNCS 11725, pp. 3–16, 2019.
https://doi.org/10.1007/978-3-030-29400-7_1
ozalp.babaoglu@unibo.it4 A. Netti et al.
viable path towards higher performance has to consider switching from increased
transistor density towards increased core count, thus leading to increased fail-
ure rates [6]. Exascale HPC systems not only will have many more cores, they
will also use advanced low-voltage technologies that are more prone to aging
effects [4] together with system-level performance and power modulation tech-
niques, all of which tend to increase fault rates [8]. It is estimated that large
parallel jobs will encounter a wide range of failures as frequently as once every
30 min on exascale platforms [16]. Consequently, exascale performance, although
achieved nominally, cannot be sustained for the duration of applications running
for long periods.
In the rest of the paper, we adopt the following terminology. A fault is defined
as an anomalous behavior at the hardware or software level that can lead to ille-
gal system states (errors) and, in the worst case, to service interruptions (fail-
ures) [10]. Future exascale HPC systems must include automated mechanisms
for masking faults, or recovering from them, so that computations can continue
with minimal disruptions. This in turn requires detecting and classifying faults
as soon as possible since they are the root causes of errors and failures.
Contributions. We propose and evaluate a fault classification method based on
supervised Machine Learning (ML) suitable for online deployment in HPC sys-
tems. Our approach relies on a collection of performance metrics that are readily
available in most HPC systems. The experimental results show that our method
can classify almost perfectly several types of faults, ranging from hardware mal-
functions to software issues and bugs. Furthermore, classification can be achieved
with little computational overhead and with minimal delay, thus meeting real
time requirements. We characterize the performance of our method in a realistic
context similar to online use, where live streamed data is fed to fault classifiers
both for training and for detection, dealing with issues such as class imbalance
and ambiguous states. Most existing studies, on the contrary, rely on extensive
manipulation of data, which is not feasible in online scenarios. Moreover, we
reproduce the occurrence of faults basing on real failure traces.
Our evaluation is based on a dataset that we acquired from an experimental
HPC system (called Antarex) where we injected faults using FINJ, a tool we pre-
viously developed [15]. Making the Antarex dataset publicly available is another
contribution of this paper. Acquiring our own dataset for this study was made
necessary by the fact that commercial HPC system operators are very reluctant
to share trace data containing information about faults in their systems [13].
Related Work. Automated fault detection through system performance metrics
and fault injection has been the subject of numerous studies. However, ML-
based methods using fine-grained monitored data (i.e., sampling once per second)
are more recent. Tuncer et al. [17] propose a framework for the diagnosis of
performance anomalies in HPC systems; however, they do not deal with faults
that lead to errors and failures, which cause a disruption in the computation, but
only with performance anomalies that result in longer runtimes for applications.
Moreover, the data used to build the test dataset was not acquired continuously,
ozalp.babaoglu@unibo.itOnline Fault Classification in HPC Systems Through Machine Learning 5
but rather in small chunks related to single application runs. Thus it is not
possible to determine the feasibility of this method when dealing with streamed,
continuous data from an online HPC system. A similar work is proposed by
Baseman et al. [2], which focuses on identifying faults in HPC systems through
temperature sensors. Ferreira et al. [9] analyze the impact of CPU interference
on HPC applications by using a kernel-level noise injection framework. Both
works deal with specific fault types, and are therefore limited in scope.
Other authors have focused on using coarser-grained data (i.e., sampling once
per minute) or on reducing the dimension of collected data, while retaining good
detection accuracy. Bodik et al. [5] aggregate monitored data by using finger-
prints, which are built from quantiles corresponding to different time epochs. Lan
et al. [14] discuss an outlier detection framework based on principal component
analysis. Guan et al. [11,12] propose works focused on finding the correlations
between performance metrics and fault types through a most relevant princi-
pal components method. Wang et al. [19] propose a similar entropy-based out-
lier detection framework suitable for use in online systems. These frameworks,
which are very similar to threshold-based methods, are not suitable for detecting
the complex relationships that may exist between different performance metrics
under certain faults. One notable work in threshold-based fault detection is the
one proposed by Cohen et al. [7], in which probabilistic models are used to esti-
mate threshold values for performance metrics and detect outliers. This approach
requires constant human intervention to tune thresholds, and lacks flexibility.
Organization. This paper is organized as follows. In Sect. 2, we describe the
Antarex dataset, and in Sect. 3, we discuss the features extracted from it. In
Sect. 4, we present our experimental results, and we conclude in Sect. 5.
2 The Antarex Dataset
The Antarex dataset contains trace data collected from an HPC system located
at ETH Zurich while it was subjected to fault injections. The dataset is pub-
licly available for use by the community and all the details regarding the test
environment, as well as the employed applications and faults are extensively
documented.1 Due to space limitations, here we only give a short overview.
2.1 Dataset Overview
In order to acquire data, we executed benchmark applications and at the same
time injected faults in a single compute node in the HPC system. The dataset
is divided into two parts: the first includes only the CPU and memory-related
benchmark applications and fault programs, while the second is strictly hard
drive-related. We executed each part in both single-core and multi-core settings,
resulting in 4 blocks of nearly 20GB and 32 days of data in total. The dataset’s
1
Antarex Dataset: https://zenodo.org/record/2553224.
ozalp.babaoglu@unibo.it6 A. Netti et al.
Table 1. A summary of the structure for the Antarex dataset.
Dataset Type Parallel Duration Benchmark Fault programs
block programs
Block I CPU-Mem No 12 days DGEMM, HPCC, leak, memeater, ddot,
STREAM, HPLa dial, cpufreq, pagefail
Block III Yes
Block II Hard Drive No 4 days IOZone, Bonnie++b ioerr, copy
Block IV Yes
a DGEMM: https://lanl.gov/projects/crossroads/, HPCC: https://icl.cs.utk.edu/hpcc/,
STREAM: https://www.cs.virginia.edu/stream/, HPL: https://software.intel.com/en-us/
articles/intel-mkl-benchmarks-suite
b IOZone: https://iozone.org, Bonnie++: https://coker.com.au/bonnie++/
structure is summarized in Table 1. We acquired the data by continuous stream-
ing, thus any study based on it will easily be reproducible on a real HPC system,
in an online way.
2.2 Experimental Setup for Data Acquisition
The Antarex compute node used for data acquisition is equipped with two Intel
Xeon E5-2630 v3 CPUs, 128 GB of RAM, a Seagate ST1000NM0055-1V4 1TB
hard drive and runs the CentOS 7.3 operating system. The node has a default
Tier-1 computing system configuration. The FINJ tool [15] was used to exe-
cute benchmark applications and to inject faults, in a Python 3.4 environment.
To collect performance metrics, we used the Lightweight Distributed Metric
Service (LDMS) framework [1]. We configured LDMS to sample a variety of
metrics at each second, which come from the meminfo, perfevent, procinter-
rupts, procdiskstats, procsensors, procstat and vmstat plugins. This configuration
resulted in a total of 2094 metrics collected each second. Some of the metrics
are node-level, and describe the status of the node as a whole, others instead are
core-specific and describe the status of one of the 16 available CPU cores.
2.3 Features of the Dataset
FINJ orchestrates the execution of benchmark applications and the injection of
faults by means of a workload file, which contains a list of benchmark and fault-
triggering tasks to be executed at certain times, on certain cores, for certain
durations. For this purpose, we used several FINJ-generated workload files, one
for each block of the dataset. The details regarding the internal mechanisms
driving FINJ are discussed in the associated work by Netti et al. [15].
Workload Files. We used two statistical distributions in the FINJ workload
generator to create the durations and inter-arrival times of the benchmark and
fault-triggering tasks. The benchmark tasks are characterized by duration and
inter-arrival times following normal distributions, and 75% of the dataset’s dura-
tion is spent running benchmarks. Fault-triggering tasks on the other hand are
ozalp.babaoglu@unibo.itOnline Fault Classification in HPC Systems Through Machine Learning 7
(a) Histogram of fault durations. (b) Histogram of fault inter-arrival times.
Fig. 1. Histograms for fault durations (a) and fault inter-arrival times (b) in the
Antarex dataset compared to the PDFs of the Grid5000 data, as fitted on a Johnson
SU and Exponentiated Weibull distribution respectively. We define the inter-arrival
time as the interval between the start of two consecutive tasks.
modeled using distributions fitted on the Grid5000 host failure trace available on
the Failure Trace Archive.2 In Fig. 1, we show the histograms for the durations
(a) and inter-arrival times (b) of the fault tasks in the workload files, together
with the original distributions fitted from the Grid5000 data.
FINJ generates each task in the workload by picking randomly the respective
application to be executed, from those that are available. This implies that,
statistically, all of the benchmark programs we selected will be subject to all of
the available fault-triggering programs, given a sufficiently-long workload, with
different execution overlaps depending on the starting times and durations of
the specific tasks. Such a task distribution greatly mitigates overfitting issues.
Finally, we do not allow fault-triggering program executions to overlap.
Benchmark Applications. We used a series of well-known benchmark applica-
tions, stressing different parts of the node and providing a diverse environment
for fault injection. Since we limit our analysis to a single machine, we use ver-
sions of the benchmarks that rely on shared-memory parallelism, for example
through the OpenMP library. The benchmark applications are listed in Table 1.
Fault Programs. All the fault programs used to reproduce anomalous conditions
on Antarex are available at the FINJ Github repository [15]. As in [17], each
program can also operate in a low-intensity mode, thus doubling the number
of possible fault conditions. While we do not physically damage hardware, we
closely reproduce several reversible hardware issues, such as I/O and memory
allocation errors. Some of the fault programs (ddot and dial ) only affect the
performance of the CPU core they run on, whereas the other faults affect the
entire compute node. The programs and the generated faults are as follows.
2
Failure Trace Archive: http://fta.scem.uws.edu.au/.
ozalp.babaoglu@unibo.it8 A. Netti et al.
1. leak periodically allocates 16 MB arrays that are never released [17] creating
a memory leak, causing memory fragmentation and severe system slowdown;
2. memeater allocates, writes into and expands a 36 MB array [17], decreasing
performance through a memory interference fault and saturating bandwidth;
3. ddot repeatedly calculates the dot product between two equal-size matrices.
The sizes of the matrices change periodically between 0.9, 5 and 10 times
the CPU cache’s size [17]. This produces a CPU and cache interference fault,
resulting in degraded performance of the affected CPU;
4. dial repeatedly performs floating-point operations over random numbers [17],
producing an ALU interference fault, resulting in degraded performance for
applications running on the same core as the program;
5. cpufreq decreases the maximum allowed CPU frequency by 50% through the
Linux Intel P-State driver.3 This simulates a system misconfiguration or fail-
ing CPU fault, resulting in degraded performance;
6. pagefail makes any page allocation request fail with 50% probability.4 This
simulates a system misconfiguration or failing memory fault, causing perfor-
mance degradation and stalling of running applications;
7. ioerr fails one out of 500 hard-drive I/O operations with 20% probability,
simulating a failing hard drive fault, and causing degraded performance for
I/O-bound applications, as well as potential errors;
8. copy repeatedly writes and then reads back a 400 MB file from a hard drive.
After such a cycle, the program sleeps for 2 s [12]. This simulates an I/O
interference or failing hard drive fault by saturating I/O bandwidth, and
results in degraded performance for I/O-bound applications.
3 Creation of Features
In this section, we explain how a set of features describing the state of the system
for classification purposes was obtained from the metrics collected by LDMS.
Post-Processing of Data. Firstly, we removed all constant metrics (e.g., the
amount of total memory in the node), which were redundant, and we replaced the
raw monotonic counters captured by the perfevent and procinterrupts plug-ins
with their first-order derivatives. Furthermore, we created an allocated metric,
both at the CPU core and node level, and integrated it in the original set. This
metric has a binary value, and defines whether there is a benchmark allocated
on the node or not. Using such a metric is reasonable, since in any HPC system
there is always knowledge of which jobs have computational resources currently
allocated to them. Lastly, for each metric above, at each time point, we added
its first-order derivative to the dataset as proposed by Guan et al. [11].
Feature vectors were then created by aggregating the post-processed LDMS
metrics. Each feature vector corresponds to a 60-s aggregation window and is
related to a specific CPU core. The step between feature vectors is of 10 s. This
3
Intel P-State Driver: https://kernel.org/doc/Documentation/cpu-freq.
4
Linux Fault Injection: https://kernel.org/doc/Documentation/fault-injection.
ozalp.babaoglu@unibo.itOnline Fault Classification in HPC Systems Through Machine Learning 9
allows for high granularity and quick response times to faults. For each metric,
we computed several indicators of the distribution of the values measured within
the aggregation window [17]. These are the average, standard deviation, median,
minimum, maximum, skewness, kurtosis, and finally the 5th, 25th, 75th and 95th
percentiles. This results in a total of 22 statistical features, including also those
related to the first-order derivatives, for each metric in the dataset. The final
feature vectors contain thus a total of 3168 elements. This number does not
include the metrics collected by the procinterrupts plugin, which were found to
be irrelevant after preliminary testing. All the scripts used to process the data
are available on the FINJ Github repository [15].
Labeling. In order to train classifiers to distinguish between faulty and normal
states, we labeled the feature vectors either according to the fault program (i.e.,
one of the 8 programs presented in Sect. 2.3) running within the corresponding
aggregation window, or “healthy” if no fault was running. The logs produced
by the FINJ tool, which are included in the Antarex dataset, detail the fault
programs running at each time-stamp. In a generic deployment scenario, if users
wish to perform training using data from spontaneous faults in the system, they
need to provide the labels explicitly instead of relying on fault injection.
A single aggregation window may capture multiple system states, making
labeling not trivial. For example, a feature vector may contain “healthy” time
points that are before and after the start of a fault, or even include two different
fault types. We define these feature vectors as ambiguous. By using a short
aggregation window of 60 s, we aim to minimize the impact of such ambiguous
system states on fault detection. Since these cannot be completely removed, we
experiment with two labelling methods. The first method is mode, where all
the labels that appear in the time window are considered. Their distribution
is examined and the label appearing the most is used for the feature vector.
This leads to robust feature vectors, whose label is always representative of the
aggregated data. The second method is recent, in which the label is given by
the state of the system at the most recent time point in the time window. This
could correspond to a fault type or could be “healthy”. Such an approach may
lead to a more responsive fault detection system, where what is detected is the
system state at the moment, rather than the state over the last 60 s.
Detection System Architecture. For our fault detection system, we adopted an
architecture based on an array of classifiers (Fig. 2). Each classifier corresponds
to a specific computing resource type in the node, such as CPU cores, GPUs,
MICs, etc. Each classifier is then trained with feature vectors related to all
resource units of that type, and is able to perform fault diagnoses for all of
them, thus detecting faults both at node level and resource level (e.g., dial and
ddot). To achieve this, the feature vectors for each classifier contain all node-level
metrics for the system, together with resource-specific metrics for the resource
unit being considered. Since each feature vector contains data from one resource
unit at most, this approach has the benefit of limiting the size of feature vectors,
which improves overhead and detection accuracy. This architecture relies on the
assumption that resource units of the same type behave in the same way, and
ozalp.babaoglu@unibo.it10 A. Netti et al.
Core 0
Resource Core 11
Resource Core 2 Core 3 N
Resource
Classifier
Classifier Classifier
Classifier Classifier Classifier
Classifier
Resource N Data
Resource 0 Data
Resource 1 Data
Node-level Data
Data
LDMS Data Processor
Fig. 2. Architecture of our machine learning-based fault detection system.
that the respective feature vectors can be combined in a coherent set. However,
users can also opt to use separate classifiers for each resource unit of the same
type, overcoming this limitation, without any alteration to the feature vectors
themselves. In our case, the compute node only contains CPU cores. Therefore,
we train one classifier with feature vectors that contain both node-level and
core-level data, for one core at a time.
The classifiers’ training can be performed offline, using labeled data resulting
from normal system operation or from fault injection (as in our case). The trained
classifiers can then be deployed to detect faults on new, streamed data. Due
to this classifier-based architecture, we can only detect one fault at any time.
This design assumption is reasonable for us, as the purpose of our study is to
distinguish between different fault scenarios automatically. In a real HPC system,
although as a rare occurrence, multiple faults may be affecting the same compute
node at the same time. In this case, our detection system would only detect the
fault whose effects on the system are deemed more relevant by the classifier.
4 Experimental Results
We tested a variety of classifiers, trying to correctly detect which of the 8 faults
described in Sect. 2.3 were injected in the HPC node at any point in time of
the Antarex dataset. The environment we used was Python 3.4, with the Scikit-
learn package. We built the test dataset by picking the feature vector of only
one randomly-selected core for each time point. Classifiers were thus trained
with data from all cores, and can compute fault diagnoses for any of them.
We chose 5-fold cross-validation for evaluation of classifiers, using the average
F-score as metric, which corresponds to the harmonic mean between precision
and recall. When not specified, feature vectors are read in time-stamp order.
In fact, while shuffling is widely used in machine learning as it can improve
the quality of training data, such a technique is not well suited to our fault
detection framework. Our design is tailored for online systems, where classifiers
are trained using only continuous, streamed, and potentially unbalanced data as
it is acquired, while ensuring robustness in training so as to detect faults in the
ozalp.babaoglu@unibo.itOnline Fault Classification in HPC Systems Through Machine Learning 11
(a) Random Forest. (b) Decision Tree.
(c) Neural Network. (d) Support Vector Classifier.
Fig. 3. The classification results on the Antarex dataset, using all feature vectors in
time-stamp order, the mode labeling method, and different classifiers.
near future. Hence, it is very important to assess the detection accuracy without
data shuffling. We reproduce this realistic, online scenario by performing cross-
validation on the Antarex dataset using feature vectors in time-stamp order.
Most importantly, time-stamp ordering results in cross-validation folds, each
containing data from a specific time frame. Only a small subset of the tests is
performed using shuffling for comparative purposes.
4.1 Comparison of Classifiers
For this experiment, we preserved the time-stamp order of the feature vectors
and used the mode labeling method. We included in the comparison a Random
Forest (RF), Decision Tree (DT), Linear Support Vector Classifier (SVC) and
Neural Network (MLP) with two hidden layers, each having 1000 neurons. We
choose these four classifiers because they characterize the performance of our
method well, and omit results on others for space reasons. The results for each
classifier and for each class are presented in Fig. 3. In addition, the overall F-
score is highlighted for each classifier. It can be seen that all classifiers show
very good performance, with F-scores that are well above 0.9. RF is the best
classifier, with an overall F-score of 0.98, followed by MLP and SVC scoring
0.93. The critical point for all classifiers is represented by the pagefail and ioerr
faults, which have substantially worse scores than the others.
We infer that a RF would be the ideal classifier for an online fault detection
system, due to its 5% better detection accuracy, in terms of F-score, over the
others. Additionally, random forests are computationally efficient, and therefore
would be suitable for use in online environments with strict overhead require-
ments. It should be noted that unlike the MLP and SVC classifiers, RF and DT
did not require data normalization. Normalization in an online environment is
ozalp.babaoglu@unibo.it12 A. Netti et al.
(a) Mode labeling. (b) Recent labeling.
(c) Mode labeling with shuffling. (d) Recent labeling with shuffling.
Fig. 4. RF classification results, using all feature vectors in time-stamp (top) or shuffled
(bottom) order, with the mode (left) and recent (right) labeling methods.
hard to achieve, as many metrics do not have well-defined upper bounds. To
address this issue, a rolling window-based dynamic normalization approach can
be used [12]. This approach is unfeasible for ML classification, as it can lead to
quickly-degrading detection accuracy and to the necessity of frequent training.
Hence, in the following experiments we will use a RF classifier.
4.2 Comparison of Labeling Methods and Impact of Shuffling
Here we evaluate the two different labeling methods we implemented by using
a RF classifier. The results for classification without data shuffling can be seen
in Figs. 4a for mode and 4b for recent, with overall F-scores of 0.98 and 0.96
respectively, being close to the ideal values. Once again, in both cases the ioerr
and pagefail faults perform substantially worse than the others. This is likely
because both faults have an intermittent nature, with their effects depending
on the hard drive I/O (ioerr) and memory allocation (pagefail) patterns of the
underlying applications, proving more difficult to detect than the other faults.
In Figs. 4c and d, the results with data shuffling enabled are presented for the
mode and recent methods, respectively. Adding data shuffling produces a sensi-
ble improvement in detection accuracy for both of the labeling methods, which
show almost ideal performance for all fault programs, and overall F-scores of 0.99.
Similar results were observed with the other classifiers presented in Sect. 4.1, not
shown here for space reasons. It can also be seen that in this scenario, recent
labeling performs slightly better for some fault types. This is likely due to the
highly reactive nature of such labeling method, which can capture system sta-
tus changes more quickly than the mode method. The greater accuracy (higher
F-score) improvement obtained with data shuffling and recent labeling, compared
ozalp.babaoglu@unibo.itOnline Fault Classification in HPC Systems Through Machine Learning 13
to mode, indicates that the former is more sensible to temporal correlations in
the data, which may lead to erroneous classifications.
4.3 Impact of Ambiguous Feature Vectors
Here we give insights on the impact of ambiguous feature vectors in the dataset
on the classification process by excluding them from the training and test sets.
Not all results are shown for space reasons. With the RF classifier, overall
F-scores are 0.99 both with and without shuffling, leading to a slightly bet-
ter classification performance compared to the entire dataset. In the Antarex
dataset, around 20% of the feature vectors are ambiguous. With respect to this
relatively large proportion, the performance gap described above is small, which
proves the robustness of our detection method. In general, the proportion of
ambiguous feature vectors in a dataset depends primarily on the length of the
aggregation window, and on the frequency of state changes in the HPC system.
More feature vectors will be ambiguous as the length of the aggregation win-
dow increases, leading to more pronounced adverse effects on the classification
accuracy.
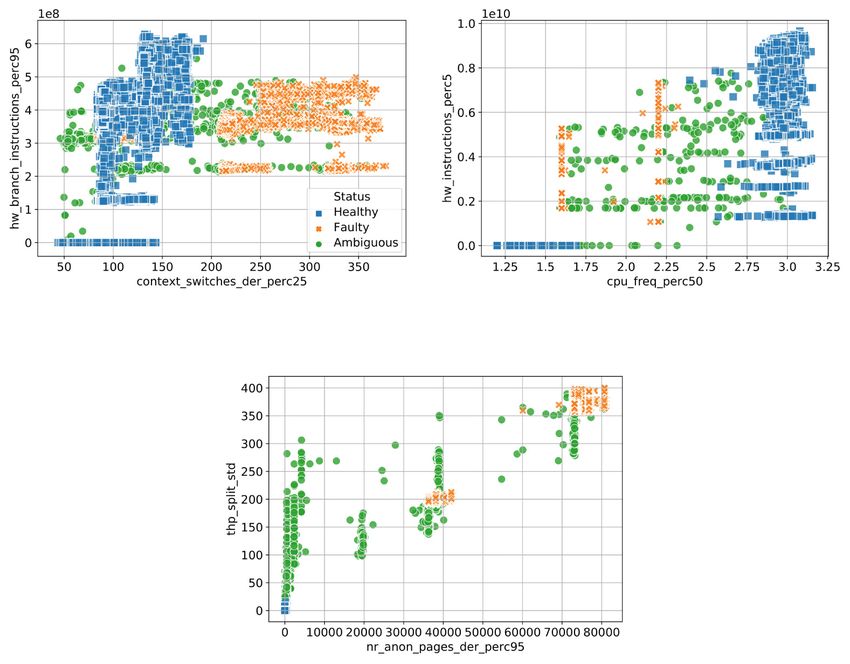
A more concrete example of the behavior of ambiguous feature vectors can
be seen in Fig. 5, where we show the scatter plots of two important metrics (as
quantified by a DT classifier) for the feature vectors related to the ddot, cpufreq
and memeater fault programs, respectively. The “healthy” points, marked in
blue, and the fault-affected points, marked in orange, are distinctly clustered
in all cases. On the other hand, the points representing the ambiguous feature
vectors, marked in green, are sparse, and often fall right between the “healthy”
and faulty clusters. This is particularly evident with the cpufreq fault program
in Fig. 5b.
4.4 Remarks on Overhead
Quantifying the overhead of our fault detection framework is fundamental to
prove its feasibility on a real online HPC system. LDMS is proven to have a
low overhead at high sampling rates [1]. We also assume that the generation of
feature vectors and the classification are performed locally in each node, and
that only the resulting fault diagnoses are sent externally. This implies that the
hundreds of performance metrics we use do not need to be sampled and streamed
at a fine granularity. We calculated that generating a set of feature vectors, one
for each core in our test node, at a given time point for an aggregation window
of 60 s takes on average 340 ms by using a single thread, which includes the I/O
overhead of reading and parsing LDMS CSV files, and writing the output feature
vectors. Performing classification for one feature vector using a RF classifier
takes on average 2 ms. This results in a total overhead of 342 ms for generating
and classifying feature vectors for each 60-s aggregation window, using a single
thread, which is acceptable for online use. Such overhead is expected to be much
lower in a real system, with direct in-memory access to streamed data, since
no CSV files must be processed and therefore no file system I/O is required.
ozalp.babaoglu@unibo.it14 A. Netti et al.
(a) ddot. (b) cpufreq.
(c) memeater.
Fig. 5. The scatter plots of two important metrics, as quantified by a DT classifier, for
three fault types. The “healthy” points are marked in blue, while fault-affected points
in orange, and the points related to ambiguous feature vectors in green.
Moreover, as the single statistical features are independent from each other, data
processing can be parallelized on multiple threads to further reduce latency and
ensure load balancing across CPU cores, which is critical to prevent slowdown
for certain applications.
5 Conclusions
We have presented a fault detection and classification method based on machine
learning techniques, targeted at HPC systems. Our method is designed for
streamed, online data obtained from a monitoring framework, which is then
processed and fed to classifiers. Due to the scarcity of public datasets contain-
ing detailed information about faults in HPC systems, we acquired the Antarex
dataset and evaluated our method based on it. Results of our study show almost
perfect classification accuracy for all injected fault types, with negligible compu-
tational overhead for HPC nodes. Moreover, our study reproduces the operating
conditions that could be found in a real online system, in particular those related
to ambiguous system states and data imbalance in the training and test sets.
ozalp.babaoglu@unibo.itOnline Fault Classification in HPC Systems Through Machine Learning 15
As future work, we plan to deploy our fault detection framework in a large-
scale real HPC system. This will involve the development of tools to aid online
training of machine learning models, as well as the integration in a monitoring
framework such as Examon [3]. We also need to better understand our system’s
behavior in an online scenario. Specifically, since training is performed before
HPC nodes move into production (i.e., in a test environment) we need to char-
acterize how often re-training is needed, and devise a procedure to perform this.
Acknowledgements. A. Netti has been supported by the Oprecomp-Open Trans-
precision Computing project. A. Sı̂rbu has been partially funded by the EU project
SoBigData Research Infrastructure — Big Data and Social Mining Ecosystem (grant
agreement 654024). We thank the Integrated Systems Laboratory of ETH Zurich for
granting us control of their Antarex HPC node during this study.
References
1. Agelastos, A., Allan, B., Brandt, J., Cassella, P., et al.: The lightweight distributed
metric service: a scalable infrastructure for continuous monitoring of large scale
computing systems and applications. In: Proceedings of SC 2014, pp. 154–165.
IEEE (2014)
2. Baseman, E., Blanchard, S., DeBardeleben, N., Bonnie, A., et al.: Interpretable
anomaly detection for monitoring of high performance computing systems. In:
Proceedings of the ACM SIGKDD Workshops 2016 (2016)
3. Beneventi, F., Bartolini, A., Cavazzoni, C., Benini, L.: Continuous learning of HPC
infrastructure models using big data analytics and in-memory processing tools. In:
Proceedings of DATE 2017, pp. 1038–1043. IEEE (2017)
4. Bergman, K., Borkar, S., Campbell, D., Carlson, W., et al.: Exascale computing
study: technology challenges in achieving exascale systems. DARPA IPTO, Tech-
nical Report 15 (2008)
5. Bodik, P., Goldszmidt, M., Fox, A., Woodard, D.B., et al.: Fingerprinting the dat-
acenter: automated classification of performance crises. In: Proceedings of EuroSys
2010, pp. 111–124. ACM (2010)
6. Cappello, F., Geist, A., Gropp, W., Kale, S., et al.: Toward exascale resilience:
2014 update. Supercomput. Front. Innovations 1(1), 5–28 (2014)
7. Cohen, I., Chase, J.S., Goldszmidt, M., Kelly, T., et al.: Correlating instrumenta-
tion data to system states: a building block for automated diagnosis and control.
OSDI 4, 16 (2004)
8. Engelmann, C., Hukerikar, S.: Resilience design patterns: a structured approach to
resilience at extreme scale. Supercomputing Front. Innovations 4(3), 4–42 (2017)
9. Ferreira, K.B., Bridges, P., Brightwell, R.: Characterizing application sensitivity
to OS interference using kernel-level noise injection. In: Proceedings of SC 2008,
p. 19. IEEE Press (2008)
10. Gainaru, A., Cappello, F.: Errors and faults. In: Herault, T., Robert, Y. (eds.)
Fault-Tolerance Techniques for High-Performance Computing. CCN, pp. 89–144.
Springer, Cham (2015). https://doi.org/10.1007/978-3-319-20943-2 2
11. Guan, Q., Chiu, C.C., Fu, S.: CDA: a cloud dependability analysis framework
for characterizing system dependability in cloud computing infrastructures. In:
Proceedings of PRDC 2012, pp. 11–20. IEEE (2012)
ozalp.babaoglu@unibo.it16 A. Netti et al.
12. Guan, Q., Fu, S.: Adaptive anomaly identification by exploring metric subspace
in cloud computing infrastructures. In: Proceedings of SRDS 2013, pp. 205–214.
IEEE (2013)
13. Kondo, D., Javadi, B., Iosup, A., Epema, D.: The failure trace archive: enabling
comparative analysis of failures in diverse distributed systems. In: Proceedings of
CCGRID 2010, pp. 398–407. IEEE (2010)
14. Lan, Z., Zheng, Z., Li, Y.: Toward automated anomaly identification in large-scale
systems. IEEE Trans. Parallel Distrib. Syst. 21(2), 174–187 (2010)
15. Netti, A., Kiziltan, Z., Babaoglu, O., Sı̂rbu, A., Bartolini, A., Borghesi, A.: FINJ:
a fault injection tool for HPC systems. In: Mencagli, G., et al. (eds.) Euro-Par
2018. LNCS, vol. 11339, pp. 800–812. Springer, Cham (2019). https://doi.org/10.
1007/978-3-030-10549-5 62. https://github.com/AlessioNetti/fault injector
16. Snir, M., Wisniewski, R.W., Abraham, J.A., Adve, S.V., et al.: Addressing failures
in exascale computing. Int. J. High Perform. Comput. Appl. 28(2), 129–173 (2014)
17. Tuncer, O., Ates, E., Zhang, Y., Turk, A., et al.: Online diagnosis of performance
variation in HPC systems using machine learning. IEEE Trans. Parallel Distrib.
Syst. 30(4), 883–896 (2018)
18. Villa, O., Johnson, D.R., Oconnor, M., Bolotin, E., et al.: Scaling the power wall:
a path to exascale. In: Proceedings of SC 2014, pp. 830–841. IEEE (2014)
19. Wang, C., Talwar, V., Schwan, K., Ranganathan, P.: Online detection of utility
cloud anomalies using metric distributions. In: Proceedings of NOMS 2010, pp.
96–103. IEEE (2010)
ozalp.babaoglu@unibo.itYou can also read