International Benchmark 2014-2018 - Commerce & Development 25-05-2020 - Rijksoverheid
←
→
Page content transcription
If your browser does not render page correctly, please read the page content below
International Benchmark 2014-2018

Commerce & Development
25-05-2020
Index

    Content                                      Page
      Summary                                     3

      1. Introduction, context and methodology    4

      2. Peer group                               8

      3. Attractive product for passengers        14

      4. Quality of railway services              27

      5. Capacity and utilization                 39

      6. Productivity                             43

      7. Financial performance                    47

    Appendices
      A. Follow-up Audit 2017                     52

      B. Structural characteristics Peer group    54

      C. Methodology                              58

2    International Benchmark 2014-2018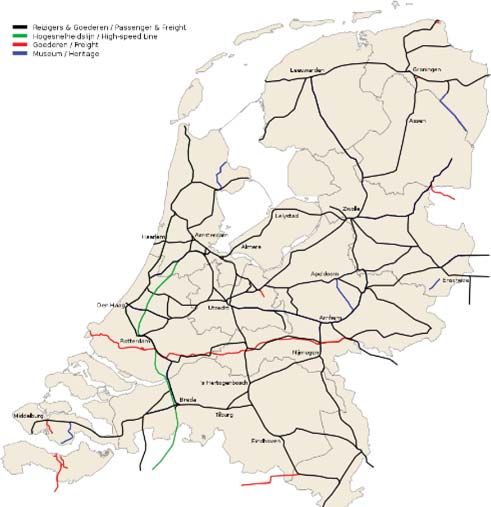
Summary

    ■   In 2019, NS conducted an international benchmark study with a number of European railway
        operators; DSB, Greater Anglia, NMBS, SBB and West Midlands Trains. This benchmark focuses on
        the development of the performance during 2014-2018.

    ■   NS’ performance is above the average of the peer group on the following aspects: attractive
        product, quality of the railway services and capacity of the railway system.

    ■   NS’ punctuality has improved over the past years and is above the average of the peer group, while
        the Dutch network has the highest utilization of the peer group. Utilization has increased even
        further during 2014-2018.

    ■   NS’ rolling stock has a relatively low age and only uses electrical traction. By using energy from
        renewable resources, the CO2 emission decreased to negligible levels.

    ■   The overall custom satisfaction has increased by 11 percent point, which is the highest increase in
        the peer group, putting NS above average in the peer group. An improved and extended train
        service, higher punctuality, better service and modernized trains and stations all contributed to the
        increased customer satisfaction.

    ■   High utilization of rolling stock and stations leads to a high productivity and a relatively low cost
        level compared to the peer group.

3   International Benchmark 2014-2018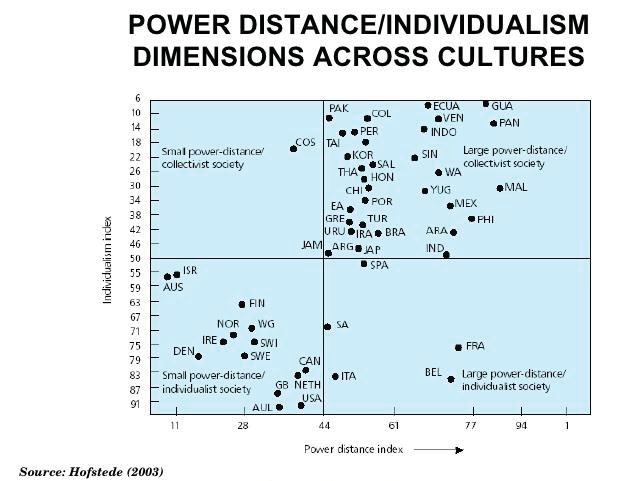
Index

    Content
      Summary                                    1. Introduction, context and methodology
                                                    1.1 Introduction and objectives
      1. Introduction, context and methodology
                                                    1.2 Context, data and analysis process
      2. Peer group
                                                    1.3 Methodology and explanations
      3. Attractive product for passengers

      4. Quality of railway services             This chapter gives a short introduction on the history of
                                                 the benchmark study, the context of the current
      5. Capacity and utilization                benchmark study and the objective of the study which
                                                 aims to identify realistic and potential improvements to
      6. Productivity                            NS performance (1.1).
                                                 It also provides a short overview of the participants in
      7. Financial performance
                                                 the benchmark, which is elaborated in chapter 2 - the
                                                 peer group description.
    Appendices                                   The process of data collection and analysis (1.2) is
      A. Follow-up Audit 2017                    followed by an overview of the methodology and
                                                 considerations on the interpretation of the information
      B. Structural characteristics              and data represented (1.3).
                                                 Appendix C provides more information on the
      C. Methodology                             methodology.

4    International Benchmark 2014-2018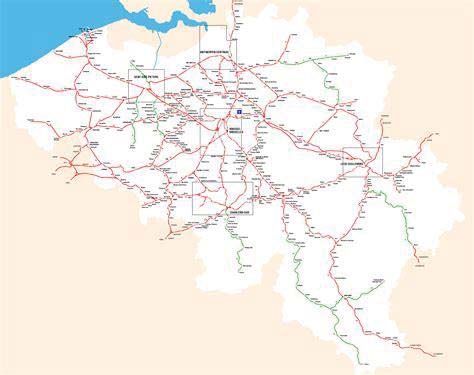
1.1 Introduction and objectives
Objectives: identify opportunities for improvement of the performance of NS

    ■   Every three years NS carries out a benchmark project, in accordance with its 2015-2025
        Transportation Contract (art. 26), to monitor its performance and to pursue continuous
        improvement. The peer group consists of at least four comparable operators. Topics cover the key
        performance areas of the Transportation Contract and the development of productivity.

    ■   The benchmark encompasses data over a period of 5 years, to provide insight in trends and
        developments and to offer an overlapping continuity between the subsequent benchmarks.

    ■   Results will be used to identify a realistic potential for improvement and best practices to contribute
        to NS’ performance. Where applicable this will be input for NS’ annual Transportation Plan.

    ■   The study encompasses a comparison between five European operators (DSB, GreaterAnglia,
        NMBS, SBB, West Midlands Trains) and includes subjects like punctuality, safety, costs,
        sustainability and productivity.

    ■   There are confidentiality arrangements with the participating operators.
        • All confidential information in this benchmark will be presented anonymously and ranked per
           comparison. Therefore the operator codes change per comparison to prevent identification of
           individual operators.
        • All confidential information will be presented as indices (not absolute numbers), with 100 as
           the average for data from 2018. Where available data for 2018 is incomplete, the average of
           2017 will be used for the index (this will be stated where applicable).

5   International Benchmark 2014-2018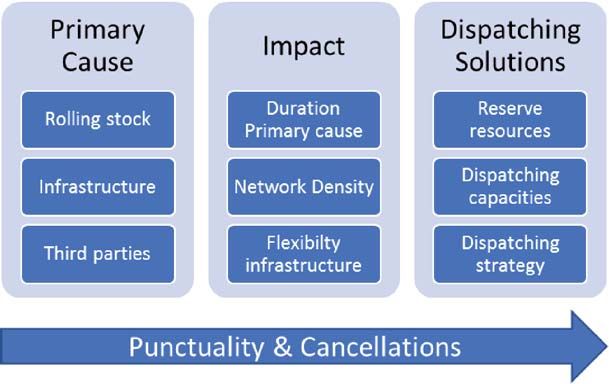
1.2 Context, data and analysis process
Challenging process to collect, compare and analyze international rail data

    ■   The peer group consists of train operators from Belgium, Denmark, Switzerland and the United
        Kingdom. The peer group is largely the same as the peer groups of earlier benchmarks of NS to
        ensure continuity and a longer term perspective.

    ■   NS used multiple sources for this benchmarking study:

        1.   Publicly available information (annual reports, internet, statistical bureaus, sector reports, etc.);
        2.   Data from international benchmark platforms and working groups that NS participates in;
        3.   Bilaterally exchanged information from the peers (covering 2014 - 2018).

    ■   The data collection and analysis process has proven to be quite challenging: not all peers have all
        requested data for the requested years available, or use different definitions. This results in a
        number of analyses with data missing for a number of peers or years. In cases where comparisons
        require caution, because of differences in definitions, this is mentioned in the texts.

    ■   All companies were consulted to verify and complete the data, evaluate trends and exchange best
        practices.

    ■   Financial data is harmonized for exchange rates and purchasing power parity levels (PPP).

    ■   This benchmark study is reviewed by the Kennisinstituut voor Mobiliteitsbeleid (KiM).

6   International Benchmark 2014-2018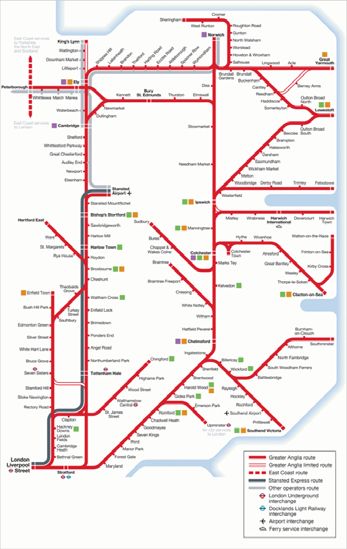
1.3 Methodology and explanations
Other remarks

    ■   The definitions used for the analyses are chosen for comparability with the indicators of the peer
        operators. Therefore the KPIs in this report do not always match the definitions of the KPI’s that NS
        uses in their dashboards and in the reports for the Ministry of Infrastructure and Water Management.
    ■   The scope for the NS data include all trains running as part of the main rail concession. Therefore trains
        on the high speed line (IC Direct, IC Brussels) are included starting in the 2015-2018 numbers. Trains
        from regional contracts are excluded.

    ■   Punctuality scores of the train operators and customer satisfaction scores are harmonized using the
        methodology described in Appendix B. There is a certain amount of uncertainty in the comparability.
        The figures are not harmonized for differences in measurement methodology (e.g. survey method for
        customer satisfaction and end station vs. entire route for punctuality).
    ■   All financial numbers are excluding VAT and harmonized using the OECD purchasing power parity
        indices* (see Appendix B).
    ■   Graphs represent time series (typically 2014-2018) or comparisons for 2018, unless stated otherwise.
    ■   The numeric convention of this report is the Dutch; a period (.) is used to separate groups of
        thousands. A comma (,) is used to indicate the decimal point.

    ■   Based on the results of the 2016 benchmark study, this 2019 study dedicates some extra attention to
        customer satisfaction and train cancellations.

    ■   Apart from this benchmark study NS engages in a number of benchmarking initiatives to improve
        performance. Examples include the International Mainline Rail Benchmark Group, a joint NS-ProRail
        weather preparation benchmark, bilateral contacts with other railways on timetable development,
        punctuality improvement, customer satisfaction, passenger information, etc.
7   International Benchmark 2014-2018                      * source: https://data.oecd.org/conversion/purchasing-power-parities-ppp.htm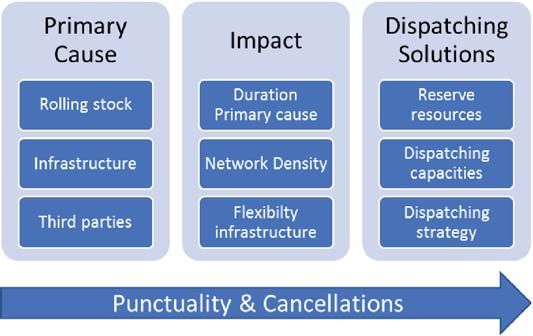
Index

    Content
      Summary                                    2. Peer group

      1. Introduction, context and methodology      2.1 Criteria and choice

                                                    2.2 Organization and market regime
      2. Peer group
                                                    2.3 Characteristics and key figures
      3. Attractive product for passengers
                                                    2.4 Rolling stock fleet
      4. Quality of railway services
                                                 This second chapter provides more detailed information
      5. Capacity and utilization                on the peer group operators which are included in this
                                                 benchmark study.
      6. Productivity                            A summary of the criteria on which the operators in the
                                                 peer group are selected (2.1) is followed by an overview
      7. Financial performance
                                                 of the different organizations, roles and market regimes
                                                 (2.2). The chapter concludes with some overall key
    Appendices                                   characteristics and figures of the operators in the peer
      A. Follow-up Audit 2017                    group such as passenger kilometers, average trip length
                                                 and system speed (2.3) and a description of the rolling
      B. Structural characteristics              stock fleet used within the peer group (2.4). Appendix
                                                 B provides some more information on the peers.
      C. Methodology

8    International Benchmark 2014-2018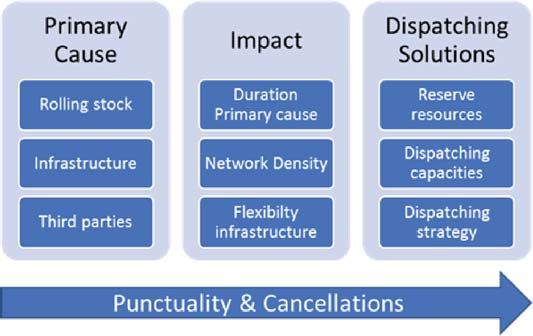
2.1 Criteria and choice
The peer group consists of operators that run medium-sized, high density operations

    Criteria
    1. As many participants as possible from previous international benchmarking studies by NS to establish a
        longer term perspective with time series
    2. Trade off between comparability and learning potential:
         a. Operations: commuter / regional transport, travel distance, traffic density, average speed, size
         b. Infrastructure: network lay-out, potential weather / winter influences, intensive use of network;
             multiple operators on network
    3. Cooperation of peer group / availability of data:
         a. Willingness to participate (market / competition issues, confidentiality conditions)
         b. Existing cooperation in other international working groups and/or benchmarking platforms

                                                                   Train operators
                                                                   NS
                                                                   NMBS
                                                                   DSB
                                                                   Greater Anglia
                                                                   West Midlands Trains
                                                                   SBB

9   International Benchmark 2014-2018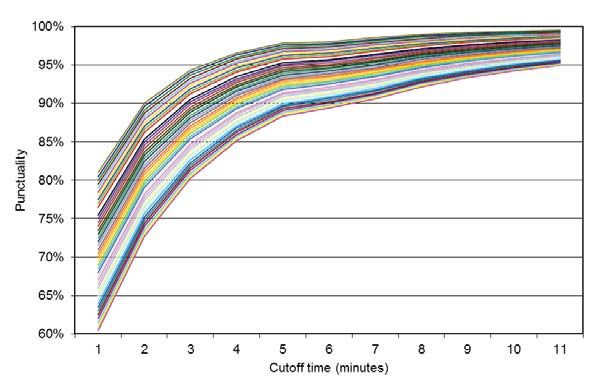
2.1 Criteria and choice
Some key figures of peer group

     The table summarizes some structural characteristics of operating environment of the peers1. Differences in
     these parameters have significant impact on the performance of the peers.

                          Passenger operator(s) in peer       NS             DSB            GA,            SBB             NMBS
                          group                                                             WMT2

                          Infrastructure manager              ProRail        Bane-          Network        SBB             Infrabel
                                                                             danmark        Rail

                          Network (routekm) – Total                 3.075          3.476        16.837           5.690         3.592

                          Network (routekm) – IM peer               3.075          1.896        15.804           3.090         3.568

                          Network (trackkm) – IM peer               5.370          3.076        31.091           6.239         5.379

                          Area – land (km2)1                       33.893       42.434        241.910          39.997         30.278

                          Population (mln)1                         17,28            5,9          65,8             8,4         11.72

                          Population density (inh./km1)              502            132            266            204             387

                          Routekm / 1000 km2 land                    90,7           81,9          69,6           142,3         118,6

                 Rail     Inhabitants / km network                  5620           1697           3908           1476           3263
                ratio’s   Passengerkm (train) / km2                  578            146            288            464             347

                          Pass.km (train) / inhabitant              1.134          1.048         1.059           2.212            896

     Most countries have one infrastructure manager. In case there are multiple infrastructure managers the
     total network length of the country differs from that of the peer.
     All passengerkm numbers are national (Eurostat / KiM), except in the cases of SBB and NMBS, where the
     passengerkm of only that operator are given.
                                                          1         Source: https://www.cia.gov/library/publications/the-world-factbook
10   International Benchmark 2014-2018                    2         GA = Greater Anglia; WMT = West Midland Trains
2.2 Organization and market regime
Peer group: a mix of operators with tendered and directly awarded transportation contracts
■ The peers operate in different market environments. Main difference: DSB, NMBS, NS and SBB
have directly awarded transportation contracts while Greater Anglia and West Midlands Trains
operate tendered contracts. Open access operation may be formally applicable, but is very
limited or absent in practice.
■ Greater Anglia and West Midlands trains share a significant part of the network with other
operators, introducing more coordination with multiple other passenger operators. The
operation of the other peers involves less interaction with other operators .
■ The operators in the peer group are also responsible for station management. The exact
implementation differs with the network, station and market characteristics.
■ SBB has a holding organization with both infrastructure management and operations. All other
peers have full separation between infrastructure management and operations.
Market segment Netherlan Belgium Denmark UK Switzerlan
ds d
HS passengers Open Open Open Open Open
access access access access access
IC passengers PSC direct PSC direct PSC direct PSC PSC direct
award award award tendered award
Commuter trains PSC direct PSC direct PSC direct PSC PSC direct
award award award tendered award
Regional passengers PSC PSC direct PSC direct PSC PSC direct
tendered award award & tendered award
tendered
Freight Open Open Open Open Open
access access access access access
PSC: public service contract
11 International Benchmark 2014-20182.3 Characteristics and key figures
Passenger kilometers are consistently growing, trip length is average, system speed is above
average
■ The total volume of passengerkm per year has been
consistently rising for NS, and is now almost twice
the average of the peer group. Most peers expect a
rise of passengerkm in the near future.
■ The average trip length of NS remains stable
around the average of the peer group.
■ NS’ system speed (km/h) is above average for the
peer group. System speed is a main driver for travel
speed and productivity.
■ Geographical characteristics (see p.54,55) and
economies of scale contribute to high efficiency.
12 International Benchmark 2014-20182.4 Rolling stock fleet
NS operates mainly electric trainsets, allowing for a higher operational flexibility
■ NS operates mainly electric multiple units (last
diesel trainset was put out of service in 2017).
NS has the highest proportion of electric
multiple units of the peer group.
■ NS has the highest proportion of double deck
rolling stock of the peer group (operator 5 and 6
do not use double deck units).
■ The average age of the fleet of NS is below the
average of the peer group.
■ During 2014-2018 this average age was rising
due to recommissioning of reserve fleet. Since
then NS has procured new rolling stock.
13 International Benchmark 2014-2018Index
Content
Summary 3. Attractive product for passengers
3.1 Customer Satisfaction
1. Introduction, context and methodology
3.2 Complaints
2. Peer group 3.3 Sustainability
3.4 Trends, insights and best practices
3. Attractive product for passengers
4. Quality of railway services A comparison of customer satisfaction trends and other
relevant factors provides an overview of the
5. Capacity and utilization attractiveness of the product.
The chapter contains a comparison of the overall
6. Productivity customer satisfaction and the satisfaction on underlying
aspects (punctuality, passenger information,
7. Financial performance
cleanliness, stations, connections and frequency (3.1).
Other aspects of attractiveness are the development of
Appendices the complaint ratio (3.2); sustainability, energy
A. Follow-up Audit 2017 efficiency and CO2 emissions are presented in (3.3). The
chapter concludes with other trends, insights and best
B. Structural characteristics practices of the peer group (3.4).
C. Methodology
14 International Benchmark 2014-20183.1 Customer Satisfaction - Overall
NS’ customer satisfaction is above average and rising significantly
NS’ overall customer satisfaction is 9% above the average
of the peer group and shows a significant and continuous
increase during the benchmarking period.
■ All peers attribute increasing customer satisfaction to a
goal-oriented focus on improving performance and
punctuality, increasing cross-functional collaboration.
■ Overall customer satisfaction is strongly correlated to
customer satisfaction on punctuality.
■ Operator 5 attributes the declining customer
satisfaction in 2018 mainly to holding the customer
satisfaction survey immediately after a winter with
extreme negative impact on performance.
■ NS recognizes a positive impact of:
• Introduction of newly designed timetable with
higher frequencies
• Introduction of new and modernized rolling stock
• Innovations in personalized passenger information
• Improvement of service quality level of staff
• Station improvement (major overhaul of stations,
“station living room”, retail, etc.)
15 International Benchmark 2014-20183.1 Customer Satisfaction - Punctuality
Customer satisfaction on punctuality is high and shows correlation to actual performance
■ Customer satisfaction on punctuality shows some
correlation to the actual punctuality, but it is far
more volatile than measured (actual) punctuality.
■ Peers attribute this volatility of the customer
satisfaction to the impact of extreme weather
conditions, construction works and major changes
in the timetable.
16 International Benchmark 2014-20183.1 Customer satisfaction – Differences between peers
CS depends on perception vs. expectation. Cultural factors have major impact on response style.
Word of Mouth Personal Needs Past Experience ■ The International Benchmark 2011-2015 found only a weak
correlation between customer satisfaction and actual performance.
Expected service
Gap 5
Other factors seem to have a higher impact. The auditors
Consumer
Perceived service recommended to give this some extra attention.
■ There are two models that provide some insight in differences in
Provider (Service Delivery)
Service Operation
Gap 4
Communcations customer satisfaction and response style.
Gap 1 Gap 3
Service Transition
■ The standard model for customer satisfaction (fig. 1, EN13816 or
(Service Specifications)
Service design SERVQUAL) focusses on the difference between perception and
Gap 2
Service Strategy
expectation.
(Management
Perceptions) • This model implies that a higher performance leads to higher
expectations. Therefore the operator has to improve
performance even further, and/or focus more on satisfiers,
such as comfort, ease of use, experiential performance, etc.
• Higher performing peers seem to invest more in “intangible
performance” and managing expectations.
■ Other research* shows that the response style correlates with
cultural factors, such as the power distance and level of
individualism.
• Hofstede (2003) maps countries on these dimensions (fig. 2).
The Netherlands rank as a relatively individualistic culture with
a medium power distance. This may lead to a less positive and
more middle (less extreme positive) response style than
average.
• A.W. Hartzig; 2006; Response Styles in Cross-national Survey Research, A 26-country Study;
17 International Benchmark 2014-2018 International Journal of Cross Cultural Management Vol 6(2): 243–2663.1 Customer satisfaction – Trends
Customer satisfaction is influenced by a large number of factors, including overall public opinion
Customer satisfaction on different aspects of a trip shows a high correlation between these aspects.
A lower performance on one aspect can influence the evaluation of other aspects of the trip.
■ A number of peers attribute part of the variation of customer satisfaction to overall public opinion
about the performance and/or the reputation of the operator. Empirical evidence for this notion
across the peer group is limited as the practices of reputation measurement vary.
■ Some of the peers, including NS, design questionnaires to focus on the evaluation of the actual trip
and minimize bias due to variations in public opinion.
■ NS has redesigned its methodology accordingly in 2015. To ensure consistency and comparability
this benchmark only includes 2016-2018 customer satisfaction measurement from NS.
■ NS has dedicated a considerable effort to understanding the entire travel experience of its
customers and improving the experience during key moments of the trip.
■ NS invests in providing clear information before and during the trip (e.g. adding new functionality
to the Reisplanner Xtra app) and managing expectations about the trip (e.g. seasonal
communication campaigns).
18 International Benchmark 2014-20183.1 Customer satisfaction - Passenger information
Customer satisfaction on passenger information shows significant increase
■ Customer satisfaction about passenger information
at NS has risen consistently and is now above
average for the peer group.
■ New developments, e.g. functionality of the
passenger information app (“Reisplanner Xtra”) and
the higher punctuality are significant contributors
to the increasing customer satisfaction.
■ Customer satisfaction about passenger information
is rather volatile for some operators. Peers confirm
correlation with punctuality and the impact of the
moment of measurement of passenger satisfaction
(e.g. continuous vs. 2 samples per year).
19 International Benchmark 2014-20183.1 Customer Satisfaction - Information in case of disruptions
NS ranks second, but significantly above average, on information during disruptions
■ NS ranks second, although satisfaction on information
in the train has declined.
■ Customer satisfaction on passenger information during
disruptions varies widely over time, partly due to very
small sample sizes for these questions. Outcomes are
sensitive to incidents and cancellations.
■ Measuring customer satisfaction only 2 times per year
increases the volatility of the outcomes for some of the
peers.
■ Multiple peers have developed their customer
satisfaction measurement methodology to focus on the
experience during a specific trip.
■ The best performer in both graphs has invested
significant resources into minimizing the impact of
disruptions.
■ Causality is not clear; customer satisfaction can vary
according to the quality of the information, but also
correlates directly to variations in punctuality.
■ There is no data concerning the impact of managing
customer expectations regarding large disruptions (e.g.
fall / winter conditions).
20 International Benchmark 2014-20183.1 Customer Satisfaction - Cleanliness
Satisfaction on cleanliness and stations is above average
■ NS’ customer satisfaction about cleanliness of
trains and stations is above average and increasing.
■ Most operators show rising trends, although some
have challenges regarding cleanliness of trains.
■ NS’ customer satisfaction on cleanliness of trains
has partly been improved due to the introduction
of new rolling stock and the overhaul of existing
rolling stock.
■ Renovation of stations has a positive effect on the
experience of cleanliness of stations.
■ Focused performance management on cleaning
has further improved the customer satisfaction on
cleanliness of NS’ trains and stations.
21 International Benchmark 2014-20183.1 Customer satisfaction – Connections and frequency
Satisfaction on train frequencies is above average, customer satisfaction on connections is
improving
■ Customer satisfaction about frequency of trains has
increased, and is now well above the average for
the peer group.
■ NS increases frequencies from 4 to 6 intercity trains
per hour per direction on the busiest lines.
■ In 2018, NS increased the frequency on the busiest
route (“A2-corridor”) as a part of Programme High
Frequent Rail (PHS).
■ NS’ customer satisfaction about connections
between trains has improved and is now around
the average of the peer group.
■ For NS, the satisfaction on frequency and
connections are highly related, as these are part of
the design of the timetables. This was also shown
in NS/ProRail International Benchmark 2011-2015.
■ Op1-Op3 show also high frequencies of trains on
the busiest parts of the network, providing many
connections.
■ Op1 has an elaborate national system of aligning
timetables between different operators.
22 International Benchmark 2014-20183.2 Complaints
Number of complaints by NS passengers has declined to a level below the average
■ The number of complaints by passengers NS has decreased
considerably over the last three years and is now below average.
■ Reasons for this decline include:
• Adoption of digital channels (OV-chipkaart, compensation
claims, feedback possibilities)
• Improvement of passenger information (e.g. about seating
availability)
• Improvements in the timetable (frequency, connections,
speed)
• Assigning rolling stock with more seats to the busiest lines
■ Changes in communication and sales channels (digitalization)
usually result in a short-term increase of complaints during the
adoption period. Customers of NS have finished adopting the
OV-chipkaart. Customers of operator 5 are still getting used to a
more recent shift to digital channels and have a higher complaint
rate.
■ The complaint rate is influenced by the ease of lodging
complaints (e.g. web-based vs. paper form) and the scope of
what is logged as a complaint. These differences limit the
comparability of levels complaint rates.
■ Correlation between the complaint rate and overall customer
satisfaction is weak .
23 International Benchmark 2014-20183.3 Sustainability – Energy efficiency
NS is leading the peer group in energy efficiency
■ Energy consumption per passengerkm at NS varies
slightly over the years, but stays around 30% below the
average of the peer group.
■ Factors contributing to NS’ low energy consumption are:
• Operating trains with electrical traction
• High numbers of passengers per train
• Relatively new rolling stock (with recuperative braking)
• Energy efficient driving, facilitated by a driver advisory
system (developed in-house)
• Relatively low number of stops (compared to regional
traffic of peers)
24 International Benchmark 2014-20183.3 Sustainability – CO2 emissions
NS’ CO2 emissions have approached zero in the benchmarking period
■ NS’ CO2 emissions have decreased to negligible
levels during the benchmarking period, resulting
in NS ranking second.
■ Factors contributing to low CO2 emissions:
• Operating trains with electrical traction
• High energy efficiency
• Sourcing energy from renewable sources
■ NS has ended diesel powered operations and
invested significantly in energy efficiency and
sourcing from renewable sources in the
Netherlands, Belgium, Finland and Sweden (wind
power from newly build local wind parks). Peers
have expressed their interest in this practice.
■ Zero emission sources from other countries
include nuclear power and hydroelectric power.
25 International Benchmark 2014-20183.4 Trends, insights and best practices
Additional insights from discussion with peers
■ Passenger demand
• External factors have major impact on growth or decline of passenger demand.
• The growth rate of one of the peers declined due to lower prices for car usage and the rise of
travel sharing app services.
■ Demand management
• Multiple peers consider pricing signals to manage demand and shift growth of demand from
the busiest trains to less busy trains .
• One of the peers introduced a new targeted proposition; lower price, but with limitations for
certain trains/times. Targeting younger passengers via digital channels proved to be very
effective; the substitution ratio was very good.
■ Targeted investments in performance improvement
• Performance management is maturing in most operators of the peer group.
• Multiple peers show more conscious decision making, making trade-offs between KPI
improvement and the associated investments (e.g. portfolio approach).
26 International Benchmark 2014-2018Index
Content
Summary 4. Quality of railway services
1. Introduction, context and methodology 4.1 Reliability, punctuality and cancellations
4.2 Seating capacity
2. Peer group
4.3 Safety and security
3. Attractive product for passengers
4.4 Insights and best practices
4. Quality of railway services Quality of railway services is operationalized as the
reliability of train services, passenger punctuality, train
5. Capacity and utilization punctuality and cancellations (4.1). This includes a
more in-depth review of factors impacting the
6. Productivity cancellation ratio of trains.
Other aspects of the quality of railway services are
7. Financial performance
seating capacity (4.2), safety of passengers and staff
and personal security on stations and in train (4.3).
Appendices This chapter concludes with some additional insights
A. Follow-up Audit 2017 and best practices found within the peer group (4.4).
B. Structural characteristics
C. Methodology
27 International Benchmark 2014-20184.1 Punctuality and cancellations – Passenger punctuality
Passenger punctuality has increased and is above average
■ The definitions and methodologies for passenger
punctuality vary significantly. NS is unique using
check-in and check-out data. Other operators use
weighted train punctuality calculations.
■ The figures have been harmonized to some extent,
but evaluating trends is more meaningful than
comparing absolute levels.
■ NS passenger punctuality has improved over the
past years and is above the average of the peer
group.
■ Four operators in the peer group use a passenger
punctuality KPI. Other operators only measure train
arrival punctuality and cancellations.
■ Passenger punctuality is highly correlated to train
punctuality and to a lesser extent to train
cancellations.
■ Focusing on improving passenger punctuality can
lead to changes in dispatching and disruption
management decisions. This may result in more
trains being cancelled, but more passengers
arriving on time.
28 International Benchmark 2014-20184.1 Punctuality and cancellations – Train punctuality
Train punctuality has increased and is above average
■ Train punctuality is a main performance indicator
for all operators, but methodologies and definitions
vary.
■ Figures have been harmonized as much as possible;
delay threshold of 5 minutes and measurement on
nodes (not only terminal stations) are used.
■ Some uncertainty remains, so focusing on trends is
more appropriate than absolute figures.
■ NS’ train punctuality at 5 minutes has increased
over the years and is well above average of the
peer group.
■ Factors impacting manageability of ■ NS has both improved reliability and increased
punctuality cited by multiple peers: frequencies of train services by:
• Aligned targets for operator and • Improving the timetable design process (aiming
infrastructure manager at operational executability)
• Dispatching decisions • Improving dispatch and exception handling
• Constraints in the timetable ■ Operator 1 has also improved its performance by
• Impact of delayed international trains introducing both new infrastructure and significant
and trains of other operators on the timetable improvements. The operator is unique in
same network integrating the processes of designing timetables
• Reserve resources (rolling stock, staff) and new infrastructure.
• Level of detail of planning systems
29 International Benchmark 2014-20184.1 Punctuality and cancellations – Train cancellations
NS’ train cancellation ratio is around average
■ NS’ train cancellation ratio is around the average of the group.
■ Cancellations are expressed with respect to the current timetable,
which is in most cases set 24 or 36 hours before operation.
■ There are some differences in definitions (e.g. measuring whole
and/or partial cancellations, timing of reference timetable),
limiting comparability. Therefore trend analysis is more
meaningful than comparing absolute ratios.
■ Most peers show upward trends, citing a variety of causes:
• Signaling problems
• Quality of rolling stock
• Dispatching goals and strategy
• Weather conditions
• Impact of performance of other operators.
■ The top performing peer has a significantly lower ratio than all
other peers. Differences will are explored further in the following
pages.
■ To analyze the number of cancellations, the following factors can
be considered:
• Primary cause of the cancellation (e.g. infra failure, accidents,
rolling stock problems),
• Direct impact of the cause on trains,
• Available solutions for the dispatchers.
■ Primary causes: in the case of the top performing operator,
considerable investments in quality of infrastructure reduce the
number of incidents. NS has improved the quality of rolling stock
preceding the high frequent operation on the A2 route.
30 International Benchmark 2014-20184.1 Punctuality and cancellations – Train cancellations vs frequency
Higher frequencies can lead to more cancellations
■ Mitigating factors that help reduce the number of primary causes
(that are mentioned by multiple peers) include close cooperation
with the infrastructure manager (analyzing and preventing causes)
and good maintenance of rolling stock.
■ The impact of a primary cause depends on the duration of the
incident, the network density and flexibility of the infrastructure
layout.
■ The infrastructure manager of the operator with the lowest
cancellation reduces repair times on infrastructure-related disruptions
by allowing repairs to take place between scheduled trains (during
operations).
■ The best performing operator also has a number of staffed
locomotives standing by to quickly tow defective rolling stock from
the tracks.
■ The impact of a disruption on a timetable and the corresponding
decision to cancel one or more trains depend on safety protocols
(e.g. allowing repairs between scheduled trains) and the properties
of the timetable itself.
■ According to multiple peers, the density of the network is an
important factor explaining a higher cancellation ratio. A higher
frequency reduces the possibility to repair failures without impacting
other trains.
■ The graph shows that NS combines the highest network density with
an average cancellation ratio.
31 International Benchmark 2014-20184.1 Punctuality and cancellations – Passenger punctuality vs
cancellations
Passenger punctuality versus cancellations – dispatching decisions
■ Given the impact on primary causes, dispatching solutions can
reduce the impact on the rest of the network.
■ The best performing peer on cancellations has a number of staffed
trains that are ready to take the place of cancelled or heavily
delayed trains in the operational timetable in very short notice.
■ NS and ProRail have invested in a better decision making process
(CMBO) in case of incidents and cancellations. A number of peers
also work co-located with the infrastructure manager in a control
centre. However the actual collaboration varies widely between
“just providing input” to more intense interaction during the
decision making process.
■ Multiple peers discuss the trade off between passenger punctuality
and cancellations during dispatching decisions. Differences in
strategies are connected to differences in goals and objectives and
the operational context.
■ There are two main strategies:
• Minimize cancellation of delayed trains (this can be culturally
unacceptable, or undesirable because of passenger flow)
• Minimize the impact of delays, aiming for overall passenger
punctuality (accepting a number of cancellations)
■ ProRail and NS adhere to the second strategy, resulting in a positive
trend in passenger punctuality.
■ A strategy combining both passenger punctuality and capacity of
trains at peak hours may be worth investigating.
32 International Benchmark 2014-20184.2 Seating capacity
Seat occupation rate is average, customer satisfaction on seating capacity is high
■ The occupation ratio of seats in trains at NS is around the
average of the peer group and remains stable.
■ Customer satisfaction about seating capacity increased
significantly, moving NS to the first place in the ranking.
■ During the benchmarking period NS introduced several
measures to improve seating capacity:
• Actively managing seating capacity; monitoring,
analysis, interventions in rolling stock allocation, e.g.
extra capacity during “hyper peak” (7.30-8.00).
• Increasing frequency of trains on busiest route and
adding peak hour services on specific routes.
• Providing seating capacity information to enable
passengers to decide on alternative trains with more
available seats (search tool in planner app, personal
mail campaign, back to school campaign).
• Developing new rolling stock planning tooling
minimizing passengers’ 'standing minutes’.
■ The operator with the highest seat occupation ratio
utilizes a seat reservation system and changes train
length frequently during operations to match seat supply
and demand as close as possible.
33 International Benchmark 2014-20184.3 Safety and security – Railway safety
Railway safety in the Netherlands is above the average of the peer group
■ During the benchmarking period there has been a
low number of accidents that involve the serious
injury of passengers.
■ The number of significant accidents (including
those without injury/death) is below the average
of the peer group.
Remarks
■ The comparisons show total numbers per country
and not per peer (ERA Common Safety Indicators).
■ Ranking in graphs is based on 2017 values, due to
ERA data on 2018 not being available yet.
■ Missing data and zero incidents both appear as
“0” in the graphs.
■ Safety comparisons like these are very sensitive to
single incidents.
34 International Benchmark 2014-20184.3 Safety and security – Safety for employees
A meaningful comparison of railway safety for staff is difficult due to low numbers of incidents
■ The Netherlands have suffered relatively few
accidents with a large impact (serious injuries,
death) during the past few years.
■ None of the peers show any stable trends.
Remarks
■ The comparisons show total numbers per country
and not per peer (ERA Common Safety Indicators)
■ Ranking in graphs is based on 2017 values, due to
ERA data on 2018 not being available yet.
■ Missing data and zero incidents both appear as
“0” in the graphs.
■ Safety comparisons like these are very sensitive to
single incidents.
35 International Benchmark 2014-20184.3 Safety and security – SPAD and security for passengers
The level of signals passed at danger (SPAD) in the Netherlands is below average
■ All peers use signals passed at danger as a main
operational safety indicator. Therefore here the graph
shows the performance of individual peers and not
performance on a country level.
■ NS’ SPAD ratio is below the average of the peer group.
■ The peak in 2018 is mainly caused by transition of roles
on shunting yards and can be expected to be incidental.
■ The figure for Operator 4 is not comparable to those of
the other operators, due to differences in definitions and
scope.
■ Security incidents are registered incidents between
passengers or between passengers and railway staff.
■ The definitions of an incident varies between the peers.
(incl/excl verbal and physical aggression), evaluating
trends is more meaningful than comparing absolute
levels.
■ The number of incidents at NS is increasing during the
benchmark period. Violence against public employees
has been a problem in Dutch society.
■ During 2018, security employees of NS were equipped
with a bodycam.
■ The number of incidents at NS dropped 18% in 2019.
36 International Benchmark 2014-20184.3 Safety and security – Customer satisfaction on security
Customer satisfaction about security is above average and consistently rising
■ Customer satisfaction about personal security
(feeling safe in trains and on stations) has
continuously increased in the case of NS.
■ NS now also ranks above average for security on
stations.
■ NS ranks above average for security in trains during
the entire benchmarking period.
■ Developments with a positive impact on security
are:
• Closing passenger gates at stations
• Opening of new stations or renovation of
stations
• Introduction of new rolling stock with a more
transparent interior and CCTV
■ The impact of these developments is recognized
throughout the peer group.
■ The questions to customers about security vary
among the peer group. Therefore a comparison of
the development of customer satisfaction is more
meaningful than a comparison of the absolute
levels.
37 International Benchmark 2014-20184.4 Insights and best practices
Additional insights from discussion with peers
■ Punctuality and cancellations
• One operator of the peer group has very clear decision rules for rolling stock problems. If a train isn’t
able to leave within a given time, the train will be cancelled.
• One operator of the peer group does not relieve a driver directly after an incident, but gives the
driver the choice to be relieved immediately or at a subsequent staff location.
• Multiple peers stress the importance of collaboration between operators and the infrastructure
manager to manage and improve punctuality and reliability for the passengers.
■ Seating capacity
• Many operators require rolling stock that is in need of maintenance to be in the depot for at least
one or two traffic peak periods. This requires a significant fleet reserve.
• One of the peers has improved rolling stock availability by dividing the maintenance schedule in
smaller time intervals that can be carried out between the rush hours. This results in a higher seat
availability, but can have a negative impact on maintenance costs.
■ ERTMS introduction
• Some peers notice that the introduction of new rolling stock or ERTMS is very complex and has an
impact on several performance aspects. Training of staff and the availability of sufficient siding and
depot facilities can be bottlenecks.
• For one operator the introduction of new rolling stock had a negative impact on the overall
performance, due to the amount of attention and capacity (of the workshop) that was needed for
this introduction.
38 International Benchmark 2014-2018Index
Content
Summary 5. Capacity and utilization
5.1 Utilization of the network, trains and
1. Introduction, context and methodology
stations
2. Peer group 5.2 Utilization of the rolling stock
3. Attractive product for passengers This chapter presents aspects of capacity and
utilization. The most important aspects are the
4. Quality of railway services utilization of infrastructure (5.1) and rolling stock (5.2).
An exploration of factors impacting the utilization of
5. Capacity and utilization rolling stock is also presented.
6. Productivity
7. Financial performance
Appendices
A. Follow-up Audit 2017
B. Structural characteristics
C. Methodology
39 International Benchmark 2014-20185.1 Utilization of the network, trains and stations
High utilization of the network, trains and stations
■ NS’ intensity of utilization of infrastructure, trains and
stations is significantly above average.
■ Characteristics of the core network operated by NS
contribute to this high intensity of utilization:
• High frequencies between large cities
• High population density in the Randstad area
• Low proportion of rural lines
• Strategy to prioritize investing in the effective use
of existing infrastructure rather than expanding.
■ High intensity makes the operation more sensitive to
disruptions. Interaction with other operators on the
same network is mentioned as an important issue.
40 International Benchmark 2014-20185.2 Utilization of the rolling stock - Figures
High utilization of rolling stock
■ NS’ number of seats per train is above average.
■ Train length is limited by infrastructure (platform length during peak
hours) and efficiency considerations (during off peak hours).
■ For productivity of rolling stock the numbers of vehicles are
compared. A vehicle is a loco-hauled passenger car or a car in a
multiple unit. This is a proxy for capacity and for the invested capital.
■ NS has a relatively low number of vehicles and utilizes a relatively
low number of vehicles and vehiclekm per passengerkm. This
indicates a high level of productivity of the rolling stock, both in
capital costs and operational costs.
■ NS however still ranks highest at customer satisfaction on seating
capacity, indicating an effective allocation of rolling stock, matching
supply and passenger demand.
41 International Benchmark 2014-20185.2 Utilization of the rolling stock– Factors of influence
Factors influencing utilization of rolling stock
■ Factors driving rolling stock productivity are:
• Occupancy ratio of seats
• Even demand pattern (geographical distribution and peak hour percentage)
• Timetable (system speed and diagramming)
• Rolling stock availability
■ The demand pattern of NS is relatively beneficial for productivity:
• Peak / off-peak hour demand ratio is lower at some other peers
• Demand is geographically evenly spread between multiple centres (large cities), whereas some
other peers have peak hour traffic that is highly concentrated along one center.
■ Some factors that have made rolling stock productivity challenging for NS are:
• Strong growth of passenger numbers in peak hour
• Temporarily large reserve of older fleet as a backup during introduction of new rolling stock
42 International Benchmark 2014-2018Index
Content
Summary 6. Productivity
1. Introduction, context and methodology 6.1 Train staff productivity
6.2 Rolling stock productivity
2. Peer group
3. Attractive product for passengers The most important cost categories for train operators
are the costs for rolling stock and train staff. Therefore
4. Quality of railway services this chapter compares the productivity of train staff
(6.1) and rolling stock (6.2). It also provides an overview
5. Capacity and utilization of the main factors impacting these productivity
indicators (e.g. system speed, timetable design, etc.)
6. Productivity Chapter 7 expands this with an evaluation of the
financial performance.
7. Financial performance
Appendices
A. Follow-up Audit 2017
B. Structural characteristics
C. Methodology
43 International Benchmark 2014-20186.1 Train staff productivity - Drivers
NS productivity of drivers is above average. Most peers show a declining productivity.
NS’ driver productivity is above average, both in terms
of trainkm per driver and driving hours per driver.
■ Driver productivity is impacted by: system speed,
labour hours, training hours and the efficiency of
planning.
■ Differences between the two comparisons are
caused by differences in system speed.
■ Both graphs have been harmonized for differences
in contract hours per week.
■ Most peers show decreasing driver productivities.
Increased training capacity is cited as a cause.
■ For NS, main factors are:
• Training of a significant amount of new drivers
• Training of drivers for new rolling stock types
• Increasing non-revenue train kilometers due to
shortage of stabling / inspection capacity.
44 International Benchmark 2014-20186.1 Train staff productivity – Train guards
Productivity of NS train guards is around average. Large differences in staff deployment policies
■ NS’ train guard productivity (guards per
passengerkm) is around average and stable.
■ Main factors impacting this productivity are:
• Staff deployment policy (number of guards per
train)
• Train utilization (passengers / train)
• System speed
• Roster efficiency (contractual rules, planning
software, timetable vs. network topology)
■ Peers with a higher guard productivity (Op1 and
Op2) do not have train guards on every train.
■ NS has a relatively high number of guards per
trainkilometer, to ensure personal security.
45 International Benchmark 2014-20186.2 Rolling stock productivity
NS has a high rolling stock utilization ratio, while retaining a high level of customer satisfaction
■ NS ranks first in rolling stock utilization, both with
respect to passengerkm per seat and vehiclekm per
vehicle.
■ Factors impacting rolling stock productivity are:
• Demand pattern (peak/off-peak, geographical)
• Timetable structure and system speed
• Rolling stock availability (efficient and effective
maintenance)
■ One operator has a higher number of passengerkm
per seat, but this is associated with overcrowding of
trains, resulting in a lower customer satisfaction on
seating capacity.
46 International Benchmark 2014-2018Index
Content
Summary 7. Financial performance
1. Introduction, context and methodology 7.1 Introduction relevant factors and flows
7.2 Operator revenues
2. Peer group
7.3 Net costs
3. Attractive product for passengers
7.4 Track access charges
4. Quality of railway services
5. Capacity and utilization A complete comparison of the financial performance of
each operator should include all relevant factors and
6. Productivity flows. These factors include average fare levels,
contract payments and track access charges (7.1).
7. Financial performance
An overview of financial performance at the level of
operator revenues (7.2) is followed by the net costs per
Appendices operator (7.3) and a comparison of track access charges
A. Follow-up Audit 2017 (7.4).
B. Structural characteristics
C. Methodology
47 International Benchmark 2014-20187.1 Introduction of relevant factors and flows
Financial flows to/from the government and the infrastructure manager vary between peers
■ A comparison of financial performance should include all relevant financial flows.
■ The total ticket revenues (1) divided by the total number of passengerkilometers indicates the cost
level for passengers.
■ The total operating subsidies (2) minus the concession premium (3) and minus the track access
charges (4) indicates the total level of net public funding for the passenger train operator.
■ The sum of ticket revenues (1) and net public funding (2. – 3. – 4.) indicates the net costs of the
passenger train operator.
■ The sum of operating subsidies (2) and infra management subsidies (5) minus concession premium
(3) is a measure for the total public funding of the railway industry. Due to differences in
operational situation (e.g. multiple passenger and freight operators) this comparison can not be
included in this benchmark.
■ The scope for this operations funding excludes funding of investments (e.g. infrastructure, stations
and/or rolling stock).
■ All financial comparisons are in current price levels, excluding VAT and corrected for purchasing
power parities as described in Appendix C.
Government 3. Concession
5. Infra management premium
subsidies 2. Operating
subsidies
Infrastructure Passenger
Manager 4. Track access Train Operator 1. Ticket revenues
Charges
48 International Benchmark 2014-20187.2 Operator revenues
NS’ passenger fares are above average, while NS has below average net public funding
■ NS’ ticket revenues per kilometer are above the
average of the peer group.
■ Ticket revenues include direct ticket sales to
passengers and large volume contracts (e.g.
public transport contract for students).
■ Most peers show a gradual increase of passenger
fares, mainly due to inflation levels and/or
increases in track access charges.
■ Average ticket prices and the net public funding
show a negative correlation; lower ticket prices
correspond with higher levels of subsidies .
■ Net public funding for NS is below the average of
the peer group; NS pays both infrastructure
charges and a concession premium. The student
transport contract has an impact on the level of
this concession premium.
■ Most other operators receive net public subsidies.
In the Netherlands this is the case for regional
lines, that are out of scope for this benchmark.
■ Operator 6 in this comparison pays a higher level
of concession premium, resulting in higher prices
for the passengers.
49 International Benchmark 2014-20187.3 Net costs
NS’ net costs of operation per passengerkm are below the average of the peer group
■ Differences in financial methodology and scope make
comparison complicated:
• NS finances its investments, while some other
operators receive capital subsidies.
• NS has relatively new rolling stock, resulting in
higher depreciation.
• NS has a wider scope of activities than most other
operators (e.g. timetable development)
■ The first graph evaluates net costs of operation: ticket
revenues + subsidies - the concession fee and track
access charges.
■ NS net costs of operation per passengerkm are
significantly below the average of the peer group and
stable, indicating an efficient operation.
■ The lower net cost of Op1 is attributed to differences in
investments in infrastructure and the division of costs
between operator and infrastructure manager. The
comparable cost level is therefore slightly higher.
■ Significant cost increases are generally attributed to
procurement of new rolling stock.
■ NS’ operational costs from the profit/loss account are
also below average. However there is only a weak
relationship between the two comparisons.
50 International Benchmark 2014-20187.4 Track access charges
Track access charges are relatively low, incentivizing growth in supply of train services
■ The peer group shows a wide variety in the levels
of track access charges.
■ Track access charges in the Netherlands are
relatively low compared with these of peers.
■ Low track access charges incentivize supply of
train services, leading to a more attractive public
transport offering.
■ Compared to the peers, NS pays a relatively high
fee for the concession and track access surcharge
for the use of the high speed line.
■ There is a relationship (to a certain extent)
between track access charges and subsidies:
operators with high track access charges often
receive a high level of subsidies as well.
51 International Benchmark 2014-2018Index
Content
Summary
1. Introduction, context and methodology
2. Peer group
3. Attractive product for passengers
4. Quality of railway services
5. Capacity and utilization
6. Productivity
7. Financial performance
Appendices
A. Follow-up Audit 2017
B. Structural characteristics
C. Methodology
55 International Benchmark 2014-2018Appendix A. Follow-up of the benchmark audit in 2017
■ The International Benchmark of 2016 was audited in 2017 by Kennisinstituut voor Mobiliteitsbeleid.
This audit made the following recommendations:
1. Provide more explanation of differences to serve as input for learning and implementing the
lessons.
2. Be careful to draw conclusions, given the complex contexts, outliers, etc.
3. Divide the report in separate NS and ProRail parts to improve clarity and readability.
4. Focus on topics that are relevant to policy making and that are possible to influence.
■ This benchmark study followed up on these recommendations by:
1. Focusing more on context and explanations (less graphs, more text)
2. Being cautious in drawing conclusions and providing more background information from the
discussions with the peers.
3. Dedicating this report to NS findings alone. ProRail makes a separate report. Both reports will be
summarized in a joint report, with special focus on highlights and joint performance.
4. This report focuses on key performance areas, such as punctuality, customer satisfaction and
productivity. It also provides in-depth considerations about train cancellations and the
development of customer satisfaction.
53 International Benchmark 2014-2018Index
Content
Summary
1. Introduction, context and methodology
2. Peer group
3. Attractive product for passengers
4. Quality of railway services
5. Capacity and utilization
6. Productivity
7. Financial performance
Appendices
A. Follow-up Audit 2017 B1. Network of operators DSB, Greater Anglia and NMBS
B2. Network of operators NS, SBB and West Midlands
B. Structural characteristics
B3. Characteristics: station density,
C. Methodology passengers per station and system speed
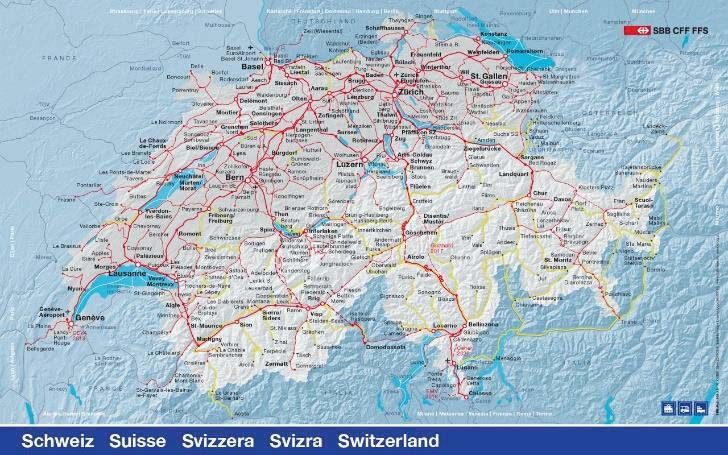
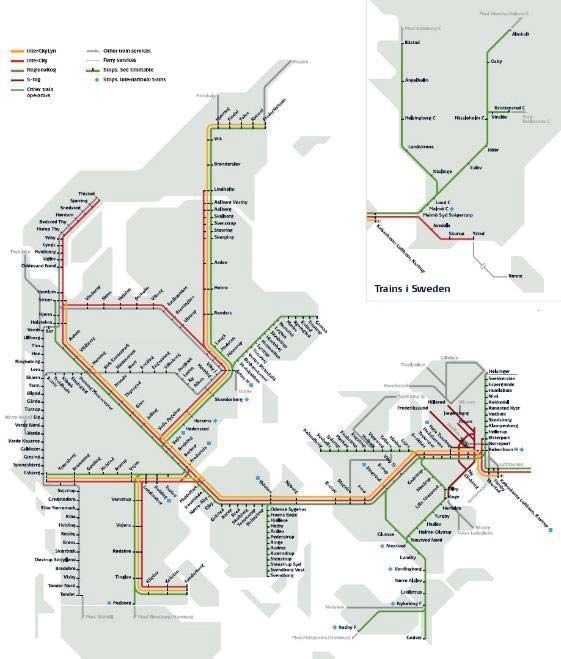
55 International Benchmark 2014-2018Appendix B1. Structural characteristics of the peer group
■ DSB operates a network with a strong East-
West axis. In the West the traffic is
concentrated to and from Copenhagen. It
operates less rural lines than average, since
these are tendered out by the Danish
government. The network length is around
67% of the network operated by NS.
■ Greater Anglia operates a network around
London, with mainly commuter rail, but
also some intercity lines. Traffic is strong
London centric. The network length is
around 75% of the network operated by
NS.
■ NMBS operates a network with a strong
East-West axis and a strong North-South
axis. Peak hour traffic is concentrated to
and from Brussels. The number of stations
is relatively high. The network length is
around 67% higher than that of the
network operated by NS.
55 International Benchmark 2014-2018You can also read