KBC Group / Bank Debt presentation August 2016 - Kbc.com
←
→
Page content transcription
If your browser does not render page correctly, please read the page content below
KBC Group / Bank
 Debt presentation
 August 2016

More infomation: www.kbc.com
KBC Group - Investor Relations Office – Email: investor.relations@kbc.com

                                                                            1
Important information for investors
This presentation is provided for informational purposes only. It does not constitute an offer to sell or the solicitation to buy any
security issued by the KBC Group.
KBC believes that this presentation is reliable, although some information is condensed and therefore incomplete. KBC cannot be
held liable for any loss or damage resulting from the use of the information.
This presentation contains non-IFRS information and forward-looking statements with respect to the strategy, earnings and capital
trends of KBC, involving numerous assumptions and uncertainties. There is a risk that these statements may not be fulfilled and
that future developments differ materially. Moreover, KBC does not undertake any obligation to update the presentation in line
with new developments.
By reading this presentation, each investor is deemed to represent that it possesses sufficient expertise to understand the risks
involved.
22Q 2016 key takeaways for KBC Group
STRONG BUSINESS PERFORMANCE IN 2Q16
Exceptionally good net result of 721m EUR in 2Q16 (and 1.11bn EUR in 1H16), as a result of:
o Strong commercial bank-insurance franchises in our core markets and core activities
o Q-o-q increase in customer loan and deposit volumes in most of our core countries
o Slightly higher net interest income despite somewhat lower net interest margin q-o-q
o Higher net fee and commission income q-o-q (in line with guidance), despite net asset management outflows
o Higher net gains from financial instruments at fair value, higher realised AFS gains (mainly on Visa) and lower net other income
o Combined ratio of 95% YTD. Excellent sales of both non-life and life insurance products
o Good cost management resulted in a cost/income ratio of 56% YTD adjusted for specific items
o Low impairment charges. Net loan provision release of 1m EUR in 2Q16 in Ireland. We are lowering our impairment guidance for Ireland
towards a 0m-40m EUR range for FY16
SOLID CAPITAL AND ROBUST LIQUIDITY POSITIONS
o Common equity ratio (B3 phased-in) of 14.9% based on the Danish Compromise at end 1H16, which clearly exceeds the new minimum
capital requirements set by the ECB (9.75%) and the NBB (0.5%), i.e. an aggregate 10.25% for 2016. The B3 fully loaded common equity
ratio stood at 14.9% based on the Danish Compromise at end 1H16
o KBC remains adequately capitalised under 2016 EU-wide EBA stress test
o Fully loaded B3 leverage ratio, based on current CRR legislation, amounted to 6.0% at KBC Group
o Continued strong liquidity position (NSFR at 123% and LCR at 132%) at end 1H16
o Interim dividend:
o KBC will pay an interim dividend of 1 EUR per share in November 2016, as an advance payment on the total dividend.
o This is the start of an interim dividend policy whereby KBC aims to pay each year an interim dividend of 1 EUR per share*
o The current pay-out ratio policy (i.e. dividend + AT1 coupon) of at least 50% of consolidated profit is confirmed
* More details on slide 44
3Contents
1 Strategy and business profile
2 Financial performance
3 Asset quality
4 Solvency and liquidity
5 MREL strategy
6 2Q16 Wrap up
Appendices
4Well-defined core markets provide access to ‘new growth’ in
Europe
MARKET SHARE (END 2015)
BE CZ SK HU BG
KBC Group’s core markets 21% 19%
Loans and 11% 10%
and Ireland deposits 3%
Investment 40%
26% 18%
funds 7%
NETHERLANDS
IRELAND Life 17%1
UK 12%
insurance 7% 4% 4%
BELGIUM GERMANY 9% 10%
Non-life 7% 5%
3%
CZECH REP insurance
SLOVAKIA
REAL GDP GROWTH OUTLOOK
FRANCE HUNGARY FOR CORE MARKETS2
BE CZ SK HU BG
% of 70%
Assets 15% 3% 3% 1%
BULGARIA
4.3% 3.6% 2.9% 3.0%
ITALY 2015 1.4%
SPAIN
PORTUGAL
Macroeconomic outlook 2.5% 3.3%
2.0% 2.4%
GREECE 2016e 1.2%
Based on GDP, CPI and unemployment trends
Inspired by the Financial Times
3.6% 2.9% 2.6%
1.2% 2.3%
2017e
1. Excluding group insurance. Including group insurance, market share of life insurance amounted to 13% at the end of 2015
2. Source: KBC data, August 2016
5Group’s legal structure and issuer of debt instruments
KBC Group NV
AT 1
Tier 2
Wholesale EMTN
100% 100%
48%
52%
KBC Bank KBC Asset Management KBC Insurance
Covered bond No public issuance No public issuance
KBC IFIMA*
Retail and Wholesale EMTN
* All debt obligations of KBC IFIMA are unconditionally and irrevocably guaranteed by KBC Bank.
6Overview of key financial data at 2Q 2016
KBC Group KBC Bank KBC Insurance
Market cap (10/08/16): EUR 20bn Net result 1H 2016: EUR 1.0bn1 Net result 1H 2016: EUR 123m
Net result 1H 2016: EUR 1.1bn Total assets: EUR 230bn Total assets: EUR 38bn
Total assets: EUR 266bn Total equity: EUR 14bn Total equity: EUR 3bn
Total equity: EUR 16bn CET1 ratio (Basel 3 transitional): 13.5% Solvency II ratio: 187%
CET1 ratio (Basel 3 transitional): 14.9% CET1 ratio (Basel 3 fully loaded): 13.6% Combined operating ratio 1H16: 95%
CET1 ratio (Basel 3 fully loaded): 14.9% C/I ratio 1H 2016: 60%2
Credit Ratings of KBC Bank (KBC Group) as at 1 August 2016
S&P Moody’s Fitch
Long-term A (Negative) A1 (Stable) A- (Positive)
(KBC Group) BBB+ (Stable) Baa1 (Stable) A- (Positive)
Short-term A-1 Prime-1 F1
1. Includes KBC Asset Management ; excludes holding company eliminations
2. Adjusted for specific items, the C/I ratio amounted to c.56% in 2Q 2016
7Overview of KBC Group
STRONG BANK-INSURANCE GROUP PRESENT WITH LEADING MARKET POSITIONS IN ITS CORE GEOGRAPHIES
(BELGIUM AND CEE)
• A leading financial institution in both Belgium and the Czech Republic
• Business focus on Retail, SME & Midcap clients
• Unique selling proposition: in-depth knowledge of local markets and profound relationships with clients
INTEGRATED BANK-INSURANCE BUSINESS MODEL, LEADING TO HIGH CROSS-SELLING RATES
• Strong value creator with good operational results through the cycle
• Integrated model creates cost synergies by avoiding overlap of supporting entities and generates added value for our clients
through a complementary and optimised product and service offering
8Business profile: KBC is a leading player in Belgium and
its 4 core countries in CEE
BREAKDOWN OF ALLOCATED CAPITAL BY BUSINESS
UNIT AT 30 June 2016
CFO SERVICES
Czech Republic
CRO SERVICES
15%
Belgium 62%
CZECH INTERNATIONAL
BELGIUM
REPUBLIC MARKETS 19% International
Markets
4%
CORPORATE STAFF Group Centre
* Covers inter alia impact own credit risk and results of holding
company
9KBC Group going forward:
To be among the best performing retail-focused institutions in Europe
KBC wants to be among Europe’s best performing retail-focused financial
institutions. This will be achieved by:
• Strengthening our bank-insurance business model for retail, SME and mid-cap
clients in our core markets, in a highly cost-efficient way
• Focusing on sustainable and profitable growth within the framework of solid
risk, capital and liquidity management
• Creating superior client satisfaction via a seamless, multi-channel, client-centric
distribution approach
By achieving this, KBC wants to become the reference in bank-insurance
in its core markets
10Summary of the financial targets at KBC Group level as
announced at our investor day in June 2014
Targets… by…
CAGR total income (‘13-’17)1 ≥ 2.25% 2017
CAGR bank-insurance gross income (‘13-’17) ≥ 5% 2017
C/I ratio ≤ 53% 2017
Combined ratio ≤ 94% 2017
Common equity ratio ≥ 10.25%2 2016
(phased-in, Danish compromise)
Total capital ratio ≥ 17% 2017
(fully loaded, Danish compromise)
NSFR ≥ 105% 2014
LCR ≥ 105% 2014
Dividend payout ratio ≥ 50% 2016
Based on adjusted figures
1. Excluding marked-to-market valuations of ALM derivatives
2. 2016 minimum phased-in CET1 ratio of 10.25% set by the ECB (9.75% minimum CET1) in combination with NBB’s systemic buffer (0.5% minimum in 2016, gradually
increasing over a 3-year period and reaching 1.5% in 2018) under the Danish compromise
11Contents
1 Strategy and business profile
2 Financial performance
3 Asset quality
4 Solvency and liquidity
5 MREL strategy
6 2Q16 Wrap up
Appendices
12Earnings capacity
CONTRIBUTION OF BANKING ACTIVITIES
TO KBC GROUP NET RESULT1,2
903
765 644
NET RESULT1 564 524
412 358
448
2 639
765 -310
1 860 1 762 1Q15 2Q15 3Q15 4Q15 1Q16 2Q16
1 113 Impact Financial Holding Goodwill impairments
1 015
612
2 218
13 CONTRIBUTION OF INSURANCE ACTIVITIES
TO KBC GROUP NET RESULT1,2
-344 121
Impact Financial Holding
121
Goodwill impairments 73 75
79
33
62 22
50 44 48
-2 466 89 31 83
59 48 44
FY09 FY10 FY11 FY12 FY13 FY14 FY15 1H16 27
1 -19 -21 -9
-41 -30
-34
1Q15 2Q15 3Q15 4Q15 1Q16 2Q16
1 Note that the scope of consolidation has changed over time, due partly to divestments
Non-life result Non-technical & taxes
2 Difference between the net result at KBC Group and the sum of the banking and insurance
contribution are the holding-company/group items 13
Life result Goodwill imprairments
Amounts in m EURSlightly higher net interest income and slightly lower net interest
margin
Amounts in m EUR
NII
1 091 1 092 1 062 1 066 1 067 1 070
Net interest income
31 2 19 4 10 1 8 2 • Slightly up q-o-q and down by 2% y-o-y
163 162 22 157 154 156 154
• The slight q-o-q increase was driven primarily by:
o lower funding costs
900 906 888 898 903 914
o additional rate cuts on savings accounts
o higher upfront prepayment fees
o continued good volume growth in current accounts and loans
-3 -2 -1 o further positive effect of enhanced ALM management
1Q15 2Q15 3Q15 4Q15 1Q16 2Q16 almost fully offset by:
NII - dealing room NII - Insurance o lower reinvestment yields
NII - Holding-company/group NII - Banking o hedging losses on previously refinanced mortgages
o pressure on commercial loan margins in most core countries
NIM o a decrease of 9m EUR in NII from the dealing room
2.10% 2.06%
1.99% 1.95% 1.96% 1.94% Net interest margin (1.94%)
• Down by 2 bps q-o-q and by 12 bps y-o-y
• Q-o-q decrease is due to lower reinvestment yields, pressure on
commercial loan margins in most core countries and hedging losses on
previously refinanced mortgages partly offset by rate cuts on savings
accounts and lower funding costs
1Q15 2Q15 3Q15 4Q15 1Q16 2Q16 Customer deposit volumes excluding debt
VOLUME TREND certificates & repos +3% q-o-q and +4% y-o-y
Excluding FX effect Total loans ** Of which mortgages Customer deposits*** AuM Life reserves
Volume 131bn 56bn 171bn 207bn 28bn
Growth q-o-q* +1% +1% +4% 0% 0%
Growth y-o-y +4% +4% +6% +2% 0%
* Non-annualised
** Loans to customers, excluding reverse repos (and bonds) 14
*** Customer deposits, including debt certificates but excluding reposHigher net fee and commission income
(in line with guidance)
Net fee and commission income
F&C • Up by 4% q-o-q and down by 23% y-o-y
• Q-o-q increase was the result chiefly of:
459 465
383 371
o higher management fees from mutual funds & unit-
346 360
linked life insurance products (thanks to reset date CPPI)
o higher fees from credit files and bank guarantees (due to
518 530
453 445 422 432 more mortgage refinancings in BE, CZ and Slovakia)
o higher fees from payment services in the Czech Republic
-59
and Hungary
-1 -64 -1
-69
-4
-70 -76 -1
-71
o lower commissions paid on insurance sales
1Q15 2Q15 3Q15 4Q15 1Q16 2Q16
partly offset by:
F&C - insurance contribution F&C - contribution of holding-company/group o lower entry fees from mutual funds & unit-linked life
F&C - banking contribution insurance products
o lower securities related fees in Belgium
Amounts in m EUR
• Y-o-y decline resulted chiefly in the Belgium Business Unit
from lower management and entry fees from mutual funds
AuM and unit-linked life insurance products, lower fees from
securities transactions, lower fees from credit files and bank
guarantees and higher commissions paid on insurance sales
208 204 209 207 207
200 • Net F&C income will remain an important top-line
contributor going forward
Assets under management (207bn EUR)
• Flat q-o-q as a result of net outflows (-1%) and a positive
price effect (+1%)
1Q15 2Q15 3Q15 4Q15 1Q16 2Q16 • Rose by 2% y-o-y owing to net inflows (+2%) and
a negative price effect (-1%)
15
Amounts in bn EUROperating expenses down, due entirely to lower bank taxes
OPERATING EXPENSES Cost/income ratio (banking) adjusted for specific
1 186
items* at 56% in 2Q16 and YTD
1 125 • Operating expenses excluding bank tax stabilised q-o-q
as higher marketing expenses were offset by lower staff
264 941 962 335 expenses
49 904
83 862
21 51
• Operating expenses without bank tax decreased by 1%
861 858 914 851 853 y-o-y due mainly to lower staff expenses, lower
841 headquarter costs and lower costs at companies in run-
down, despite higher ICT expenses
1Q15 2Q15 3Q15 4Q15 1Q16 2Q16
Bank tax Operating expenses
• Pursuant to IFRIC 21, certain levies (such as
EXPECTED BANK TAX SPREAD contributions to the European Single Resolution Fund)
have to be recognised in advance, and this adversely
TOTAL Upfront Spread out over the year
impacted the results for 1Q16. In 2Q16, the Belgian
2Q16 1Q16 2Q16 1Q16 2Q16 3Q16e 4Q16e government replaced the 4 existing taxes by 1, which
led to 38m EUR additional bank taxes in Belgium, partly
BU BE 32 241 32 0 0 0 0 offset by the ability to book 6m EUR of the ESRF
BU CZ -1 28 -1 0 0 0 0 contribution as a non-P&L item
Hungary 19 31 0 17 19 20 25
• Total bank taxes (including ESRF contribution) are
Slovakia 1 6 -2 3 3 3 3 expected to increase from 417m EUR in FY15 to 440m
2 1 1 0 1 0 0
EUR in FY16
Bulgaria
Ireland 1 2 0 1 1 1 2
GC -3 5 -3 0 0 0 0
* See glossary (slide 80) for the exact definition
TOTAL 51 314 27 22 24 23 30
16
Amounts in m EURLow asset impairments, excellent credit cost ratio and
decreased impaired loans ratio
ASSET IMPAIRMENT
472
Higher impairment charges q-o-q from the
149
unsustainable low level in 1Q16
11 344 • In 2Q16, a parameter adjustment was made to the IBNR-
77 50 models. This resulted in a increase of impairments by roughly
71 25m EUR (of which 18m EUR in the Belgium BU, 6m in the Czech
4 138 49 21
73 15 78 28 BU and 1m in Bulgaria)
50
34
4
25 • The q-o-q increase in loan loss provisions was attributable
1Q15 2Q15 3Q15 4Q15 1Q16 2Q16
mainly to:
GW impairments Other impairments Impairments on L&R
o a 25m EUR increase due to IBNR parameter changes
o lower reversals
despite:
CREDIT COST RATIO o low gross impairments in all segments in Belgium and the
1.21% Czech Republic
1.11%
0.91%
0.82%
0.71% • Impairment of
0.42% o 20m EUR on AFS shares (entirely in Belgium)
0.23%
0.07%
FY09 FY10 FY11 FY12 FY13 FY14 FY15 1H16
The credit cost ratio only amounted to 0.07% in 1H16
IMPAIRED LOANS RATIO due to low gross impairments and some releases
9.6% 9.3% 9.0% 8.6% 8.2% 7.8%
The impaired loans ratio dropped further to 7.8%
5.5% 5.3% 5.2% 4.8% 4.7% 4.4%
1Q15 2Q15 3Q15 4Q15 1Q16 2Q16
17
Impaired loan ratio of which over 90 days past dueOverview of results based on business units
NET PROFIT – BELGIUM NET PROFIT – CZECH REPUBLIC
1H16 ROAC: 20% 1H16 ROAC: 45%
1 570 1 515 1 564 581 554
528 542
1 360
767 706 264
812 275 251 271
630
320
579
730 803 858 317 279 277 271
703
2012 2013 2014 2015 1H16 2012 2013 2014 2015 1H16
2H 1H 2H 1H
NET PROFIT – NET PROFIT – INTERNATIONAL
INTERNATIONAL MARKETS MARKETS EXCL. IRELAND
1H16 ROAC: 22%
1H16 ROAC: 19%
245
183 232
153
21 92
-56 144 139 140
-203 130
-204
-182 104 103
-260 -743 101 92
40 36
-104
-110
-853 -3
2012 2013 2014 2015 1H16 2012 2013 2014 2015 1H16
2H 1H 2H 1H
Amounts in m EUR 18Contents
1 Strategy and business profile
2 Financial performance
3 Asset quality
4 Solvency and liquidity
5 MREL strategy
6 2Q16 Wrap up
Appendices
19Balance sheet
(KBC Group consolidated at 30 June 2016)
Total assets Total liabilities and equity
(EUR 266bn) (EUR 266bn)
Credit quality 131 145
Capital adequacy &
liquidity position
50 16
30
21
13 20
12 12
10
39 33
Customer deposits
Loan book (loans and advances to customers)
Equity
Bank investment portfolio
Other funding (excl. interbank deposits)
Insurance investment portfolio
Technical provisions,
Insurance investment contracts
before reinsurance
Trading assets
Liabilities under insurance
Other (incl. interbank loans, investment contracts
intangible fixed assets..)
Trading liabilities
20
Other (incl. interbank deposits)Impaired loans ratios of KBC Group and per Business Unit,
incl. of which over 90 days past due
KBC GROUP CUSTOMER LOAN BOOK: EUR 131bn at 30-06-2016
9.6% 9.3% (LARGELY SOLD THROUGH OWN BRANCHES)
9.0% 8.6% 8.2% 7.8%
44% 43%
5.5% 5.3% 5.2% 4.8% 4.7% 4.4%
13% Total retail = 56%
Residential mortgages SME/Corporate loans
1Q15 2Q15 3Q15 4Q15 1Q16 2Q16
Other retail loans
BELGIUM BU CZECH REPUBLIC BU INTERNATIONAL MARKETS BU
4.2% 4.1% 4.0% 3.7% 33.4% 32.9%
3.8% 3.7% 3.5% 3.4% 3.4% 31.4% 29.8%
3.6% 3.2% 28.9% 27.8%
2.8%
2.5% 2.7% 2.6% 2.5% 2.5% 2.4%
2.4% 2.4% 2.2% 2.2% 2.0% 2.2% 18.4% 17.9% 17.0% 16.0% 15.4%
14.8%
1Q15 2Q15 3Q15 4Q15 1Q16 2Q16 1Q15 2Q15 3Q15 4Q15 1Q16 2Q16 1Q15 2Q15 3Q15 4Q15 1Q16 2Q16
Impaired loans ratio * of which over 90 days past due **
* Impaired loans ratio : total outstanding impaired loans (PD 10-12)/total outstanding loans
** of which total outstanding loans with over 90 days past due (PD 11-12)/total outstanding loans 21Cover ratios
KBC GROUP BELGIUM BU
60.3% 60.8% 61.5% 58.3% 60.4% 60.0% 59.7%
57.6% 57.8% 57.9% 57.6% 56.5%
43.9% 44.8% 45.4% 45.5% 43.4% 43.6% 44.0% 44.7% 44.8%
42.4% 42.9% 42.5%
1Q15 2Q15 3Q15 4Q15 1Q16 2Q16 1Q15 2Q15 3Q15 4Q15 1Q16 2Q16
Impaired loans cover ratio *
Cover ratio for loans with over 90 days past due **
CZECH REPUBLIC BU INTERNATIONAL MARKETS BU
67.1% 66.6% 67.1% 65.1% 58.1% 59.4% 60.0%
63.2% 62.6% 54.5% 55.2% 55.6%
54.2% 53.6% 54.2% 56.1%
52.9% 53.4%
43.0% 44.0% 44.7%
39.8% 40.4% 41.7%
1Q15 2Q15 3Q15 4Q15 1Q16 2Q16 1Q15 2Q15 3Q15 4Q15 1Q16 2Q16
* Impaired loans cover ratio: total impairments (specific) for impaired loans / total outstanding impaired loans (PD10-12)
** Cover ratio for loans with over 90 days past due: total impairments (specific) for loans with over 90 days past due / total outstanding PD11-12 loans
22Loan loss experience at KBC
1H16 FY15 FY14 FY13 FY 2012 AVERAGE
CREDIT COST RATIO CREDIT COST RATIO CREDIT COST RATIO CREDIT COST RATIO CREDIT COST RATIO ‘99 –’15
Belgium 0.07% 0.19% 0.23% 0.37% 0.28% n/a
Czech
0.09% 0.18% 0.18% 0.26% 0.31% n/a
Republic
International
0.03% 0.32% 1.06% 4.48%1 2.26% n/a
Markets
Group Centre 0.29% 0.54% 1.17% 1.85% 0.99% n/a
Total 0.07% 0.23% 0.42% 1.21%2 0.71% 0.52%
Credit cost ratio: amount of losses incurred on troubled loans as a % of total average outstanding loan portfolio
1 The high credit cost ratio at the International Markets Business Unit is due in full to KBC Bank Ireland. Excluding Ireland, the CCR at this business unit amounted to 108 bps in FY13
2 Credit cost ratio amounted to 1.21% in FY13 due to the reassessment of the loan books in Ireland and Hungary
23Limited trading activity at KBC Group
BREAKDOWN ACCORDING TO RWA*
30-06-2016
Market risk
3%
Operational risk
12%
Credit risk 75%
10%
Insurance activity
* RWA on fully loaded basis and under Danish Compromise
24Investment portfolio (as per 30/06/2016)
INVESTMENT PORTFOLIO
(Total EUR 70bn)
Equities Other
SOVEREIGN BOND PORTFOLIO
Non-Financial bonds (Carrying value1 EUR 54bn)
2% 2%
5% (Notional value EUR 49bn)
Covered bonds
Netherlands * Ireland **
7% Austria * Portugal *
ABS Germany *
2% Spain
Financial bonds 6%
3%
Other
8%
6% 39%
Other public bonds
France 11%
5% Belgium
73% Italy
Sovereign bonds 6%
Slovakia 4% 13%
2%
Hungary
Czech Rep.
Poland **
(*) 1%, (**) 2%
1 Carrying value is the amount at which an asset [or liability] is recognised: for those not valued at fair value this is after deducting any accumulated depreciation
(amortisation) and accumulated impairment losses thereon, while carrying amount is equal to fair value when recognised at fair value
25Contents
1 Strategy and business profile
2 Financial performance
3 Asset quality
4 Solvency and liquidity
5 MREL strategy
6 2Q16 Wrap up
Appendices
26Strong capital position
BASEL 3 CET1 RATIO AT KBC GROUP BASED ON THE DANISH
COMPROMISE
15.2% 14.9% Common equity ratio (B3 phased-in) of
14.6%
13.7% 14.9% based on the Danish Compromise at
13.3% end 1H16, which clearly exceeds the
11.4% minimum capital requirements set by the ECB
(9.75%) and the NBB (0.5%), i.e. an aggregate
10.25% for 2016
10.25% regulatory
minimum (phased-in)
for 2016
14.9% 14.6% 14.9%
13.2% 14.0% As announced by the NBB the systemic buffer
11.7% (CET1 phased-in of 0.5% in 2016 under the
Danish Compromise) will gradually increase
over a 3-year period, reaching 1.5% in 2018.
A pro forma fully loaded minimum common
equity ratio translation to 11.25% was clearly
exceeded with a fully loaded B3 common
1Q15 1H15 9M15 FY15 1Q16 1H16 equity ratio of 14.9% based on the Danish
Compromise at end 1H16
Fully loaded Phased-in
Total distributable items (under Belgian GAAP) KBC Group 6.9bn EUR, of which:
• available reserves 1.3bn EUR
• accumulated profits (losses) 5.6bn EUR
27Fully loaded Basel 3 leverage ratio
Fully loaded Basel 3 leverage ratio at KBC Bank
5.1% 5.4% 5.1%
4.9% 4.8% 4.8% 5.0%
Fully loaded B3 leverage ratio, based on the
FY14 1Q15 1H15 9M15 FY15 1Q16 1H16
current CRR legislation (which was adapted
during 4Q14):
• 5.1% at KBC Bank consolidated level
Fully loaded Basel 3 leverage ratio at KBC Group • 6.0% at KBC Group level
6.3% 6.0%
5.9%
5.4% 5.6%
5.1% 5.2%
FY14 1Q15 1H15 9M15 FY15 1Q16 1H16
28Solid liquidity position (1)
KBC Bank continues to have a strong retail/mid-cap deposit base in its core markets – resulting in a stable
funding mix with a significant portion of the funding attracted from core customer segments & markets
3% 3% 6% 3% 4% 5%
6% 100%
8% 5% 0% 2% 2% 2%
9% 9%
5% 8% 10% 8% 8%
7%
8% 7% 8% 8%
8% 9% 8% 9% 8%
6% 1%
8% 9% 3% 2% 3% 3%
7%
3%
7%
20%
74%
73% 75% 73% 73% 74% customer
70% 69% 71%
64% driven
Retail and SME
Mid-cap
-4%
Debt issues in retail network
FY09 FY10 FY11 FY12 FY13 FY14 FY15 1H16
Government and PSE
Net unsecured interbank funding Total equity
Net secured funding Certificates of deposit
Debt issues placed with institutional investors Funding from customers
29Solid liquidity position (2)
Short term unsecured funding KBC Bank vs Liquid assets as of end June 2016 (*)
(bn EUR)
68,6
65,0 62,9
376% 58,5 58,3 KBC maintains a solid liquidity position, given that:
362% • Available liquid assets are almost 3 times the amount of
352%
306% the net recourse on short-term wholesale funding
278% • Funding from non-wholesale markets is stable funding
24,70
from core-customer segments in core markets
18,5 17,4 19,04
15,6
2Q15 3Q15 4Q15 1Q16 2Q16
Net Short Term Funding Available Liquid Assets Liquid Assets Coverage
* Graphs are based on Note 18 of KBC’s quarterly report, except for the ‘available liquid assets’ and
‘liquid assets coverage’, which are based on the KBC Group Treasury Management Report
Ratios FY15 1H16 Target NSFR is at 123% and LCR is at 132% by the end of 1H16
• Both ratios were well above the minimum target of at least
NSFR* 121% 123% >105%
105%, in compliance with the implementation of Basel 3
LCR* 127% 132% >105% liquidity requirements
* Liquidity coverage ratio (LCR) is based on the Delegated Act requirements, while the Net
Stable Funding Ratio (NSFR) is based on KBC’s interpretation of current Basel Committee
guidance
30Upcoming mid-term funding maturities
Breakdown Funding Maturity Buckets
(Including % of KBC Group’s balance sheet)
5000
4500 1,6% KBC Group has also successfully issued an inaugural 750m EUR senior
4000 unsecured bond with 5-year maturity in April 2016
Millions EUR
3500 1,2% 1,2%
1,1%
3000
2500
KBC’s credit spreads have narrowed during 2Q16
0,7% 0,7%
2000
0,6%
1500
0,3%
KBC Bank has 6 solid sources of long-term funding:
1000
500 0,1%
• Retail term deposits
0,1%
0 • Retail EMTN
2016 2017 2018 2019 2020 2021 2022 2023 2024 >= 2025 • Public benchmark transactions
Senior Unsecured - Holdco Senior Unsecured - Opco Subordinated T1 Subordinated T2
• Covered bonds
Contingent Convertible Covered Bond TLTRO
• Structured notes and covered bonds using the private placement
format
4%
15% • Senior unsecured, T1 and T2 capital instruments issued at KBC
19% Group level and down-streamed to KBC Bank
Total
outstanding =
7%
20bn EUR
40% 11%
4%
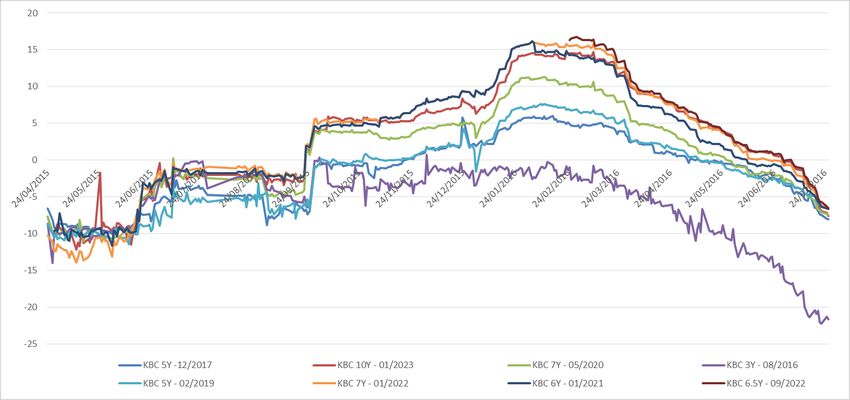
31Credit spreads evolution
Credit Spreads Evolution
240
145
125
190
105
85 140
65
90
45
25
40
5
-15 -10
Dec-13 Apr-14 Aug-14 Dec-14 Apr-15 Aug-15 Dec-15 Apr-16
1
2Y Senior Debt Opco Interpolated 5Y Covered Bond Interpolated 5Y Senior Debt Holdco 10NC5 Subordinated Tier 2
1 10NC5 Subordinated Tier 2 spread is depicted based on the right hand axis.
32Summary covered bond programme (1/2) (details, see Annex 3)
KBC HAS ISSUED 8 SUCCESSFUL BENCHMARK COVERED BONDS AND PRIVATE PLACEMENTS FOR AN AMOUNT
OF 8.06BN EUR
• KBC’s 10bn EUR covered bond programme is rated Aaa/AAA (Moody’s/Fitch)
• CRD and UCITS compliant / 10% risk-weighted
• All issues performed well in the secondary market
KBC’S COVERED BONDS ARE BACKED BY STRONG LEGISLATION AND SUPERIOR COLLATERAL
• Cover pool: Belgian residential mortgage loans
• Strong Belgian legislation – inspired by German Pfandbriefen law
• Direct covered bond issuance from a bank’s balance sheet
• Dual recourse, including recourse to a special estate with cover assets included in a register
• Requires license from the National Bank of Belgium (NBB)
• The special estate is not affected by a bank insolvency. In that case, the NBB can appoint a cover pool administrator to manage
the special estate in issuer ; both monitor the pool on a ongoing basis
• The value of one asset category must be at least 85% of the nominal amount of covered bonds
• The value of the cover assets must at least be 105% of the covered bonds (value of mortgage loans is limited to 80% LTV)
• Maximum 8% of a bank’s assets can be used for the issuance of covered bonds
THE COVERED BOND PROGRAMME IS CONSIDERED AS AN IMPORTANT FUNDING TOOL FOR THE TREASURY
DEPARTMENT
• KBC’s intentions are to be a frequent benchmark issuer if markets permit
33Summary covered bond programme (2/2) (details, see Annex 3)
COVER POOL: BELGIAN RESIDENTIAL MORTGAGE KBC HAS A DISCIPLINED ORIGINATION POLICY
LOANS • 2009 to 2016 residential mortgage loan losses below 4 bp
• Exclusively, this is selected as main asset category • Arrears in Belgium approx. stable over the past 10 years:
• Value (including collections) at least 105% of the (i) Cultural aspects, stigma associated with arrears,
outstanding covered bonds importance attached to owning one’s property
• Branch originated prime residential mortgages (ii) High home ownership also implies that the
predominantly out of Flanders change in house prices itself has limited impact
• Selected cover asset have low average LTV (63%) and high on loan performance
seasoning (45 months) (iii) Well established credit bureau, surrounding
legislation and positive property market
1,4%
1,22%
1,22%
1,20%
1,20%
1,20%
1,20%
1,20%
1,19%
1,19%
1,19%
1,18%
1,18%
1,18%
1,18%
1,17%
1,17%
1,17%
1,17%
1,17%
1,17%
1,17%
1,17%
1,17%
1,16%
1,16%
1,16%
1,16%
1,16%
1,16%
1,16%
1,15%
1,14%
1,14%
1,14%
1,13%
1,13%
1,13%
1,12%
1,12%
1,12%
1,12%
1,12%
1,12%
1,11%
1,11%
1,11%
1,10%
1,09%
1,09%
1,09%
1,09%
1,08%
1,08%
1,08%
1,08%
1,08%
1,06%
1,06%
1,06%
1,06%
1,2%
1,0% Market loans in 3 months arrears KBC loans in 90days arrears KBC loan losses
0,8%
0,56%
0,54%
0,53%
0,52%
0,50%
0,48%
0,440%
0,440%
0,430%
0,44%
0,6%
0,41%
0,41%
0,39%
0,38%
0,33%
0,4%
0,0073%
0,037%
0,0034%
0.015%
0,020%
0,014%
0,013%
0,012%
0,2%
0,0%
34Contents
1 Strategy and business profile
2 Financial performance
3 Asset quality
4 Solvency and liquidity
5 MREL strategy
6 2Q16 Wrap up
Appendices
35KBC Group: Already comfortable bail-in buffer (30/06/2016)
23.0%
3.0% 19.2%
0.8% Also 13.4% on phased-in basis
3.4%
1.9%
1.6% 1.6% 13.5%
7.5%
8.3% 4.5% 0.3%
7.0% 0.7% 7.4%
1.1% 1.2% 0.6%
14.9% 14.9%
1.2% 0.7% 0.3%
1.3% 0.7% 0.3%
0.6% 0.6% 0.6% 0.6%
5.4% 5.4% 5.8% 5.8% 5.7%
as per based on KBC as per based on KBC as per based on KBC based on KBC
regulatory Group HoldCo regulatory Group HoldCo regulatory Group HoldCo Group HoldCo
framework issues only framework issues only framework issues only issues only
Fully loaded Fully loaded Fully loaded Phased-in
TLAC1 as % of RWA TLAC1 as % of Leverage MREL1,2 as % of Liabilities
Other MREL eligible liabilities > 1y Senior unsecured debt T2 eligible TLAC AT1 CET1
1 TLAC: Total loss-absorbing capacity / MREL: Minimum Requirement for own funds and Eligible Liabilities
2 Resolution strategy and the individual institution MREL requirements are subject to the decision of the Single Resolution Board
36KBC Group: Moving towards MREL via HoldCo issues*
TOTAL CAPITAL KBC GROUP MREL AT HOLDCO
CONCEPT 30/06/2016 30/06/2016 UP TO 8% MINIMUM*
(all transitional) (all transitional)
Minimum 17% total capital, 19.3% 7,4% HoldCo Senior
both phased or fully loaded Senior 0,3% up to MREL target
T2 2.8% T2 0,7%
up to total capital
T2 ratio of 17%
(and min. 2%). AT1 1.6% AT1 0,6%
AT1 1.5%
Partly a
flexible internal buffer
communicating
Minimum CET1 vessel with T2
(phased) 11.25% Systemic Buffer (SB)
0.5% for 2016 CET1, AT1
1.5% fully
loaded Joint Capital Decision & T2
2015 CET1 14.9% CET1 5,7%
CET1 9.75%
In % RWA In % Liabilities
KBC Bank has a limited reliance on wholesale funding and has a number of transactions through KBC IFIMA (fully guaranteed subsidiary of KBC Bank) outstanding. Going
forward, KBC will issue public senior unsecured from KBC Group to fulfil MREL needs and use KBC IFIMA issues to supplement remaining wholesale funding needs
37
* Resolution strategy and the individual institution MREL requirements are subject to the decision of the Single Resolution Board.KBC has a diversified holding structure which helps mitigate risks
• Additional Tier 1
• Tier 2
• Senior Unsecured (MREL/TLAC)
(KBC Group)
FY15 net profit*: EUR
1 638m (82%), excl.
impact of Financial FY15 net profit*: EUR
Holding (765m EUR) 100% 100% 354m (18%)
48%
KBC Bank KBC Insurance NV
52%
• Covered bonds • No public issuance
• Senior Unsecured (Funding) KBC Asset Management NV
• No public issuance
KBC’S DIVERSIFIED GROUP STRUCTURE ALLOWS HOLDCO DEBT INVESTORS TO HAVE A CLAIM ON SUBSIDIARIES THAT ARE LESS IMPACTED BY LOSSES (LOWER
CORRELATION BETWEEN ENTITIES) OR THAT ARE EVEN OUTSIDE THE RESOLUTION PERIMETER:
in a case where KBC Bank is fully wiped out by losses, investors in KBC Group will always have a claim on KBC Insurance and on part of KBC Asset Management
In a case where KBC Insurance is fully wiped out by losses, investors in KBC Group will always have a claim on KBC Bank and on part of KBC Asset Management (note that, KBC Insurance
is outside the scope of BRRD)
ISSUING SENIOR UNSECURED FROM KBC GROUP WILL PROVIDE FOR EXTRA CUSHION TO THE SENIOR DEBT INVESTORS AT KBC BANK LEVEL GIVEN THE
SUBORDINATED ON-LOAN
FROM KBC PERSPECTIVE, THE BANK-INSURANCE MODEL (I.E. OUR LONG-TERM STRATEGIC VIEW) IS MAINTAINED IN ALL BUT THE MOST EXTREME
RESOLUTION SCENARIOS
WILL KBC ISSUE FROM OTHER ENTITIES WITHIN THE GROUP?
Recent capital issuances (AT1 & T2) have come from KBC Group – this approach will continue in the future (providing support to potential KBC Group senior creditors)
Covered bonds will continue to be issued by KBC Bank
Senior unsecured from KBC Bank for funding reasons
* Before intragroup / consolidation effects 38KBC has strong buffers cushioning Sr. debt at all levels
Senior issued by KBC Bank, KBC Group Temporary short-term
which will be limited going finance which allowed
To large extent customer- Senior Short-term CDs
forward (for funding repayment of state aid
related, protected as
reasons) 750 1 070 cash-wise as dividends
much as possible
are up-streamed to KBC
Tier 2 Group with a delay
1 680
Additional Tier 1
KBC Bank 1 400
KBC Insurance
Senior Other liabilities Tier 2
3 803 28 345 CET1 (phased)
500
13 125
Tier 2 Parent shareholders equity
1 581 1 680 Buffer for Sr. level 16.2bn EUR 3 006
Additional Tier 1
52 1 400
CET1 (phased) KBC Asset Management The buffer grows further as short-
10 676 Fully consolidated for solvency purposes term CDs are repaid by up-streamed
dividends (in excess to what is paid
out by KBC Group to its shareholders)
Buffer for Sr. level 13.8bn EUR
Legacy AT1 & T2 issued by KBC Bank and will disappear over time
MREL GROUP INSTRUMENTS = 7.4% (13.1+1.4+1.7+0.8)/228 510)
MREL KBC GROUP INSTRUMENTS + BANK INSTRUMENTS = 13.4% BASED ON PHASED CET1 ( 13.5% ON FULLY LOADED BASIS)
39
31/12/2015 – nominal amounts in million EURKey investment highlights
KBC is one of the strongest capitalised and most capital generative financials in Europe
• Compared with other European financials to have issued from their Holding Companies, KBC has one of the strongest leverage ratios and
one of the highest CET1 and total capital positions
• According to market estimates, KBC generates at least an approximated additional 2% of CET1 on a yearly basis before dividends
• Proven track record of prudent capital management (e.g. shareholder loans (2013), capital increase (2012), final repayment of YES (2015))
Given its already strong capitalisation and liquidity, KBC currently foresees relatively limited amounts of senior debt in
the future to reach MREL targets (at group level) and/or to complete its funding needs
A really diversified holding company and the absence of ring-fencing helps to mitigate the risks of structural
subordination of Senior debt of KBC Group compared to other issuers
40Contents
1 Strategy and business profile
2 Financial performance
3 Asset quality
4 Solvency and liquidity
5 MREL strategy
6 2Q16 Wrap up
Appendices
41Wrap up
Strong commercial bank-insurance results in our core countries
Successful underlying earnings track record
Solid capital and robust liquidity position
42Looking forward
KBC Group is the bank-insurer that puts its clients centre stage, even in
demanding economic circumstances
We expect the remainder of 2016 to be a year of sustained economic growth
in both the euro area and the US, despite the continuing low level of interest
rates, the volatility on the financial markets and higher than average economic
& political uncertainty
Management guides for:
continued stable and solid returns for the Belgium& Czech Republic Business Units
loan impairments for Ireland towards a 0m-40mEUR range for FY16
a phased-in B3 common equity ratio of minimum 10.25% for 2016
LCR and NSFR of at least 105%
43KBC Group introduces an interim dividend policy
KBC refines its dividend policy:
• Starting as of this year, KBC aims to pay each year an interim dividend of 1 EUR
per share in November of the accounting year, as an advance on the total
dividend. This will ensure a more evenly distributed cash flow to shareholders
throughout the year
• The current pay-out ratio policy (i.e. dividend + AT1 coupon) of at least 50% of
consolidated profit is confirmed
At its meeting held on 10 August 2016, the KBC Board of Directors
approved an interim dividend* of 1 EUR per share, an advance
payment on the total 2016 dividend. This dividend will be paid on 18
November 2016
* Ex-coupon date: 16 November 2016; Payment date: 18 November 2016
44Appendices
1 KBC 2015/16 benchmarks + overview of outstanding benchmarks
2 KBC Bank CDS levels
3 Summary of KBC’s covered bond programme
4 Details on selective credit exposure
5 Overview of bank taxes
6 Solvency: details on capital
7 Macroeconomic views
45KBC 2015 benchmarks
KBC 7Y Fixed – Covered – BE0002482579 KBC 12NC7 Fixed – Tier 2 – BE0002485606
• Notional: 1bn EUR • Notional: 750m EUR
• Issue Date: 22 January 2015 – Maturity: 22 January 2022 • Issue Date: 11 March 2015 – Maturity: 11 March 2027
• Coupon: 0.45% A, Act/Act • Coupon: 1.875 %, A, Act/Act
• Re-offer spread: Mid Swap +2bp (issue price 99.815%) • Re-offer spread: Mid Swap +150bp (issue price 99.49%)
• Joint lead managers: KBC, HSBC, ING Bank, LBBW and Unicredit • Joint lead managers: KBC, Bank of America, BNP Parisbas ,
Deutsche Bank and Morgan Stanley
KBC 6Y Fixed – Covered – BE0002489640
• Notional: 1bn EUR
• Issue Date: 28 April 2015 – Maturity: 28 April 2021
• Coupon: 0.125% A, Act/Act
• Re-offer spread: Mid Swap -8 bp (issue price 99.678%)
• Joint lead managers: KBC, Commerzbank, Natixis, RBS and
Unicredit
46KBC 2016 Benchmarks
KBC 6.5Y Fixed – Covered – BE0002498732 KBC Groep 5Y Fixed – Senior – BE6286238561
• Notional: 1.25bn EUR • Notional: 750m EUR
• Issue Date: 01 March 2016 – Maturity: 01 September 2022 • Issue Date: 26 April 2016 – Maturity: 26 April 2021
• Coupon: 0.375% A, Act/Act • Coupon: 1%, A, Act/Act
• Re-offer spread: Mid Swap +19 bp (issue price 99.770%) • Re-offer spread: Mid Swap +112bp (issue price 99.396%)
• Joint lead managers: KBC, Commerzbank, Credit Agricole, • Joint lead managers: KBC, Deutsche Bank, Goldman Sachs,
LBBW and Credit Suisse JP Morgan and Société Générale
47Outstanding benchmarks
Tranche Report
Issuer Curr Amount issued Coupon Settlement Date Maturity Date ISIN YEAR
UNSECURED
KBC Ifima N.V. EUR 1 000 000 000 4.5 27/03/2012 27/03/2017 XS0764303490 2017
KBC Ifima N.V. EUR 500 000 000 3 29/08/2012 29/08/2016 XS0820869948 2016
KBC Ifima N.V. EUR 750 000 000 2.125 10/09/2013 10/09/2018 XS0969365591 2018
KBC Group EUR 750 000 000 1.000 26/04/2016 26/04/2021 BE6286238561 2021
COVERED
KBC Bank N.V. EUR 1 250 000 000 1.125 11/12/2012 11/12/2017 BE6246364499 2017
KBC Bank N.V. EUR 750 000 000 2 31/01/2013 31/01/2023 BE0002425974 2023
KBC Bank N.V. EUR 1 000 000 000 1.25 28/05/2013 28/05/2020 BE0002434091 2020
KBC Bank N.V. EUR 750 000 000 0.875 29/08/2013 29/08/2016 BE0002441161 2016
KBC Bank N.V. EUR 750 000 000 1 25/02/2014 25/02/2019 BE0002462373 2019
KBC Bank N.V. EUR 1 000 000 000 0.45 22/01/2015 22/01/2022 BE0002482579 2022
KBC Bank N.V. EUR 1 000 000 000 0.125 28/04/2015 28/04/2021 BE0002489640 2021
KBC Bank N.V. EUR 1 250 000 000 0.375 1/03/2016 01/09/2022 BE0002498732 2022
Total: EUR 10.75bn
5.000 Maturity profile KBC benchmark issues
in million euros
4.000
3.000
2.000
1.000
0
2016 2017 2018 2019 2020 =>2021
48Main characteristics of subordinated debt issues
SUBORDINATED BOND ISSUES KBC
KBC Bank NV KBC Groep NV KBC Groep NV KBC Groep NV
KBC Bank NV
T2 Coco AT1 Tier II Tier II
Amount issued GBP 525 000 000 USD 1 000 000 000 EUR 1 400 000 000 EUR 750 000 000 EUR 750 000 000
Tendered GBP 480 500 000
Net Amount GBP 44 500 000 USD 1 000 000 000 EUR 1 400 000 000 EUR 750 000 000 EUR 750 000 000
ISIN-code BE0119284710 BE6248510610 BE0002463389 BE0002479542 BE0002485606
Call date 19/12/2019 25/01/2018 19/03/2019 25/11/2019 11/03/2022
Initial coupon 6.202% 8% 5.625% 2.375% 1.875%
Coupon step-up / reset 3m gbp libor + 193bps $ MS 5Y + 7.097% € MS 5Y + 4.759% € MS 5Y + 1.980% € MS 5Y + 1.50%
First (next) call date 19/12/2019 25/01/2018 19/03/2019 25/11/2019 11/03/2022
ACPM Yes - - - -
Dividend Stopper Yes - - - -
Conversion into PSC Yes - - - -
CT1/CET1 < 7% at KBC
Supervisory Event or Trigger CET1 RATIO <
Group level
Trigger general "concursus 5.125% Temporary write- Regulatory+Tax Call Regulatory+Tax Call
Full and permanent write-
creditorum" down
down
49Appendices
1 KBC 2015/16 benchmarks + overview of outstanding benchmarks
2 KBC Bank CDS levels
3 Summary of KBC’s covered bond programme
4 Details on selective credit exposure
5 Overview of bank taxes
6 Solvency: details on capital
7 Macroeconomic views
50KBC Bank CDS levels (in bp)
600
500
400
300
200
100
0
KBC CDS EUR KBC CDS EUR KBC CDS KBC CDS KBC CDS
SR 2Y Corp SR 3Y Corp EUR SR 5Y Corp EUR SR 7Y Corp EUR SR 10Y Corp
51Appendices
1 KBC 2015/16 benchmarks + overview of outstanding benchmarks
2 KBC Bank CDS levels
3 Summary of KBC’s covered bond programme
4 Details on selective credit exposure
5 Overview of bank taxes
6 Solvency: details on capital
7 Macroeconomic views
52Key messages on KBC’s covered bond programme
KBC’s covered bonds are backed by strong legislation and superior collateral
• KBC’s covered bonds are rated Aaa/AAA (Moody’s/Fitch)
• Cover pool: Belgian residential mortgage loans
• Strong Belgian legislation – inspired by German Pfandbriefen law
• KBC has a disciplined origination policy – 2009 to 2016 residential mortgage loan losses below 4 bp
• CRD and UCITS compliant / 10% risk-weighted
KBC already issued 8 successful benchmark covered bonds in different maturity buckets
The covered bond programme is considered as an important funding tool
Sound economic picture provides strong support for Belgian housing market
• Private savings ratio of approx. 12 %
• Belgian unemployment is significantly below the EU average
• Demand still outstrips supply
53KBC’s disciplined origination leads to low arrears and
extremely low loan losses
BELGIUM SHOWS A SOLID PERFORMANCE OF MORTGAGES…
Arrears have been very stable over the past 10 years. Arrears in Belgium are low due to:
Cultural aspects, stigma associated with arrears, importance attached to owning one’s property
High home ownership also implies that the change in house prices itself has limited impact on loan
performance
Well established credit bureau and surrounding legislation
Housing market environment (no large house price declines)
… AND KBC HAS EXTRAORDINARY LOW LOAN LOSSES
54Belgian legal framework
Direct covered bond issuance from a bank’s balance
sheet
Dual recourse, including recourse to a special estate
with cover assets included in a register
The special estate is not affected by a bank’s insolvency
National Bank of Requires licenses from the National Bank of Belgium
Belgium (NBB)
Ongoing supervision by the NBB
The cover pool monitor verifies the register and the
Cover Pool
portfolio tests and reports to the NBB
Monitor
The NBB can appoint a cover pool administrator to
manage the special estate
Covered bonds
Issuer Special Estate with Cover
Note Holders
Assets in a Register
Proceeds
Cover Pool Representative
Administrator of the Noteholders
55Strong legal protection mechanisms
1 The value of one asset category must be at least 85% of the nominal amount of
covered bonds
Collateral type
• KBC Bank selects residential mortgage loans and commits that their value (including
collections) will be at least 105%
2 The value of the cover assets must at least be 105% of the covered bonds
Over- • The value of residential mortgage loans:
1) is limited to 80% LTV
collateralisation
Test 2) must be fully covered by a mortgage inscription (min 60%) plus a mortgage mandate (max 40%)
3) 30 day overdue loans get a 50% haircut and 90 days (or defaulted) get zero value
3
The sum of interest, principal and other revenues of the cover assets must at
Cover Asset least be the interest, principal and costs relating to the covered bonds
Coverage Test • Interest rates are stressed by plus and minus 2% for this test
4 Cover assets must generate sufficient liquidity or include enough liquid assets to
Liquidity Test pay all unconditional payments on the covered bonds falling due the next 6
months
Interest rates are stressed by plus and minus 2% for this test
5
Cap on Issuance Maximum 8% of a bank’s assets can be used for the issuance of covered bonds
56KBC Bank NV residential mortgage covered bond
programme
Issuer: • KBC Bank NV
• min 105% of covered bond outstanding is covered by residential mortgage loans and
Main asset category:
collections thereon
Programme size: • Up to 10bn EUR (only)
Interest rate: • Fixed rate, floating rate or zero coupon
• Soft bullet: payment of the principal amount may be deferred past the final maturity
Maturity: date until the extended final maturity date if the issuer fails to pay
• Extension period is 12 months for all series
• Failure to pay any amount of principal on the extended final maturity date
Events of default:
• A default in the payment of an amount of interest on any interest payment date
Rating agencies: • Moody’s Aaa / Fitch AAA
Moody’s Fitch
Over-collateralisation 15% 25%
TPI Cap Probable D-cap 4 (moderate risk)
57Benchmark issuance KBC covered bonds
Since establishment of the covered bond programme KBC has issued eight benchmark issuances:
SPREAD EVOLUTION KBC COVERED BONDS (SPREAD IN BP VERSUS 6 MONTH MID SWAP)
Source Bloomberg Mid ASW levels
58Key cover pool characteristics (1/3)
Investor reports, final terms and prospectus are available on www.kbc.com/covered_bonds
Portfolio data as of : 30 June 2016
Total Outstanding Principal Balance 11 596 646 222
Total value of the assets for the over-collateralisation test 10 724 067 927
No. of Loans 142 251
Average Current Loan Balance per Borrower 101 145
Maximum Loan Balance 1 000 000
Minimum Loan Balance 1 000
Number of Borrowers 101 707
Longest Maturity 359 month
Shortest Maturity 1 month
Weighted Average Seasoning 45 months
Weighted Average Remaining Maturity 191 months
Weighted Average Current Interest Rate 2.46%
Weighted Average Current LTV 63.4%
No. of Loans in Arrears (+30days) 214
Direct Debit Paying 97.8%
59Key cover pool characteristics (2/3)
REPAYMENT TYPE (LINEAR VS. ANNUITY) GEOGRAPHICAL ALLOCATION
Linear Brussels Hoofdstedelijk gewest
4% 5% Waals Brabant
1%
Oost-
Vlaanderen Vlaams
18% Brabant
17%
West-
Vlaanderen
15%
Luxemburg Antwerpen
0% 29%
Annuity Henegouwen Limburg
96% 1% 12%
Namen Luik
0% 2%
LOAN PURPOSE INTEREST RATE TYPE (FIXED PERIODS)
Construction 10 y / 5 y 15 y / 5 y 20 y / 5 y
11% 2% 0% 0%
5y/5y
8%
3y/3y
Purchase 19%
48%
Remortgage No review
41% 56%
1y/1y
15%
60Key cover pool characteristics (3/3)
FINAL MATURITY DATE SEASONING
60,00 45,00
Weighted Average Weighted Average
Remaining Maturity: 40,00
Seasoning:
50,00 191 months
35,00 45 months
40,00 30,00
25,00
30,00
20,00
20,00 15,00
10,00
10,00
5,00
0,00 0,00
2013 - 2017 2018 - 2022 2023 - 2027 2028 - 2032 > 2032 0 - 12 13 - 24 25 - 36 37 - 48 49 - 60 61 - 72 73 - 84 85 - 96 97 -108 109 -
INTEREST RATE CURRENT LTV
45,00 18,00
40,00 16,00 Weighted Average
35,00 Weighted Average 14,00 Current LTV:
Current Interest Rate: 63%
30,00 2.46% 12,00
25,00 10,00
20,00 8,00
15,00 6,00
10,00 4,00
5,00 2,00
0,00 0,00
< 2,5
> 7.0
2.5 < toAppendices
1 KBC 2015/16 benchmarks + overview of outstanding benchmarks
2 KBC Bank CDS levels
3 Summary of KBC’s covered bond programme
4 Details on selective credit exposure
5 Overview of bank taxes
6 Solvency: details on capital
7 Macroeconomic views
62Ireland (1): profitable in 1H16 (53m EUR)
IMPAIRED
LOAN
OUT-
STANDING
IMPAIRED
LOANS
IMPAIRED
LOANS PD
SPECIFIC LOANS Strong domestic activity suggests Irish GDP growth is likely to be about 4%
PORTFOLIO € PROVISIONS PD 10-12
€ € 10-12
€ COVERAGE in 2016, with the UK referendum vote likely to restrain growth in 2H16
Owner
occupied 9.0bn 2.9bn 32.6% 1.0bn 33%
mortgages Domestic spending is expected to improve further, supporting solid jobs
Buy to let 2.4bn 1.7bn 68.2% 0.7bn 43% growth and driving a reduction in unemployment rate towards 7.8% at end
mortgages 2Q16
SME /corporate 1.0bn 0.7bn 67.1% 0.4bn 61%
Real estate The housing market continues to recover with house price inflation easing
- Investment 0.8bn 0.6bn 76.2% 0.3bn 56%
- Development 0.3bn 0.3bn 100.0% 0.2bn 90% gradually to a more sustainable level
Total 13.5bn 6.1bn 45.3% 2.6bn 43%
Customer Deposits (Retail & Corporate) net inflows of 0.1bn EUR in 2Q16,
resulting in a deposit portfolio of 5.5bn EUR (compared with 5.4bn EUR in
PROPORTION OF HIGH RISK AND IMPAIRED LOANS 1Q16). Growth of Customer Deposits amounted to 15% y-o-y
Loan loss provision release of 1m EUR in 2Q16 compared with 3m EUR
50.2% 52.1% 52.6% 52.0% 51.3% 50.3% 48.7% release in 1Q16. Coverage ratio increased from 42% in 1Q16 to 43% in
47.3% 46.4% 45.3%
2Q16
8.2% 8.2% 8.4% 9.2% 9.5% 9.9% 10.3%
7.2% 5.4% 4.7% We are lowering our impairment guidance for Ireland, namely from the
lower end of the 50m-100m EUR range for impairments towards a
0m-40m EUR range for FY16
High Risk Performing (PD 8-9 probability of Default >6.4%)
Impaired Loan (PD 10-12)
63Ireland (2): portfolio analysis
2Q16 Retail Portfolio 2Q16 Corporate Loan Portfolio
PD Exposure Impairment Cover % PD Exposure Impairment Cover %
PD 1-8 5,901 24 0.4% PD 1-8 472 1 0.2%
Perf.
Of whi ch non Forborne 5,839 PD 9 45 1 2.6%
Performing
Of whi ch Forborne 61 PD 10 517 189 36.5%
Impaired
PD 9 975 52 5.3% PD 11 279 179 64.3%
Of whi ch non Forborne 243 PD 12 723 603 83.5%
Of whi ch Forborne 732 TOTAL PD1-12 2,035 973
PD 10 2,617 667 25.5% 64.0%
Impaired
Specific Impairment/(PD 10-12)
PD 11 1,227 428 34.9%
PD 12 760 578 76.1%
TOTAL PD1-12 11,480 1,750
Corporate loan portfolio
Specific Impairment/(PD 10-12) 36.4%
Impaired portfolio has reduced by roughly 90m EUR q-o-q.
Reduction driven mainly by continued deleverage of the
‘Forborne’ loans (in line with EBA Technical Standards) comprise loans on a live restructure or continuing portfolio (reduction of 0.2bn EUR y-o-y)
to serve a probation period post-restructure/cure to Performing.
Coverage ratio for impaired loans has increased to 64.0% in
Retail portfolio 2Q16 (from 62.9% in 1Q16)
Impaired portfolio fell by roughly 140m EUR q-o-q due to a
combination of property sales and improvement in the portfolio Overall exposure has dropped by 0.4bn EUR y-o-y
performance. This was in line with the previous quarter (reduction
of 0.2bn EUR q-o-q and 0.8bn EUR y-o-y)
Coverage ratio for impaired loans increased to 36.4% in 2Q16 (from
35.4% in 1Q16)
Overall exposure has decreased due to a reduction of the impaired
book and loan amortisations, partly offset by new mortgage
production
64Appendices
1 KBC 2015/16 benchmarks + overview of outstanding benchmarks
2 KBC Bank CDS levels
3 Summary of KBC’s covered bond programme
4 Details on selective credit exposure
5 Overview of bank taxes
6 Solvency: details on capital
7 Macroeconomic views
65Overview of bank taxes1 Bank taxes of 273m EUR YTD.
On a pro rata basis, bank taxes
represented 10.1% of 1H16
KBC GROUP Bank taxes of 386m EUR BELGIUM BU opex at the Belgium BU
335
YTD. On a pro rata basis, 241
bank taxes represented
264 92 10.5% of 1H16 opex at KBC 57
62 Group2 160
42
243 184
202 83 49
49 51 118 32
21 15 59 13 38
32 34 0
-8 -6
-12
1Q15 2Q15 3Q15 4Q15 1Q16 2Q16
1Q15 2Q15 3Q15 4Q15 1Q16 2Q16
European Single Resolution Fund contribution ESRF contribution Common bank taxes
Common bank taxes
Bank taxes of 83m EUR
YTD. On a pro rata basis,
Bank taxes of 27m EUR YTD.
bank taxes represented
CZECH REPUBLIC BU On a pro rata basis, bank INTERNATIONAL MARKETS BU 18.1% of 1H16 opex at
taxes represented 4.3% of
28 79 the IM BU
1H16 opex at the CR BU
8
20 61
22 11
11
10
7
71 28
9 9 25
6 23 2 22
50
-1 26 23
-12
-1
-3
1Q15 2Q15 3Q15 4Q15 1Q16 2Q16
1Q15 2Q15 3Q15 4Q15 1Q16 2Q16
ESRF contribution Common bank taxes
ESRF contribution Common bank taxes
1 This refers solely to the bank taxes recognised in opex, and as such it does not take account of income tax expenses, non-recoverable VAT, etc.
2 The C/I ratio adjusted for specific items of 56% in 1H16 amounts to roughly 50% excluding these bank taxes
66Appendices
1 KBC 2015/16 benchmarks + overview of outstanding benchmarks
2 KBC Bank CDS levels
3 Summary of KBC’s covered bond programme
4 Details on selective credit exposure
5 Overview of bank taxes
6 Solvency: details on capital
7 Macroeconomic views
67Fully loaded B3 CET1 based on the Danish Compromise (DC)
from 1Q16 to 2Q16
DELTA AT NUMERATOR LEVEL (BN EUR)
-0.4
0.6 -0.1
13.1 -0.0
13.3
Fully loaded B3
common equity ratio of
approx. 14.9% at end
B3 CET1 at 2Q16 net result Jan 2012
Pro-rata accrual dividend Delta in AFS Dec 2012
Other* B3 CET1 at end 2Q16 (DC) 2Q162014-2020
based on the
end 1Q16 (DC) revaluation reserves Danish Compromise
(DC)
DELTA ON RWA (BN EUR) A pro forma fully
89.8 loaded common equity
-0.7 ratio translation to
11.25% was clearly
89.0 exceeded
1Q16 (B3 DC**) 2Q16 impact 2Q16 (B3 DC)
* Includes the q-o-q delta in remeasurement of defined benefit obligations, DTAs on losses carried forward, IRB provision shortfall, deduction re. financing provided to
shareholders, translation differences, etc.
** Includes the RWA equivalent for KBC Insurance based on DC, calculated as the book value of KBC Insurance multiplied by 370%
68Overview of B3 CET1 ratios at KBC Group
Method Numerator Denominator B3 CET1 ratio
FICOD1, phased-in 13 638 101 353 13.5%
FICOD, fully loaded 13 804 102 237 13.5%
DC2, phased-in 13 125 88 149 14.9%
DC, fully loaded 13 290 89 033 14.9%
DM3, fully loaded 12 151 83 222 14.6%
1 FICOD: Financial Conglomerate Directive
2 DC: Danish Compromise
3 DM: Deduction Method
69Implementation of the BRRD in Belgium
1. The BRRD has been transposed to a large extent by the Act of 25 April 2014 on the legal
Hierarchy of Claims in Belgium status and supervision of credit institutions ("The Banking Act") which applies since
May-2015, with the exception of some major provisions, such as the bail-in tool. Some
provisions will be further implemented by a Royal Decree (“RD”):
Covered Deposits
• Bail-in mechanism and MREL requirement of the BRRD: RD was published in the
Belgian Official Journal 29 December 2015 and entries into force as from 1 January
Individual & SME Deposits 2016. However, the resolution strategy and MREL target for KBC are assumptions
and have not been determined by the Resolution Authority
Junior Deposits • Group dimension of the BRRD: transposition is currently under preparation
2. The competent authorities are
Senior
Derivatives
Unsecured • Supervision authority (KBC Bank NV, KBC Group NV): ECB/NBB.
Loss Absorption in KBC Bank
• Resolution authority (KBC Bank NV, KBC Group NV): Single Resolution Board as
Structured Notes from 1 January 2016.
• Competent authority for conduct supervision of financial institutions and
intermediaries (KBC Bank NV): FSMA.
Internal Sub Loan
3. The hierarchy of claims in Belgium is in line with the BRRD as provided for in art. 48
BRRD and applies losses accordingly.
Tier 2
• Creditors are protected by the No Creditor Worse Off (“NCWO”) principle which
ensures that creditors in resolution can’t be worse-off than in normal insolvency
proceedings (art 34(1) BRRD).
AT1
4. KBC plans on on-lending senior unsecured issued out of KBC Group NV as subordinated
instruments at KBC Bank NV to ensure the on-loan would only take losses after Tier 2
CET1 securities.
• Additionally KBC Bank NV’s funding needs in senior unsecured are expected to be
moderate going forward
70General principles (1/2):
What happens in different solvency situations?
Point of Non
Viability (PONV)
Resolution Authority
KBC is in control
is in control
Business as usual Recovery plan Resolution plan
in breach of minimum requirements (4.5% CET1 /
Capital instruments
sufficiently above Joint in breach (or breach is imminent) of Joint
CET1 6% T1 / 8% total capital) or considered as non
Capital Decision Capital Decision
viable by the competent authorities.
coupon uncertain
AT1 no impact absorbs losses when trigger (5.125% CET1 on absorb losses at PONV
transitional basis) is breached
no impact (except CoCo: absorbs losses when
T2 no impact trigger (7% CET1 on a transitional basis) is absorb losses at PONV
breached)
absorb losses beyond PONV
Senior debt no impact no impact
(bail-in)
71You can also read