Fiscal risks and their impact on banks' capital buffers in South Africa
←
→
Page content transcription
If your browser does not render page correctly, please read the page content below
Fiscal risks and their impact on banks’
       capital buffers in South Africa

         Konstantin Makrelov, Neryvia Pillay and Bojosi Morule

                                           ERSA working paper 862

                                                         June 2021

The views expressed are those of the author(s) and do not necessarily represent those of the funder, ERSA or the author’s affiliated
          institution(s). ERSA shall not be liable to any person for inaccurate information or opinions contained herein.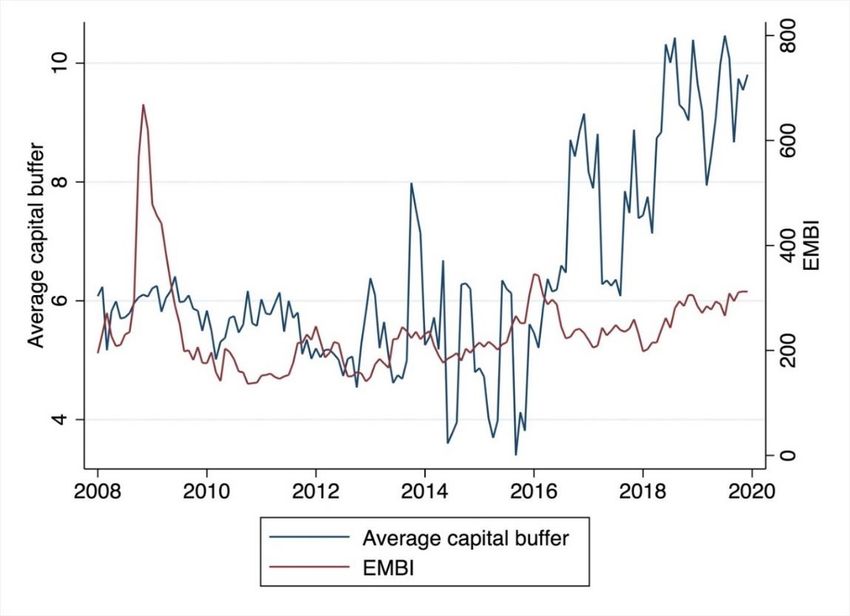
Fiscal risks and their impact on banks’capital
              bu¤ers in South Africa
       Konstantin Makrelov, Neryvia Pillay and Bojosi Morule
                                    June 11, 2021

                                        Abstract
          South Africa’s …scal balances have deteriorated signi…cantly over the
      last decade, while the economy has been recording disappointing economic
      growth rates even prior to the COVID-19 crisis. In this paper, we estimate
      a series of equations using the Arellano and Bond (1991) estimator to test
      how sovereign risk premia a¤ect capital bu¤ers, while controlling for vari-
      ables identi…ed in the literature, such as size of banks, the economic cycle,
      competition and equity prices. Unlike other studies, we use actual capital
      bu¤ers provided by the South African Prudential Authority. We show
      that these are substantively di¤erent to the proxy bu¤ers calculated using
      the common approach in the literature, indicating that results based on
      proxy measures should be interpreted with caution. Our overall results
      show a positive relationship between the sovereign risk premium and cap-
      ital bu¤ers, and the results are robust across di¤erent speci…cations. This
      suggests that banks are accumulating capital to mitigate against …scal
      and other domestic policy risks, and the related …nancial stability issues.
      It is likely that this is contributing to higher lending rates.
          JEL classi…cation: C23, E62, H32, G28
          Keywords: Fiscal policy, capital bu¤ers, …nancial regulation, sovereign-
      bank nexus, South Africa

1     Introduction1
South Africa’s …scal balances have deteriorated signi…cantly over the last decade,
while the economy has been recording disappointing economic growth rates even
prior to the COVID-19 crisis (Burger and Calitz 2020; Loewald, Faulkner and
     Konstantin Makrelov is a lead economist at the South African Reserve Bank (SARB),
Neryvia Pillay is a Research Fellow at the SARB and at Economic Research Southern Africa,
and a senior lecturere at the University of Cape Town, Bojosi Morule is an economist at the
SARB.
   1 We would like to thank Hugh Campbell, Angeline Phahlamohlaka and Jaco Vermeulen

for their help with our numerous Basel III queries. We also want to thank Vafa Anvari, an
anonymous referee and participants in the SARB seminar series for their useful comments and
suggestions.

                                            1
Makrelov 2020). South Africa’s credit rating has been reduced to ‘junk status’,
while sovereign risk premia have increased signi…cantly, driven by global risk
aversion and deteriorating domestic …scal and economic conditions.
In this paper, we assess how the deteriorating …scal conditions are a¤ecting
banks’capital bu¤ers in South Africa. Banks and the sovereign are closely inter-
linked through several channels. For example, …scal dynamics are an important
determinant of bank equity and solvency value as they depend on changes in
the perceived solvency and market value of government debt (Dell’Ariccia et al.
2018). A drop in bond prices also reduces the market value of banks’bond hold-
ings, eroding their collateral value.2 Government plays an important role as a
backstop in the event of …nancial sector distress. Unsustainable …scal balances
reduce the ability of government to play this role and increase risks of bank
runs and contagion if the banking sector faces solvency challenges (Kallestrup,
Lando and Murgoci 2016). Higher …scal risks can also increase the …nancial sec-
tor’s funding costs and risk aversion, causing banks to hold more capital than
required by regulators (Borio and Zhu 2012). Increasing capital bu¤ers is costly
for banks and can increase the cost of lending and reduce economic activity.3
In South Africa, …scal risks have increased, while banks and the …nancial
sector in general have increased their holding of government debt. Banks, pen-
sion funds and insurance companies held government debt of just over 40% of
GDP in 2020/21, up from 20% in 2012/13.4 At the same time, the government
debt-to-GDP ratio deteriorated from 41% to 80.3%, and sovereign risk premia
have increased steadily by over 200 basis points, indicating rising …scal risks.
We estimated a series of equations using the Arellano and Bond (1991) esti-
mator, controlling for variables such as size of banks, the economic cycle, changes
in equity prices, and – most importantly – sovereign risk premia. The results
are robust across di¤erent speci…cations and they show a strong relationship
between the sovereign risk premium and the banks’ capital bu¤ers. For every
one percentage point increase in the sovereign risk premium, the capital bu¤ers
increase by 1.7 to 1.9 percentage points, on average, across the banks.
Our contribution to the literature is threefold. Firstly, we provide the …rst
estimates of how rising …scal risks are a¤ecting capital bu¤ers in South Africa.
Previous studies on other countries have relied on proxy measures for banks’
capital bu¤ers to study their determinants. In our analysis, we use the actual
capital bu¤ers provided to us by the South African Prudential Authority. Sec-
ondly, we highlight signi…cant di¤erences between the actual capital bu¤ers and
the proxy measures used in the literature. We show how the proxy measures
are not a good indicator of actual bu¤ers. Thirdly, we illustrate how potential
growth revisions a¤ect estimates of the cyclicality of capital bu¤ers.
The results suggest that …scal policy decisions need to take into account
the adverse impacts of negative …scal shocks on the …nancial sector, as these
2 Bonds are used for example as collateral in some transactions with the Reserve Bank.
3 See for example Woodford (2010).
4 See the second edition of the 2020 Financial Stability Review available at
https://www.resbank.co.za/en/home/publications/publication-detail-pages/reviews/…nstab-
review/2020/Second_edition_Financial_Stability_Review.
2contribute to smaller …scal multipliers. Macro- and microprudential regulators
need to review the role of government debt as a low-risk asset in the regulatory
framework and identify interventions to reduce bank exposure to sovereign debt
instruments as …scal risks increase. This will also support more prudent …scal
policy and enhance macro-economic stability.
The paper is ordered as follows. In the next section, we present a review of
the related literature. This is followed in Section 3 by a brief discussion of South
Africa’s …scal risks, macroprudential regulation and structure of the banking
sector. The methodology is presented in Section 4. The data is discussed in
Section 5 and the results in Section 6. We conclude with some policy-related
comments in Section 7.
2 Related literature
Increasing the level of capital can be costly due to di¤erential tax treatment of
debt and equity; government guarantees that change the relative costs of capital
to debt; or transaction costs associated with higher equity issuance (Elliott
2013).5
Despite these costs, banks choose to hold capital above the regulatory re-
quirements. In summarising the literature, Fonseca and González (2010) identify
three reasons why banks hold higher capital than required. The …rst reason is
that bank shareholders have an incentive to maintain a capital bu¤er when bank
liabilities are not totally insured. In this case, the capital bu¤er reduces the cost
of deposits by signalling lower bank risks to depositors.
The second reason is that banks can also hold extra capital because they
want to preserve their monopoly rents. Shareholders may choose to fund the
bank using capital rather than cheaper deposits if this reduces the likelihood
of failure, preserves the monopoly pro…ts and provides for cheaper borrowing.
This suggests that costs of deposits and competition are likely to be important
determinants of capital bu¤ers. The third reason is that breaching the minimum
regulatory requirement is costly. These costs are linked to supervisory actions
and reputational risks, and incentivise banks to hold more capital than required
(Borio and Zhu 2012).
Furthermore, banks may hold higher capital bu¤ers to respond to higher
loan demand in the future (Jokipii and Milne 2008). In the absence of capital
bu¤ers, banks will not have the required capital to expand lending.6
Increasing capital bu¤ers has implications for economic activity. In the
model of Repullo and Suarez (2013), capital bu¤ers increase as a precaution
against shocks that may hinder future lending. The increase is larger if the
regulatory regime requires higher capital during recessionary periods and for
5 These market frictions reduce the validity of the Modigliani and Miller theorem. See
.()Modigliani and Miller (1958).
6 Banks, of course, can reduce risk-weighted assets, creating scope for more lending or
appropriate capital from reserve accounts.
3high social costs of bank failure. The framework generates credit rationing of
borrowers under recessionary conditions.
In the framework developed by Borio and Zhu (2012), banks’e¤orts to avoid
breaching the minimum requirement and maintain a capital bu¤er a¤ect the
availability and funding of credit extended to customers. These increase lending
spreads. In the theoretical model developed by Woodford (2010), increasing
bank capital is costly, and it leads to lower levels of intermediation, higher
interest rate spreads, and lower economic activity. In the model of Van den
Heuvel (2008), the negative impacts operate through the liquidity preferences
of households. Empirical studies support the relationship between increasing
bank capital and decreased lending (Aiyar et al. 2014; Bridges et al. 2014; Noss
and To¤ano 2016).
Capital bu¤ers, however, can also have welfare-enhancing e¤ects to the ex-
tent that they can prevent very large increases in the lending spreads in response
to sudden loan losses and the need to rebuild net worth (Benes and Kumhof
2015).
The relationship between economic activity and capital bu¤ers also moves in
the opposite direction, creating a feedback loop between economic activity and
capital bu¤ers. The size of the capital bu¤er is a function of the economic cycle
as it changes probabilities of default, valuations and perceptions of risk. This
shifts the relative position of bank capital to regulatory capital and thus a¤ects
bank behaviour (Borio and Zhu 2012). Lower interest rates and stronger eco-
nomic growth are likely to reduce the size of the capital bu¤er (Aiyar, Calomiris
and Wieladek 2016).
This suggests that determinants of the business cycle and perception of risks
a¤ect the willingness of banks to hold higher capital above the required level.
In South Africa, there have been several factors contributing to a slowdown in
economic activity in the period since the Global Financial Crisis of 2008. These
include a fall in export commodity prices; large supply shocks such as agricul-
tural droughts, disruptive strikes in the mining and manufacturing sectors, and
electricity shortages; as well as a signi…cant …scal deterioration, evident in the
large increase in government debt stocks and risk premia.
Fiscal dynamics are an important determinant of bank equity and solvency
values as they depend on changes in the perceived solvency and market value
of their government’s debt. Dell’Ariccia et al. (2018) calculate that a 10% loss
on a sovereign bond portfolio, which is 10% of banks’ assets, would imply a
15% reduction in bank capital for a bank with a 6.6% leverage ratio. They also
…nd a very strong relationship between sovereign risks as captured by credit
default swap (CDS) spreads, the valuations of banks and the cost of funding.
The impact is proportional to the stock of ‘home country’government debt held
by a bank and the strength of its balance sheet.
The second (November) edition of the 2020 Financial Stability Review7 out-
lines four channels that describe the relationship between …scal dynamics and
7 The review is available at https://www.resbank.co.za/content/dam/sarb/publications
/reviews/…nstab-review/2020/…nancial-stability-review-2nd-edition-
2020/Second%20edition%202020%20Financial %20Stability%20Review.pdf
4the …nancial sector.8 The …rst channel is related to the direct holding of gov-
ernment debt by the …nancial sector and leads to large capital losses when an
adverse shock materialises, as illustrated in the previous paragraph. The second
channel refers to government’s role in acting as a backstop in the event of …-
nancial sector distress. When a government’s …nancial position deteriorates, its
ability to serve in this role diminishes, increasing risks of bank runs and …nan-
cial contagion in the presence of solvency challenges. The third channel operates
through the impact of the …scus and the …nancial sector on economic activity.
This channel re‡ects the feedback loop, which ampli…es economic and …nancial
shocks. For example, in the model developed by Corsetti et al. (2013), strained
government resources increase the cost of …nancial intermediation as rising …scal
risks a¤ect the economic environment and the ability of banks to monitor and
enforce loan contracts. Unsustainable …scal balances can also lead to higher
distortionary taxes, lower private and public investment, and less scope for
countercyclical …scal policy, all impeding long-term growth and increasing bank
risk aversion (Barro 1979; Burriel et al. 2020; Checherita-Westphal and Rother
2012; Ostry, Ghosh and Espinoza 2015). The last channel operates through
the borrowing rates of government, which are important reference rates in the
economy. Higher rates reduce the demand for investment and …nancial services.
These relationships are part of the so-called sovereign-bank nexus. Shocks
to the sovereign or …nancial sector balance sheets generate large economic losses
by impacting each other directly and indirectly, creating feedback loops (‘doom
loops’) (Brunnermeier et al. 2016; Dell’Ariccia et al. 2018). This suggests that
in the presence of looming …scal risks, banks are likely to hold larger capital
bu¤ers to reduce the strength of the feedback loops.
The current literature on the determinants of capital bu¤ers tends to focus
on the cyclical behaviour of the cushion, controlling for variables such as size,
risk pro…le, funding cost and competition. The impact of …scal dynamics is not
tested directly.
Large banks are likely to have smaller bu¤ers for three reasons. Firstly,
they have lower costs of screening and monitoring because of economies of scale
and they require less capital to substitute for these activities. Secondly, large
banks also have more diversi…ed portfolios, which will reduce their probability
of experiencing large drops in their capital ratios. The third reason is that large
banks tend to be classi…ed as ‘too big to fail’ and receive larger government
support in response to shocks to their balance sheets, compared to smaller
banks (Jokipii and Milne 2008). The empirical evidence indicates that bank
size is an important determinant of capital bu¤ers, with large banks having
smaller bu¤ers (Carvallo and Jiménez 2018; Moudud-Ul-Huq 2019; Valencia
and Bolanos 2018).
The size of the cushion also depends on factors such as the quality of ac-
counting information, restrictions on bank activities and supervision (Fonseca
and González 2010). The quality of accounting information can reduce asym-
8 See also ...Dell’Ariccia et al. (2018), Acharya, Drechsler and Schnabl (2014), and
Kallestrup, Lando and Murgoci (2016).
5metric information problems and enforce greater market discipline. Tighter
restrictions on bank activities can reduce the incentives for depositors to moni-
tor banks, thus reducing market discipline and the need to hold higher capital
bu¤ers.
The evidence is inconclusive as to whether capital bu¤ers are pro- or coun-
tercyclical. There are di¤erences between countries, and there are di¤erent
results for di¤erent types of banks within a country. For example, Valencia
and Bolanos (2018) …nd pro-cyclical behaviour of capital bu¤ers in developing
countries and countercyclical behaviour in advanced economies. Similar results
are found by Chen and Hsu (2014) in a study of 171 countries over the period
1995 to 2009. Fonseca and González (2010) …nd no systemic relationship be-
tween capital bu¤ers and the cycle for a sample of 1 337 banks from 70 countries
in the period 1995–2002. At a country level, García-Suaza et al. (2012) …nd
that in Colombia larger banks have capital bu¤ers which show stronger negative
correlation with the economic cycle.9
The empirical literature indicates that market power is associated with
higher capital bu¤ers, supporting the so-called ‘competition stability’ view10
(Carvallo and Jiménez 2018; Fonseca and González 2010; Saadaoui 2014; Schaeck
and Cihak 2012). This relationship, however, is not as strong in emerging mar-
kets (Valencia and Bolanos 2018). In this case, market power may be associated
with lower adjustment and capital costs, and larger margins and pro…tability.
This increases bank revenues, reducing the role of capital as a bu¤er to absorb
future losses (Elizalde and Repullo 2007).
Other drivers include: costs of deposits, the share of non-performing loans
and pro…tability (Fonseca and González 2010). Bank shareholders have an in-
centive to hold higher capital, as this signals that the bank is well-capitalised
and less risky, reducing the cost of deposits. This relationship holds only when
banks’ deposits are not explicitly or implicitly insured. Non-performing loans
are an indicator of risk behaviour, associated with lower capital bu¤ers (Atici
and Gursoy 2013; Fonseca and González 2010). Pro…tability is associated with
higher capital bu¤ers as retained earnings and appropriated pro…ts can increase,
which in turns leads to higher capital holdings (Atici and Gursoy 2013; Carvallo
and Jiménez 2018).
There are four main gaps in the literature that we attempt to address. The
…rst is that studies of capital bu¤ers use proxy measures, and we show later in
the paper that these can be quite di¤erent from the actual capital bu¤ers. Using
the proxy measures can generate misleading results. The second gap is that, as
far as we know, the impact of …scal dynamics on bank capital bu¤ers has not
been assessed, neither in the South African nor global literature. Thirdly, there
9 See also Tabak, Noronha and Cajueiro (2011) for discussion of capital bu¤ers in Brazil,
Jokipii and Milne (2008) for the European Union, and Vu and Turnell (2015) for Australia.
1 0 The competition-stability view stipulates that market power can increase bank risk. The
higher rates charged to customers encourage moral hazard and adverse selection. Banks can
reduce risk by increasing capital holding. Under the competition-fragility view, banks engage
in more risk taking as lower pro…t margins translate into lower franchise value. For a detailed
discussion see Berger, Klapper and Turk-Ariss (2017).
6are no speci…c studies looking at the determinants of capital bu¤ers for South
Africa. The fourth gap is that the cyclicality of capital bu¤ers is sensitive to
estimates of potential growth, which are subject to revisions. It is possible that
the banks base their decisions on the ‘wrong’cyclical estimate or have a better
sense of the cycle than the o¢ cial estimates. We illustrate how potential growth
revisions a¤ect our …ndings.
3 The South African context
In this section, we provide a short overview of South Africa’s capital regulations,
the structure of the banking sector and recent …scal developments.
3.1 Changes to capital requirements
South Africa began phasing in the Basel III regulations from the beginning
of 2013 and completed the process in 2019. Table 1 summarises the capital
requirements structure. Banks are required to hold signi…cantly more capital
than the Basel minima. The systemic risk capital (Pillar 2A) should not exceed
3.5% together with the systemically important banks bu¤er.11 Individual bank
capital requirements fall under Pillar 2B. These can vary substantially and there
are no upper limits. Smaller banks and those that are unsecured lenders have
higher 2B pillar requirements.
In addition, banks are required to have a bu¤er stack, consisting of a coun-
tercyclical bu¤er, capital conservation bu¤er and systemically important banks
bu¤er. The countercyclical bu¤er is currently set at 0%. The capital conserva-
tion bu¤er is set at 2.5%12 and the systemically important banks bu¤er varies
between 0.5% and 2.5%. It is also recommended by the regulators that banks
hold additional capital. The total capital requirements per bank are not publicly
disclosed.
The regulations are also clear that breaching the prescribed requirement is
costly, leading to the imposition of capital conservation ratios and limits to
discretionary payments (such as dividends).
Our data covers the period 2008 to 2020, which overlaps with the introduc-
tion of BASEL III. Over this period, the minimum capital requirement as per
BASEL III of 8% was e¤ective from 2013. The other elements, however, were
phased in (see Table 2). For example, the pillar 2A for total capital was intro-
duced at 1.5% in 2013. It peaked at 2% in 2015 and decreased to 1% as the
systemically important capital bu¤er was phased in from 2016. Pillar 2A was
further reduced to 0% in 2020, in response to the COVID-19 crisis.
1 1 The current systemically important banks are Absa, Capitec, First National Bank, Ned-
bank, Investec and Standard Bank.
1 2 The capital conservation bu¤er is always set at 2.5% and can decrease to 0 if capital is
depleted under certain conditions.
73.2 South Africa’s banking sector
There are 36 banks in South Africa. The Basel III requirements apply to 33 of
these banks as three are mutual banks and are regulated di¤erently. There are
18 local branches of foreign banks and 15 domestic banks, including the top six
banks according to asset size (Rapapali and Simbanegavi 2020).
Large banks are pro…table, with a return on equity of over 17.3% in 2018.
Smaller banks have seen a decrease in pro…tability, particularly over the last
two years. The pro…tability of the sector as a whole is higher than in many
other jurisdictions. This, in turn, facilitates the accumulation of capital through
higher retained earnings (Davies, Harris and Makrelov 2019). Most recently,
pro…tability has declined and credit impairments have increased as economic
activity declined due to the COVID-19 crisis.
The higher pro…tability is a function of the level of competition in the sector.
Rapapali and Simbanegavi (2020) reviewed the literature on competition in the
South African banking sector and employed the Boone Indicator and Panzar–
Rosse approaches to assess the current level of competition. They concluded
that competition is low in the banking sector and has not changed since 2008,
despite the entry of new banks as these have remained very small. The six
largest banks account for 93% of bank assets (FSB 2020). This suggests that
changes to the level of competition are less likely to explain changes in capital
bu¤ers over the period.
South African banks are well regulated and the …nancial sector is highly
developed. According to a number of Global Competitiveness reports, South
Africa continues to have one of the highest accounting standards.13 This sug-
gests that institutional factors related to monitoring banks are not an important
determinant of the change in the size of capital bu¤ers.
The …nancial sector regulatory authorities are currently improving the frame-
work for resolution of banks. The SARB will become the sole resolution author-
ity for all banks, as well as for any non-bank …nancial institutions that are
designated as systemically important. These authorities are also planning the
introduction of a deposit insurance framework. South Africa is the only Finan-
cial Stability Board jurisdiction without an explicit deposit insurance framework
(FSB 2020).
3.3 The …scal situation
South Africa’s …scal situation has deteriorated signi…cantly in the post-Global
Financial Crisis period. Government consumption expenditure achieved average
growth of almost 4% per year and increased by more than 7% in 2019/20. Over
the 10 years prior to the COVID-19 crisis, the share of government expenditure
in GDP has increased from 25% to 33%. This increase was funded through a
combination of tax increases and debt. Personal income tax and consumption
taxes recorded the largest increases. At the same time, the debt-to-GDP ratio
1 3 The Global Competitiveness reports are available at
https://www.weforum.org/reports/the-global-competitiveness-report-2020.
8increased from under 30% to over 80% in 2020.14 South Africa’s credit rating
is currently at so-called junk status.
Measures of sovereign risk, such as the JP Morgan Emerging Market Bond
Index spread, suggest that the South Africa’s sovereign risk premium has been
rising steadily since 2013 (Figure 1). More recently, domestic factors have been
the main driver of the risk premium (Soobyah and Steenkamp 2020).
The May 2020 Financial Stability Review identi…ed the government’s large
and increasing …nance requirements as a major risk to the …nancial sector.15
The deterioration in government …nances has been accompanied by an increased
exposure of the …nancial sector to the sovereign. The exposure accounts for more
than 15% of total banking sector assets in 2020, almost twice as large compared
to 2008. Banks that use the internal ratings-based (IRB) approach have been
increasing risk weights for sovereign exposure in line with the rising public debt
burden and deteriorating sovereign credit ratings. IRB banks are required to
hold more capital against their sovereign exposures and some of their private
sector loans. This may constrain lending and increase the cost of credit.
4 Methodology
Our aim is to test whether bank capital bu¤ers respond to …scal dynamics. We
follow the methodology previously proposed in the literature (see for example,
Fonseca and González (2010)) and estimate the following dynamic panel data
model:
BU Fi;t = 1 BU Fi;t 1 + 2 EM BIi;t + 3 SIZEi;t + 4 LOAN Si;t (1)
+ 5 N P Li;t + 6 IN DU ST RY _ROEt + 7 GRDEVt + vi + "i;t
where BU F i;t is the capital bu¤er for bank i in year t. This model captures
the partial adjustment framework in which banks may be adjusting their capital
bu¤ers through the inclusion of the lagged capital bu¤er BU F i;t 1 . We use the
di¤erence GMM estimator developed by Arellano and Bond (1991) to estimate
equation (1) and report robust standard errors throughout. We control for the
potential endogeneity of SIZE, LOANS, and NPL in the GMM estimations using
the second to fourth lags of the same variables as instruments.
This approach addresses three relevant econometric issues: (1) the pres-
ence of unobserved bank-speci…c e¤ects, which are eliminated by taking …rst-
di¤erences of all variables; (2) the autoregressive process in the data regarding
the behaviour of capital bu¤ers (i.e. the need to use a lagged dependent vari-
ables model to capture the dynamic nature of the capital bu¤er); and (3) the
1 4 See Loewald, Faulkner and Makrelov (2020) for a review of …scal policy in the post-Global
Financial Crisis period.
1 5 The Financial Stability Review is available at https://www.resbank.co.za/en/home /pub-
lications/review.
9likely endogeneity of the explanatory variables. The panel estimator controls
for this potential endogeneity by using instruments based on lagged values of
the explanatory variables (Fonseca and González 2010).
Our primary variable of interest is EM BI, which is a measure of South
Africa’s sovereign risk premium.16 A deterioration in government’s …scal posi-
tion is captured by an increasing risk premium. Hence, if banks respond to …scal
dynamics by increasing their capital bu¤ers when the …scal position worsens,
we would expect that 2 is positive. An increase in the risk measure can re‡ect
both global and domestic factors. For example, a global economic shock can
increase the ‡ight to safety and reduce US bond yields, increasing the EMBI
spread. In order to test separately for the global, EM BI_IN T , and domestic
factors, EM BI_DOM , we use the risk premium decomposition of Soobyah and
Steenkamp (2020). The domestic measure is the residual factor after accounting
for emerging markets and global factor drivers of the South African CDS spread.
The domestic measure re‡ects …scal risks, which can be due to discretionary …s-
cal changes or the impact of domestic developments on the …scal matrix and
perceptions of …scal sustainability. We also use government debt to GDP as an
alternative measure of …scal risks.
As additional bank level controls, we include SIZE, which is the log of total
bank assets; LOAN S, which is loans over total assets; and N P L, which is the
ratio of non-performing loans to total loans. Unfortunately, we do not have
complete data on the return on equity for all banks, so instead we use a return
on equity for the banking industry as a whole, IN DU ST RY _ROE, to capture
the e¤ects of higher pro…tability.
We use two measures of cyclical dynamics, GRDEV 1 and GRDEV 2. They
both measure the deviation of actual growth from potential growth, but di¤er
in the calculation of potential growth. GRDEV 2 uses the t 1 estimate for
potential growth in t. GRDEV 1 is based on the most recent historical potential
growth estimates, which incorporate additional information to those used in the
calculation of GRDEV 2. Both estimates of potential growth are produced by
the SARB and are communicated widely. Since commercial bank decisions are
likely to be based on the available information at the time, GRDEV 2 is more
likely to capture the information used by banks in their decision making. The
two measures are better indicators of cyclical dynamics than just using economic
growth as they capture the impacts of supply and demand shocks on the cycle.
We do not include any measure of market power (such as the Lerner Index)
because the structure of the sector has remained relatively unchanged and we
do not expect this measure to generate signi…cant results.
In the next section, we provide more information on the data used in the
regression analysis.
1 6 The EMBI is the JP Morgan Emerging Market Bond Index. We use the EMBI+ index
which provides a maturity weighted spread between United States and South African bond
yields priced in the same currency.
105 Data
We use data on the universe of South African banks over the period 2008–2019.17
Uniquely, we have data on banks’actual capital bu¤ers provided to us by the
South African Prudential Authority. Whereas the prior literature has inferred
the size of banks’voluntary capital bu¤ers, we are able to observe the true size
of the voluntary bu¤er. There are elements of the minimum capital require-
ment that are common across all banks, but there are important bank-speci…c
requirements that are typically unobserved. These bank-speci…c requirements
are likely of huge importance in a banking sector like South Africa’s, which is
characterised by a few dominant banks and a number of smaller banks.
Although we have data available at the monthly frequency, we use annual
data for two main reasons. The …rst is so that our estimates will be comparable
with the prior literature that has typically used annual data. The second is to
avoid any noise that might be present in monthly data.
We drop FinBond, GBS and VBS banks from the sample because they are
mutual banks that are not subject to capital adequacy requirements that other
banks are. We also drop African Bank, which experienced signi…cant …nancial
stress over the period and had to be bailed out and restructured. We further
exclude outliers, de…ned as those observations with an absolute value of the
capital bu¤er z-score greater than 3.
We compare the actual capital bu¤er to two proxy de…nitions of capital
bu¤ers. The …rst, BU F 1, is measured as the di¤erence between capital and the
Basel III 8% minimum requirement (which is the common approach in the lit-
erature), and the second, BU F 2; takes into account the Pillar 2A requirements
and so is the di¤erence between capital and the South African base minimum re-
quirement. While the 8% minimum requirement is constant across the years we
study, the Pillar 2A, and hence the South African base minimum requirements,
vary across the years (see the discussion in Section 3 for details).
It is clear from Figure 2 that the banks’actual capital bu¤ers are much lower
than the calculated bu¤ers, typically used in the literature. Without knowing
the speci…c requirements the regulator imposes on each bank, researchers are
likely to be overestimating the voluntary capital bu¤ers by as much as two times
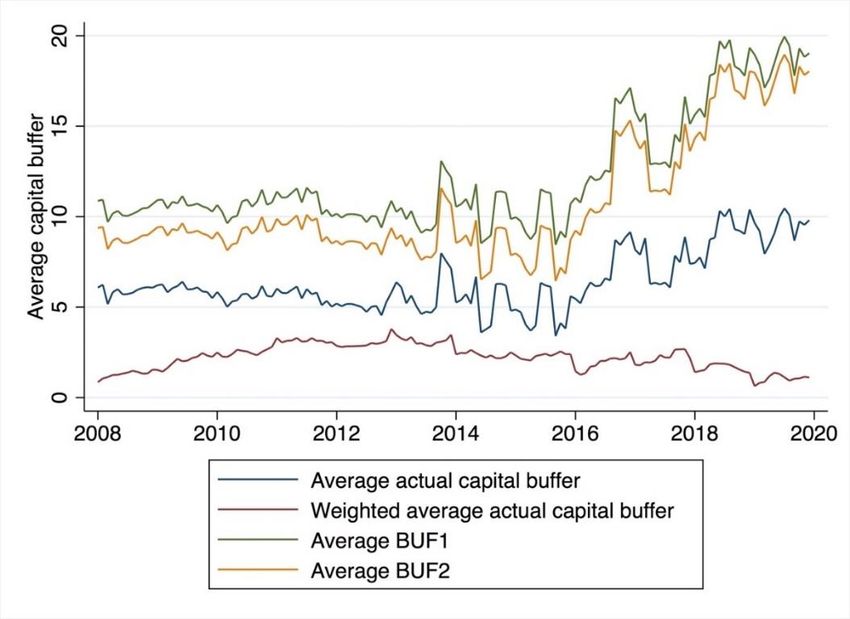
the true capital bu¤ers. In Figure 3, we compare the average actual bu¤er to
the EMBI index. The two series do seem to broadly move together, although
there are times where they diverge.
Table 3 provides summary statistics for the entire data set. Negative values
for the capital bu¤er re‡ect that certain banks were below the regulatory re-
quirements at speci…c points over the period. The high maximum values re‡ect
the bu¤er of some banks that entered the market. The table also illustrates
the di¤erences between the actual capital bu¤er and the proxy measures. The
latter have higher mean and standard deviation values.
1 7 Details on the de…nitions and sources of all the variables can be found in the Appendix.
116 Results
Table 4 presents our main results from the estimation of equation (1). The
m1 and m2 statistics give the Arellano-Bond test statistics for autocorrelation
in the …rst-di¤erenced standard errors. The m2 statistic is insigni…cant, which
indicates that there is no second-order serial correlation in the …rst-di¤erence
residuals. The Hansen test of over-identifying restrictions con…rms that the
instruments are appropriate. These two conditions are required for the validity
of the Arellano-Bond GMM estimates.18
The coe¢ cient on EMBI is positive but not statistically signi…cant when we
look at all years. However, when looking at the period from 2013 onwards it is
clear that the EMBI has a positive and statistically signi…cant e¤ect on banks’
voluntary capital bu¤ers. It is over this period that …scal risks increased. The
results indicate that a 100 basis point increase in the EMBI increased the capital
bu¤er by 1.7 to 1.9 percentage points on average.
Looking at the EMBI decomposition variables, it is clear that domestic fac-
tors drive the changes in the capital bu¤er, both over the full sample period and
from 2013 onwards. The increases in EMBI_DOM seem to drive the capital
bu¤er responses entirely, whereas the coe¢ cient on EMBI_INT is close to zero
and not statistically signi…cant.
Although the coe¢ cients on the lagged bu¤ers are not statistically signif-
icant, they are positive and relatively large, which suggests that the partial
adjustment framework may still be appropriate. The size of the coe¢ cients is
close to those estimated by Fonseca and González (2010).
Of the bank-speci…c variables, the coe¢ cient on SIZE is statistically signif-
icant. It shows that large banks hold smaller capital bu¤ers, in line with our
expectations and consistent with the economic literature. Large banks have
implicit public guarantees, larger margins, lower adjustment costs and higher
pro…tability.19 These reduce the need for high capital bu¤ers (Valencia and
Bolanos 2018).
LOANS and NPL are insigni…cant. The proportion of loans in the total
assets of a bank is a weak predictor of capital.20 Changes to the loan portfolio
relative to other asset classes have not a¤ected the banks’capital bu¤ers. Non-
performing loans are also a weak predictor, which is expected, given that there
was little variability in the NPL ratio over the period 2013 to 2019, particularly
for large banks.21
1 8 The insigni…cant values of m1 in some of the estimations suggests that the errors in
levels follow a random walk. This does not a¤ect the consistency of the GM estimates in the
…rst-di¤erence model. See Arellano and Bond (1991).
1 9 Large banks in South Africa also have large unappropriated pro…ts, which can be appro-
priated if required to become capital. They can serve the role of back-up capital.
2 0 The coe¢ cients of LOANS is insigni…cant, with a positive sign over the entire period and a
negative sign in the post-2013 period. The coe¢ cient sign can suggest possible compositional
changes to lending. For example, growth in unsecured lending slowed down signi…cantly in
the post-2013 period.
2 1 The NPL ratio may re‡ect discretionary write-o¤ of bad debts by banks in order to keep
NPL ratios in check, which reduces variability.
12The INDUSTRY_ROE coe¢ cient is positive and signi…cant in most esti-
mations, indicating that higher pro…tability is associated with higher capital
bu¤ers. This is consistent with our expectations, as retained earnings in the
sector increased. Higher retained earnings translate into higher capital bu¤ers
when a bank appropriates them as capital and informs the regulator.
Over the full sample period, both measures of cyclical dynamics –GRDEV1
and GRDEV2 – are positive (and statistically signi…cant when the EMBI de-
composition is used), indicating that capital bu¤ers are procyclical. This is in
line with the …ndings of Valencia and Bolanos (2018). Interestingly, over the
years 2013–2019 the coe¢ cient on GRDEV1 is negative, while the coe¢ cient
on GRDEV2 is positive, although none of the estimated e¤ects are statistically
signi…cant. It is this later period that was characterised by large supply-side
shocks such as mining and manufacturing strikes, droughts in the agricultural
sector and signi…cant policy uncertainty. Estimates of potential growth were
continually revised down retrospectively. Recall that GRDEV2 uses the t–1
estimate of potential growth and so it better captures the information available
to banks at the time. Using this estimate shows that banks adjust their bu¤ers
in a procyclical way. Wider and more negative output gaps are associated with
lower capital bu¤ers. However, the GRDEV1 measure uses the latest estimates
of historical potential GDP and demonstrates that banks’capital bu¤ers were
actually counter-cyclical as potential growth turned out to be lower than initially
expected.22
We interact the EMBI variables with an indicator for whether a bank is
systemically important, SYSIMP, to test whether the e¤ects vary across banks.
The results in Table 5 show that the e¤ects of …scal dynamics on the capital
bu¤er do not di¤er for the six systemically important banks. The coe¢ cients on
EMBIxSYSIMP, EMBI_DOMxSYSIMP and EMBI_INTxSYSIMP are close to
zero and not statistically signi…cant, indicating that the systemically important
banks do not di¤er in their capital bu¤er responses to changes in the EMBI.
We use the main speci…cation in Table 6 to compare how the results change
when using the proxy capital bu¤er measures used in the literature. The esti-
mated results are very di¤erent in terms of magnitudes, indicating that the use
of proxy measures in the analysis of capital bu¤ers is likely to generate mislead-
ing results.23 In particular, the estimated e¤ect of the EMBI measure on capital
bu¤ers is almost twice as large when using the proxied capital bu¤ers, BUF1
and BUF2, than when using the true capital bu¤er measure. Other variables
have di¤erent sizes, signi…cance levels or magnitudes.
Finally, in Table 7, we consider an alternative …scal risk measure, GOV-
DEBT, de…ned as gross government debt as a percentage of GDP. GOVDEBT
is an alternative measure for …scal risks. The results support our main conclusion
that banks’capital bu¤ers increase with greater …scal risks since the coe¢ cient
2 2 This …nding may also indicate that commercial banks had a di¤erent view to the Reserve
Bank of potential growth and the output gap.
2 3 We ran regressions using the proxy measures over the entire period. The results are
di¤erent in terms of magnitude but also in terms of statistical signi…cance.
13on GOVDEBT is positive and statistically signi…cant in all estimates.24 As ex-
pected, the coe¢ cient is larger in the post-2013 period when concerns regarding
the sustainability of government …nances increased.
7 Conclusion
Our results show that higher …scal risks are associated with higher capital bu¤ers
and empirically support the presence of a sovereign-bank nexus in South Africa.
The results are consistent with the theoretical models of Borio and Zhu (2012)
and Woodford (2010), which link the broader risk environment to bank capital
holdings and risk taking. Other important drivers include the size of banks and
the business cycle. Large banks hold smaller capital bu¤ers, which is in line with
the ‘competition stability’view. The capital bu¤ers tend to be procyclical. An
important contribution of our analysis is to illustrate the limitations of proxy
measures for capital bu¤ers widely used in the literature.
There are two main implications for …scal and macroprudential policy based
on our results. The channel between …scal risks and capital bu¤ers, or more
generally the relationship between the sovereign and the …nancial sector, is often
ignored in the calculation of …scal multipliers. Yet, the interlinkages between
the sovereign and the …nancial sector can positively or negatively amplify …scal
expenditure shocks, depending on the level of government debt and the size
of the output gap.25 Internalising this channel into …scal policy decisions will
improve the assessment of …scal sustainability and reduce crowding out e¤ects
in the economy. The second implication is that macro- and microprudential
regulations need to review the role of government debt as a low-risk asset in
the regulatory framework and identify interventions to reduce bank exposure to
sovereign debt instruments as …scal risks increase. This will also support more
prudent …scal policy and enhance macro-economic stability.
Our analysis was somewhat limited by the availability of observations af-
ter the 2013 period, when BASEL III was introduced. As more data becomes
available and new entrants such as TymeBank and Discovery Bank gain market
share, the analysis can be expanded to test how more speci…c bank character-
istics a¤ect decisions around holding capital bu¤ers. Due to data availability,
we also did not include in our analysis unappropriated (reserve) pro…ts, which
are generally large for the big six banks.26 These can be appropriated and
used as an additional bu¤er at times of stress. Their inclusion can improve the
2 4 We also tested whether bank exposure to government debt is associated with higher
capital bu¤ers. The estimated coe¢ cient was insigni…cant. We can think of two possible
explanations. One is that the variable is highly correlated with other explanatory variables
such as size, that is, the exposure is linked to the size of the bank. The second explanation is
that the willingness of banks to hold capital bu¤ers is not only a function of their exposure
but the exposure of the entire system. The second explanation is in line with the theoretical
model of Borio and Zhu (2012).
2 5 See for example Makrelov et al. (2020) for analysis of how the …nancial sector can amplify
government expenditure shocks.
2 6 These pro…ts are retained earnings that have not been appropriated as bank capital.
14representation of capital bu¤ers.
References
[1] Acharya, V, Drechsler, I and Schnabl, P. 2014. ‘A pyrrhic victory? Bank
bailouts and sovereign credit risk’. Journal of Finance 69: 2689–2739.
[2] Aiyar, S, Calomiris, C W, Hooley, H, Korniyenko, Y and Wieladek, T.
2014. ‘The international transmission of bank capital requirements: evi-
dence from the UK’. Journal of Financial Economics 113: 368–382.
[3] Aiyar, S, Calomiris, C W and Wieladek, T. 2016. ‘How does credit supply
respond to monetary policy and bank minimum capital requirements?’.
European Economic Review 82: 142–165.
[4] Arellano, M and Bond, S. 1991. ‘Some tests of speci…cation for panel data:
Monte Carlo evidence and an application to employment equations’. Review
of Economic Studies 58: 277–297.
[5] Atici, G and Gursoy, G. 2013. ‘The determinants of capital bu¤er in the
Turkish banking system’. International Business Research Journal 6: 224–
234.
[6] Barro, R. 1979. ‘On the determination of the public debt’. Journal of Po-
litical Economy 85: 940–971.
[7] Benes, J and Kumhof, M. 2015. ‘Risky bank lending and countercyclical
capital bu¤ers’. Journal of Economic Dynamics and Control 58: 58–80.
[8] Berger, A N, Klapper, F L and Turk-Ariss, R. 2017. ‘Bank competition and
…nancial stability’. In Handbook of Competition in Banking and Finance,
edited by J A Bikker and L Spierdijk. Edward Elgar Publishing:185–205
[9] Borio, C and Zhu, H. 2012. ‘Capital regulation, risk-taking and monetary
policy: a missing link in the transmission mechanism?’. Journal of Finan-
cial Stability 8: 236–251.
[10] Bridges, J, Gregory, D, Nielsen, M, Pezzini, S, Radia, A and Spaltro, M.
2014. ‘The impact of capital requirements on bank lending’. Bank of Eng-
land Working Paper Series, No. 486.11
[11] Brunnermeier, M K, Garicano, L, Lane, P R, Pagano, M, Reis, R, Santos,
T, Thesmar, D, Van Nieuwerburgh, S and Vayanos, D. 2016. ‘The sovereign-
bank diabolic loop and ESBies’. American Economic Review 106: 508–512.
[12] Burger, P and Calitz, E. 2020. ‘COVID-19, economic growth and South
African …scal policy’. Stellenbosch Working Paper Series, No. WP15/2020.
15[13] Burriel, P, Checherita-Westphal, C D, Jacquinot, P, Schön, M and Stähler,
N. 2020. ‘Economic consequences of high public debt: evidence from three
large scale DSGE models’. ECB Working Paper Series, No. 2450.
[14] Carvallo, Ó A and Jiménez, L A. 2018. ‘Bank capital bu¤ers and procycli-
cality in Latin America’. Monetary Policy and Financial Stability in Latin
America and the Caribbean 1(1): 133–158.
[15] Checherita-Westphal, C and Rother, P. 2012. ‘The impact of high govern-
ment debt on economic growth and its channels: an empirical investigation
for the euro area’. European Economic Review 56: 1392–1405.
[16] Chen, Y, and Hsu, C. 2014. ‘Are bank capital bu¤ers cyclical? Evidence
for developed and developing countries’. Journal of Financial Studies 22:
27–56.
[17] Corsetti, G, Kuester, K, Meier, A and Müller, G J. 2013. ‘Sovereign risk,
…scal policy, and macroeconomic stability’. Economic Journal 123: F99–
F132.
[18] Davies, R, Harris, L and Makrelov, K. 2019. ‘The impact of a higher lever-
age ratio on the South African economy’. SA-TIED Working Paper No.
51.
[19] Dell’Ariccia, G, Ferreira, C, Jenkinson, N, Laeven, L, Martin, A, Minoiu,
C and Popov, A. 2018. ‘Managing the sovereign-bank nexus’. European
Central Bank Discussion Paper No. 2177.
[20] Elizalde, A and Repullo, R. 2007. ‘Economic and regulatory capital in
banking: what is the di¤erence?’. International Journal of Central Banking
10: 87–118.
[21] Elliott, D J. 2013. ‘Higher bank capital requirements would come
at a price’. Brookings Institute Internet posting. Available on-
line at http://www.brookings. edu/research/papers/2013/02/20-bank-
capitalrequirements-elliott (accessed 3 May 2021).
[22] Financial Stability Board. 2020. Peer review of South Africa. Basel, Switzer-
land: Financial Stability Board.
[23] Fonseca, A R and González, F. 2010. ‘How bank capital bu¤ers vary across
countries: the in‡uence of cost of deposits, market power and bank regu-
lation’. Journal of Banking & Finance 34: 892–902.
[24] García-Suaza, A F, Gómez-González, J E, Pabón, A M and Tenjo-Galarza,
F. 2012. ‘The cyclical behavior of bank capital bu¤ers in an emerging econ-
omy: size does matter’. Economic Modelling 29: 1612–1617.
[25] Jokipii, T and Alistair Milne, A. 2008. ‘The cyclical behaviour of European
bank capital bu¤ers’. Journal of Banking & Finance 32: 1440–1451.
16[26] Kallestrup, R, Lando, D and Murgoci, A. 2016. ‘Financial sector linkages
and the dynamics of bank and sovereign credit spreads’. Journal of Empir-
ical Finance 38: 374–393.
[27] Loewald, C, Faulkner, D and Makrelov, K. 2020. ‘Time consistency and
economic growth: a case study of South African macroeconomic policy’.
South African Reserve Bank Working Paper Series, No. WP/20/12.
[28] Makrelov, K, Arndt, C, Davies, R and Harris, L. 2020. ‘Balance sheet
changes and the impact of …nancial sector risk-taking on …scal multipliers’.
Economic Modelling 87: 322–343.
[29] Modigliani, F and Miller, M H. 1958. ‘The cost of capital, corporation
…nance and the theory of investment’. American Economic Review 48: 261–
297.
[30] Moudud-Ul-Huq, S. 2019. ‘Banks’ capital bu¤ers, risk, and e¢ ciency in
emerging economies: are they counter-cyclical?’. Eurasian Economic Re-
view 9: 467–492.31
[31] Noss, J and To¤ano, P. 2016. ‘Estimating the impact of changes in aggre-
gate bank capital requirements on lending and growth during an upswing’.
Journal of Banking & Finance 62: 15–27.
[32] Ostry, J D, Ghosh, A R and Espinoza, R A. 2015. ‘When should public
debt be reduced?’ IMF Sta¤ Discussion Note No. 15/10.
[33] Rapapali, M and Simbanegavi, W. 2020. ‘Competition in South African
banking: an assessment using the Boone Indicator and Panzar-Rosse
approaches.’ South African Reserve Bank Working Paper Series, No.
WP/20/02.
[34] Repullo, R and Suarez, J. 2013. ‘The procyclical e¤ects of bank capital
regulation’. Review of Financial Studies 26: 452–490.
[35] Saadaoui, Z. 2014. ‘Business cycle, market power and bank behaviour in
emerging countries’. International Economics 139: 109–132.
[36] Schaeck, K and Cihak, M. 2012. ‘Banking competition and capital ratios’.
European Financial Management 18: 836–866.
[37] Soobyah, L and Steenkamp, D. 2020. ‘A measure of South Africa’s sovereign
risk premium’. South African Reserve Bank Economic Notes OBEN/20/01.
[38] Tabak, B M, Noronha, A C and Cajueiro, D. 2011. ‘Bank capital bu¤ers,
lending growth and economic cycle: empirical evidence for Brazil’. Pa-
per prepared for the 2nd Bank for International Settlements Consultative
Council for the Americas conference titled ‘Monetary policy, …nancial sta-
bility and the business cycle’, Ottawa, Canada, 12–13 May. Paper No. BIS
CCA-004-2011.
17[39] Valencia, O C and Alberto, O B. 2018. ‘Bank capital bu¤ers around the
world: cyclical patterns and the e¤ect of market power’. Journal of Finan-
cial Stability 38: 119–131.
[40] Van den Heuvel, S J. 2008. ‘The welfare cost of bank capital requirements’.
Journal of Monetary Economics 55: 298–320.
[41] Vu, Ha and Turnell, S. 2015. ‘The behavior of Australian banks’ capital
bu¤ers: pro-or counter-cyclical?’. Applied Economics and Finance 2: 110–
118.
[42] Woodford, M. 2010. ‘Financial intermediation and macroeconomic analy-
sis’. Journal of Economic Perspectives 24: 21–44.
18Table 1: Structure of capital requirements
%
Basel III minima 8
South African minima 8
Pillar 2A 0.5 to 2
South Africa base minima 8 +Pillar 2A
Pillar 2B (ICR) no specific range
Prudential minima 8+Pillar2A+ICR
Systemically important buffer 0.5 to 2.5
Capital conservation buffer 0 to 2.5
Countercyclical buffer 0 to 2.5
Source: SARB.
Table 2: Phasing of capital regulation
% 2013 2014 2015 2016 2017 2018 2019
Total capital requirements (per
Basel III) 8.0 8.0 8.0 8.0 8.0 8.0 8.0
Pillar 2A for Total Capital 1.5 2.0 2.0 1.8 1.5 1.3 1.0
Minimum Total Capital Plus 2A 9.5 10.0 10.0 9.8 9.5 9.3 9.0
Phasing in of specified charge 25 50 75 100
for systemically important banks
Capital conservation buffer 0.625 1.25 1.875 2.5
Countercyclical buffer1 0.625 1.25 1.875 2.5
Source: SARB.
1 The maximum for the countercyclical buffer was phased in but never activated.
19Table 3: Summary statistics (2008–2019)
(1) (2) (3) (4)
VARIABLES mean sd min max
BUF 6.964 12.72 -6.500 79
BUF1 13.22 15.97 1.835 138.4
BUF2 11.68 16.00 0.335 136.6
EMBI 260.3 119.2 138.6 620.5
EMBI_DOM 55.09 51.30 3.786 160.0
EMBI_INT 197.5 67.03 133.9 402.5
INDUSTRY_ROE 16.21 1.841 13.85 21.08
SIZE 16.53 2.188 12.50 21.07
LOANS 0.406 0.251 0 1.146
NPL 0.0335 0.0566 0 0.445
GRDEV1 -0.330 0.868 -3.188 0.271
GRDEV2 -1.255 1.246 -5.288 -0.0625
Note: BUF is actual capital buffer. BUF1 is defined as the difference between the bank’s total capital and the 8%
minimum requirement. BUF2 is defined as the difference between BUF1 and the Pillar 2A capital requirement.
Source: Authors’ own calculations.
20Table 4: Estimation results
(1) (2) (3) (4) (5) (6) (7) (8)
VARIABLES All years All years All years All years 2013+ 2013+ 2013+ 2013+
EMBI 0.0129 0.0124 0.0170* 0.0193*
(0.00944) (0.00942) (0.0103) (0.0102)
EMBI_DOM 0.0202** 0.0183* 0.0166* 0.0223**
(0.00992) (0.0104) (0.00983) (0.0112)
EMBI_INT 0.00107 0.00234 0.0120 0.00808
(0.00994) (0.0101) (0.0128) (0.0118)
L.BUF 0.170 0.173 0.170 0.173 0.0583 0.0577 0.0589 0.0563
(0.145) (0.144) (0.144) (0.144) (0.162) (0.159) (0.161) (0.159)
SIZE -5.190** -5.222** -5.461** -5.405** -9.571*** -9.607*** -9.425*** -9.649***
(2.345) (2.354) (2.228) (2.248) (2.892) (3.010) (2.780) (2.953)
LOANS 2.353 2.357 2.142 2.237 -1.726 -1.448 -1.563 -1.461
(6.956) (6.932) (6.892) (6.877) (7.309) (7.359) (7.217) (7.256)
NPL -0.602 -1.028 -1.591 -1.784 -10.10 -9.889 -9.757 -10.18
(9.031) (8.959) (8.752) (8.741) (8.710) (9.297) (8.817) (9.144)
INDUSTRY_ROE 0.303* 0.269* 0.320** 0.273* 0.182 0.270* 0.0943 0.169
(0.158) (0.147) (0.156) (0.147) (0.198) (0.162) (0.202) (0.173)
GRDEV1 0.597 0.704* -1.344 -1.418
(0.434) (0.382) (1.210) (1.177)
GRDEV2 0.432 0.469** 0.407 0.561
(0.271) (0.231) (0.497) (0.505)
Observations 271 271 271 271 193 193 193 193
Number of banks 30 30 30 30 30 30 30 30
m1 -1.950* -1.957* -1.875* -1.879* -1.542 -1.558 -1.535 -1.527
m2 0.619 0.643 0.495 0.523 0.550 0.669 0.530 0.675
Hansen 26.97 27.81 27.02 27.37 21.92 24.47 22.18 25.44
Robust standard errors in parentheses
*** pYou can also read