WALOP-South: A Four Camera One Shot Imaging Polarimeter for PASIPHAE Survey. Paper I - Optical Design
←
→
Page content transcription
If your browser does not render page correctly, please read the page content below
WALOP-South: A Four Camera One Shot Imaging Polarimeter for
                                               PASIPHAE Survey. Paper I - Optical Design

                                               Siddharth Maharanaa* , John A. Kypriotakisb,c , A. N. Ramaprakasha,b,e , Chaitanya
                                               Rajarshia , Ramya M. Anchea , Shrishh , Dmitry Blinovb,c,i , Hans Kristian Erikseng , Tuhin
                                               Ghoshh , Eirik Gjerløwg , Nikolaos Mandarakasb,c , Georgia V. Panopoulouf , Vasiliki
                                               Pavlidoub,c , Timothy J. Pearsone , Vincent Pelgrimsb,c , Stephen B. Potterd,j , Anthony C. S.
                                               Readheade , Raphael Skalidisb,c , Konstantinos Tassisb,c , Ingunn K. Wehusg
arXiv:2102.09505v1 [astro-ph.IM] 18 Feb 2021

                                               a
                                                 Inter-University Centre for Astronomy and Astrophysics, Post bag 4, Ganeshkhind, Pune, 411007, India
                                               b
                                                 Institute of Astrophysics, Foundation for Research and Technology-Hellas, Voutes, 70013 Heraklion, Greece
                                               c
                                                 Department of Physics, University of Crete, Voutes, 70013 Heraklion, Greece
                                               d
                                                 South African Astronomical Observatory, PO Box 9, Observatory, 7935, Cape Town, South Africa
                                               e
                                                 Cahill Center for Astronomy and Astrophysics, California Institute of Technology, Pasadena, CA, 91125, USA
                                               f
                                                 Hubble Fellow, California Institute of Technology, Pasadena, CA 91125, USA
                                               g
                                                 Institute of Theoretical Astrophysics, University of Oslo, P.O. Box 1029 Blindern, NO-0315 Oslo, Norway
                                               h
                                                 School of Physical Sciences, National Institute of Science Education and Research, HBNI, Jatni 752050, Odisha,
                                               India
                                               i
                                                 Astronomical Institute, St. Petersburg State University, 198504, St. Petersburg, Russia
                                               j
                                                 Department of Physics, University of Johannesburg, PO Box 524, Auckland Park 2006, South Africa

                                               Abstract. The WALOP-South instrument will be mounted on the 1 m SAAO telescope in South Africa as part of the
                                               PASIPHAE program to carry out a linear imaging polarization survey of the Galactic polar regions in the optical band.
                                               Designed to achieve polarimetric sensitivity of 0.05% across a 35 × 35 arcminute field of view, it will be capable
                                               of measuring the Stokes parameters I, q and u in a single exposure in the SDSS-r broadband and narrowband filters
                                               between 0.5 µm − 0.7 µm. For each measurement, four images of the full field corresponding to linear polarization
                                               angles of 0◦ , 45◦ , 90◦ and 135◦ in the instrument coordinate system will be created on four detectors from which
                                               the Stokes parameters can be found using differential photometry. In designing the optical system, major challenges
                                               included correcting for the dispersion introduced by large split angle Wollaston Prisms used as analysers as well as
                                               other aberrations from the entire field to obtain imaging quality PSF at the detector. We present the optical design of
                                               the WALOP-South instrument which overcomes these challenges and delivers near seeing limited PSFs for the entire
                                               field of view.

                                               Keywords: polarization, linear polarimetry, optical polarization, wide-field polarimeter, Wollaston Prisms, one-shot
                                               polarimetry.

                                               *Siddharth Maharana, sidh@iucaa.in

                                               1 Introduction
                                               Optical polarimetry in nighttime astronomy began in the 1940’s with Hiltner1 and Hall’s2 pioneer-
                                               ing work on polarization measurement of stars, leading to the serendipitous discovery of interstellar
                                               polarization. Since then, optical polarimetry has been used as an essential tool by astronomers to
                                               make progress in understanding various classes of objects such as stars, active galactic nuclei, exo-
                                               planets and protoplanetary disks.3, 4 With advancements in detectors, polarization optics hardware
                                               as well as associated control systems, optical polarimeters with polarimetric sensitivity1 (s) better
                                                   1
                                                    We define polarimetric sensitivity (s) as the least value and change of linear polarization which the instrument
                                               can measure, without correction for the cross-talk and instrumental polarization of the instrument. s is a measure
                                               of the internal noise and random systematics of the instrument due to the optics. Polarimetric accuracy (a) is the
                                               measure of closeness of the predicted polarization of a source to the real value after applying the above corrections

                                                                                                         1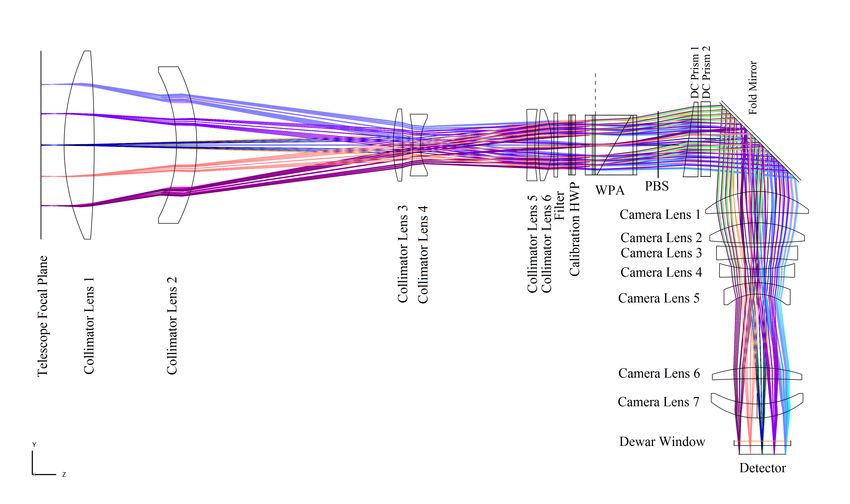
than 10−5 in p (fractional polarization) have been made, eg. HIPPI-25 and DIPOL-2.6 But most
polarimeters built to date have limited field of view (FOV) of about 1 × 1 arcminute or less. So
while we have extensive polarization measurements of many of the above mentioned individual
classes of objects, a large area (> 1000 square degrees) continuous optical polarization map of the
sky has been unavailable. Existing large stellar polarization catalogues include measurements of
nearly 3600 and 10000 individual stars by Berdyugin et al.7 and Heiles8 respectively in the opti-
cal wavelengths, and a continuous map of 76 square degrees of the galactic plane by the GPIPS
survey9 in the near infrared wavelengths.
    Using two WALOP (Wide-Area Linear Optical Polarimeter) polarimeters as survey instru-
ments, the PASIPHAE (Polar-Areas Stellar Imaging Polarization High Accuracy Experiment) pro-
gram aims to create a unique optopolarimetric map of the sky. Such a map will enable astronomers
to pursue answers to many open questions related to the physics of dust and magnetic fields in the
interstellar medium (ISM), which together are the main source of starlight polarization. A detailed
description of the motivation and scientific objectives of the PASIPHAE survey can be found in
the PASIPHAE white paper by Tassis et al.10 Here we mention key highlights of the program:

    – In the northern and southern Galactic polar regions, cover > 4000 square degrees of the sky
      and measure polarization of about 106 stars with polarimetric accuracy (a) of 0.1 %. Current
      optical polarization catalogues have polarization measurements of around 104 stars.8

    – The survey will be simultaneously carried out from the 1 m telescope at SAAO’s (South
      African Astronomical Observatory) Sutherland Observatory, South Africa in the southern
      hemisphere and the 1.3 m telescope at Skinakas Observatory, Greece in the northern hemi-
      sphere by using the WALOP-South and WALOP-North instruments, respectively.

    – Using stellar polarimetry in conjugation with the GAIA mission’s distance measurements of
      stars, carry out magnetic field and dust cloud tomography of the ISM. The methodology to
      create such a map has been discussed by Panopoulou et al.11

    – The main science goal of the PASIPHAE program is to aid CMB B-mode polarization
      searches by identifying clean patches of sky suitable for the search as well as to improve
      the foreground emission models by combining PASIPHAE’s tomographic map with polar-
      ized dust emission data.

    – Some of the secondary science goals are- (a) improving understanding of interstellar dust by
      testing various physical models of grain alignment and size distribution, (b) finding the paths
      of ultra high-energy cosmic rays though the Galaxy, (c) creating a catalogue of intrinsically
      polarized stars and finding associated systematic correlations with properties like the spectral
      type and stage of the stars.

    Of the two WALOP instruments, WALOP-South is scheduled to be commissioned first in 2021.
Both the WALOPs are currently under development at IUCAA, Pune. The unique scientific goals
of the PASIPHAE survey lead to a set of very challenging design and performance requirements
for the optical system of WALOP instruments.
using calibration techniques (Section 4.3).

                                                  2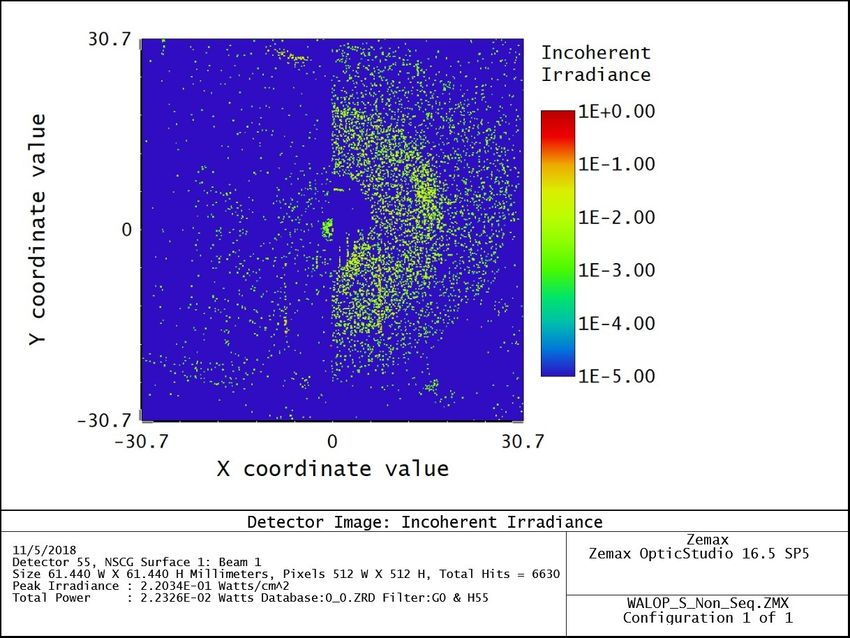
This paper is the first of a series of papers describing the design, polarization modelling, cal-
ibration and on-sky performance of the WALOP-South instrument.12 In this paper, we present
the complete optical design of the instrument. The optical design of WALOP-North is similar
to that of WALOP-South- the differences are due to the differences in the telescope optics (they
have different f-numbers) as well as opto-mechanical interfaces. Section 2 describes the techni-
cal goals of the instrument as driven by the scientific objectives of the PASIPHAE survey and the
challenges in realizing them. Section 3 explains the overall optical design and Section 3.3 gives
a detailed description of the architecture and working of the polarization analyzer subsystem of
the instrument, referred to as the polarizer assembly in this paper, which is the most complex and
novel subsystem of the instrument’s optical system. In Section 4, we show the performance of
the design and Section 5 contains our conclusions and observations regarding the optical design
of WALOP-South and its possible application to the design of other wide field polarimeters. In
addition to the WALOP-South optical system, we designed new baffles for the telescope’s mirrors
to accommodate the wide FOV and an auto-guider camera. These are presented in Appendix A
and B respectively.

2 Technical Requirements of WALOP-South instrument
Based on PASIPHAE survey goals as well as the current state of the art optical polarimeter design
technology and understanding, optical design goals for WALOP-South instrument were decided.
These goals are captured in Table 1. The design goals for WALOP-North are same as WALOP-
South.
     Most stars at high galactic latitude are expected to have p < 0.5% due to lower dust con-
tent13 in these regions. To accomplish the scientific objectives of the PASIPHAE program, a wide
field polarimeter with high accuracy (a) and high sensitivity (s) is needed. As the survey aims to
measure p with a =< 0.1 % as limited by photon noise, we aim to limit s =< 0.05 %.
     The polarimeter will be capable of carrying out four channel one-shot linear imaging polarime-
try in R broadband filter and narrowband filters lying between 0.5 µm to 0.7 µm. Previous optical
polarimeters like RoboPol14 have demonstrated the benefit of one-shot linear polarimetry, which
avoids instrumental noise due to rotating components like Half Wave Plates (HWP) as well as
changing sky conditions such as airmass during the exposures to obtain better polarimetric sensi-
tivity. Each of the four channels is imaged on a separate detector or detector area. A schematic of
this concept is shown in Fig 1, where after passing through the polarimeter, four images of the in-
put field along the 0◦ , 45◦ , 90◦ and 135◦ polarization angles are imaged on separate detectors. This
approach has three major advantages over conventional polarimeters which image all two or four
channels on the same detector area. Firstly, the background sky is an extended object, so imaging
the four channels on different detectors reduces the sky background by a factor of four by avoiding
overlap of ordinary and extraordinary images from adjacent sky regions. Second, there is no in-
termixing of images from different channels, enabling more accurate photometry and polarimetry
in sky regions with higher stellar density. Finally, this approach allows extended object imaging
polarimetry for a large field, which has not been possible without using slit masks in previous
polarimeters like RoboPol14 and IMPOL,15 leading to obscuration of large regions of the FOV.
     The initial PASIPHAE survey goal with WALOP-South is to cover 1000 square degrees, mainly
covering the areas targeted by upcoming CMB B-mode search missions. With 200 available nights
on the telescope per year, an average of 8 hours per night and 70% observation efficiency, we can

                                                  3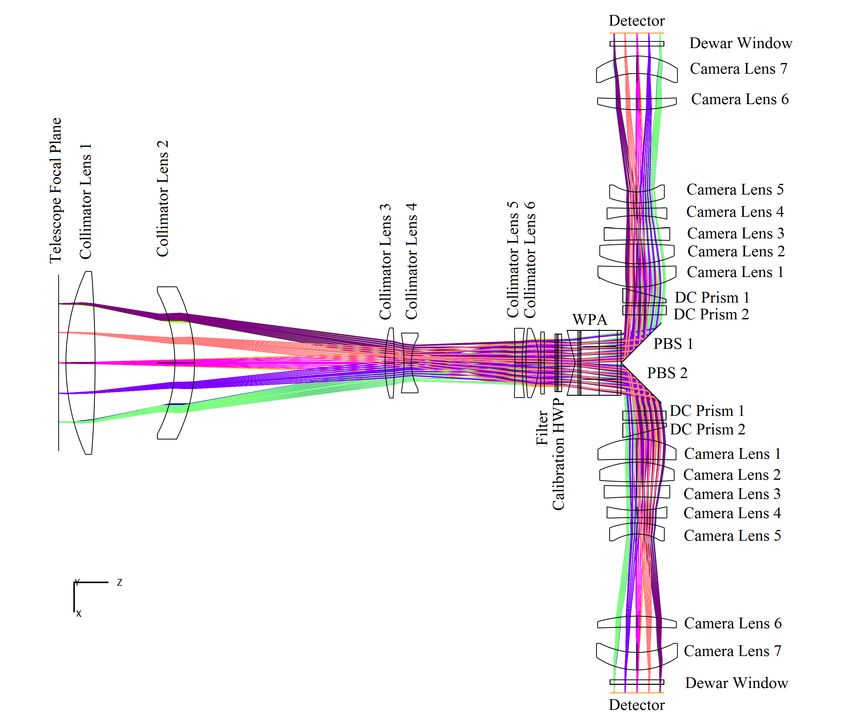
Sl. No.            Parameter                         Technical Goal
         1       Polarimetric Sensitivity (s)                   0.05 %
         2            Polarimeter Type        Four Channel One-Shot Linear Polarimetry
         3           Number of Cameras              4 (One Camera for Each Arm)
         4              Field of View                     30 × 30 arcminutes
         5              Detector Size               4k × 4k (Pixel Size = 15 µm)
         6             No. of Detectors                            4
         7              Primary Filter                          SDSS-r
         8          Imaging Performance              Close to seeing limited PSF
         9       Stray and Ghost Light Level Brightness less than sky brightness per pixel.
                Table 1: Design goals for WALOP-South instrument optical system.

Fig 1: Concept of four channel imaging with separate camera for each channel. The input field
is split into four channels along the 0◦ , 45◦ , 90◦ and 135◦ polarization angles and imaged on four
separate detectors without any overlap.

cover a 1000 square degrees region in 16 months with a FOV of 30 × 30 arcminutes and measure
p with a =< 0.1 % for R =< 14.0 mag stars (with the obtained FOV of 35 × 35 arcminutes, the
estimated survey period becomes 14 months).
    The median seeing FWHM (full width half maximum) at the Sutherland Observatory is 1.5 arc-
seconds. Imaging the FOV on a 4k × 4k detector with pixel size of 15 µm gives a plate scale of
0.45 arcseconds per pixel, allowing better than Nyquist sampling. The PSF (point spread func-
tion) should be close to seeing limited for median seeing conditions. While a larger PSF helps in
spreading photons over more pixels and washing out pixel to pixel sensitivity variation, it comes
at the cost of a higher measurement uncertainty from increased sky background.
    The stray light from objects outside the FOV and ghost light from field objects due to reflections
from telescope baffles/instrument optics should be reduced to a level where their intensities at the
detector will introduce less than 0.05% polarization (less than s). While this cannot be realised
for very bright stars and moon if they are near the FOV, for most sources this can be achieved by
keeping their stray/ghost light levels below the sky background.

                                                  4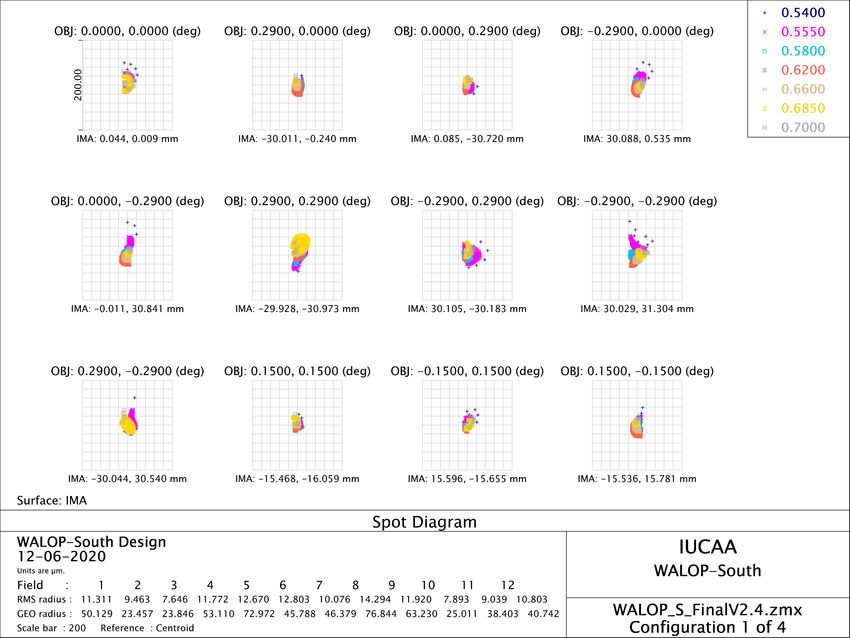
2.1 Challenges in making the WALOP-South Optical Design
The main challenge in building WALOP-South is obtaining s =< 0.05% across the FOV. Wollas-
ton Prisms (WP) are the most widely used linear polarization analyzers in optical astronomy due
to their high extinction ratios (> 105 ) as well as near symmetrical angular splitting of orthogonal
polarization states, making these suitable to be placed at a pupil plane. It was decided to use a
double WP system to create a four channel analyzer system (refer to Section 3.3.1 for a trade-off
study between different candidate analyzer systems). While double WPs with separate imaging
of four channels on different detector areas have been designed and implemented in astronomical
polarimeters in the past, eg. in HOWPol16 using WeDoWo prisms17 and in RoboPol,14 these instru-
ments have smaller FOVs for which WPs with split angles of around 1◦ are sufficient. However,
for WALOP-South’s field size, large split angles of the order 5◦ to 10◦ are required. WPs with such
large split angles introduce large spectral dispersion in broadband filters in the split beams due to
the dependence of split angle on wavelength. This is in addition to the usual problems of large
aberrations of off-axis objects due to the very wide field.

3 Instrument Design
3.1 Telescope And Site Details
WALOP-South will be mounted on the direct port of the 1 m telescope at SAAO’s Sutherland
Observatory. Details of the telescope and site is captured in Table 2. The instrument has been
designed to perform optimally for the temperature range and seeing conditions at the site.

                     Parameter                               Value
                   Telescope Type           Cassegrain Focus and Equatorial Mount
               Primary Mirror Diameter                        1m
              Secondary Mirror Diameter                     0.33 m
             Nominal Telescope f-Number                       16.0
                       Altitude                            1800 m
                Median Seeing FWHM                            1.5”
              Extreme Site Temperatures                −10 C to 40◦ C
                                                           ◦

                              Table 2: Telescope and Site Details.

3.2 Optical Design Overview
The optical model of WALOP-South was created and analyzed using the Zemax® optical design
software. The complete instrument model is shown in Fig 2. The instrument can be divided
into the following assemblies: a collimator, a polarizer and four cameras (one for each channel).
The collimator assembly, beginning from the telescope focal plane is aligned along the z-axis and
creates a pupil where the polarizer assembly is placed. The polarizer assembly splits the incoming
collimated beam into four channels corresponding to 0◦ , 45◦ , 90◦ and 135◦ polarization angles,
which are referred to as O1, O2, E1 and E2 beams respectively. Additionally, this assembly steers
the O beams along the +y and -y directions and the E beams along the +x and -x directions. Each
channel has its own camera which images the entire field on a 4k × 4k detector. The obtained FOV

                                                 5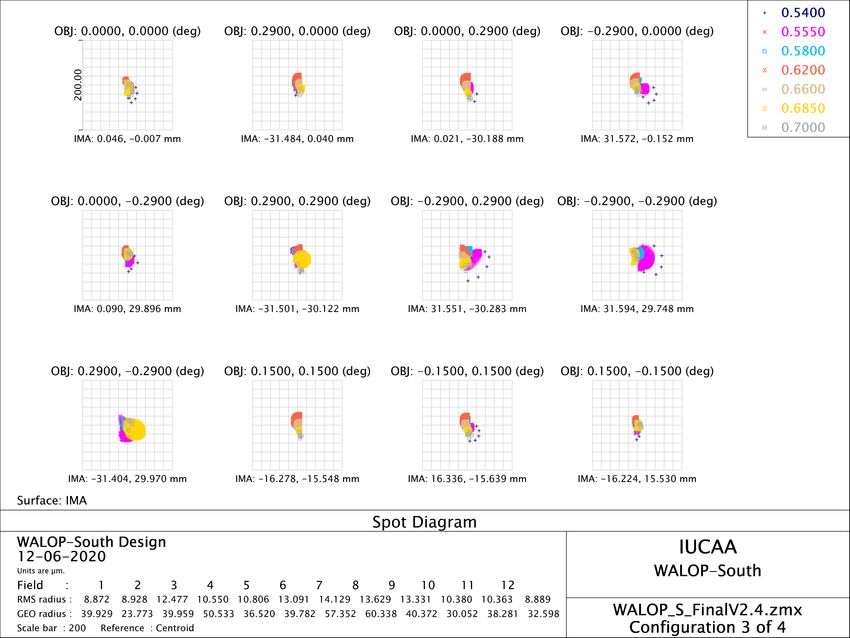
Fig 2: Complete optical model of the WALOP-South instrument. It accepts the beam for the
complete FOV from the telescope focal plane and through the collimator assembly creates a pupil
which is then fed to the polarizer assembly. The polarizer assembly splits the pupil beam into four
channels and steers them in +/- x and +/- y directions. The O1 and O2 beams correspond to 0◦ , 45◦
polarization while the E1 and E2 beams correspond to 90◦ and 135◦ polarization. Each channel
has its own camera assembly to image the complete field on a 4k × 4k detector.

of the instrument is 34.8 × 34.8 arcminutes (see Section 3.3.4 for more details). The key design
parameters of the optical design are listed in Table 3.
    While creating the optical design, a major consideration was to avoid the use of mirrors and as-
pheric lenses. Mirrors introduce instrumental polarization due to reflections while aspheric lenses
are relatively more difficult to fabricate and align in an optical assembly. In addition to these, the
length of the instrument must be restricted to less than 1.5 m from the telescope focal plane due to
space constraints at the telescope.
    Almost all the complexity of WALOP-South optical design resides in the architecture and
working of the polarizer assembly. Its design and working are explained in detail in Section 3.3.
The collimator and camera assemblies are described in Sections 3.4 and 3.5.

                                                  6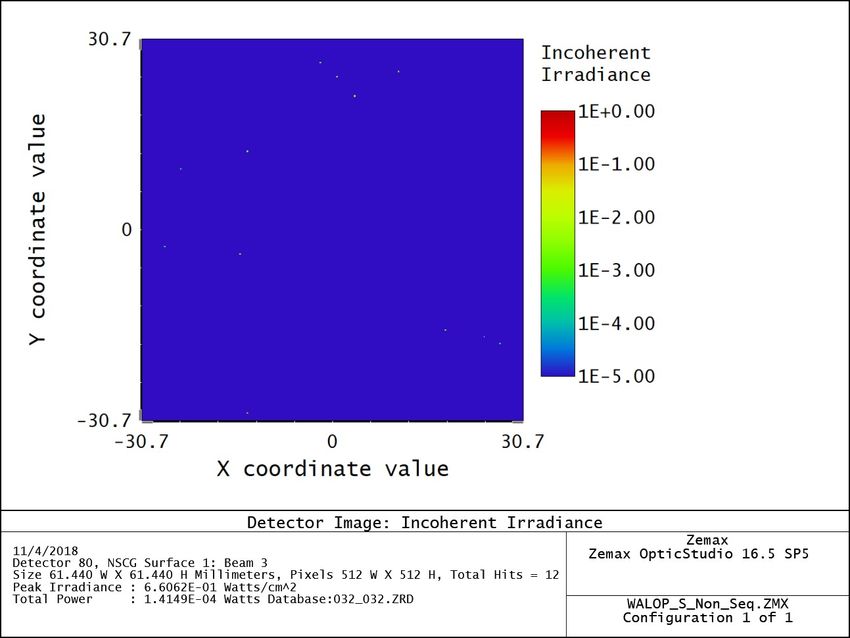
Parameter              Design Value/Choice
                                  Filter                    SDSS-r
                          Telescope F-number                  16.0
                           Camera F-number                    6.1
                           Collimator Length                700 mm
                             Camera Length                  340 mm
                             Pupil Diameter                 65 mm
                       No of lenses in Collimator              6
                      No of lenses in Each Camera              7
                              Detector Size               4096 × 4096
                                Pixel Size                   15 µm
                        Sky Sampling at detector           0.5”/pixel
             Table 3: Values of the key parameters of WALOP-South Optical Design.

3.3 Polarizer Assembly
3.3.1 Design Choices for the Polarizer System
Our key requirements in deciding on a suitable polarization analyzer design were: (a) to achieve
four channel beam-splitting as shown in Figure 1, (b) to achieve good PSFs at the detectors from
the split beams for the entire FOV, and (c) to ensure that the split beams have high extinction ratios
(> 104 ) to achieve the required s. To decide on the most suitable architecture of the polarizer
system, we considered four broad types of polarization analyzer systems and a trade-off study was
carried out to find the most suitable solution. These were:

   1. Twin Wire-Grid Polarization Beam Splitters (PBS).

   2. Twin Glan-Taylor/Thomson Prisms.

   3. Twin Polarization Gratings.

   4. Twin Wollaston Prisms.

    A single Wire-Grid PBS separates the incident beam into two orthogonal polarization states
(parallel and perpendicular to the direction of nano-wires in the PBS) and steers them in orthogo-
nal directions- one polarization is transmitted while the other is reflected. These have been used in
two-channel polarimeters like MOPTOP18 to obtain on-sky accuracy of 0.25 % using a modulating
HWP. The advantage of using these is that their beam-splitting performance does not change sig-
nificantly over large angles of incidence, or over the range of wavelengths of broadband filters like
the SDSS-r, which is a major problem with using crystal based polarizers like Wollaston Prisms,
as described later. While the transmitted beam can have a very high extinction ratio of > 104 , the
reflected beam has extinction ratio of less than 100, which would compromise the sensitivity of the
instrument in a single shot polarimeter like WALOP-South.
    The Glan-Taylor Prisms also work in a very similar manner as the Wire-Grid PBS- orthogonal
polarization states are split and steered in orthogonal directions. Instead of nano-wires, Glan-
Taylor Prisms use anisotropic optical properties of birefringent crystals like calcite to reflect one
of the polarizations using total internal reflection. Similar to Wire-Grid PBS, the reflected beam

                                                  7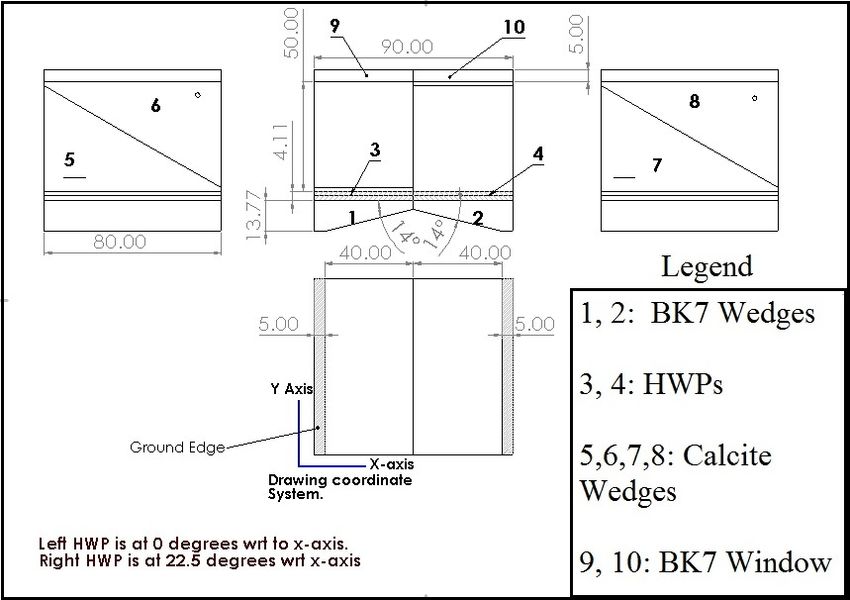
has very low extinction ratio. Additionally, in general, these polarization beam-splitters suffer from
severe degradation of polarization performance even for small angles of 1 − 2◦ away from normal
incidence, whereas the collimated beam of WALOP-South at pupil has angles of up to 6◦ .
    Polarization gratings (PG)19 have been used in astronomical spectropolarimetry to achieve
0.1 % accuracy in four channel polarimeters, e.g. WIRC+Pol.20 An advantage of PGs for use
in large FOV polarimeters is their availability in large aperture sizes, whereas a major problem
associated in employing PGs in imaging polarimeters is the large dispersion introduced in the
outgoing beams. Also, since PGs separate circular polarizations, a quarter-wave plate (QWP) is
needed in front of the PGs to make them separate linear polarization states, making them more
suitable for circular polarimetry than linear polarimetry.
    Finally, Wollaston Prism (WP) systems have been used in astronomy14, 16, 17, 21 as the go-to
polarization analyzer system. These separate the orthogonal polarization states (called E and O
beams) with high extinction ratios. For WALOP-South’s FOV, WPs with large split angles (> 5◦ )
and apertures are needed to image the four split beams on different detectors. Also, the split angle
of a WP depends on the wavelength, and for a broadband filter like the SDSS-r, there is large
dispersion in the outgoing beams (Section 3.3.5, Figure 6).
    Since our main goal is to carry out sensitive polarimetry, we decided to go with twin Wollas-
ton Prisms as the polarization analyzer system, with each Wollaston Prism having its own HWP
in front, similar to the architecture of RoboPol’s polarization analyzer system.14 The dispersion
introduced by the Wollaston Prism system is corrected downstream in the optical design.

3.3.2 Polarizer Assembly Overview
It consists of four sub-assemblies: (a) Wollaston Prism Assembly (WPA), (b) Wire-Grid Polar-
ization Beam-Splitter (PBS), (c) Dispersion Corrector Prisms (DC Prisms) and (d) Fold Mirrors.
The WPA, using the splitting action of the WPs, separates the beam at the pupil into O1, O2, E1
and E2 beams- corresponding to the polarization angles of 0◦ , 45◦ , 90◦ and 135◦ respectively. The
PBS’ act as beam selectors, allowing both the O beams to pass through while folding the E1 and
E2 beams along -x and +x directions. Fig 3 shows the overall working idea of the WPA and PBS
components of the polarizer assembly, which in combination act as the polarization beamsplitter
unit of the instrument. The collimated pupil is split equally between two BK7 wedges which is
then fed to the HWP + WP system to split into four channels. Then the two PBS’ steer the four
beams in four directions. The need for the PBS’ is described in Sec 3.3.6. The DC Prisms are a
pair of glass prisms present in the path of each of the four beams after the PBS to correct for the
spectral dispersion introduced by the WPA. Additionally, before the O-beams enter their respective
camera assemblies, mirrors placed at ± 45◦ to the y-axis in the y-z plane fold the beams into +y
and -y directions. This folding was done to limit the length of the instrument to 1.1 m from the
telescope focal plane.

3.3.3 Wollaston Prism Assembly (WPA) Architecture
Fig 4 shows the drawing of the WPA. The WPA is made of two parts, named as the Left Half and
the Right Half. Each half has the following optical components: a glass (BK7) wedge, a half-
wave retarder plate (HWP), a calcite WP and a flat BK7 window. The aperture of all the elements
is 45 mm × 80 mm, making the overall WPA aperture 90 mm × 80 mm. The Left Half has
been designed to separate the 0◦ and 90◦ polarizations, from which the Stokes parameter q will be

                                                  8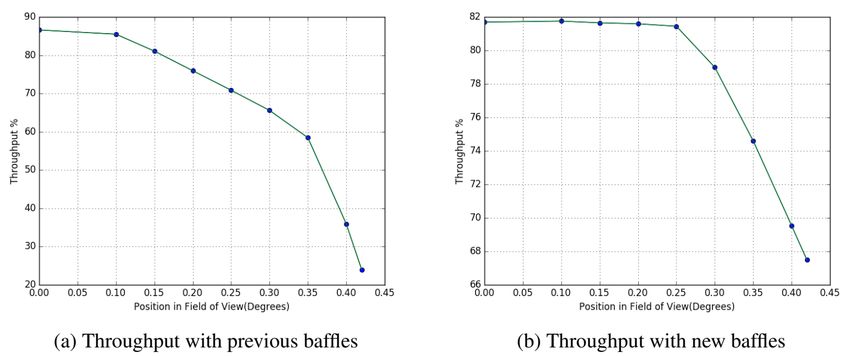
Fig 3: Schematic of the working of the polarizer assembly of the WALOP-South instrument. In
combination, the Wollaston Prism Assembly consisting of the two BK7 glass wedges, Wollaston
Prisms (WP) and Half-Wave Plates (HWP) and the two PBSs act as the polarization beamsplitter
unit of the instrument. The collimated beam at the pupil is split equally between two BK7 wedges
which is then fed to the twin HWP + WP system to be split into four channels with the polarization
states of 0◦ , 45◦ , 90◦ and 135◦ , and two PBSs steer these four beams in four directions. The change
in the polarization state of the beams while passing through this system is annotated.

obtained while the Right Half separates the 45◦ and 135◦ polarizations from which the u parameter
will be obtained. For this purpose, the Left HWP’s fast-axis is along 0◦ and that of the Right one is
at 22.5◦ with respect to the x-axis in the WPA coordinate system. While the right HWP effectively
rotates the EVPA (electric vector polarization angle) of the beam by −45◦ , the left HWP has no
effect on the beam, and has been used to maintain similar optical path as the right HWP. Both
WPs separate 0◦ and 90◦ polarizations. So while the right WP separates 0◦ and 90◦ polarizations
of the incoming beam, because the HWP has rotated the beam by −45◦ , it effectively separates
45◦ and 135◦ polarizations. At the exit face, a BK7 window is placed to provide a surface which
can be anti-reflection (AR) coated. Calcite is a softer material than conventional glasses. During
application of AR coatings, large mechanical and thermal stresses that develop on substrates could
break the large calcite wedges. The complete WPA is cemented together as one unit using the
Norland 65 cement. This is a flexible cement which has been carefully chosen so as to withstand
large stresses in WPs that will arise from anisotropic thermal expansion of calcite WPs22 when
subjected to large temperature variations such as that expected at SAAO’s Sutherland Observatory
(Table 2). To ascertain the flexibility of the cement, sacrificial calcite WPs cemented with Norland
65 were subjected to temperatures in range of −10◦ C to 40◦ C in an environmental chamber.
    Due to extended FOV of WALOP-South, rays from non-axial field points arrive at large oblique
angles at the pupil. This angle α’s approximate value can be found using Eqn 1 (also called Optical
Invariant equation), where D, p and θ are the telescope primary mirror diameter, pupil image

                                                  9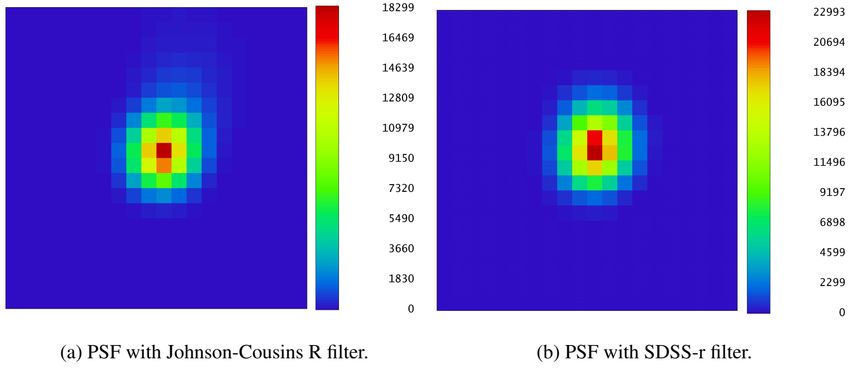
Fig 4: Drawing of the Wollaston Prism Assembly (WPA). The optic axis of the calcite wedges
forming the Wollaston Prisms are marked. All length dimensions are in mm.

Fig 5: Beam splitting action of the Left and Right Half of the Wollaston Prism Assembly (WPA)
as seen from Y-Z plane. The right WP is rotated by 180◦ with respect to the left Wollaston Prism.

                                               10
diameter and the on-sky angle of the field point from center. Without the BK7 wedge, a fraction
of rays from such sources will go on to hit the interface between the Left and Right Half, leading
to throughput loss and possible stray light from scattering at the surface. To avoid such a scenario,
BK7 wedges with tilt angle of 14◦ are used. Fig 10 shows the BK7 wedges bending the rays from
the whole field such that none hit the interface.
D×θ
α= (1)
p
The HWPs are made of Quartz-MgF2 plates designed to provide achromatic half-wave retarda-
tion (within 0.515 to 0.480 λ) over the wavelength range of 0.5 µm to 0.7 µm for normal incidence.
Both the Left and Right HWPs are made by a 2 × 1 mosaic of 45 mm × 40 mm size HWPs. This
was necessitated due to unavailability of larger blanks of Quartz and MgF2 to create a single HWP
of aperture 45 mm × 80 mm. In general, the retardance of a HWP is dependant on the absolute
and azimuth angles of incidence of the incoming beam with respect to the fast axis of the HWP.23
Due to the bending by the BK7 wedges, rays from the entire FOV have oblique angles of incidence
on both the HWPs, and hence undergo ’non-half wave’ retardation. This leads to cross-talk be-
tween all the Stokes parameters, which has been considered and modelled as part of the calibration
method we have developed for the instrument (Section 4.3).
Two identical calcite WPs are used as polarization analyzers. The polarization separation be-
haviour of the WPs is shown in Figure 5. While both the WPs separate 0◦ and 90◦ (called O and
E beams) polarizations, due to the HWPs in front of each WP, the O1 beam and O2 beams corre-
spond to 0◦ and 45◦ while the E1 and E2 to 90◦ and 135◦ . The right WP is rotated by 180◦ with
respect to the left WP. Hence, the O1 beam goes downwards and O2 beam goes upwards, and vice
versa for E1 and E2 beams. This inversion of WPs was done so that the E1 and E2 and O1 and O2
beams can be folded in opposite directions to each other to physically separate the four beams to
correct for their dispersion, the need for which is explained in Section 3.3.5.
The complete polarizer assembly is fabricated by Karl Lambrecht Corporation, Chicago, USA.
3.3.4 Choice of Wollaston Prism (WP)
A WP can be characterized by the following quantities: (a) aperture, (b) material, (c) wedge angle,
(d) optic axis directions in the two wedges forming the WP and (e) extinction ratio. Of these, the
material and the wedge angle decide the split angle of the WP.
The minimum required split angle for a WP (βmin ) to separate the E and O beams such that
they are fully separated on the detectors is given by Eqn 2. It is twice of the angle formed by the
extreme field point in the direction of splitting at the pupil (which is y-axis in our case), given by
Eqn 1. For a FOV of 34.8 × 34.8 arcminute (0.58◦ × 0.58◦ ), the extreme vertical field point is 0.29◦
for which βmin = 8.92◦ .
2×D×θ
βmin = (2)
p
Materials from which WPs of such large split angle can be created in the optical wavelengths
are α-BBO (Barium Borate), LiNbO3 (Lithium Niobate) and calcite. α-BBO and LiNbO3 have
lower birefringence than calcite and are not available in large crystal sizes. Employing WPs made
from either of these would lead to reduction in the pupil image size and consequently higher split
11angle requirement (Eqn 1) and hence larger dispersion and aberrations. Also, calcite has been used
in previous wide-field astronomical polarimeters such as SALT-RSS polarimeter.21 Calcite WPs
have very high extinction ratios > 105 .
The approximate split angle (β) for a WP can be calculated using Eqn 3,24 where ne and no are
extraordinary and ordinary index of refraction and γ is the wedge angle of the WP.
β
sin( ) = (ne − no )tanγ (3)
2
The WP used in the WPA has a wedge angle of γ = 30◦ , for which the split angle comes out
to be 11.4◦ at 0.6 µm (Figure 6). As can be seen, the split angle is larger than βmin . We increased
the FOV from 30.0 × 30.0 arcminutes to 34.8 × 34.8 arcminutes to take advantage of this large
split angle without degrading the image quality. The plate scale for this FOV is 0.5”/pixel, so the
median seeing FWHM (1.5”) is sampled by 3 pixels. Although we could have increased the FOV
further, it would lead to sparser PSF sampling at the detector and higher instrumental noise due to
pixel to pixel sensitivity variation of the CCD.
As can be seen from Eqn 2, for the same telescope, if the pupil diameter is larger, WP with
smaller split angle is required which will introduce smaller dispersion. The issue of dispersion
from calcite WPs is described in Section 3.3.5. So, while it is advantageous to make the pupil
larger to reduce dispersion by using large aperture WPs, the upper limit is set by the availability of
largest calcite crystals. Additionally, making a large pupil makes the collimator design challenging.
Hence we decided to use WPs with the largest available apertures- 45 mm × 80 mm.
3.3.5 Dispersion by WP and the WPA
Birefringence (δn = ne − no ) of crystals and consequently the split angle of WPs depends on the
wavelength (Eqn 3). Figure 6 shows the wavelength dependence of calcite’s birefringence and split
angle for the WALOP WPs. This split angle variation with wavelength leads to the outgoing E and
O beams to have dispersion in the splitting direction. WPs with larger split angle introduce larger
dispersion. There is significant change in the split angle within the SDSS-r band wavelengths of
0.55µm to 0.7µm. In case of WALOP WPs, this leads to dispersion in the y-axis direction in the
outgoing E and O beams corresponding to a spectral resolution R ∼ 80. The dispersion in the
E and O beams are similar (but not equal) and in opposite directions. Hence the dispersion of
both the E and O beams cannot be corrected by placing a suitable glass wedge after the WP exit
surface. Fig 7 shows the dispersion in the E and O images for a 4 × 8 arcminute FOV of the
SALT-RSS polarimeter which employs calcite WPs as the polarization analyzer. As can be seen,
the dispersion of the same stars is in the opposite directions between the top and bottom images. In
addition to the WPs, the BK7 wedges at WPA entrance also introduce dispersion, but in the x-axis
(horizontal). So, the outgoing beams from the WPA suffer from dispersion along both the x and y
directions.
Most imaging polarimeters like RoboPol which do not image the entire FOV on separate de-
tectors use WPs with small split angles (around 1.0◦ ), for which the dispersion is minimal and
lower in value than other optical aberrations of the system. On the other hand, SALT-RSS (Fig 7)
and HOWPol polarimeters image a large FOV on separate detectors, but do not correct for the
dispersion by the WPs and are limited to carry out only narrow-band imaging polarimetry.
120.19 12.50
12.25
0.18
12.00
Split angle (deg)
11.75
Birefringence
0.17
11.50
0.16 11.25
11.00
0.15
10.75
0.14 0.4 0.5 0.6 0.7 0.8 0.9 1.0 10.50
Wavelength ( m)
Fig 6: Dependence of birefringence and split angle of the WALOP Wollaston Prisms on wave-
length.
Fig 7: SALT-RSS two channel polarimeter image of the M30 globular cluster, which employs
calcite Wollaston Prisms as the polarization analyzer. The E and O beams are imaged on the top
and bottom half of the detector. The dispersion in the E and O images for a 4 × 8 arcminute
field is clearly visible. Also, the dispersion direction is opposite in the two images. This image is
reproduced with permission, courtesy of Prof. Kenneth Nordsieck, the PI of the RSS instrument.
13DC Prism No. Beam Glass Name Tilt Angle-X Tilt Angle-Y
Prism 1 O Beam S-TIH6 - 8.3◦
Prism 1 E Beam S-TIH6 - 7.76◦
Prism 2 O Beam S-BSL7 14.0◦ -
◦
Prism 2 E Beam S-BSL7 14.0 -
Table 4: Details of the Dispersion Corrector Prisms used in WALOP-South optical model.
3.3.6 Wire-Grid Polarization Beam-Splitter (PBS)
As the dispersion due to the WPs in E and O beams is in opposite directions, the four beams need to
be separated physically so that the required correction can be applied on each beam. The wire-grid
PBS is designed such that it allows the O-Beam to pass through but folds the E-Beam by acting
as a mirror. Since the two beams have already been completely separated in the angle-space by
the WPA, the lower extinction ratio of the PBS for the E-Beam (which causes some fraction of
O-beams to be folded as well, but at different angles than E-beam) will not lead to any O-Beam
rays reaching the detector of E-Beam cameras. Unlike other types of polarization beam splitter
systems, wire-grid type have uniform performance for large angles of incidence of ± 10◦ and are
available in sizes required for WALOP-South instrument. The PBSs used in the WALOP-South
design are of aperture 78 × 90 mm, and have been fabricated by Moxtek, Inc., Utah, USA. It
has nearly 90 % throughput for p (O Beam) and s (E Beam) polarizations for the transmitted and
reflected beams respectively over the SDSS-r filter wavelengths.
3.3.7 Dispersion Corrector Prisms (DC Prisms)
Each of the four beams have two DC Prisms- the first prism made of S-TIH6 glass corrects the
y direction dispersion and the second prism made of S-BSL7 (glass from Ohara catalogue with
properties identical to BK7) corrects the x direction dispersion. Each prism has one tilted and one
flat surface, as shown in Fig 8, 9 and 10. Details of the DC Prisms are captured in Table 4.
3.4 Collimator Assembly
The collimator assembly begins from the telescope focal plane as shown in Fig 2, 8, 9 and 10. It
consists of 6 spherical lenses placed axially along the z-axis. At the telescope focus, the field size
is 162 mm × 162 mm, from which a pupil of of 65 mm in diameter is formed. The choice of the
pupil size was driven by the architecture of the polarizer assembly described in Section 3.3.4. The
effective focal length of the collimator is 1.6 × 108 mm and its total length is 700 mm.
3.5 Camera Assemblies
Each camera assembly consists of 7 spherical lenses. Fig 8 and 9 shows the optical path for O1 and
O2 beams. The Polarization Beam-Splitter (PBS), described in Section 3.3, allows these beams to
pass straight through to be then folded towards the +y and -y directions by the Fold Mirrors. Fig 10
shows the optical system for the E1 and E2 beams. The PBS folds these beams towards the -x and
+x directions.
The O1 and O2 cameras are identical to each other, i.e, they have identical lens prescription
and air gaps. Similarly, the E1 and E2 cameras are identical to each other. Between the O and
E beam cameras, while the glass types are same for corresponding lenses, their apertures and air
14Fig 8: O1 Beam Optical Path. After getting split by the Wollaston Prism Assembly (WPA), the
Polarization Beam-Splitter (PBS) allows this beam to pass through it to the Dispersion Corrector
(DC) Prisms. The fold mirror downstream then directs this beam along +y direction to its camera.
separations are different. Also, between the O-Beam and E-Beam cameras, the radii of curvatures
and central thicknesses are same for the first five lenses but differ for the last two lenses. As a
design choice, we made the E and O beam cameras as similar as possible to reduce fabrication
effort and cost of the lenses. The f-number at the detectors is 6.12 and 6.06 for the E and O beam
cameras, respectively, which corresponds to effective focal lengths of 6220 mm and 5993 mm.
With 4k × 4k detectors of pixel size 15 µm, the plate scale is 0.5 arcsecond per pixel. This allows
for better than Nyquist sampling for the median seeing FWHM of 1.5 arcsecond at the Sutherland
Observatory.
3.6 Filter, Calibration HWP
The filter and the calibration HWP are located near the pupil image before the polarizer assembly,
as shown in Fig 8, 9 and 10. The initial design idea was to use Johnson-Cousins R as the main
broadband filter. In comparison to this filter, SDSS-r has a similar throughput but a smaller wave-
length spread which helps in reducing the spectral dispersion introduced by the polarizer assembly
and provides better PSFs (refer to Section 4, Fig 12). Fig 11 compares the transmission profiles
between the two filters. The SDSS-r filter used in WALOP-South instrument is of 85 mm aperture
fabricated by Asahi Spectra Co., Ltd. (ASC), Japan.
Rotation of the calibration HWP to orientations that are multiples of 45◦ deg, would in an ideal
instrument interchange the intensities in the O and E beams. Any departure from this behaviour
of the beams passing through the four cameras can be used to correct for any channel dependant
transmission variation. This offers an additional method to calibrate the instrument (Section 4.3)
15Fig 9: O2 Beam Optical Path. After getting split by the Wollaston Prism Assembly (WPA), the
Polarization Beam-Splitter (PBS) allows this beam to pass through it to the Dispersion Corrector
(DC) Prisms. The fold mirror downstream then directs this beam along -y direction to its camera.
during main science observations. The aperture of the calibration HWP is 80 mm × 80 mm, and
is made by a 2 × 2 mosaic of 40 mm × 40 mm size HWPs whose fast-axes are accurately aligned
with each other.
4 Optical Performance
As described in Section 2, the essential performance criterion for the instrument optical design is to
obtain near seeing limited PSF for the entire FOV (within 1.5-2 times the median seeing Gaussian
profile). To carry out polarimetry with sensitivity of 0.05 %, all the photons from a star reaching
the detector need to be counted using aperture photometry. Larger PSFs sample larger sky areas
and lead to higher measurement uncertainty. So, in judging the quality of PSFs obtained, while
FWHMs are a good measure of spatial resolution, for high sensitivity polarimetry, the ensquared
energy radius containing all the starlight (> 99.95 %) is a better measure. For example, Fig 12
shows the PSF at the center of WALOP-South’s FOV for the Johnson-Cousins R and SDSS-r
filters. Although both have similar FWHMs, the radius corresponding to the > 99.95 % ensquared
energy is much larger for the Johnson-Cousins filter due to its extended spectral transmission tail,
as shown in Fig 11.
Figs 13 and 14 show the spot diagrams for the O and E beam cameras at different field points.
As the optical path of the O1 and O2 beams is same, they have identical optical performance.
Same is true of E1 and E2 beams. As can be seen, the dispersion introduced by the WPA has
been corrected by post-WPA optics. On an average, the centroid of the spot diagrams for all
the individual wavelengths within the SDSS-r filter fall within 10 µm (less than a pixel) of each
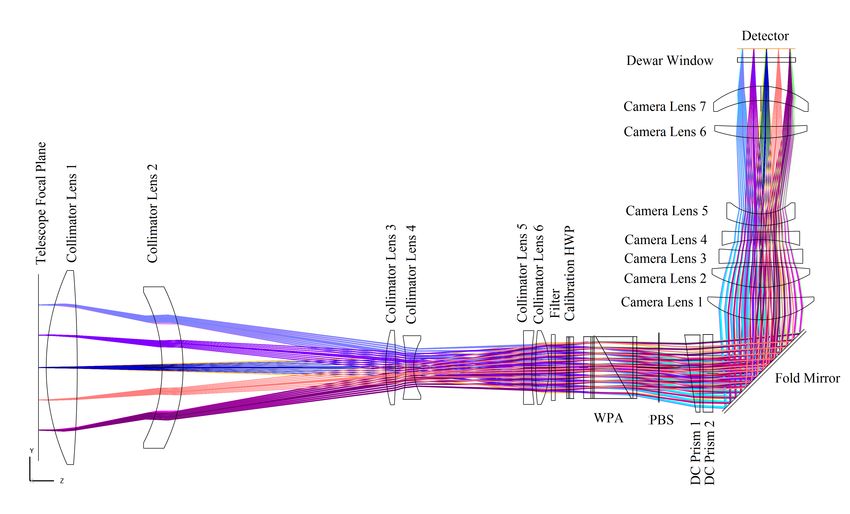
16Fig 10: E1 and E2 Beam Optical Paths. After getting split by the Wollaston Prism Assembly
(WPA), the two Polarization Beam-Splitters (PBS) fold these along -x and +x directions. After
passing through the Dispersion Corrector (DC) Prisms, each beam goes to its camera.
17100
Johnson-Cousins R
SDSS-r
Transmission (%) 80
60
40
20
0
500 550 600 650 700 750 800 850 900
Wavelength (nm)
Fig 11: Comparison of the transmission profiles of the SDSS and Johnson-Cousins R filters. While
both filters have similar throughput, the SDSS-r has a narrower wavelength coverage which reduces
the dispersion by the Wollaston Prisms.
Fig 12: Comparison of the PSF at the center of FOV for a 1.5” (median seeing) input beam at
the detector for Johnson-Cousins and SDSS R band filters. As can be seen, with Johnson-Cousins
filter, we get an elongated PSF due to the residual dispersion from the Wollaston Prisms owing to
the filter’s broad spectral range while we get a symmetric PSF with the SDSS filter.
other for the entire FOV for both E and O beams. The average RMS radius of both the beams is
around 11.5 µm for the whole field. For comparison, the RMS radius for a 1.5 arcsecond FWHM
Gaussian beam (median seeing at Sutherland) with the same plate scale as at the camera detectors
is 19.1 µm. The PSF obtained will be a convolution of the input Gaussian seeing beam with the
spot diagram profile. The radius corresponding to 99.95% of the ensquared energy at different
points in the FOV for a 1.5” FWHM source for the E and O beams is captured in Table 6 under
column name Nominal. The averaged radius for both the beams is less than 75 µm or 5 pixels at
18Fig 13: Spot diagram for the O Beam cameras at the detector for different field points. Different
colors represent rays of different wavelengths, as labeled in the image legend. RMS and GEO
radius stand for the root-mean square and geometric radius of the spot diagrams, respectively. The
optical performance of O1 and O2 beams are identical as they follow identical optical paths.
the detector whereas for an ideal Gaussian this radius is 67.1 µm or 4.5 pixels at the detector.
Tolerance analysis of the optical system was carried out to get an estimate of expected degrada-
tion of spot sizes and ensquared energy radii due to tolerances in fabrication of optical components
and mechanical mounts to hold the optics. Two compensators were defined - one is the separation
between the primary and secondary mirrors of the telescope. The second compensator is the dis-
tance of the detector from the last lens in each camera. We used the Monte Carlo (MC) simulation
feature of Zemax for this work. Table 5 shows the results for the spot radius based on 20,000
Monte Carlo runs for the system. Table 6 lists the radius containing 99.95 % of the ensquared
energy for median seeing conditions for the E and O beams in nominal as well as best and worst
Monte Carlo simulation results at different field points. Even in the worst case scenarios, we get
PSFs equivalent to Gaussian beams with FWHM of 1.6 and 1.3 times the seeing FWHM for the O
and E beams, respectively.
4.1 Thermal Tolerancing
While the WALOP-South instrument will be assembled and characterized in the lab at IUCAA at
around 1 Atm pressure and 25◦ C temperature for which the design has been made, the atmospheric
19Fig 14: Spot diagram for the E Beam cameras at the detector for different field points. Different
colors represent rays of different wavelengths, as labeled in the image legend. RMS and GEO
radius stand for the root-mean square and geometric radius of the spot diagrams, respectively. The
optical performance of E1 and E2 beams are identical as they follow identical optical paths.
20Parameter O-Beams E-Beams
RMS Spot Radius (µm) RMS Spot Radius (µm)
Nominal Spot 11.63 11.77
Root-Sum-Square 17.1 15.37
MC Simulation Best Case 11.72 11.7
MC Simulation Worst Case 37.4 25.5
MC Simulation Mean 17.54 15.72
MC Simulation Std Dev 0.003 0.0018
Table 5: Results of Monte Carlo simulations based tolerance analysis for the O and E beams.
Root-Sum-Square radius is the RMS spot radius obtained if the offset in spot radius due to all
mechanical and optical tolerances are added in quadrature.
Field Poisition O Beams E Beams
Sl. No 99.95 % Ensqaured 99.95 % Ensqaured
X Y
Energy Radius (µm) Energy Radius (µm)
(in Deg) (in Deg) Nominal MC Best MC Worst Nominal MC Best MC Worst
1 0 0 73 75 62 69 69 75
2 0.29 0 62 61 68 64 63 68
3 0 0.29 74 72 96 79 82 62
4 -0.29 0 66 66 66 66 66 82
5 0 -0.29 75 68 165 70 63 114
6 0.29 0.29 86 76 150 82 82 67
7 -0.29 0.29 86 78 112 88 92 78
8 -0.29 -0.29 73 71 154 83 76 140
9 0.29 -0.29 78 78 210 85 74 127
10 0.15 0.15 70 68 68 66 68 64
11 -0.15 0.15 74 74 68 68 70 65
12 0.15 -0.15 62 64 90 65 63 82
Field Average 73 71 109 74 72 85
Table 6: For an input 1.5” (median seeing) beam, radius containing 99.95% of the ensquared
energy of the PSF for the E and O beams in nominal design and the best and worst case Monte
Carlo simulation realizations.
pressure at the Sutherland Observatory is 0.78 Atm due to its higher altitude and the temperature
may change from −10◦ C to 30◦ C during observations. Changes in pressure and temperature lead
to change in thickness, curvature and refractive index of the optics and separation between optical
elements due to expansion/contraction of metallic components used as optics holders and spacers.
The estimated change in the RMS spot radius for different temperature conditions is shown in
the Before Compensation column of Table 7. This image degradation effect can be compensated
by adjusting the separation between the detector and the last lens in each camera. Using Zemax,
thermal tolerancing was carried out on the optical design. As can be seen from the achieved
RMS spot radius after compensation in Table 7, we can get to within 1.1 times the nominal RMS
spot radius using this compensator system for all the temperature conditions at the Sutherland
Observatory.
21Temperature Pressure O Beams E Beams
(in Celsius) (in Atm) RMS Spot Radius (µm) RMS Spot Radius (µm)
Before After Before After
Compensation Compensation Compensation Compensation
25 1 11.63 - 11.79 -
-10 0.78 17.1 12.5 16.7 12.08
0 0.78 17.3 12.19 17.05 11.94
10 0.78 17.55 11.92 17.36 11.84
20 0.78 17.7 11.76 17.65 11.78
30 0.78 17.9 11.7 17.9 11.77
Table 7: Thermal tolerancing results for WALOP-South optical model.
4.2 Stray and Ghost Light Analysis
Stray and ghost light analysis for the entire WALOP-South optical system including the telescope
mirrors and baffles was carried out using the non-sequential mode of Zemax. As part of the study,
we created point sources inside and outside the FOV and light rays were traced through the system.
Using Zemax’s Path Analysis feature, all paths of stray and ghost light from each source reaching
the detectors were identified and controlled in the optical as well as optomechanical model of the
instrument so that for any source the ghost/stray light intensity at the detector is less than 5 × 10⁻⁴
of it’s total intensity incident on top of the telescope tube. For most sources barring the extremely
bright ones (< 10 mag), its stray and ghost light will be undetectable on WALOP-South detectors
as it will be fainter than the background sky. The major source of ghost light from inside FOV
object is due to reflection from the lens surfaces at the beginning of the cameras. To control
the ghost light as well as improve instrument’s throughput, we used high efficiency AR coatings
(R < 0.5%) for all optical surfaces. Fig 15 shows the ghost image pattern from a source at the
center of the FOV. For a total input power of 100 Watts incident on top of the telescope tube,
2 × 10⁻² Watts of power reaches the detector as ghost image.
Fig 16 shows the stray light irradiation for an object in the vicinity of the FOV (source position:
x, y = 19.2, 19.2 arcminute) at one of the four detectors. For a total input power of 100 Watts at
the telescope, 1.4 × 10⁻⁴ Watts of power reaches the detector.
4.3 Polarimetric Modelling and Calibration
To achieve high accuracy linear polarimetry of 0.1 % across the FOV, we need to accurately obtain
the value of the real linear Stokes parameters of a star from those measured by the instrument.
All optical elements can introduce instrumental polarization and cross-talk in the following ways:
(a) due to oblique angles of incidence, which leads to preferential transmission of one orthogonal
polarization over the other , (b) due to stress birefringence in the optics, as a result of thermal and
mechanical stresses on the optics. Over and above these, we expect the main source of instrumental
cross-talk to arise from the non half-wave retardance from the HWPs in WPA, as described in
Sec 3.3.3.
So the measured value of the linear Stokes parameters by the instrument will depend on the
input polarization of the source (cross-talk) and the instrumental zero point (instrumental polariza-
tion). To correct for these effects and obtain high accuracy polarization values, we have developed
22Fig 15: Ghost image formed for an object at the center of the FOV at one of the four detectors. For
a total input power of 100 Watts at the telescope, 2 × 10⁻² Watts of power reaches the detector as
ghost light.
a detailed model for on-sky calibration of the instrument. For this purpose, we have placed a mov-
able linear polarizer at the beginning of the instrument (after the telescope optics and before the
first collimator lens), which will be removed from the optical path during the main observations.
This polarizer will be used to provide as input linearly polarized light with different EVPAs to
the instrument, which will be used to create a mapping function between the instrument’s mea-
sured and real polarization values of stars. Additionally, the model uses standard polarized and
unpolarized stars for building as well as testing the accuracy of the model. We have tested and
validated this scheme by using the Zemax optical model of the instrument and have achieved bet-
ter than 0.1 % accuracy over the entire FOV. We will test the calibration model on sky during the
commissioning of WALOP-South instrument and details of the model and results obtained will be
published as a separate paper.
5 Conclusions
We have described the complete optical model of the WALOP-South instrument which meets all
the design goals to successfully carry out the PASIPHAE Survey. Scheduled for commissioning in
2021, it will be a unique wide field polarimeter. In one shot, it allows determination of I , q and u
with four channels simultaneously imaged on separate detector/camera operating over a broadband
filter wavelength range. We have elaborated the key challenges in creating the design, namely the
dispersion introduced by large split angle Wollaston Prisms and aberrations due to the very wide
field. With WALOP-South optical design, we expect to obtain within 1.6 times the seeing limited
PSF for the entire FOV after correcting for these effects.
23Fig 16: Stray light irradiation pattern for an object in the vicinity of the FOV (source position: x,
y = 19.2, 19.2 arcminute) at one of the four detectors. For a total input power of 100 Watts at the
telescope, 1.4 × 10⁻⁴ Watts of power reaches the detector.
While we have developed the optical model to work for the SDSS-r filter and narrowband filters
within the wavelengths of 0.5 µm − 0.7 µm, the prescription presented can be implemented with
minor modifications to design polarimeters to work over other broadband filters. It can also be
used to design polarimeters with larger FOV by using WPs with larger aperture than those used
in WALOP-South, most likely by employing a mosaic of smaller WPs, without increasing the
split angle and associated spectral aberrations from the WPs. Also, of interest is the possibility
of carrying out low-resolution imaging spectropolarimetry in WALOP-South like polarimeters by
taking advantage of the dispersion created by WPs by not correcting for the dispersion.
Appendix A: Baffles Design
Telescope baffles are used to prevent direct stray light from sources outside the FOV of the in-
strument to reach the telescope focal plane and propagate into the instrument. An efficient baffle
system should achieve this objective with minimal obstruction to light from sources inside the
FOV. The existing baffles at the 1 m SAAO telescope were optimized for a narrow FOV of 12 ar-
cminutes in diameter. The throughput with these baffles at the telescope focal plane for the radial
extent of WALOP-South FOV (the extreme field point is at a distance of 0.41◦ from the center) is
shown in Fig 17 a. While this baffle allows high throughput for objects up to a radius of 6 arcmin-
utes, there is a steep drop in throughput for farther objects. In order to get uniform throughput for
the entire WALOP-South FOV, we designed a new baffle system for the telescope’s primary and
secondary mirrors using the method described by Kumar et al.25 Fig 17 b shows the throughput at
24Fig 17: Comparison of throughput at the telescope focal plane between the previous baffles and
the new baffles for the telescope designed to accommodate WALOP-South’s FOV.
Baffle Length (mm) Outside Diameter (mm)
Primary 1673.6 236.2
Secondary 610.3 424.2
Table 8: Dimensions of the new telescope baffles designed for the 1 m SAAO telescope.
the telescope focal plane with the new baffle system. Table 8 captures the dimensions of the new
baffles. The new baffle system has been optimised for a FOV of 30 arcminutes in diameter, and
there is minor drop in throughput for farther field points. The average throughput for the complete
field is 80.3% in comparison to 72.8% from the previous baffles.
Appendix B: Guider Camera Design
As WALOP-South will be mainly observing the southern Galactic polar regions where there are
less number of stars available per square degree, there is sparsity of available guide stars. Addi-
tionally, the guider camera field must lie outside of the main science field as any guider optics and
associated mechanical structure may lead to reflection of light leading to stray light on the detector.
As can be seen in Fig 17, the throughput from the telescope is lower outside the science field. The
auto-guider camera for the instrument needs to have a large enough FOV to be able to find guide
stars for all fields to be covered in PASIPHAE survey. We estimate a minimum required FOV area
of 200 square arcminutes for the guider camera. The guider camera designed for WALOP-South
is a modified version of the guider camera on the 1 m Lesedi Telescope at SAAO’s Sutherland
Observatory. Fig 18 a shows the FOV for the guider camera which is located near the telescope
focal plane. This region spanning 540 square arcminutes will be patrolled using two linear stages
on which the camera optics, consisting of a pick-off mirror and a lens doublet, and a Lodestar X2
CCD detector will be mounted. The pick-off mirror will be moved to the position of the light beam
path coming from the target guide star and folded sideways to be imaged on the detector after
correction of aberrations by the lens doublet. Fig 18 b shows the PSF obtained (FWHM = 2.2”)
for median seeing FWHM of 1.5”.
25Fig 18: (a) Schematic of the available FOV for WALOP-South guider camera and (b) PSF at the
guider camera detector across the FOV.
Acknowledgments
The PASIPHAE program is supported by grants from the European Research Council (ERC) under
grant agreement No 771282 and No 772253, from the National Science Foundation, under grant
number AST-1611547 and the National Research Foundation of South Africa under the National
Equipment Programme. This project is also funded by an infrastructure development grant from
the Stavros Niarchos Foundation and from the Infosys Foundation.
We are thankful to Vinod Vats at Karl Lambrecht Corp. for his inputs and suggestions on
various aspects of the polarizer assembly design and fabrication and Prof. Kenneth Nordsieck for
sharing his experience and ideas on thermal properties of calcite Wollaston Prisms.
We thank the anonymous reviewers of the paper whose comments and suggestions helped
improve the paper.
References
1 W. A. Hiltner, “Polarization of light from distant stars by interstellar medium,” Science
109(2825), 165–165 (1949).
2 J. S. Hall, “Observations of the polarized light from stars,” Science 109(2825), 166–167
(1949).
3 J. Hough, “Polarimetry: a powerful diagnostic tool in astronomy,” Astronomy And Geo-
physics 47, 3.31–3.35 (2006).
4 S. Scarrott, “Optical polarization studies of astronomical objects,” Vistas in Astronomy 34,
163 – 177 (1991).
26You can also read