South Napa M 6.0 Earthquake of August 24, 2014
←
→
Page content transcription
If your browser does not render page correctly, please read the page content below
South Napa M 6.0 Earthquake of
       August 24, 2014

   ASCE TCLEE Preliminary Reconnaissance Report

                         Prepared by

                             Editor:
           John Eidinger – G&E Engineering Systems

                     Investigation Team:
         Alexis Kwasinski – University of Texas at Austin
                   Mark Yashinsky - Caltrans
  John Andrews – California Department of Water Resources
            Anshel Schiff – Precision Measurements
                 Alex K. Tang - L&T Consulting
Charles Scawthorn – University of California, Berkeley / SPA Risk
               Tom O'Rourke – Cornell University

                    September 02, 2014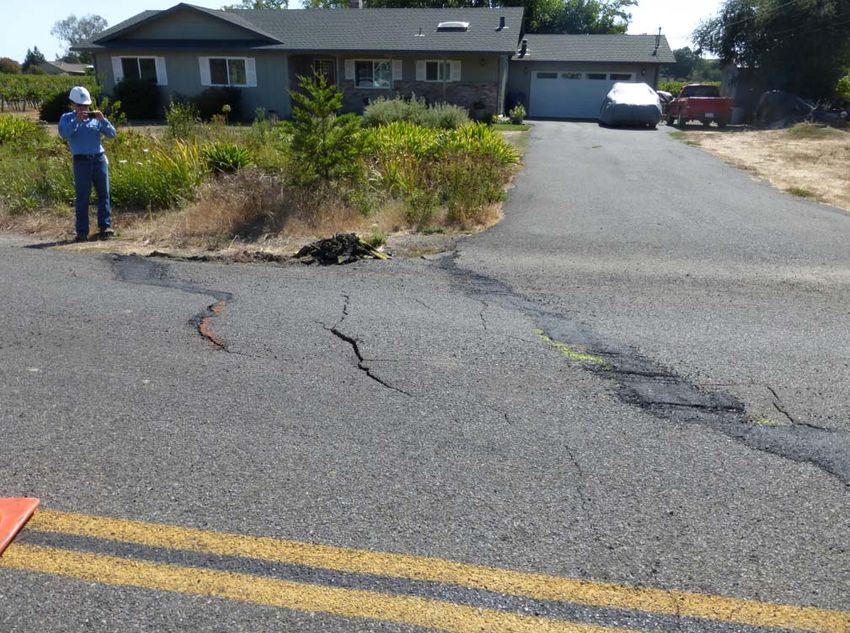
South Napa M 6.0 Earthquake                                                                                                Rev. A September 1 2014

Table of Contents
TABLE OF CONTENTS .............................................................................................................................. I
1.0 INTRODUCTION .................................................................................................................................. 1
    1.1 OUTLINE OF THIS REPORT ..................................................................................................................... 1
    1.2 KEY FINDINGS ...................................................................................................................................... 1
    1.3 LIMITATIONS ........................................................................................................................................ 2
    1.4 ACKNOWLEDGEMENTS ......................................................................................................................... 3
    1.5 ABBREVIATIONS ................................................................................................................................... 3
    1.6 UNITS ................................................................................................................................................... 3
2.0 SEISMIC HAZARDS ............................................................................................................................. 5
    2.1 LOCATION OF THE EARTHQUAKE .......................................................................................................... 6
    2.2 GEOLOGIC CONDITIONS AND LIQUEFACTION SUSCEPTIBILITY ........................................................... 12
    2.3 SERA LISTINGS OF SHAKEMAP GROUND MOTIONS........................................................................... 15
    2.4 SURFACE FAULTING ........................................................................................................................... 23
3.0 PERFORMANCE OF PG&E POWER SYSTEM ............................................................................ 32
4.0 PERFORMANCE OF WATER AND WASTEWATER SYSTEMS............................................... 37
5.0 PERFORMANCE OF TRANSPORTATION.................................................................................... 41
    5.1 BRIDGE 23-0064 ................................................................................................................................. 41
    5.2 BRIDGE 21-0049 ................................................................................................................................. 42
    5.3 BRIDGE 21-0108 L/R .......................................................................................................................... 43
    5.4 HIGHWAY 37 ...................................................................................................................................... 43
6.0 PERFORMANCE OF TELECOMMUNICATIONS SYSTEM ...................................................... 45
7.0 FIRE FOLLOWING EARTHQUAKE .............................................................................................. 47
8.0 OTHER.................................................................................................................................................. 49
9.0 REFERENCES ..................................................................................................................................... 50

ASCE - TCLEE                                                                                                                                             Page i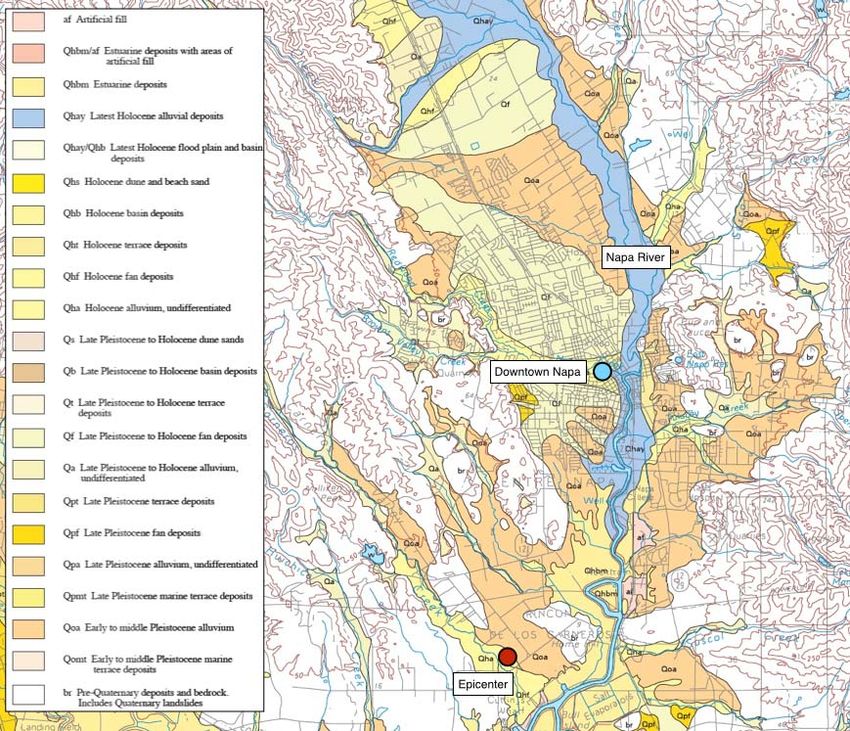
South Napa M 6.0 Earthquake                                              Rev. A September 1 2014

1.0 Introduction
This report describes the performance of lifelines systems due to the Napa, California M
6.0 earthquake of August 24, 2014.
This report is an initial overview of the lifeline performance. It is based on preliminary
and necessarily incomplete information. Findings in this report may change, as more
information becomes available.
1.1 Outline of this Report
This report is organized into the following sections:
    o Section 2 describes seismic hazards, including ground shaking, liquefaction and
      surface faulting.
    o Section 3 describes the performance the power system.
    o Section 4 describes the performance of water and wastewater systems.
    o Section 5 describes the performance of highway bridges and roads.
    o Section 6 describes communications.
    o Section 7 covers fire following earthquake, hospitals / injuries and the gas system
    o Section 8 provides references.
1.2 Key Findings
The location of the fault rupture was south and west of urbanized Napa, California, in a
rural area. It is a right lateral strike-slip faulting. In this area, there was surface ground
rupture, and local ground motions likely exceeded PGA = 0.5g.
A series of ShakeMaps were produced for this earthquake by the USGS. As of August
31, 2014, three such maps were produced, which in this report are called versions 1, 2, 3
(v1, v2 and v3). As time progresses after a large earthquake more instruments "call in"
their data, and the three versions use 617, 619 and 665 instruments, respectively. The
version 3 ShakeMap includes more instruments located close to the fault rupture, as well
as the implied fault geometry, thus making for much-improved ShakeMaps in the near-
field areas. The version 3 ShakeMap also includes one instrument about 20 km south of
the epicenter, with a recorded very high motion (PGA = 0.98g); but the time history trace
for this instrument looks unusual, suggesting that the perhaps something happened to
cause false readings. The version 3 ShakeMaps in this report include this instrument data,
and this considerably changes the intensity of shaking south of the epicenter near Vallejo
and Martinez and Carquinez, to levels which may be incorrectly high.
Surface faulting on the order of a few inches occurred near the epicenter.
Liquefaction effects have so far not been widely observed, even though much of the area
that was exposed to strong shaking was mapped as being in either Very High or Highly
susceptible soils. Damage to buried pipes, though; suggest that some type of soil PGDs
did occur, even if PGDs were not readily observable. Future Lidar and mapping work
may clarify the situation.

ASCE - TCLEE                                                                              Page 1
South Napa M 6.0 Earthquake Rev. A September 1 2014
Electric Power System
Up to 70,000 PG&E customers, affecting about 200,000 people, lost power. Essentially
all power was restored within 24 hours after the earthquake. The reasons for these
outages are related to the following:
The performance of the 60 kV – 230 kV transmission system was "superior"
(essentially no functional damage). This allowed power to remain "on" during the
strong shaking and for many seconds thereafter.
As the overhead distribution circuits were energized, when the wire slapping
occurred, that resulted in blown fuses (cut-outs) and power outages.
More than 90% of all outages appear to be related to wire slapping.
No overhead poles are known to have collapsed. Early estimates are than more
than 11,000 poles were exposed to PGA > 0.2g.
Water and Wastewater System
Potable water supply is provided by three agencies in the strong shaken areas: Napa,
American Canyon and Vallejo water departments. By August 25, about 40 pipe breaks
had been identified. By August 29, more than 120 water pipe breaks had been identified.
More than 10 pipe repair crews were working to repair these, with full service estimated
to be restored by August 31. As pipes were being repaired and re-pressurized, additional
downstream pipe breaks were identified. There was no reported damage to water
treatment plants.
As of the time of writing this report, wastewater agencies were inspecting sewers using
video. While no sewage spills are presently known, it is suspected that there will have
been damage to the sewage collection system serving Napa. There was no damage to the
wastewater treatment plants in Sonoma Valley.
Transportation
Very little damage to bridges was observed. This is mainly due to the bridge upgrade
program by Caltrans, demonstrating good engineering works. Major roads that traversed
mapped liquefaction zones showed very little or no liquefaction-distress.
Telecommunications System
A very early survey suggests that one communication building in central Napa suffered
some structural damage that led to loss of offsite power. The emergency generator
reportedly did not work, so battery power was required and did work. Battery power had
to be supplemented by portable generators and ventilation equipment.
Fire Following Earthquake.
Seven (7) fire ignitions are known. There was little wind, which helped limit fire spread.
1.3 Limitations
The findings in this quick reconnaissance report were developed within the first few days
of the earthquake, and must be considered preliminary. The data in this report may be
ASCE - TCLEE Page 2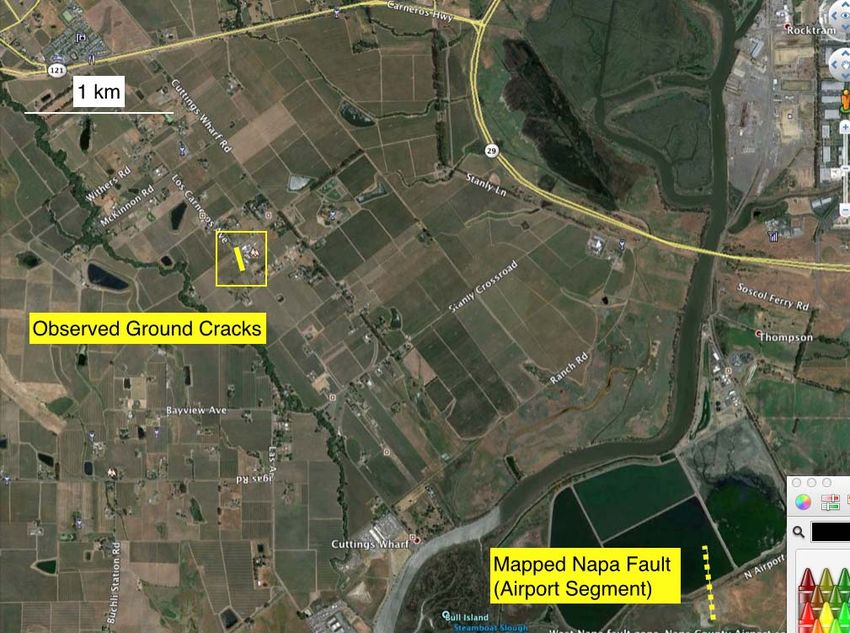
South Napa M 6.0 Earthquake                                           Rev. A September 1 2014

incomplete, and the interpretations may be incorrect. The authors of this report make no
warranty of any kind. ASCE posting this report is not responsible for the contents.
1.4 Acknowledgements
This report was edited by John Eidinger, with contributions by Mr. Mark Yashinsky
(transportation), Prof. Alexis Kwasinski (telecom and electric power), Prof. Anshel Schiff
(electric power), Mr. John Andrew (water and wastewater), Prof. Tom O'Rourke
(pipeline and geotechnical), Mr. Alex K Tang (telecom and electric power), Prof. Charles
Scawthorn (fire following earthquake). Comments were provided by Prof. Jon Bray, who
is leading a geotechnical investigation by GEER.
Photo credits: M. Yashinsky (Figures 5-1, 5-2, 5-3). A. Schiff (Figure 3-3). City of Napa
(Figures 4-1, 4-2, 4-3). KGO (Figures 6-1, 6-2). Google (underlying aerial photos in
Figures 2-19 and 2-20), Prof. C. Scawthorn (7-1 and 7-2). All other figures belong John
Eidinger.
1.5 Abbreviations
ASCE            American Society of Civil Engineers
cm              centimeter
g               acceleration of gravity (=32.2 feet / second / second = 981 gal)
G&E             G&E Engineering Systems Inc.
km              kilometer
kV              kilovolts
M               Magnitude (moment magnitude unless otherwise noted)
PGA             Peak Ground Acceleration, g
PGD             Permanent Ground Displacement, (inches or cm)
PGV             Peak Ground Velocity (measured in inches/second or cm/sec)
PG&E            Pacific Gas and Electric
SERA            System Earthquake Risk Assessment
USGS            United States Geological Survey

1.6 Units
This report makes use of both common English and SI units of measure.
Common Conversions
1 kip = 1,000 pounds
1 foot = 12 inches
1 inch = 25.4 mm = 2.54 cm
1 mile = 1.609347 kilometers
1 pound-force = 4.448 newtons
1 pound = 0.453592 kilogram

ASCE - TCLEE                                                                           Page 3
South Napa M 6.0 Earthquake         Rev. A September 1 2014

1 psi = 6.894757 kiloPascal (kPa)
1 kPa = 0.145038 psi
1 m = 1,000 mm = 100 cm

ASCE - TCLEE                                         Page 4
South Napa M 6.0 Earthquake Rev. A September 1 2014
2.0 Seismic Hazards
Section 2 describes the seismic hazards in this earthquake.
Section 2.1 provides maps showing the location of the earthquake, major
population centers, an overview of the ground shaking levels.
Section 2.2 describes the geologic conditions and liquefaction susceptibility of the
Napa and north San Francisco Bay region.
Section 2.3 provides maps showing PGA, PGV, and Spectra Accelerations in the
Napa area.
Section 2.4 provides listings of ground motion values (PGA, PGV, Spectra) at all
PG&E substations in the strong shaking areas.
Section 2.5 examine the observed surface faulting.
ASCE - TCLEE Page 5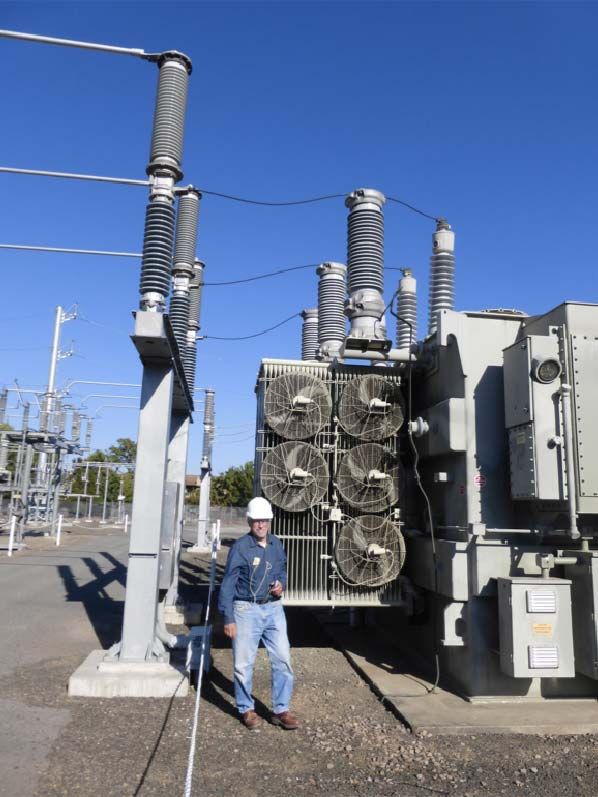
South Napa M 6.0 Earthquake Rev. A September 1 2014
2.1 Location of the Earthquake
At 3:20 A.M., Pacific Time, on August 24, 2014, an earthquake occurred near the city
Napa, California. Figure 2-1 shows a map of the region, with major places and
populations, along with a map1 of the level of ground shaking.
Figure 2-1. Place Names and Populations, SERA ShakeMap - v1 (PGA). (Courtesy John
Eidinger)
In Figure 2-1, the bright blue "dot" corresponds to an early interpretation of the location
of the epicenter of the earthquake; the green squares represent the major population
centers (population in brackets). The colors of the shaking correspond to:
Blue. PGA = 0.55g+
Green. PGA 0.40g – 0.55g
Magenta. PGA 0.25g to 0.40g
Dark Grey. PGA 0.20g to 0.25g.
Cyan. PGA 0.15g to 0.20g.
Yellow. PGA 0.10g to 0.15g.
Light Grey. PGA 0.05g to 0.10g.
1
All ShakeMaps in this report were prepared using SERA. This map shows PGA, maximum of
NS and EW components, based on a ShakeMap using 617 recording instruments (Version 1).
Other maps and tables rely on version 2 (619 reporting instruments) or version 3 (665 reporting
instruments).
ASCE - TCLEE Page 6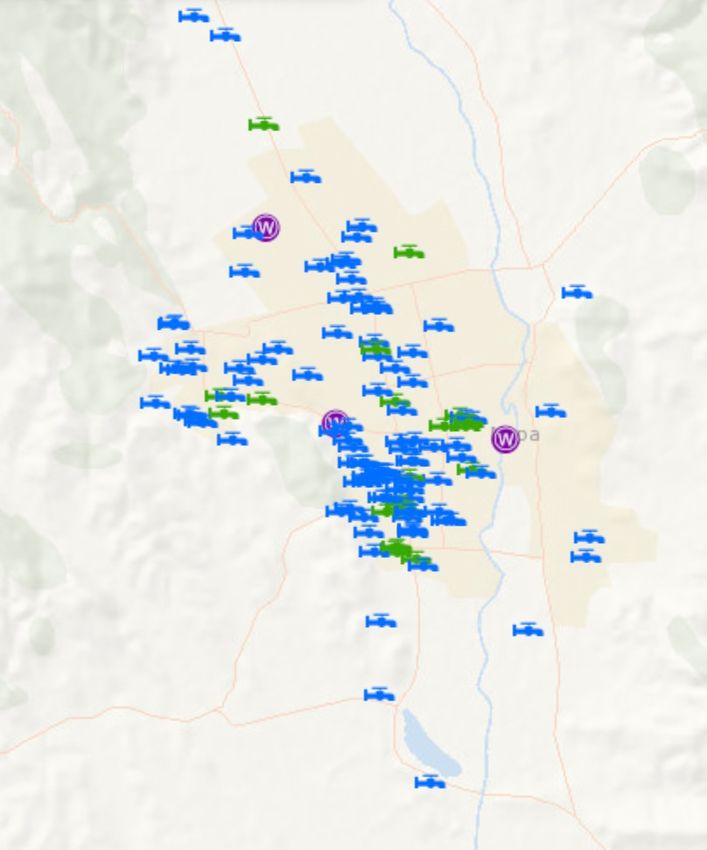
South Napa M 6.0 Earthquake Rev. A September 1 2014
White (no color). PGA < 0.05g.
Figure 2-2 shows the version 3 ShakeMap, produced August 29, 2014. In this version, the
fault geometry is incorporated into the ShakeMap, as well as additional recording
stations. Importantly, more than 40 additional instruments are included that were not
available for the first ShakeMap. The following highlights some key instruments.
Instrument (CE.68206) recorded PGA = 0.98g (North South), 0.51g (East West)
and 0.32g (Vertical). This instrument is located 20 km from the epicenter; given
the distance to the epicenter, the meaning of this very high PGA level is still being
reviewed, and this may again change future ShakeMaps.
Instrument (NC.N016) recorded PGA = 0.65g (North South), 0.32g (East West)
and 0.24g (Vertical). This instrument is plotted as a red dot in Figure 2-4. This
instrument is located 3.9 km from the epicenter.
Instrument (NC.N019B) recorded PGA = 0.28g (North South), 0.37g (East West)
and 0.18g (Vertical). This instrument is plotted as a blue dot in Figure 2-4. This
instrument is located 6.1 km from the epicenter.
The extra instrument recordings strongly influence the PGA map towards Vallejo and
Martinez. The additional of fault geometry also strongly influences the PGA map near
Napa.
ASCE - TCLEE Page 7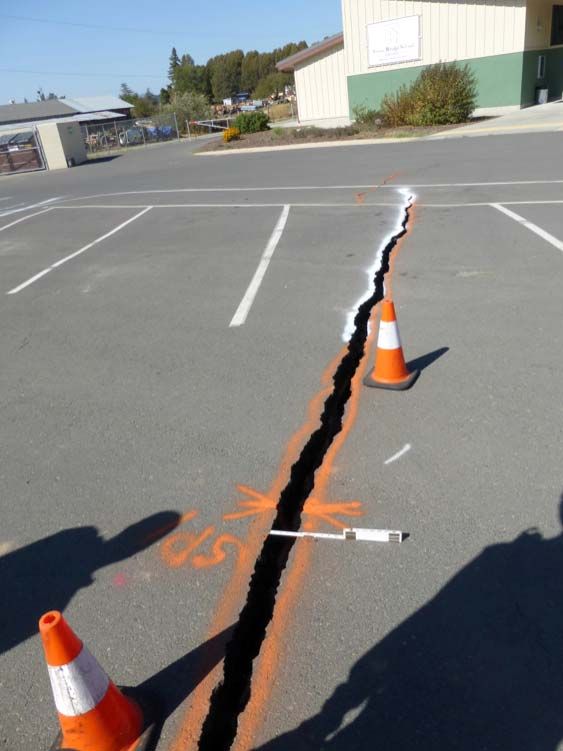
South Napa M 6.0 Earthquake                                  Rev. A September 1 2014

 Figure 2-2. Place Names and Populations, SERA ShakeMap -3 (PGA) (Courtesy John
                                    Eidinger)

ASCE - TCLEE                                                                  Page 8
South Napa M 6.0 Earthquake Rev. A September 1 2014
Figure 2-3 shows the underlying data from strong motion instruments that produced the
map in Figure 2-1. In preparing this map, a total of 617 strong motion instruments
recorded the earthquake. In Figure 2-2, the small dots show the location of each
instrument. For instruments that recorded motions higher than PGA = 0.05g, colored dots
are plotted, using the same scale as in Figure 2-1. Using attenuation models, default soil
maps and the estimated location of the epicenter, the USGS ShakeMap software
interpolates between the dots in Figure 2-2 to produce the shaking map in Figure 2-1.
Figure 2-3. Strong Motion Instruments (PGA) (Courtesy John Eidinger)
ASCE - TCLEE Page 9South Napa M 6.0 Earthquake Rev. A September 1 2014
Figure 2-4 shows the underlying data from strong motion instruments that produced the
map in Figure 2-2. In preparing this map, a total of 665 strong motion instruments
recorded the earthquake. Using attenuation models, and the assumed fault geometry, and
default soil maps and the estimated location of the epicenter, the USGS ShakeMap
software interpolates between the dots in Figure 2-4 to produce the shaking map in Figure
2-2. The instrument that produced the (possibly anomalous) PGA = 0.98g value is
"mostly hidden" under another instrument dot that is plotted as "green".
Figure 2-4. Strong Motion Instruments (v 3) (PGA) (Courtesy John Eidinger)
The actual fault geometry is not used in producing the ShakeMap in Figure 2-1. The red
line in Figure 2-1 is a preliminary interpretation of the actual fault rupture. Once the fault
rupture location is better quantified, updated ShakeMaps will tend to remove the "bull-
eye" directly over the epicenter, and replace it with strong shaking that emanates more
regularly from either side of the fault rupture; this is clearly seen in Figure 2-2. There will
likely be some refinements in the ShakeMaps as more data gets processed.
Figure 2-5 shows the known active faults in the region. Based on preliminary
interpretation, it appears that the West Napa fault caused the August 24 2014 earthquake.
The red lines correspond to the locations of active faults in the USGS 2008 database of
Quaternary active faults, as used in preparation of U. S. National seismic hazard maps,
such as those used in the 2012 IBC. While these red lines are accurate enough for
preparation of national ground shaking hazard maps, they are not detailed enough for
local assessments of hazards such as surface faulting.
ASCE - TCLEE Page 10South Napa M 6.0 Earthquake Rev. A September 1 2014
Figure 2-5. Nearby Active Faults (Courtesy John Eidinger)
ASCE - TCLEE Page 11South Napa M 6.0 Earthquake Rev. A September 1 2014
2.2 Geologic Conditions and Liquefaction Susceptibility
Figure 2-6 shows a geologic map of the Napa area. This geologic map (USGS) was
prepared by Sowers et al (1998).
Figure 2-6. Geologic Map (USGS, Sowers et al, 1998)
In preparing the map, Sowers et al were particularly concerned by the geologic conditions
of greatest concern that can lead to liquefaction:
Holocene estuarine deposits
Holocene stream deposits
Eolian sands
Artificial fills
In developing this geologic map, Sowers et al first interpreted aerial photographs and
topographic maps to determine the depositional environment and to estimate relative age
by evaluating landforms and geomorphic relationships. Second, published soil survey
data (dated 1956 through 1985) was reviewed to assess the character and age of near-
surface deposits.
ASCE - TCLEE Page 12South Napa M 6.0 Earthquake Rev. A September 1 2014
Figures 2-7 and 2-8 show the liquefaction susceptibility map for the San Francisco and
Napa areas (after Knudsen 2000 and Witter 2006), respectively. In these maps, red = very
high; pink = high; yellow = moderate; green = low; grey = non / very low; white = none /
not mapped; heavy red line = West Napa fault location.
Figure 2-7. Liquefaction Susceptibility Map, San Francisco Bay Area (Courtesy USGS
Knudsen et al)
ASCE - TCLEE Page 13South Napa M 6.0 Earthquake Rev. A September 1 2014
Figure 2-8. Liquefaction Susceptibility Map, Napa and Sonoma Valley Area (Courtesy
USGS Knudsen et al)
By examining Figures 2-6, 2-7, and 2-8 (surface geology and liquefaction maps) and
Figures 2-1 and 2-2 (PGA), one might expect that perhaps 20% to 40% of the areas
mapped as being Holocene (young) and exposed to PGA > 0.3g, should have shown
evidence of liquefaction. Initial maps of water pipe leaks in Napa would seem to validate
this; however, initial assessment at the ground level by teams of geologists have not (yet)
shown widespread effects of liquefaction in these areas. As of the time of writing this
report (7 days post-earthquake), liquefaction assessments are still being developed, so
these observations may yet change. However, the following (initially) can be surmised:
The low magnitude of this earthquake (M6.0) results in relatively short duration
of very strong shaking (PGA > 0.2g). Liquefaction in moderate to high
susceptible soils tends to be triggered at PGA > 0.15g at a minimum (sometimes
PGA > 0.3g), and the short duration results in small settlements (volumetric
strains) or lateral spreads, even where liquefaction occurs.
The underlying liquefaction susceptibility map includes "High" and "Very High"
zones for locations with very different soils: both loose sandy / gravelly soils
ASCE - TCLEE Page 14South Napa M 6.0 Earthquake Rev. A September 1 2014
(such as very near the banks of the Napa River), as well as locations with young
Bay Muds (north of San Pablo Bay). Young Bay muds are very weak clays, and
could fail under very high magnitude (such as M 7.5 events) due to shear strain
failure), with attendant slumps, but not much at M 6; if these muds are not
interbedded with sandy lenses, there may be very modest / small permanent
movements at M 6.0, although moderate large transient displacement might still
occur.
2.3 SERA Listings of ShakeMap Ground Motions
The SERA program is used to interpret the USGS instrumental strong motion data and
ShakeMap data. For the results presented in this report, SERA v. 8.4.3.3 is used.
Figure 2-9. SERA header, version, run time (Courtesy John Eidinger)
Figure 2-10 shows the SERA ShakeMap header information. This shows the event ID
(72282711), time, magnitude and estimated epicenter of the event, the boundaries (in
UTM Zone 10 coordinates) within which ShakeMaps are computed, and the time the data
was processed by the USGS (in this case, Sunday Aug 24 2014 at 22:21:05.) Over time,
as more data becomes available, USGS recomputes the instrumented data and resulting
ShakeMaps, and the older versions of the data are removed from the USGS web site.
Earlier on August 24, USGS first released a ShakeMap that was processed at 16:21:29.
Figure 2-10 shows the second data set. Between the first and second datasets, the
ASCE - TCLEE Page 15South Napa M 6.0 Earthquake Rev. A September 1 2014
epicenter was moved about 800 meters to the east, and more instruments reported in (619
total), with more processing of data for all instruments. Between the second and third
datasets, more instruments were added (655 total), and the fault geometry was defined.
As time progresses, the ShakeMaps will tend to get refined and improved. Note: USGS
tends to repeat the ShakeMap processing only for larger events (such as this earthquake),
whereas for smaller events, USGS generally only releases one ShakeMap.
Figure 2-10. ShakeMap-v2 Data (Courtesy John Eidinger)
ASCE - TCLEE Page 16South Napa M 6.0 Earthquake Rev. A September 1 2014
Figure 2-11. ShakeMap-v3 Data (Courtesy John Eidinger)
ASCE - TCLEE Page 17South Napa M 6.0 Earthquake Rev. A September 1 2014
Figure 2-12 shows the distances between the epicenter and the mapped faults (from
Figure 2-5). In this event, SERA shows that the most likely causative fault is the West
Napa fault, with the estimated epicenter being 2.3 km from the mapped fault (surface
projection).
Figure 2-12. Distance to faults within 75 km of epicenter (v2, v3) (Courtesy John
Eidinger)
Figure 2-13 shows a sample listing the raw ShakeMap-3 data produced by the USGS.
This "raw" data is included in the file "grid.xyz" that is produced by the USGS, and then
downloaded to be read into SERA. In this case, the "grid.xyz" file has 60,501 entries,
each computed at a latitude / longitude pair. For this event, six parameters are computed
at each point: PGA, PGV, MMI, PSA03 (T = 0.3 seconds, 5% damping), PSA10 (T =
1.0 seconds, 5% damping), PSA30 (T = 3.0 seconds, 5% damping). Each value is meant
to represent the maximum of NS and EW motions (excluding vertical).
There are many steps in developing this data. Essentially, the instrument data are
deconvoluted to "equivalent rock". Then the "equivalent rock" data is extrapolated to a
regular set of grid points (the latitude / longitude pairs in Figure 2-13). Then, the
"equivalent rock" motions are re-convoluted to the surface, assuming a soil map for each
grid point. The soil map in ShakeMap is based on indirect computation of likely soil
conditions based on local slope. The soil deconvolution and reconvolution factors are
based on simplified "bump up" factors commonly adopted in codes. The attenuation
model in ShakeMap is currently a single model, circa 2007.
ASCE - TCLEE Page 18South Napa M 6.0 Earthquake Rev. A September 1 2014
After going through this process, the minimum and maximum of the ShakeMap are listed
at the bottom of Figure 2-13. For example, the maximum ShakeMap PGA value is 85.32
(0.8532g) [for ShakeMap-2 data, the corresponding values were 64.37 (0.6437g)]. This
value reflects that there usually are instrument directly over the fault (epicenter), so the
ShakeMap "back-calculates" the assumed motions at the epicenter (and in version 3, to
the assumed fault rupture) using attenuation models, interpolations and assumed soil
profiles. Even with all these assumptions, the resulting ShakeMaps that use these 60,501
points are often interpreted as being extremely "accurate", as a) they come from the
USGS, and b) they are based on instruments. In fact, no more than about 1% of
ShakeMap grids points have "accurate" instrumental data (655 instruments produced
60,501 grid points, and some of the instruments are outside the grid boundaries); and
even within a grid point that has a instrument, many studies show that variation in high
frequency content of spectra (such as PGA, SA (T=0.3 seconds), varies considerably
even over distances as short as 100 meters. Therefore, as a rule of thumb, unless situated
immediately at an instrument location, ShakeMap grid data should usually be considered
to be no more accurate than about ±50%.
Figure 2-13. Raw ShakeMap Grid Data (v3) (Courtesy John Eidinger)
ASCE - TCLEE Page 19South Napa M 6.0 Earthquake Rev. A September 1 2014
Figure 2-14 shows the ShakeMap station list header.
Figure 2-14. ShakeMap Instrument Station List Header (v 1 v 2 v 3) (Courtesy John
Eidinger)
In SERA, a complete listing is provided for all 665 (v3) 619 (v2) 617 (v1) recording
instruments. Each instrument (one instrument per row) can provide up to 23 fields of
data:
Station code
Longitude, Latitude
Epicentral distance
Network Code
Channel description (NS, 3) or (EW 2) or (VT, 1)
For each channel, PGV, PGA, PSA03, PSA10, PSA30
ASCE - TCLEE Page 20South Napa M 6.0 Earthquake Rev. A September 1 2014
Figure 2-15. ShakeMap Instrument Station List (Sample, NS Channel Only) (Courtesy
John Eidinger)
Each instrument can record three channels. Depending on instrument health, some
instruments might not record in one or more channels, or have some other type of loss of
data. These cases are listed as -1.000 values (no data) or blank (no data); etc. Also,
depending how the instruments were set up, the horizontal orthogonal directions might be
NS and EW (true in nearly all instruments), but sometimes as channels 2 and 3 (90
degrees from each other). In SERA, the data for each channel is assessed, grouped into
NS, EW or Vertical bins, and then listed accordingly; missing / bad data is listed as
-1.0000 (for example, instrument BK.CVS) and this data is ignored when computed
minima and maxima.
Figure 2-16 shows more of the NS channel instruments, highlighting two that have strong
motions (68150 and 68310). Comparing the results from these two instruments (both near
the epicenter):
ASCE - TCLEE Page 21South Napa M 6.0 Earthquake Rev. A September 1 2014
Both instruments show high PGA and PSA03 motions (epicentral distance
varying by a factor of 2, and motions vary by about a factor of 2)
Instrument 68150 also shows high PGV, PSA10 and PSA30 motions, but
instrument 68310 shows only about 1/10th the motions. This suggests that
instrument 68310 is a "rock" site, while 68510 is a "soil" site.
Figure 2-16. ShakeMap (v2) Instrument Station List (NS Channel Only) (Courtesy John
Eidinger)
Figures 2-17 and 2-18 show the maximum recorded for each channel, for 655 (v3) or 619
(v2) stations. The highest recorded PGA = 0.9790 g (v3). Compare to the ShakeMap,
where the inferred highest horizontal motion in the area is PGA = 0.8532 g (v3). As
discussed earlier, the ShakeMap motions are different than the instrument motions due to
the use of attenuation models, and various interpolation / soil computations, to backward
infer the highest motions at the epicenter (fault rupture for v3). The estimated error at the
instruments is likely under ±2%; the estimated error at the vast majority of the ShakeMap
locations is at least ±50%. As the "grid" cell with the instrument that recorded 0.98g also
ASCE - TCLEE Page 22South Napa M 6.0 Earthquake Rev. A September 1 2014
has another nearby instrument that recorded much lower motions, the resulting
ShakeMap (v3) averages out the very high 0.98g value to a lower value.
Figure 2-17. Instrument Maxima (v3) (Courtesy John Eidinger)
Figure 2-18. Instrument Maxima (v2) (Courtesy John Eidinger)
2.4 Surface Faulting
On August 26, 2014, the editor visited one area, which shows ground failure. The
location is shown by the solid yellow line in Figure 2-19. In Figure 2-19, the dashed
yellow line shows the inferred location of the Napa fault zone, based on prior studies. In
one projects this dashed line to the north, where it would connected up with the mapped
ASCE - TCLEE Page 23South Napa M 6.0 Earthquake Rev. A September 1 2014
Browns Valley segment of the West Napa fault zone, it is located about 2 km easterly of
the solid yellow line, where (apparently) surface rupture was observed.
While it is yet possible that the ground failures at the solid yellow line will be ultimately
attributed to a lateral spread, the nature of the cracks suggest surface faulting, for the
following reasons:
It seems to be right lateral in nature
The ground cracks are en echelon, oriented in a manner consistent with soil pull
apart associated with right-lateral faulting
The cracks, if projected north-northwesterly as suggested by the direction of the
solid yellow line in Figure 2-36, would go over the epicenter. If we assume the
West Napa fault zone has a 90-degree dip (purely vertical), then the rupture would
correspond to the presently-observed fault location.
The site with these ground failures is mapped as not likely to liquefy, using the
geologic maps (mapped at border of Qoa and pre-Quaternary soils). A Moderate-
high liquefaction zone is mapped a few hundred west of this site (along a creek);
as entire area is nearly flat, it would seem unlikely that there could be a lateral
spread towards the creek, but this cannot yet be entirely ruled out.
Figure 2-19. West Napa Fault Zone (Marked up using Google Earth Map)
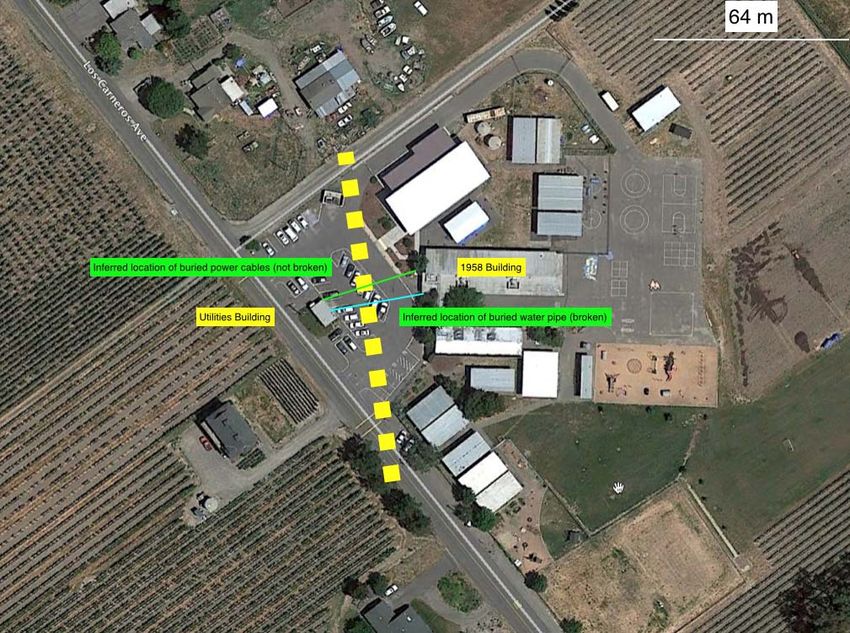
Figure 2-20 shows a close up aerial view of the area in the highlighted box in Figure 2-
19. In Figure 2-20, the thick dashed yellow line represents the zone with surface faulting.
ASCE - TCLEE Page 24South Napa M 6.0 Earthquake Rev. A September 1 2014
The property is a K – 8th grade school. The building noted "1958" building is one of the
primary classroom buildings, and the oldest at the site.
We measured the width of the fault zone with observed ground failure at about 35 feet
wide. The thick dashed line represents the strike of the faulting, but the actual cracks
were en-echelon in nature, with most of the larger cracks oriented somewhat clockwise
from the strike of the thick yellow dashed line. The cracks are very clear in the road (Los
Carneros Avenue) and in the asphalt-paved parking lot of the school. To the west is a
small "utilities building" housing switchgear (from the overhead PG&E distribution line
along Los Carneros Avenue) as well as water quality equipment to treat water from the
school's well.
Figure 2-20. Aerial View of Fault Zone (Marked up using Google Earth Map)
ASCE - TCLEE Page 25South Napa M 6.0 Earthquake Rev. A September 1 2014
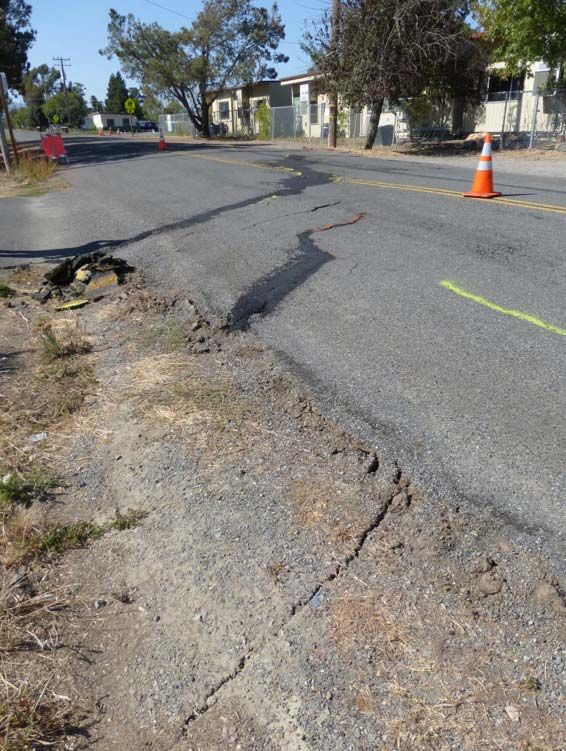
Figure 2-21 shows Los Carneros Avenue (and John Eidinger), looking northerly, from a
point just south of the fault offset zone. Photos taken around 4 P.M. local time, August 26
2014. Asphalt patches in the road pavement can be seen. To the west, the cracks in the
ground are clearly seen on the westerly shoulder of the road. Note the overhead cable TV
poles (west side of road) and overhead PG&E distribution poles (12 kV, east side of
road).
Figure 2-21. Repaired cracks in street (Courtesy John Eidinger)
Figure 2-22 shows the ground cracks that have been repaired by August 25 and some
newly formed cracks (post-seismic creep).
ASCE - TCLEE Page 26South Napa M 6.0 Earthquake Rev. A September 1 2014 Figure 2-22. Repaired and newly formed cracks in street (Courtesy John Eidinger) Figure 2-23 clearly shows the strike of the fault and the en echelon ground cracks. There appears to be about a 20° clockwise rotation of some of the en echelon cracks. One practical aspect is that for buried pipes crossing a fault, the fault offset might be along the strike, or perhaps rotation 20 degrees or so (clockwise for right lateral, counterclockwise for left lateral). ASCE - TCLEE Page 27
South Napa M 6.0 Earthquake Rev. A September 1 2014
Figure 2-23. Road cracks (repaired and new), looking northerly (Courtesy John
Eidinger)
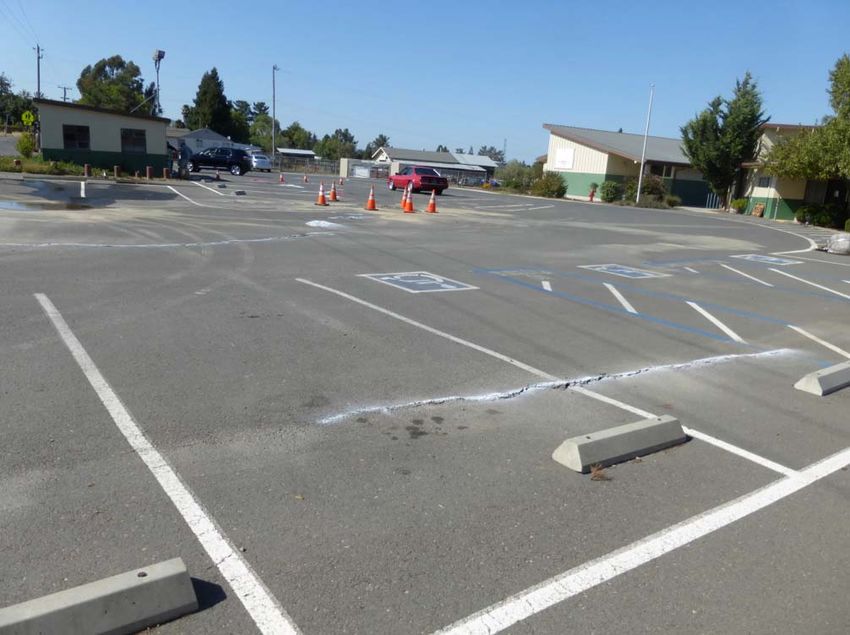
Figure 2-24 shows the parking lot for the school, looking northerly. In the foreground, a
crack (painted white after the earthquake to help identification) is seen, again oriented in
en echelon clockwise direction as compared to the strike of the fault. In the center of the
photo are several orange cones, surrounding where the water pipe (to-from well and the
ASCE - TCLEE Page 28South Napa M 6.0 Earthquake Rev. A September 1 2014
utility building on the left). The ejected sand at this location is from the sand surrounding
the water pipe, that was ejected as part of the pipe break (not from liquefaction).
Figure 2-24. Parking lot cracks, looking northerly (Courtesy John Eidinger)
ASCE - TCLEE Page 29South Napa M 6.0 Earthquake Rev. A September 1 2014
Figure 2-25 shows the largest crack in the parking lot, paring originally white, and then
as the crack grew wider, orange. The ruler shows almost 4 inches of opening.
Figure 2-25. Parking lot crack, looking northerly (Courtesy John Eidinger)
The power pole (Figure 2-26) located on the street just west of the utilities building
shows no particular distress. The pole-mounted transformer does not look distressed and
there were no signs of oil leak. The pot head / line drop looks undisturbed. According to
the school's staff, the power was out on Sunday (August 24) morning. Once power was
ASCE - TCLEE Page 30South Napa M 6.0 Earthquake Rev. A September 1 2014
restored at this location, the line drop into the utilities building worked, and the
underground cables from the utilities building into the school buildings worked. In other
words, the cable (school-owned) that crossed the fault was not damaged to the point of
becoming non-functional. In other earthquakes around the world, short (commonly
shorter than 200 meter) secondary buried power cables have had a much lower failure
rate due to modest PGDs (on the order of several inches) than long (several km) direct
buried cables. This superior performance, all other factors being equal, is attributed to the
available slack at either termination of the short cable, that can be used up at the specific
PGD zone; whereas any available slack in a very long cable is "too far away" and the soil
effectively anchors the cable preventing any available slack from being used at the PGD
zone where it is needed. This analogy would have to be adjusted if the buried cable is
within ducts (PVC or Transite are common) rather than in direct burial.
Figure 2-26. Power Pole, adjacent to fault zone (left side looking north, right side
looking south) (Courtesy John Eidinger)
ASCE - TCLEE Page 31South Napa M 6.0 Earthquake Rev. A September 1 2014
3.0 Performance of PG&E Power System
Nearly 70,000 PG&E customers experienced one or more power outages during this
earthquake. Figure 3-1 shows the power outage time chart.
Figure 3-1. Power Outages (Courtesy John Eidinger)
Within about 14 hours after the earthquake, PG&E's STOEC had inspected 35
distribution and transmission substations. Initial observations indicated that oil leaked
from some power transformer radiators; oil alarms occurred due to oil sloshing within the
transformers (these were reset), some damage to scaffolding (no impact on equipment); a
circuit breaker tripped and reclosed and remain closed.
On August 26, 2014, six substations were inspected by Anshel Schiff and John Eidinger.
About 1,000 pieces of 60 kV to 230 kV voltage equipment and buildings were reviewed,
all having been exposed to PGAs between 0.16g and 0.35g. The following summarizes
key observations.
Buildings. One precast concrete building suffered slight damage to the roof
diaphragm. Building is operational.
Power transformers. 2 power transformers (installed pre-1980) had minor leaks of
oil from radiators. Some of this leakage might have been pre-earthquake. The
affected radiators were very flexible (first mode frequency from 2 to 3 hertz). All
newly installed transformers had much stiffer radiators and no leaks. There was
no damage to bushings (all porcelain) or surge arrestors (some porcelain, some
composite).
Circuit breakers, disconnect switches, circuit switchers. Nearly every component
installed post-1990, with all 230 kV equipment having been seismically qualified
to IEEE 693 (high seismic zone). No damage.
Figure 3-2 shows a 1977-vintage power transformer, with Prof Anshel Schiff in the
foreground.
ASCE - TCLEE Page 32South Napa M 6.0 Earthquake Rev. A September 1 2014
Figure 3-2. Power Transformer (Courtesy John Eidinger)
Figure 3-3 shows the time history of response of the radiator. The forced vibration
response is seen on the left (increasing blue line) and the free vibration response is shown
on the right (two lines, with the blue line being the recorded motion, and the second line
being a fitted sine wave motion attempting to match the response). From the matched
sine wave, the best-fit first mode frequency is 2.905 hertz with 0.3% damping.
ASCE - TCLEE Page 33South Napa M 6.0 Earthquake Rev. A September 1 2014
Figure 3-3. In Situ Test Vibration Response of Radiator (Courtesy Anshel Schiff)
There is evidence of oil leakage, Figure 3-4.
ASCE - TCLEE Page 34South Napa M 6.0 Earthquake Rev. A September 1 2014
Figure 3-4. Transformer Oil Leak (Courtesy John Eidinger)
Power outages are mostly due to damage within the distribution system (generally 12
kV).
The distribution system in the Napa area includes both overhead and buried feeders.
Within the PGA > 0.15g zone (urban Napa and American Canyon), the estimated number
of overhead structures (nearly all wood poles) is about 11,000.
In Figure 4-1, the time of maximum number of customers without power is about 3.75
hours after the earthquake, peaking at just under 70,000 customers. Systemwide, PG&E
has about 5,100,000 customers, serving about 15,000,000 people. So, at the peak, about
1.4% of PG&E customers lost power. Of the customers who lost power, more than 99%
had power restored within 24 hours.
ASCE - TCLEE Page 35South Napa M 6.0 Earthquake Rev. A September 1 2014
Over the course of the first 24 hours, there were many aftershocks, typically in the M 3
range or so. While the level of shaking was low from these aftershocks, these aftershocks
seem to have caused more outages.
The following summarizes the causes of the outages.
166 overhead, 3 underground
52 fuse related
41 wire related
10 equipment related
6 pole / cross arm / insulator related.
ASCE - TCLEE Page 36South Napa M 6.0 Earthquake Rev. A September 1 2014
4.0 Performance of Water and Wastewater
Systems
The City of Napa operates a potable water distribution system, serving the Napa urban
area (Figure 4-1). Figure 4-2 shows the locations of the three water treatment plants
serving Napa, as well as the major pipelines in the water system.
Figure 4-1. Napa Water System Service Area (Courtesy City of Napa)
ASCE - TCLEE Page 37South Napa M 6.0 Earthquake Rev. A September 1 2014
Figure 4-2. Napa Water System Major Pipelines and Location of Water Treatment Plants
(Courtesy City of Napa)
As of August 29, 2014, Napa reported about 105 water pipe breaks. Figure 4-3 shows the
locations of the breaks.
ASCE - TCLEE Page 38South Napa M 6.0 Earthquake Rev. A September 1 2014
Figure 4-3. Napa Water Pipe Break Locations and repiars (green = repaired, blue = to
be repaired) 31 August 2014. (Courtesy City of Napa)
In Vallejo, there were an additional 16 water pipe breaks reported.
The Napa water system is estimated to have 350 miles of pipe. The break rate
corresponds to a repair rate on the order of 0.5 repairs per km. This repair rate would
appear to indicate that some level of PGDs occurred, as most pipe fragility models can
not forecast this level of damage from ground shaking (PGV) effects alone. Other
possible explanations include:
Weak installation initially
ASCE - TCLEE Page 39South Napa M 6.0 Earthquake Rev. A September 1 2014
High water pressure surges
Heavy corrosion effects on metallic pipes
Old pipes, with cumulative aging effects (corrosion, past repairs, etc.)
The North Bay Aqueduct delivers raw water to the Jameson Canyon Water treatment
plant. The North Bay Aqueduct is a 1991-vintage 72-inch diameter pipe. This pipe would
have been exposed to PGA from 0.02g to 0.15g (or so) along its alignment: the raw water
source is from the Delta, more than 20 miles east of Napa. DWR reports no known
damage based on preliminary review.
There were no boil water alerts issued during or after the earthquake. Water quality at the
water treatment plants was reported to be acceptable. The general population was
encouraged to use bottled water (many did).
By August 28, there were about 500 Napa customers without water. By August 29, this
was reduced to about 400 customers, with the intent to have all customers back in service
by August 30.
Napa used 10 outside pipe repair crews to assist in making pipe repairs. 5 of these crews
(about 30 people total, including the needed pieces of heavy equipment) were from
EBMUD, a water agency located about 30 miles south of Napa.
As of August 31, 2014, the Napa wastewater agency was conducting videos through the
sewer pipes.
The Sonoma County Water Agency operates water and wastewater system throughout
Sonoma County. In the city of Sonoma Valley, where ground motions were between
PGA = 0.07g and 0.17g, there were no reported pipe breaks. At the wastewater treatment
plant in Sonoma Valley, there was no reported damage, and water did not slosh over the
walls of the clarifiers.
ASCE - TCLEE Page 40South Napa M 6.0 Earthquake Rev. A September 1 2014
5.0 Performance of Transportation
There are several reasons why very little bridge damage occurred during the South Napa
Earthquake. The most vulnerable bridges had been retrofitted. Out of 412 bridges in
Solano, Napa, and Sonoma Counties 54 bridges had been retrofitted and the others were
screened and found not to be significantly vulnerable. Brief descriptions of bridge
performance follow.
5.1 Bridge 23-0064
Figure 5-1. Napa River Bridge on Route 37 Br. #23 0064 (38.1203, -122.2800) (Courtesy
Mark Yashinsky)
Bridge 23-0064 is a 33 span precast girder bridge on flexible two column piers and stiff
four column piers that was built in 1963. Like many river crossings it starts at ground
level and then quickly rises to provide clearance over the river. A problem with many
precast girder bridges is that they are not well designed for earthquakes. The girders need
to be continuous to protect the superstructure and force plastic hinging into ductile
columns. The girders on the Napa River Bridge were inadequately developed and they
pulled out of the end diaphragms during the 1989 Loma Prieta earthquake. The bridge
was repaired after the earthquake and got a very thorough seismic retrofit in 1996. The
retrofit included bolsters around the end diaphragms to make the girders more
continuous, also transverse prestressing, with additional seat width, and pipe seat
restrainers at the hinges. The foundations were retrofit with additional piles and a bigger
pile cap. All of the columns were encased in steel jackets. A downhole array2 was
2
http://www.strongmotioncenter.org/cgi-
bin/CESMD/iqrStationMap.pl?ID=AmericanCanyon_24Aug2014_72282711
ASCE - TCLEE Page 41South Napa M 6.0 Earthquake Rev. A September 1 2014
installed at the bridge, which recorded 0.2g acceleration, 19 cm/s velocity, and 2 cm
displacement at the ground surface during the South Napa Earthquake. The bridge was
also instrumented with Channels 1, 2, and 3 between piers 13 and 14 at the top of the
bridge, which recorded 0.53g acceleration and 14.7 cm (about 6 inches transverse) of
displacement. The ground motion and structural excitation were not high enough to cause
serious damage to a well-designed or to a seismically retrofitted bridge. The only damage
to the Napa River Bridge was that the expansion joints opened and closed enough to
damage a few of the type B joint seals which had to be replaced. The hand railing at the
expansion joints opened up enough to cause the bridge crews who first inspected the
bridge to close it as a precautionary measure.
5.2 Bridge 21-0049
Figure 5-2. Napa River Bridge on Route 29 Br. #21 0049 (38.1245, -122.285) (Courtesy
Mark Yashinsky)
Bridge 21-0049 is a 13 span prestressed concrete continuous box girder bridge on single
column bents that was built in 1977. The bridge is 2,230 ft long with a 250 ft long span
over the Napa River. This bridge was built after the 1971 San Fernando Earthquake and
consequently it was designed for earthquakes. The columns had good confinement and
the in-span hinges were well designed. Apparently, the foundations were felt to be under-
designed because they were retrofitted with additional piles in 1994. This was the closest
bridge to the earthquake epicenter (about 2 miles). Although the bridge wasn’t
instrumented there was a station nearby (Napa College) that recorded ground motion of
0.375g. The only damage during the earthquake was at Abutment 14 on the west side of
the river, the wingwall on the left side of the abutment settled one inch and rotated
outward two inches. Where the abutment was in contact with the wingwall it has a
concrete spall of six inches by six feet with exposed reinforcement.
ASCE - TCLEE Page 42South Napa M 6.0 Earthquake Rev. A September 1 2014
5.3 Bridge 21-0108 L/R
Figure 5-3. Napa River (W. Imola) Bridge Br. #21 0108L/R (38.2814, -122.2842)
(Courtesy Mark Yashinsky)
Bridge 21-0108 L/R is a pair of bridges that were built in 2007. They are 13 span (2143 ft
long) prestressed concrete continuous box girder bridges on single column bents. These
nearly new bridges have not been retrofitted. When Caltrans staff first saw the abutments
on the West Imola Avenue Bridges, it was assumed there was soil behind them that was
held in place with mechanically stabilized earth (MSE) retaining walls. However, when
Caltrans staff looked behind the abutment, it was seen that the approaches were actually
slab bridges on pile extensions. What had been thought to be MSE Walls turned out to be
curtain walls. Caltrans prefers to have soil behind the abutment to provide stiffness and
damping during the earthquake. However, on such a long bridge a stiff abutment plays a
much smaller role. These bridges are also very close to the Napa College station that
recorded peak acceleration of 0.375g during the earthquake. The damage that occurred
during the earthquake, cracks and spalls of the curtain walls at all the abutments, was the
result of the ends of the superstructure banging against the slender curtain walls described
above. More substantial abutments could have held the superstructure more securely in
place. However, it is unlikely that the superstructure could unseat (the approach slab is
securely attached to the end of the superstructure) but the abutment plays no role in
reducing large displacements of these bridges. Large embankments may not be necessary
on such a long bridge since none of the columns had any damage due to the earthquake.
Still, this bridge had the most expensive repair ($350,000) of all the bridges.
5.4 Highway 37
Highway 37 is located along the north shore of San Pablo Bay. Other than damage where
the road transitions to a bridge (differential movements, described in Section 5.1 above),
there is no observed damage to this road between Sonoma and Napa: no lateral spreads or
material cracks in the asphalt surface. This road is mapped as being almost entirely in
"high" liquefaction susceptibility zones, with PGA > 0.2g for much of the length, one
ASCE - TCLEE Page 43South Napa M 6.0 Earthquake Rev. A September 1 2014 would have surmised some type of liquefaction damage, but none has been observed. One suspects that the liquefaction maps of Sowers (1998) Knudson (2000) and Witter (2006) may deserve some refinement. ASCE - TCLEE Page 44
South Napa M 6.0 Earthquake                                         Rev. A September 1 2014

6.0 Performance of Telecommunications System
The performance of communication systems in this earthquake is generally "good",
although some issues arose.
The ATT building on Clay Street in downtown Napa was damaged, Figure 6-1.

            Figure 6-1. AT&T Building on Clay Street, Napa (Courtesy KGO)

The concrete wall panel that has been displaced was apparently a "knock-out" type panel,
to allow for future expansion of the facility. The panel was attached to the rest of the
building using eight angles, bolted to the panel and to the building. Apparently, shaking
of the building resulted in excessive forces on the bolts, and the connections failed,
allowing the panel to fall.
When the panel fell, it severed the PG&E power supply into the facility. The emergency
generators failed to work. Battery systems did work, and the batteries sustained the
equipment and operations.
As battery power generally is not sufficient to provide HVAC, external HVAC was
needed. It was reported that AT&T brought in an external generator, as well as external
ventilation to keep the heat down in the building, Figure 6-2.
According to reports, some cell and land-line service was down (not available) on Sunday
morning, August 24, 2014. Reportedly, the 911 system remained on line. As of August
28 2014, many people were still involved making repairs.

ASCE - TCLEE                                                                       Page 45
South Napa M 6.0 Earthquake Rev. A September 1 2014
Figure 6-2. Providing External Services to AT&T Building (Courtesy KGO)
ASCE - TCLEE Page 46South Napa M 6.0 Earthquake Rev. A September 1 2014
7.0 Fire Following Earthquake
A survey of fire sites was conducted on the day following the earthquake (ie, 25 Aug),
and data obtained from an interview with senior officers of Napa City Fire Department
(NFD). A complete list of incidents the NFD responded to was not available at the time
of the interview – fires attributable to the main shock are summarized in Table 7-1 and
shown in Figures 7-1 and 7-2.
Table 7-1 Fires attributed to the 24 August main shock (from handwritten notes)
No. Time of Report Location Description (see below)
(approx.)
1 0330 Orchard Ave Napa Valley Mobile Home Park (NVMHP) –
actually two ignitions – see narrative
2 0400 Laurel St. (no. street 2 story, 2 unit residence, roof collapse, started
number) fire
3 0500 162 Robin at Solano Double wide home
4 0630 1990 Trower Smoke inside structure
5 0730 770 Lincoln x Soscol Electrical fire in substructure of a mobile home
6 1200 4072 Rohlffs Way x Fair Kitchen fire in single story multi-unit senior
housing complex
Orchard Ave Fire: This was the largest fire in the earthquake. First dispatch was of T1
to a report of gas odor but en route T1 observed a fire in the Napa Valley Mobile Home
Park (NVMHP) off of Hwy 29 at Orchard Road, and diverted to this incident. T1
encountered a broken water main spewing water at the entrance to the NVMHP on
Orchard Road, and proceeded to enter the NVMHP. T1 then encountered a single
structure fire at 313 Mark Way – the structure was 50% involved; they also observed a
second fire at 317 Patty Way, which was 100% involved and impinging on neighboring
buildings, see Fig. 7-2. Wind conditions were calm.
Approximately 20 minutes into the incident (about 0400) Water Tenders 15 and 25
arrived from Napa County Fire Department (NCFD). NCFD E6 had also arrived and
took water from one of the WT 15 and suppressed the Mark Way fire. T1 and WT 25
similarly suppressed the Patty Way fire. Overhauling continued until about 10am.
1990 Trower: This was a report of smoke inside a structure. Scawthorn visited this site,
which is a restaurant – employees reported some equipment had fallen onto other
equipment in the kitchen, causing a call to the fire department. No significant damage
occurred.
ASCE - TCLEE Page 47South Napa M 6.0 Earthquake Rev. A September 1 2014
Rohlffs Way: This was a report of smoke in a kitchen area of a senior citizens residence
Mutual Aid: As reported above, Napa County FD responded quickly with water tenders.
By noon, two OES strike teams had arrived in Napa.
Figure 7-1 Fires and approx. times overlaid on PGA (v1), 24 Aug 2014 S. Napa Mw 6.0
Earthquake
(half shaded triangle indicates street number unknown) (Courtesy Charles Scawthorn)
Figure 7-2 NVMHP Park and locations of fires, 24 Aug 2014 S. Napa Mw 6.0 Earthquake
(damaged buildings outlined in red) (Courtesy Charles Scawthorn)
ASCE - TCLEE Page 48South Napa M 6.0 Earthquake Rev. A September 1 2014 8.0 Other There were no fatalities in this earthquake. About 200 people reported to the local area hospital, of which about a dozen were admitted, and the rest out patients. This hospital had sustained some non-structural damage in the Napa M 5.2 earthquake of 2000 (John Eidinger et al, 2000), and was serviceable in the Napa 2014 earthquake. Gas lines. Initial indications are that there were more than 30 (possibly approaching 100?) gas leaks reported in this earthquake. As of the time of writing, there are no known natural gas transmission pipeline failures; the causes of the leaks might be due to either in-house damage (such as toppled water heaters) or distribution system pipe leaks. ASCE - TCLEE Page 49
South Napa M 6.0 Earthquake                                        Rev. A September 1 2014

9.0 References
Eidinger, J., Yashinsky, M., Schiff, A., Napa M 5.2 Earthquake of September 3, 2000,
online, at www.geEngineeringSystem.com.
Knudson, Keith, Sowers, Janet, Witter, Robert, Wentworth, Carl, and Helley, Edward,
Preliminary maps of quaternary deposits and liquefaction susceptibility, nine-county San
Francisco Bay region, California, U.S. Geological Survey Open file Report 00-444, V.
1.0, 2000.
Sowers, J. M., Noller, J. S., Lettis, W. R., Quaternary Geology and Liquefaction
Susceptibility, Napa, California, 1:100,000 Quadrangle: A Digital Database, U.S.
Geological Survey, Open File Report 98-460, 1998.
Witter, R.C., Knudsen, K.L., Sowers, J.M., Wentworth, C.M., Koehler, R.D., and
Randolph, C.E., Maps of Quaternary deposits and liquefaction deposits in the central San
Francisco Bay region, California: U.S. Geological Survey Open-File Report 06-1037,
2006.

ASCE - TCLEE                                                                       Page 50
You can also read