PSL Icing Facility Upgrade Overview - NASA
←
→
Page content transcription
If your browser does not render page correctly, please read the page content below
https://ntrs.nasa.gov/search.jsp?R=20140008692 2019-07-29T02:32:32+00:00Z

                     PSL Icing Facility Upgrade Overview

                                  Thomas A. Griffin 1 and Dennis J. Dicki 2
                             NASA Glenn Research Center, Cleveland, Ohio 44135

                                                      and

                                               Paul J. Lizanich 3
                                Sierra Lobo Corporation, Cleveland, Ohio 44135

            The NASA Glenn Research Center Propulsion Systems Lab (PSL) was recently upgraded
        to perform engine inlet ice crystal testing in an altitude environment. The system installed 10
        spray bars in the inlet plenum for ice crystal generation using 222 spray nozzles. As an
        altitude test chamber, the PSL is capable of simulating icing events at altitude in a ground-
        test facility. The system was designed to operate at altitudes from 4,000 to 40,000 ft at Mach
        numbers up to 0.8M and inlet total temperatures from –60 to +15 °F. This paper and
        presentation will be part of a series of presentations on PSL Icing and will cover the
        development of the icing capability through design, developmental testing, installation,
        initial calibration, and validation engine testing. Information will be presented on the design
        criteria and process, spray bar developmental testing at Cox and Co., system capabilities,
        and initial calibration and engine validation test. The PSL icing system was designed to
        provide NASA and the icing community with a facility that could be used for research
        studies of engine icing by duplicating in-flight events in a controlled ground-test facility.
        With the system and the altitude chamber we can produce flight conditions and cloud
        environments to simulate those encountered in flight. The icing system can be controlled to
        set various cloud uniformities, droplet median volumetric diameter (MVD), and icing water
        content (IWC) through a wide variety of conditions. The PSL chamber can set altitudes,
        Mach numbers, and temperatures of interest to the icing community and also has the
        instrumentation capability of measuring engine performance during icing testing. PSL last
        year completed the calibration and initial engine validation of the facility utilizing a
        Honeywell ALF502-R5 engine and has duplicated in-flight roll back conditions experienced
        during flight testing. This paper will summarize the modifications and buildup of the facility
        to accomplish these tests.

                                                Nomenclature
A/D       = analog/digital
ARRA      = American Recovery and Reinvestment Act
ATP       = Aeronautics Test Program
CDP       = cloud droplet probe
CIP       = cloud imaging probe
DCS       = distributed control system
DI        = deionized
DPU       = data processing unit
DVD       = digital video disc
DVR       = digital video recorder
EHWG      = Engine Harmonization Working Group
FAA       = Federal Aviation Administration

1
  PSL Mechanical Tech Lead, Wind Tunnel and Propulsion Test Branch, 21000 Brookpark Road, Cleveland, OH, 44135.
2
  PSL Lead Facility Engineer, Wind Tunnel and Propulsion Test Branch, 21000 Brookpark Road, Cleveland, OH, 44135.
3
  PSL Electrical Tech Lead, Sierra Lobo Corporation, 21000 Brookpark Road, Cleveland, OH, 44135.

                                                       1
                               American Institute of Aeronautics and Astronautics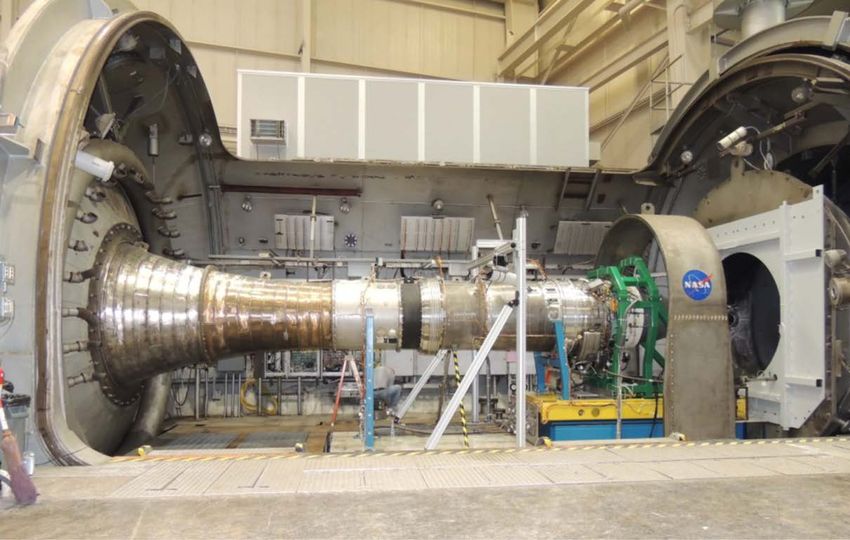
FOD        = foreign object damage
FT         = Facilities Test Division
ID         = inner diameter
I/O        = input/output
IRT        = Icing Research Tunnel
IWC        = icing water content
MMI        = man-machine interface
MVD        = median volumetric diameter
NASA       = National Aeronautics and Space Administration
NTSC       = National Television System Committee
OPC        = object linking and embedding for process control
OS         = operating system
PC         = personal computer
PSL        = Propulsion Systems Laboratory
scfm       = standard cubic feet per minute
UAV        = unmanned aerial vehicle
UTR        = uniform temperature reference?
WDPF       = Westinghouse Distributed Process Family

                                                   I. Introduction

T    he Propulsion Systems Laboratory (PSL) at the NASA Glenn Research Center is one of the premier U.S.
     facilities for research on advanced aeropropulsion systems. The facility can simulate a wide range of altitude
and Mach number conditions while supplying the aeropropulsion system with all the support service necessary to
operate at those conditions. Test data are recorded on a combination of steady-state and high-speed data acquisition
systems. For over three years, the PSL has undergone a significant transformation: an ice crystal cloud generation
system was added, making it the first ground-based test facility in the world capable of fully simulating these
challenging atmospheric conditions, which have been a longstanding threat to aircraft engines. Following the
completion of the facility’s first engine icing test, which resulted in the successful replication of a known altitude
icing loss of power engine event condition, the facility staff are further augmenting the facility capability in response
to ever-evolving research requirements to improve the efficiency of the testing process and to resolve known
deficiencies in the system identified as part of the lessons-learned process.

                                           II. PSL Facility Background
     The Propulsion Systems Laboratory (PSL) at NASA Glenn Research Center in Cleveland, OH, houses two
altitude simulation test chambers, which are used for aeronautics research of turbine engines. It consists of two
chambers, PSL3 and PSL4, which are each 24 ft in diameter and 39 ft long. They are direct-connect facilities in
which the engines are connected through inlet ducts to the inlet plenum. Each chamber utilizes the NASA GRC
central air services for supply of pressurized air to set the inlet conditions and altitude exhaust for altitude
simulation. Local to PSL are also J-57 heater engines and turbo-expanders, which provides nonvitiated temperature
conditioning of the inlet air for Mach and altitude conditions (Fig. 1). Both test chambers were commissioned in
1973 for turbine engine research studies. They have been in continuous use since that time and have tested a wide
variety of propulsion systems including military and commercial turbofan engines, turboshaft, turbine-based
combine cycle, and unmanned aerial vehicle (UAV) engines. PSL is NASA’s only ground-based, full-scale engine
test capability designed for research to provide detailed information on the performance and operability of engines
and propulsion systems at extreme conditions over the entire flight envelope, which can only be obtained through
altitude-simulated ground-based testing. PSL overall facility capabilities are:

   (1) Ambient air:
        • 480 lbm/s at 55 psig
        • 380 lbm/s at 150 psig
        • 100 lbm/s at 450 psig
   (2) Heated air:
        • 39 lbm/s at 465 psia, 1200 ×F
        • 50 lbm/s at 50 psig, 2670 °F (Mach ∼6.0)
   (3) Cold air:

                                                         2
                                 American Institute of Aeronautics and Astronautics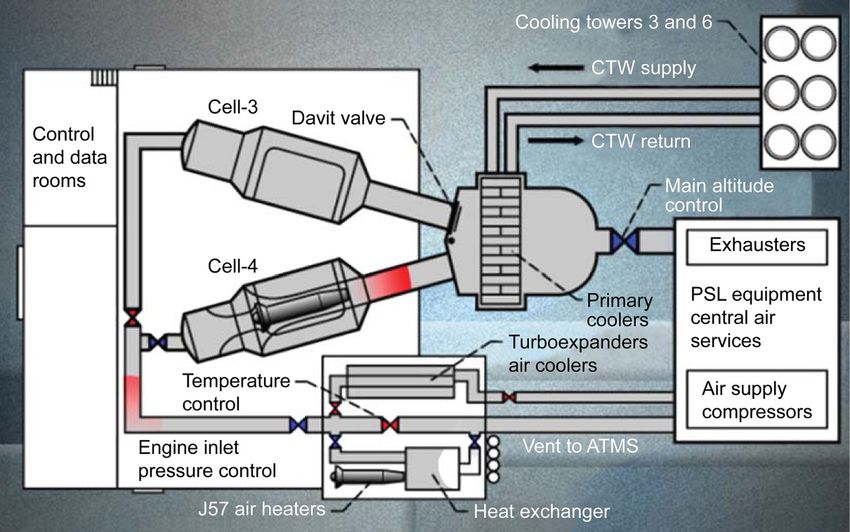
• 330 lbm/s at 10 psig, –50 °F
        • 30 lbm/s at 10 psig, –90 °F
   (4) Altitude exhaust capabilities:
        • Sea level at 750 lbm/s
        • 90,000 ft at 18 lbm/s
   (5) Support services:
        • GH2, GO2, natural gas, and liquid fuels
        • Steam and hydraulics
        • Six-component thrust system ( 50,000 lbf)
        • 1600 channels data acquisition/display
        • High-response transient data

          Figure 1. PSL functional layout.

    PSL3 was recently upgraded in 2010 to 2012 for engine ice crystal research at altitude conditions. This paper
will explain the enhancements made to the facility, the lessons learned, and the future enhancements planned.

                                        III. Advocacy for PSL Upgrade
    NASA Glenn has a strong icing research program dating back to the establishment of the Icing Research Tunnel
(IRT) in World War II.1 Numerous icing flight campaigns have been conducted by the NASA GRC Icing Branch,
including programs to characterize the natural icing environment, to collect data and study various aspects of the
natural icing process, to study the aerodynamic effects of icing, and investigate methods to protect aircraft from
icing. Many complimentary, similar, and even more extensive studies have been conducted by the Icing Branch in
the IRT, where precise control over icing conditions greatly expand test utility. NASA has also developed the
LEWICE icing code which predicts ice accretion and shapes on airfoil surfaces.2,3 The Icing Branch researchers and
IRT operations engineers and technical staff represent world class experience in aircraft icing. Based on this and that
PSL is uniquely suited to operate small- and medium-sized engines at varying altitudes and inlet conditions, the
icing and altitude capabilities could be merged to position PSL to provide a capability to the icing community for a
simulated flight environment to conduct both ice crystal and conventional icing research.
    Based on the increased experience of engine power loss events since 1990,4 the technical staff at NASA began to
advocate for the upgrade of the PSL to have a capability for ice crystal generation for engine research studies under
simulated altitude conditions. Preliminary design studies were performed to consider different ice generation designs
such as shaved ice and spray bars. Several companies and agencies such as Cox and Company, the Federal Aviation

                                                         3
                                 American Institute of Aeronautics and Astronautics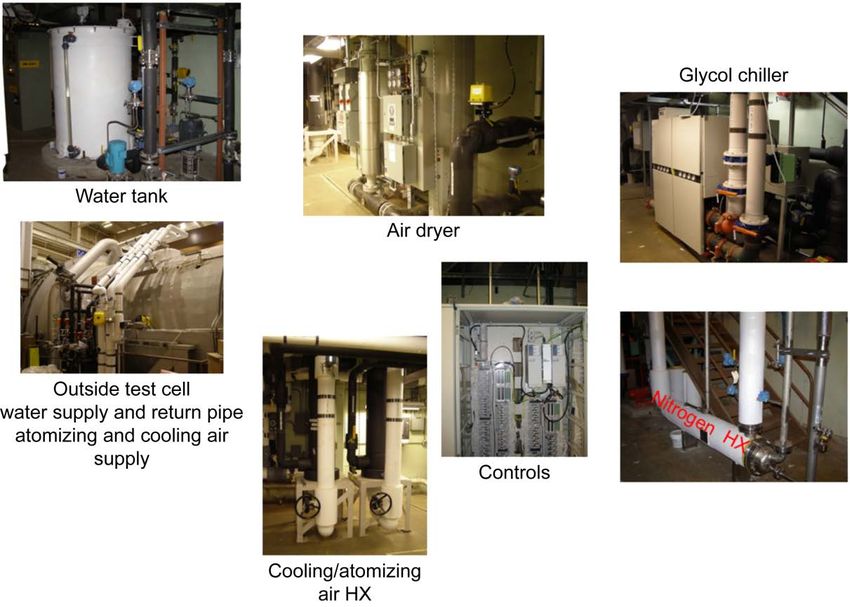
Administration (FAA), NASA GRC Icing Branch, and NASA Headquarters Aviation Safety Program provided input
for design requirements. Input was also obtained from the FAA Engine Harmonization Working Group (EHWG),
much of which was included in their 2005 roadmap,5 task 3 and 4, Mixed-Phase/Glaciated Icing Technology Plan.
These tasks were titled:

   (1) Task 3. Experimental testing in support of ice accretion model development and validation for high ice water
content environments.
   (2) Task 4. Test Facilities Requirements for demonstrating engine compliance with Appendix D requirements.

    The EHWG endorsed the enhancement of the PSL for an ice crystal test capability in 2008 and a study was done
of future utilization rates of the icing system in the PSL. It was determined that there was sufficient interest from the
icing community to proceed with solicitation of funding sources for the facility icing system.
    Ultimately the spray bar technique, similar to those used in the IRT, was selected as the most practical and gave
the most versatility for use in the PSL. Utilizing the modulation of water supply pressure and atomizing air pressure
would give a wide range of median volumetric diameter (MVD) distributions and icing water content (IWC). It was
determined that the amount of material required to meet our requirements would make the shaved ice method
impractical. The design envelope specified is presented in Table 1.

                                      Table 1. PSL Icing Design Requirements
                                       Specification        Minimum Maximum
                                Altitude (pressure), ft       4000         40,000
                                Inlet total temperature, °F    –60           15
                                Mach number                   0.15          0.80
                                Air flow rate, lbm/s            10          330
                                IWC, g/m3                      0.5           9.0
                                MVD, µm                         40           60
                                Run time                    Continuous up to 45 min

    Initial studies and preliminary designs were funded through the NASA Aeronautics Test Program (ATP). This
provided accurate cost estimates for a detailed design and fabrication effort. Once funds became available from the
American Recovery and Reinvestment Act (ARRA) of 2009, approval was given to proceed with final design,
fabrication, and enhancement of the facility. The system was required to be removable so that the PSL3 can be
reconfigured back to pre-icing configuration for standard engine research.
    The modification was programmed in several different phases: the design phase, fabrication phase, icing system
installation, icing calibration, and then an engine validation test. This was further separated into icing systems that
included all of the systems necessary to generate the ice cloud in the plenum and test cell hardware, which would be
hardware located in PSL3 utilized for the calibration and engine validation phases.
    The facility modification, fabrication, and icing system installation was managed by the NASA Glenn Facilities
Division. A.M. Kinney was selected as the prime contractor for the design with a subcontract to Cox and Company,
Inc., for the spray bars and plenum transition duct. For part of the design effort, as a risk reduction, two
demonstration tests of the spray bar design were performed at the Cox and Company LeClerc Icing Research
Laboratory. A representative cross section of the spray bar was installed and velocities and residence times
equivalent to the environment in the PSL were run to determine droplet freeze out and MVD distributions. Based on
the results of these tests there was confidence to proceed forward with the spray bar and facility design under
consideration.
    Once the icing system was designed, fabricated, and installed the system was turned over to the Facilities Test
Division (FT) for checkout and commissioning. This involved a lengthy process of verification of all of the wiring,
control programming, instrumentation, and operation of the icing systems. This process took approximately
3 months to complete and was accomplished by initially performing end-to-end checks of instruments and valve and
switch wiring, then individual component operation, and then complete subsystem operation and verification. A
detailed checkout plan was written and performed before the systems were determined to be ready to operate
collectively.
    Separate from this design effort was the FT design and fabrication of the test cell hardware needed for the initial
icing calibration and validation test. This included the remaining transition duct, which reduced the inlet diameter

                                                         4
                                 American Institute of Aeronautics and Astronautics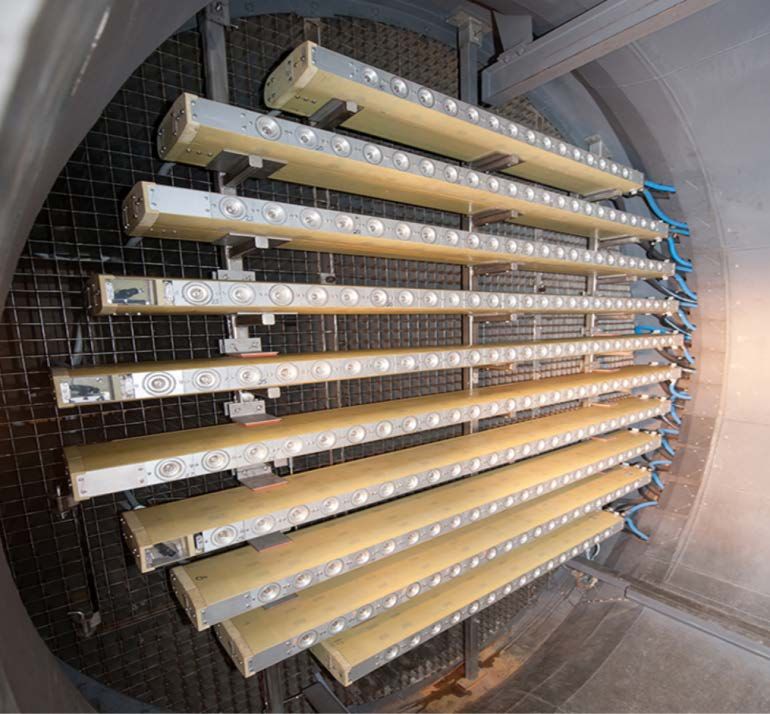
down to 36 in.; the instrumentation duct for location of the icing instrumentation; and the initial uniformity grid
measurement system. The hardware was fabricated in house by the NASA GRC Fabrication Division.
    The initial calibration of the icing system was performed in 2012.6 Although we drew on experience and
techniques utilized in the IRT, there were differences in the operation of the facility, which required new procedures
and techniques to be developed. The IRT is designed to create a cloud of supercooled liquid droplets. The PSL was
initially designed to generate a cloud of frozen ice particles, although it has since demonstrated the capability of also
performing conventional icing testing. There was the new cooling air system which sprays –40 °F service air at the
nozzle discharge to aid with droplet freeze out. Operating procedures for the system had to be developed to optimize
its effectiveness. Initial valve tuning had to be performed to optimized control response when sprays were initiated.
The initial calibration was completed after 35 test periods. A cloud imaging probe (CIP) and cloud droplet probe
(CDP) for cloud particle sizing; robust and multiwire probes for cloud water content; and a uniformity grid,
tomography duct, and sheet laser for cloud uniformity are used to characterize the ice cloud. We calibrated the
facility at flight altitude conditions and ice cloud conditions that would be used for the validation test.
    The last phase of the ice system upgrade program was an engine validation test. NASA wished to conduct a
series of validation tests of the new icing system, and a contractor, Honeywell, provided the test article for this
validation test via a task order under the RTAPS contract. NASA would provide test time in PSL3 and Honeywell
would provide an ALF502-R5 engine that previously experienced power loss due to ice crystal ingestion during a
flight test. The design of the engine has since been changed to eliminate this issue. Thus we were able to use a
unique engine that was instrumented for icing testing and had a characterized rollback condition. Under this contract
the data were provided to Honeywell for use of the engine, and Government- use-only rights were provided to
NASA for all of the data generated. The engine was installed in the PSL immediately after completion of the
calibration test in 2012 (Fig. 2).
    Using spray bar settings determined for the calibration to replicate the cloud conditions experienced during a
flight test, flight 850, the engine was successfully rolled back three times. The facility was then operated at
conditions that the engine did not roll back during flight test, flight 855, and the engine did not roll back. An
additional 86 test points where roll backs were identified and 37 no roll backs test points were performed.7

           Figure 2. ALF502-R5 installation in PSL3.

                                                         5
                                 American Institute of Aeronautics and Astronautics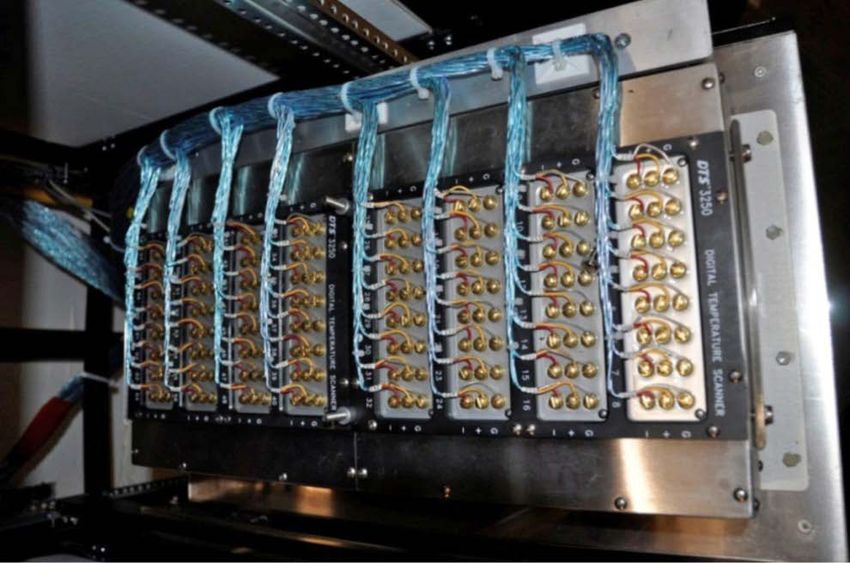
IV. Facility Modifications
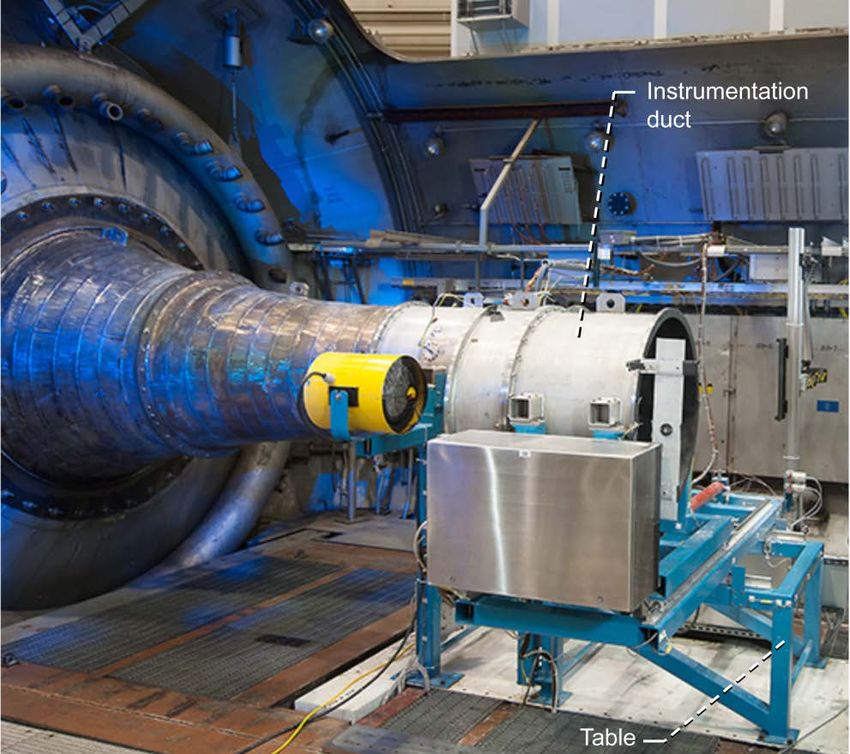
A. Design of Facility Hardware for Calibration
The design of the facility hardware that was required for the first calibration of the PSL Icing system was
designed by one of NASA Glenn’s in-house engineering contractors, Vantage Partners, LLC. They were given the
task of providing design and fabrication drawings and specifications for all of the hardware including a transition
duct, a tomography duct, a uniformity grid, a translating table, an instrumentation duct, a camera duct, and a powder
spray system for coating the ice on the grid during cloud uniformity calibration. These items are shown in Figs. 3
and 4. This hardware enabled the icing researchers to gather data on the particle size, water content, and uniformity
of the icing cloud that would be generated in PSL3 at various altitude conditions.
Figure 3. Icing calibration layout.
Figure 4. Icing calibration installation.
6
American Institute of Aeronautics and Astronautics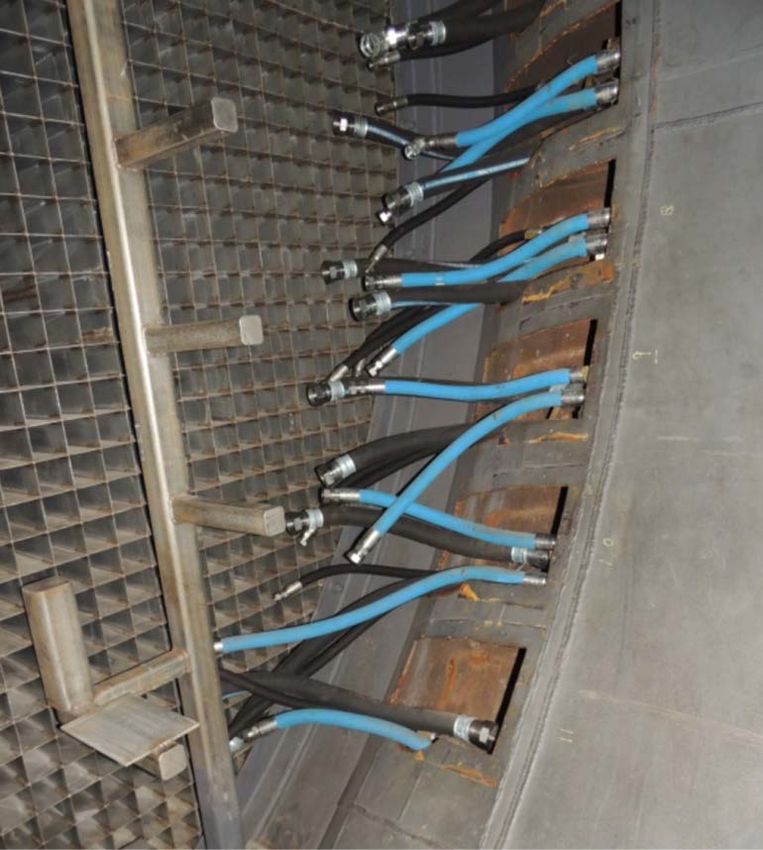
B. Icing Calibration Hardware
    Figures 3 and 4 show the calibration hardware installed into PSL3 prior to testing. The first two pieces on the left
are transition ducts that reduce the diameter of the air stream from the 90-in. test cell bulkhead down to the 36-in.
inner diameter (ID) ducting of all of the downstream ducts. The next piece to the right of the transition duct is the
camera duct that houses the external cameras and the powder spray nozzles, followed by the tomography duct. The
next duct is the instrument duct that is used to house all of the icing measuring instruments including the multiwire
probe, robust probe, CDP, and CIP along with a cloud uniformity grid. The table at the far right was used in the
uniformity portion of the calibration. The uniformity grid was inserted into the instrumentation duct and a
supercooled liquid droplet spray was turned on until a predetermined amount of ice accreted on the grid. Then
powder was sprayed onto the ice and the table slid the duct across a plane of lasers that measured the ice buildup, all
remotely because the test section is sealed during tests. Finally the yellow heater was turned on to melt the ice. The
table was then moved back into the air stream and ready for another test. Ice particle cloud uniformity was later
verified using the sheet laser and tomography systems.

    1. Plenum Modifications
    (1) Removal of FOD screen: The inlet plenum that is upstream of the transition duct would normally contain an
inlet bellmouth and a foreign object damage (FOD) screen that is the last form of protection for an engine during
normal altitude engine testing. This must be removed for all icing tests. Its removal is shown in Figs. 5 and 6. The
inlet bellmouth and FOD screen are replaced with carbon fiber transition sections.

                            Figure 5. FOD screen removal.

                            Figure 6. FOD screen disassembly.

                                                         7
                                 American Institute of Aeronautics and Astronautics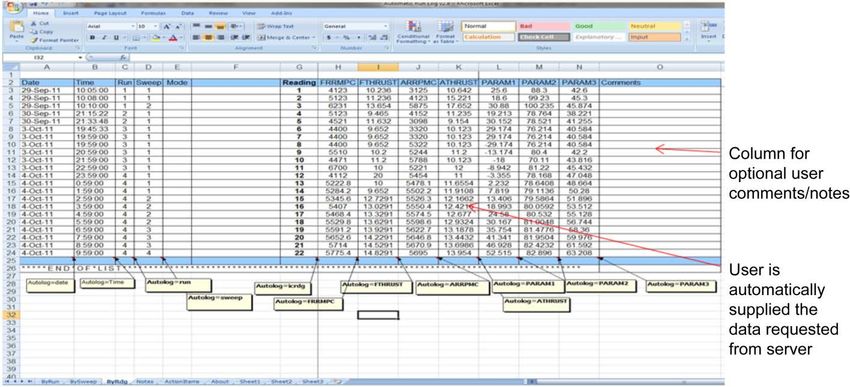
(2) Carbon fiber transition panel: After the FOD screen is removed, carbon fiber panels are installed into the
plenum to reduce the plenum diameter From ~16 ft. down to the 90-in.-diameter test cell bulkhead. These panels are
coated with a special conductive material that allows the surface to be grounded and reduces the chance of ice
buildup that may occur because of a static charge from the ice particles (Fig. 7). Two of the lower sections also
contain cameras for monitoring the spray bar nozzle performance during testing.

                    Figure 7. Carbon fiber transition panel installation.

    (3) Spray bar support structure: The spray bar support structure is made from stainless steel structural tubing that
will support each spray bars at three locations: the center and both sides as shown in Fig. 8. It is positioned just
downstream of the existing plenum flow straightener. The spray bar supports are designed to be removable for
reconfiguration of the plenum back to normal engine testing.

                    Figure 8. Spray bar support structure.

                                                         8
                                 American Institute of Aeronautics and Astronautics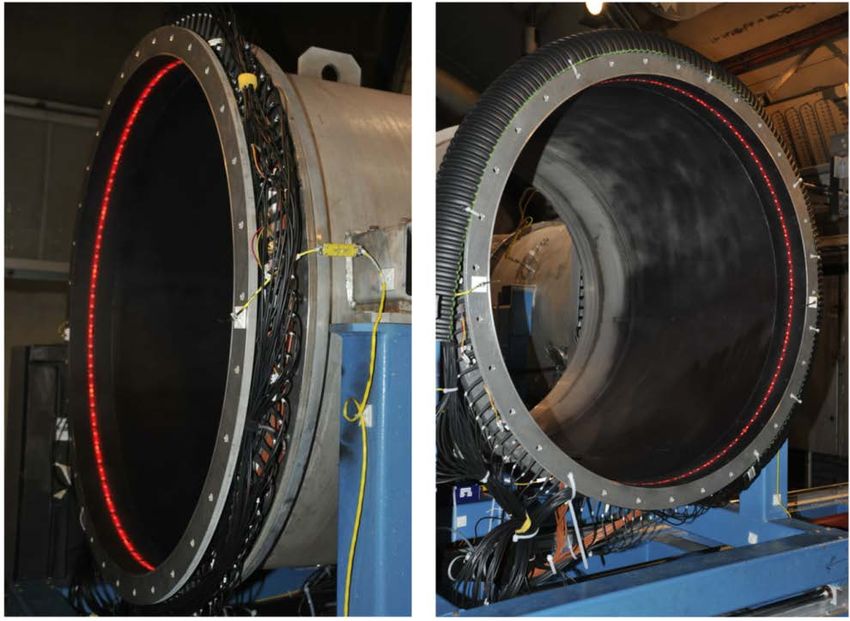
(4) Plenum penetrations for spray bar supplies: All of the subsystems that feed the 10 equally spaced spray bars
were fed into the plenum through several new penetrations (Fig. 9) that were made in the outer skin of the PSL3
plenum. From the penetration the atomizing air, cooling air and spray water pipes were routed around the ID of the
plenum behind the plenum liner before exiting at the location of the proper spray bar. Hoses made the connection
from the supply system piping to the actual spray bars (Fig. 10). These allowed for ease of installation and removal
as well as provided thermal expansion relief.

   Figure 9. Plenum penetration.                        Figure 10. Supply hoses to spray bars.

    2. Spray Bar Configuration
    The 10 spray bars hold a total of 222 nozzles, 110 of the standard type and the 112 of the modified (Mod. 1) type
that were both developed in GRC’s IRT (see Fig. 11). The IRT nozzles have been developed over years of testing.
The design, copied directly from the IRT with only minor modifications, has proven to produce a robust, repeatable
water-atomizing nozzle. Standard nozzles have a larger hypodermic tube with higher water flow rate capability than
the Mod. 1 nozzles.

       Figure 11. Icing spray nozzle cross section.

                                                        9
                                American Institute of Aeronautics and Astronautics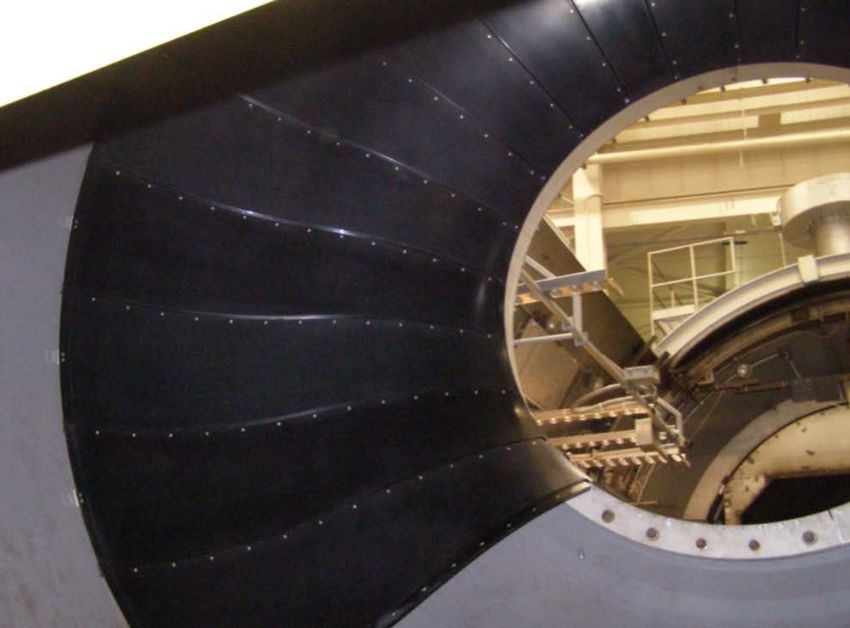
High-pressure water is delivered through the center tube while lower pressure atomizing air enters the nozzle
from the side, and the spray exits through the larger hole on the left.
    The atomizing air is required to break up the larger water droplets that are formed when the high-pressure water
exits the small tube in the center of the nozzle. This air pressure along with the correct water pressure determines the
size of the particles that leave the body of the nozzle.
    The cooling air distribution manifold is located on the aft end of the spray bar, and this manifold circles the spray
nozzle (Fig. 12). The cooling air temperature can be as low as –40 °F and is used as needed to assist with droplet
freeze-out by creating a local zone of cold air.
    The 10 spray bars are primarily made out of fiberglass to allow them to be relatively lightweight (see Fig. 13).
The spray bar pressure controls are in three zones to account for changes in head pressure for different mounting
heights. There are three compartments in the spray bar; the leading compartment holds all of the wires for the nozzle
solenoid valves, heater, and instrumentation. The center section is structurally the support for the bars, and it houses
the atomizing air pipes, water pipes, individual spray water solenoid valves, and nozzle holders. The aft compartment
houses the cooling air supply lines, cooling air nozzle, and spray nozzle. The middle and aft compartment are insulated
and temperature monitored.

           Figure 12. Spray bar cross section.

                           Figure 13. Spray bar installation in the inlet plenum.

                                                         10
                                 American Institute of Aeronautics and Astronautics
3. Icing Spray System Modifications
Overall, the icing spray system worked well during the first PSL engine icing test. The system as designed
includes over 222 individually controlled spray nozzles that are alternated between two difference sets of nozzles,
”Standard” and ”Modified” (Mod. 1) lowflow nozzles. The main issue which required improvement was to reduce
the occasional frozen nozzle. This phenomenon was observed primarily when a nozzle would be used early in the
test run, then would not be required for a long period of time. The belief is the water which is dead-headed in the
tube running through the solenoid and into the nozzle would freeze in place, precluding proper nozzle operation
either by freezing in the solenoid or partially obstructing the flow path within the nozzle itself. Investigation after the
testing showed the spray bar heating system as designed was insufficient. This design concentrated the heat trace
along the water supply and return lines—ignoring the spray bar solenoid and nozzles all together. With the nominal
operating point calling for water to be constantly recirculated through the spray bars back to the holding tank at a
temperature well above freezing, it is believed there is little chance for the main water pipe to become frozen.
The existing heat trace was removed from the spray bars and has been replaced with a new three-zone heat trace
system. One heat trace circuit is used to maintain heat on all solenoids in the spray bar. The heat trace circuit is used
to wrap around each solenoid on the spray bar. A second heat trace circuit is used to wrap the standard nozzles, and
a third to wrap the Mod. 1 nozzles. In addition, the insulation installed in the spray bars was greatly improved. Each
of these heat trace zones are separately monitored through multiple type T thermocouples and should enable trouble-
free operation of the system.
4. Steam System
In a normal non-icing engine test the combustion air supplied to PSL is dried through desiccant dryer beds prior
to being delivered to the facility. This enables the supplied combustion air line to operate as low as –50 °F without
freezing up the flow-straightening grid in the plenum ahead of the engine. However, in an icing environment this
abnormally low dew point could create the situation where droplets lose volume/mass because of evaporation.
To mitigate this problem, the icing system design included a steam injection system. This steam injection occurs
downstream of the turbo-expander air coolers at the combustion air control valves (Fig. 14). This is a high
turbulence point in the combustion air system well upstream of the flow straighteners to enable thorough mixing.
The desired operating point is a 50% relative humidity in the inlet plenum. This sets a dew point that remains just
below the combustion air temperature to preclude ice forming on the flow straighteners while still maintaining a set
relative humidity in the inlet plenum.
As an engine operates at higher altitudes, the total mass flow of air required is greatly reduced. The steam system
as originally designed did not sufficiently account for this dramatic reduction of mass flow required, and it had
difficulty maintaining a 50% relative humidity under some conditions. The steam system was modified to include a
new low-flow leg, which permits stable control down to 0.025 lbm/s of steam.
Figure 14. Steam injection system schematic for PSL.
11
American Institute of Aeronautics and AstronauticsAs described above, the PSL facility was designed for operation with cold dry air at altitude conditions. To
measure the dew point of the provided air the facility relies upon a General Eastern dew point analyzer, which
operates on a chilled mirror technology. This technology device is excellent for a steady-state measurement such as
monitoring the moisture content of the combustion air after being processed by a dryer bed whose performance
slowly degrades over the course of a test run. The steam injection system changed this philosophy to one that
requires a measurement system having a much faster response. Step changes in dew point caused by the enabling or
disabling of steam injection overwhelms the chilled mirror system, forcing the system into a 20-min-long PACER
mirror cleaning cycle.
The facility has upgraded its dew point system to include three Spectra WVSS-II atmospheric water vapor
sensors (Fig. 15), measuring the humidity at the point prior to steam injection, prior to the spray bars and just
upstream of the engine face. The sensors are commonly used on commercial aircraft and provide an output with an
update rate as short as 2.3 s. Unlike a chilled-mirror technology system, these devices use a tunable diode laser
absorption spectroscopy method, which is not overwhelmed by rapid changes to the humidity of the sample.
Figure 15. SpectraSensors water vapor sensor.
5. Icing Support Systems
Figure 16 displays the PSL icing support systems.
Figure 16. PSL icing system photographs.
12
American Institute of Aeronautics and AstronauticsFigure 17. Icing subsystem diagram.
The first of the three main icing subsystems required for ice generation is the spray water system (Fig. 17). It
was originally designed to supply high-pressure, cold city water to the spray bars. The spray water system has a
mechanical chiller that can reduce the water temperature down to about 35 °F before it is sent to a holding tank
where batches of water-particle mix can be formulated. The water is then pressurized to 400 psig with a pair of
water pumps and sent to the water control manifold, which splits the water into three separately controlled pressure
zones that feed the spray bars. The three zones are used to minimize differences in pressure at the spray nozzles
caused by differential water heads at the bars because of their different elevations. The water will flow through the
spray bar and then return to the main holding tank with another set of control valves that close down when a spray
begins so that the supply pumps maintain a constant flow and pressure with sprays on and off. The particle injection
portion of this system was never used because it was found that city water has an adequate concentration of particles
that become the nucleation sites of the ice particles. After the first engine test the researchers had requested that a
deionized (DI) water system be installed because the city water used during the first engine test caused a
considerable amount of buildup on the test engine’s internal parts during the test. A 100-gpm DI water system has
been installed in PSL and will be used during the next calibration test. It has the capability of delivering pure DI
water or a blend of city water and DI as required to provide adequate particles for ice nucleation sites.
The atomizing air system (Fig. 17) brings in up to 2500 scfm of shop air at 120 psig, filters it, and cools it down
to around 35 °F. The air goes through a control station where a control valve reduces the pressure to meet the
research test point condition requirements. There is a separate control valve for the standard nozzles and one for the
Mod. 1 nozzles, and when air is delivered to the nozzle, it goes to every standard or Mod. 1 nozzle depending on
which type of nozzle is selected.
The cooling air system (Fig. 17) also uses the facility shop air for its source. The air is dried with a desiccant
dryer to a dew point temperature of –40 °F, and from there it enters a heat exchanger that brings the temperature
down to 35 °F. It then goes to a liquid nitrogen heat exchanger, which brings it down to a temperature of –40 °F
before it goes to the control station behind the plenum where the pressure and flow rate are set to meet the research
requirements. The system has a maximum flow rate of 2500 scfm.
6. Design and Fabrication of Facility Hardware for Validation Test
The calibration transition duct and tomography duct were used for the engine validation test. Downstream of
these ducts a new labyrinth seal was designed, fabricated, and installed. The labyrinth seal is used during tests that
utilize a thrust stand for measurement of engine thrust and isolates the facility from the engine inlet ducting. After
13
American Institute of Aeronautics and Astronauticsthis hardware, a new transition duct was made to increase the internal diameter from 36 to ∼40 in., which matches
the inlet fan flange. The other major piece of hardware that was used was the 10K thrust measurement stand.
Before icing tests were performed in the PSL, the primary types of video data obtained in the PSL were from
four cameras in the test cell for monitoring the engine and a number of cameras outside the cell positioned around
the facility monitoring for fuel or other leaks, and very importantly observing the aft of the engine for signs of
sparks. Up to five of these cameras were overlayed with time code and recorded on medical-grade digital video disc
(DVD) recorders. Engine icing has brought about a new level of importance to the observation of the engine under test.
For the first engine icing test a single standard National Television System Committee (NTSC) camera was used
to observe the face of the engine. The camera was in an enclosure in the test cell peering through a window in the
final section of inlet ducting (Fig. 18). Additional windows were present to provide lighting for this camera. The
camera was canted at an angle to permit the viewing of the inlet guide vanes and/or splitter lip between the core and
bypass of the engine. In addition, the facility added a number of cameras to observe the operation of the spray bars
as well as monitoring the 27:1 contraction ratio for ice accretion. The continuous observation of this video during
icing tests demonstrated their importance.
The facility has committed to improving the video capability. A new 16-channel digital video recorder (DVR)
system is being installed to replace the five DVD recorders, and a new 20-channel time code overlay system is
replacing the obsolete five-channel system. This will enable the recording by all five plenum cameras, as well as the
typical four-cell cameras and other special cameras that are installed for a test.
In addition, an eight channel 1080-pixel camera system is being installed. For the next engine icing test a new
camera duct is being fabricated with 16 ports to enable four engine quadrant views as well as a view of the entire
engine face from a camera mounted dead-center on one of the spray bar supports in the inlet plenum. Additional
control room monitors are being installed as required to display these new views.
Figure 18. Instrument and camera duct.
14
American Institute of Aeronautics and Astronautics7. Prototype Tomography System
During the initial icing calibration a tomography duct was installed at the exit plane for cloud uniformity
measurement.8 The system is nonintrusive and can be used for real time monitoring of spray bar performance and
cloud uniformity (Fig. 19).
This advanced instrumentation was used for an in-situ measurement utilizing equally spaced laser diodes and
receivers around the circumference of the duct. The system was utilized in conjunction with the sheet laser and
uniformity grid with good correlation. The system demonstrated the ability to diagnose abnormal performance of the
spray bars such as leaking nozzles, which were deliberately turned on at low flow rates (see Fig. 20). Another
abnormal operation is two nozzles becoming inoperative during testing. This was also simulated and diagnosed
using the tomography system as shown in Fig. 21.
Figure 19. Tomography duct installation.
Figure 20. Leaking nozzle simulation image.
(a) 30 Nozzles. (b) 28 Nozzles. (c) Difference.
Figure 21. Inoperative nozzle simulation image.
15
American Institute of Aeronautics and AstronauticsC. Data System and Facility Control Modifications
1. COBRA Data System
For decades the steady-state data system at GRC has been ESCORT. ESCORT is a system based around Neff
400/470/600 A/D (analog/digital) systems which are now 30+ years old. Neff itself is out of business. The system
runs on HP/DEC Alpha computers running VMS, which are at least 15 years old and whose maintenance and repair
services are now no longer available. The system architecture is central bus, which does not take advantage of
modern computing systems or operating system (OS) designs. There is no ability for multicore, multithreading, or
distributed processing.
The ESCORT system limits are similarly being pushed to the limit with every successive test in the PSL. There
is a maximum of only 2000 input channels, 8000 calculations, and only 16 display screens. The system
configuration is through ASCII configuration files, and the system operates on a command line interface.
The PSL is expecting to receive one of the first new COBRA data systems that will replace ESCORT. This
system (Fig. 22) is designed around standard commercial hardware including personal computers (PCs), switches,
data storage, and multiple vendors of A/D converters. It will utilize commercial and open-source software running
on multiple OS including Windows and Linux and will be capable of processing data with multiple programming
languages. It is designed to be scalable in the number of displays, calculators, subsystems, and analog channels. The
system will be completely configurable through an online interface. COBRA will effectively be both a steady-state
and medium-speed data system offering multiple data acquisition rates of 12.5, 25, 50, 100, 200, 400, and 800
samples per second with digital signal processing and anti-aliasing. The maximum of display stations will be
doubled to 32.
Figure 22. COBRA data system.
2. Ovation System
In the early 1990s a Westinghouse Distributed Process Family (WDPF) control system was installed in the PSL.
The facility subsystems utilized almost 300 control sheets, which were spread across seven data processing units
(DPUs). In the early 2000s, WDPF evolved into the Emerson Ovation product line. The PSL facility control system
was upgraded to Ovation 2.2, running OCR-161 processors operating on AutoCAD-developed control sheets with
Windows 2000 engineering stations and operator stations utilizing Windows NT servers, while retaining the WDPF
Q-line I/O (input/output) cards.
16
American Institute of Aeronautics and AstronauticsThe icing system would require a significant expansion of the control system. The decision was made to break
away from the use of 20-year-old Q-line I/O cards and augment the system with multiple remote drops near the new
subsystems using the current line of Ovation I/O cards (see Fig. 23). The use of the current Ovation I/O cards
required an upgrade of the control system to at least v3.0. Emerson has a process called Evergreen for the migration
of older WDPF or Ovation systems to the up-to-date versions of Ovation. In 2010, the PSL performed a partial
upgrade to Ovation v3.3.1. This upgrade included modern OCR400 controllers, migrating the control sheets from
WDPF-era AutoCAD-based to Ovation E-CAD, and man-machine interface (MMI)/PC upgrades to Windows XP
and Windows Server 2003 and 2008. With the changeover of control sheets a complete facility integrated system
test of all subsystems was performed. This nearly 500-page-long, 8-week task culminated in a cold pipe test to fully
certify that the facility was completely functional after the control system change.
Two remote drops were added to the PSL Distributed control system (DCS), one for analog signals and one for
discrete signals. With the vast improvements in processor capability over the 20 years since the system was
originally designed, these remote drops were added to a single processor, DPU 7. As part of a simultaneous DCS
expansion, controls for two facility heater engines were moved to a remote drop off DPU 8, relieving DPU 7 of any
tasks associated with operating one of those engines. The icing system alone requires 300 control sheets, which
exceeds the total number of control sheets required to operate the facility prior to the installation of the icing or
heater engine controls. The end-to-end checks of all signals, subsystem checkouts, and integrated system testing of
the icing system culminating in a series of validation test runs was completed in 2012.
An image of the PSL Ovation DCS topology is presented in Fig. 23.
Figure 23. Ovation I/O diagram.
17
American Institute of Aeronautics and AstronauticsThe MMI of the facility DCS utilizes schematic-like drawings that generally reflect piping and instrumentation
diagrams (Figs. 24 and 25). Control screens were created for each individual subsystem, spray bar nozzle control,
annunciation (see Fig. 26), trending of spray bar pressures, and an overall icing system control display. The control
screen expansion was made in the style of the existing facility screens to ensure a familial experience for the facility
operators, with popup windows at the bottom of the screen for control actions.
Figure 24. Ovation MMI screen, pump and valve control.
Figure 25. Ovation MMI screen, spray bar water regulator controls.
18
American Institute of Aeronautics and AstronauticsFigure 26. Ovation icing annunciators.
Figure 27. Ovation spray bar solenoid controls.
The spray bar control system (Fig. 27) permits the operator to select individual modules from eight
programmable patterns. The pattern can be programmed to manually start and stop, or it can be programmed to
spray for a predetermined length of time. The pattern can be modified on the fly as required by selecting or
deselecting nozzles. The spray can also be aborted on demand.
In 2018 Emerson will drop the SureService support program for the WDPF Q-line I/O cards. The current plan is
to initiate another Evergreen process in 2015 with a further upgrade to Ovation 3.5 and replace all remaining Q-line
cards with current Ovation I/O cards. This change of I/O cards can be accomplished without any modifications to
19
American Institute of Aeronautics and Astronauticsfield wiring, though the facility will be required to perform a complete end-to-end check of all signals and repeat the
full integrated systems test before returning to testing.
3. Ovation to ESCORT Data Transfer
During operation of any aeronautical facility at NASA GRC, the practice is to not have the facility control
system rely upon data acquired from the data system. The control system should be able to operate the facility
without the data system being in scan. However, the reverse is not always true. Even though the Ovation system
does have a Historian, which tracks and permits the recall of virtually every parameter in the system, it can be useful
to integrate some of this data with the dataset acquired on the ESCORT steady-state data system. One must
recognize that although the ESCORT data system is the data system of record and all of its measurements are
traceable, the facility control system is not held to that standard. Ovation permits the use of OPC (object linking and
embedding for process control) for the transmitting of points to other systems. In the case of the PSL, approximately
100 points are routinely sent to the ESCORT system for inclusion in the data set. The routinely included parameters
are pressures, temperatures and valve positions from combustion air, auxiliary air, exhaust, fuel, cooling tower
water, and hydraulic systems. During an icing test this OPC transfer list is doubled to include salient parameters
from the icing system including pressures and temperatures from air, water, and spray bar and chiller systems as
well as status from each of the spray nozzles.
4. Auto Run Log
The Auto Run Log system (Fig. 28) was originally designed for test conductors. Test conductors spent a
considerable amount of their time writing down the critical test parameters for every test point to be used as an index
for locating the points in the future. In addition the test conductor is expected to log observations on each point,
observations which are not necessarily tied to a point, and actually keep overall awareness for the safety of the
personnel, facility, and the article under test. Experience has shown that testing efficiency is largely dependent on
the speed of the test conductor.
The Auto Run Log was designed to help ease the burden on test conductors by permitting the entry of
observations for each data point taken without the need to laboriously log the numerous critical parameters. The use
can configure the logger to fill in any of the data tags in the system. A new entry is created with each data system
point taken, or on demand by the user. All of the desired parameters requested by the user would be filled in by the
system for each observation or reading as an example, for a typical engine test this would include Time, Date,
Reading Number, P0, P2, Altitude, Mach number, N1, N2, and EGT. The automatic logging of the numerous
parameters greatly facilitates the active monitoring of the test, improved communication to the facility operators,
and overall ”heads up” testing.
Figure 28. Auto Run Log spreadsheet.
20
American Institute of Aeronautics and Astronautics5. Digital Temperature Scanner System
PSL is transitioning from 1960s vintage ovens to a digital temperature scanner system. The Scanivalve
DTS3250/64Tx thermocouple scanners (Fig. 29) provide for 64-channel thermocouple measurements. The first four
units installed in PSL3 were used to augment the temperature measurement capability of the test cell, increasing the
available customer channel count over 500 thermocouples. A similar upgrade is also underway in the companion
PSL4.
Figure 29. Scanivalve DTS module wiring.
Near-term plans include replacing the ten 48-channel ovens with eight 64-channel scanners in both PSL3 and
PSL4.
This is just part of the first phase of a $4M plan to roll out large numbers of these systems, replacing all ovens
and uniform temperature reference (UTR) block measurement devices with scanners over the next several years.
The advantage of these units is the elimination of copper wiring and associated patch board contacts required with
an oven or UTR as well as the reduction of A/D channels required by the next-generation data system.
V. Conclusion
The PSL has successfully added an engine altitude icing capability to PSL3 and has performed its inaugural test
program. We have successfully calibrated our icing system and demonstrated we can simulate the icing conditions
that caused the ALF502-R5 engine to roll back in flight test.
Subsequent to this first test program we have implemented several enhancements which should improve the
capabilities of the system. We have added a low flow steam line, improved water vapor measurement system,
improved spray bar heater and temperature measurements, and a de-ionized water system.
The PSL has a unique capability of being able to be used for simulated altitude icing studies and has been
designed to offer a wide range of flight conditions and cloud properties. It would be a valuable resource to use for
parametric studies of icing sensitivity without the risk or variability of a flight campaign.
Acknowledgments
This facility enhancement effort was funded by NASA AEST, and ATP programs. The authors wish to
acknowledge and thank the superior effort given by the entire PSL team. Mechanical Engineers: Queito Thomas,
Jack Kowalewski, and JP Kirkegaard;. Electrical Engineers: Steve Pesek, Bryan Rosine, and Vince Anton; Data
Engineers: Pam Poljak, Morgan Pugh, and Kin Wong; Mechanical Technicians: Jeff Bobonik, John Wargo, Kent
Smith, Adam Wasylyshyn, Jim Sexton, Jason Jacko, Chris Yager, and Jeff Luptak; Electrical/Electronic
Technicians: Ken Trsek, Joe Switala, Dan Erbacher, Ryan Brown, Jeff Paulin, Mike Garapic, Eric Stevens, and John
Brodkowski; the cloud specialists from the Icing Research Tunnel: Judy VanZante, Bob Ide, and Laura Steen; the
Icing Research Branch: Michael Oliver, Gene Addy, and Paul Tsao; and the Optical Instrumentation Branch:
Timothy Bencic, Amy Fagan, and Michelle Clem.
21
American Institute of Aeronautics and AstronauticsReferences
1
Soeder, Ronald H., Sheldon, David W., Ide, Robert F., Spera, David A., and Andracchio, Charles R., “NASA Glenn Icing
Research Tunnel User Manual,” NASA/TM—2003-212004, 2003.
2
Wright, W. B., “User's Manual for LEWICE Version 3.2,” NASA/CR—2008-214255, 2008.
3
Bidwell, C. S., and Potapczuk, M. G., “Users Manual for the NASA Lewis Three-Dimensional Ice Accretion Code
(LEWICE3D),” NASA TM-105974, 1993.
4
Mason, Jeanne, Strapp, J. Walter, and Chow, Philip, “The Ice Particle Threat to Engines in Flight,” 44th AIAA Aerospace
Sciences Meeting and Exhibit, Paper 2006-206, AIAA, Reston, VA, 2006.
5
FAA Engine Harmonization Working Group, “Mixed-Phase/Glaciated Icing Technology Plan,” EHWG Technology Plan
Document, Version 1.1, Dec. 20, 2005.
6
VanZante, Judith F., and Rosine, Bryan M., “NASA Glenn Propulsion Systems Lab: 2012 Inaugural Ice Crystal
Cloud Calibration Procedure and Results,” 2014 AIAA Aviation, AIAA Meeting Papers on Disc [CD-ROM], AIAA,
Reston, VA, 2014 (submitted for publication).
7
Michael J., Oliver, “Validation Ice Crystal Icing Engine Test in the Propulsion Systems Laboratory at NASA Glenn
Research Center,” 2014 AIAA Aviation, AIAA Meeting Papers on Disc [CD-ROM], AIAA, Reston, VA, 2014 (submitted
for publication).
8
Bencic, Timothy J., et al., “Advanced Optical Diagnostics for Ice Crystal Cloud Measurements in the NASA Glenn
Propulsion Systems Laboratory,” Paper 2678, AIAA, Reston, VA, 2013.
22
American Institute of Aeronautics and AstronauticsYou can also read