Detection of hydroacoustic signals on a fiber optic submarine cable
←
→
Page content transcription
If your browser does not render page correctly, please read the page content below
www.nature.com/scientificreports
OPEN Detection of hydroacoustic signals
on a fiber‑optic submarine cable
Hiroyuki Matsumoto1*, Eiichiro Araki1, Toshinori Kimura1, Gou Fujie1, Kazuya Shiraishi1,
Takashi Tonegawa1, Koichiro Obana1, Ryuta Arai1, Yuka Kaiho1, Yasuyuki Nakamura1,
Takashi Yokobiki1, Shuichi Kodaira1, Narumi Takahashi1,2, Robert Ellwood3, Victor Yartsev3 &
Martin Karrenbach3
A ship-based seismic survey was conducted close to a fiber-optic submarine cable, and 50 km-long
distributed acoustic sensing (DAS) recordings with air-gun shots were obtained for the first time.
We examine the acquired DAS dataset together with the co-located hydrophones to investigate the
detection capability of underwater acoustic (hydroacoustic) signals. Here, we show the hydroacoustic
signals identified by the DAS measurement characterizing in frequency-time space. The DAS
measurement can be sensitive for hydroacoustic signals in a frequency range from 10−1 Hz to a few
tens of Hz which is similar to the hydrophones. The observed phases of hydroacoustic signals are
coherent within a few kilometers along the submarine cable, suggesting the DAS is suitable for
applying correlation analysis using hydroacoustic signals. Although our study suggests that virtual
sensor’s self-noise of the present DAS measurement is relatively high compared to the conventional
in-situ hydroacoustic sensors above a few Hz, the DAS identifies the ocean microseismic background
noise along the entire submarine cable except for some cable sections de-coupled from the seafloor.
Various previous studies have shown that a fiber-optic cable itself can be a sensor because optical light scattering
effects are relatively sensitive to external influences such as strain, temperature or magnetic fi eld1–5. Distributed
acoustic sensing (DAS) based on Rayleigh back-scattering of light is one of the fiber-optic sensing technologies
enabling us to monitor vibration of the ground by measuring phase changes within a fiber-optic cable due to its
strain changes caused by elongation and compression of the fi ber6. Therefore, DAS functions as spatio-temporally
continuous strain sensors deployed from the optical source over a distance of few tens of kilometers. It has been
studied that DAS based on Rayleigh back-scattering of light is capable of long-range sensing within a wide
frequency range, but with less spatial resolution, as compared to Brillouin based sensing7. On the other hand,
Brillouin based sensing is commonly employed in distributed strain sensing (DSS) or distributed temperature
sensing (DTS), because even ambient condition directly affects the back-scattering of light. However, Brillouin
based sensing can suffer from issues of narrow frequency bands, small frequency shift, and reduced sensitivity to
temperature. Detailed discussions on the difference in the scattering processes between Rayleigh and Brillouin
can be found in an a rticle8. The sensor channel spacing along a fiber-optic cable can be decreased down to a few
centimeters and the gauge length for each sensor can be controlled independently. The ultimate resolution is
controlled by a combination of channel spacing and gauge length. DAS can be regarded as a continuous strain
sensor array deployed along a fiber-optic cable. DAS technology, in the early period of its history, has been
developed primarily by industry for surveillance of underground reservoirs of oil or gas9,10, as well as condition
monitoring of pipeline distribution systems11. To a lesser degree, DAS technology has been employed in civil
engineering for the purpose of monitoring the maintenance requirements and degradation of linear structures
such as bridges, railways, embankments or buildings in which material properties are changing over t ime12–15.
Recently DAS technology has been applied to studies of earth science in both on-land and under-sea regions
and successfully detected seismic signals. For example, the DAS technique was applied to the on-land fiber-optic
cable, and it detected surface waves that originated from regional to global teleseismic events16–19, an ice-quake
event inside the glacier t errain20, and ice sheet d
isplacement21. DAS can estimate subsurface structures using arti-
ficially controlled sources or ambient noise22,23. Previous field studies for earthquake observations and laboratory
experiments suggest that DAS data shows the same sensitivity as a seismometer24. Some successful applications
of DAS technique using a submarine fiber-optic cable have been c onducted25–29. For example, DAS identified
an unknown fault system in Monterey Bay, California U.S.A., as well as a signal originated by a local earthquake
1
Japan Agency for Marine-Earth Science and Technology (JAMSTEC), Yokosuka, Japan. 2National Research
Institute for Earth Science and Disaster Resilience (NIED), Tsukuba, Japan. 3OptaSense Ltd, Farnborough,
UK. *email: hmatsumoto@jamstec.go.jp
Scientific Reports | (2021) 11:2797 | https://doi.org/10.1038/s41598-021-82093-8 1
Vol.:(0123456789)
www.nature.com/scientificreports/
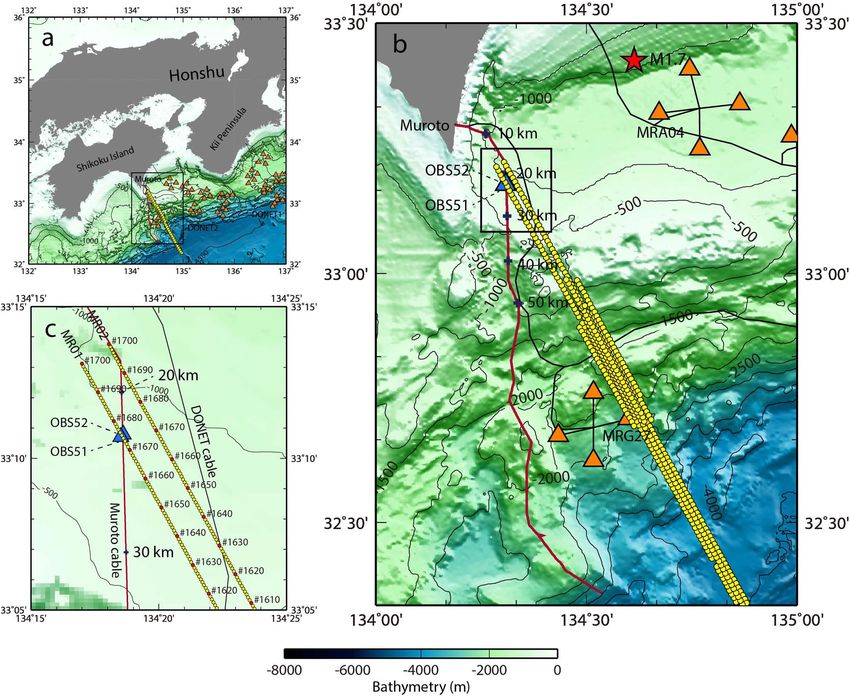
Figure 1. The DAS experimental areas covered by the study. The locations of the Muroto cable (red line), the
air-gun shot sites (yellow circles), two OBSs (blue triangles), and the DONET observatories (orange triangles)
are shown. (a) The DAS experimental site is located off Shikoku Island, Japan, where the DONET observatories
are deployed. (b) Detailed map of the Muroto cable and the surrounding area. The Muroto cable is 128 km long
of which the cable section up to 50 km is used for the DAS measurement. Cable length is indicated by a blue
cross at every 10 km. Two OBSs, i.e. OBS51 and OBS52, had been deployed near the Muroto cable temporally
during the air-gun shots. The seismic survey lines with the air-gun shots were located over the Muroto cable and
one DONET observatory, MRG27. (c) Detailed map of the air-gun shots near the Muroto cable. The numbers
presented along two seismic survey lines, i.e. MR01 and MR02 are the shot identifications (IDs). The locations
of the air-gun shot are represented by red circles every 10 shots for easier visibility. It is expected that the air-gun
shots between #1670 and #1680 along the MR01 line were conducted over the Muroto cable and two OBSs.
These maps were created with the Generic Mapping Tools (GMT 4.5.11, https://www.generic-mapping-tools
.org) software60.
nearby26. Another seafloor experiment demonstrated that DAS is capable of detecting surface gravity wave with
same frequency range as a tsunami in the o cean28. These applications of in-situ DAS geophysical measurement
were primarily based on passive sources30. Additionally, hydro-pressure sensing by DAS has not been common,
so only a few literatures can be found31,32.
We conducted a unique experiment: DAS measurements contemporarily with a ship-based seismic survey
using air-guns above a submarine fiber-optic cable. Thus, we report on this first opportunity to examine the in-
situ DAS dataset consisting of signals originating from the active sources. The submarine cable (power and data
transmission) used in the present DAS measurement had been deployed in 1997 as part of offshore earthquake
and tsunami o bservatories33. We refer to this submarine cable off Muroto in Shikoku Island, Japan as the “Muroto
cable” in this paper (Fig. 1). Six single mode optical fibers are encased in the submarine cable, which were used
for data transmissions by the seismic and pressure sensors. Their operation stopped in 2019, and were replaced
by a new permanent cabled seafloor observatory nearby, named the Dense Ocean-floor Network system for
Scientific Reports | (2021) 11:2797 | https://doi.org/10.1038/s41598-021-82093-8 2
Vol:.(1234567890)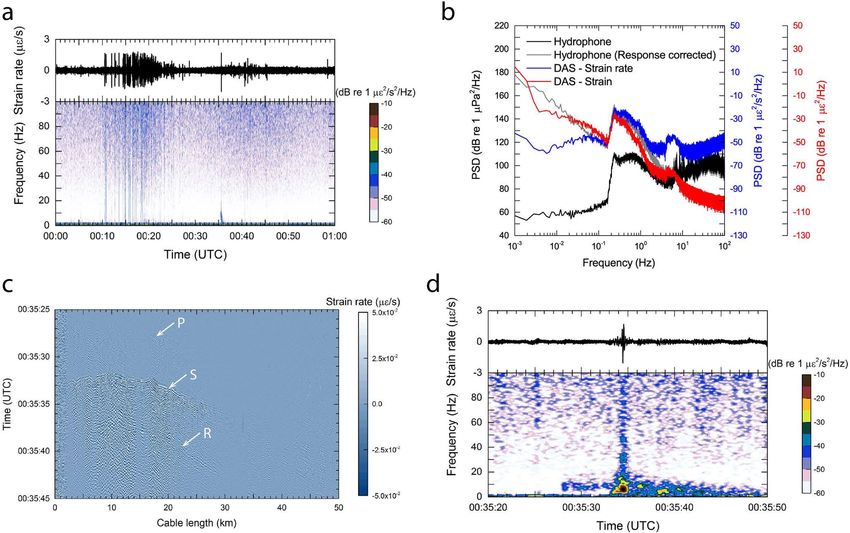
www.nature.com/scientificreports/
Earthquakes and Tsunamis (DONET)34,35. DONET and two co-located stand-alone seismometers (temporarily
deployed near the submarine cable) were available during the experiment. They allowed us to compare the signals
acquired by DAS with conventional geophysical sensors at the seafloor. DONET consists of two seismometers, a
broadband seismometer and an accelerometer, three kinds of pressure sensors, an absolute pressure gauge (PG),
a differential pressure gauge (DPG) and a hydrophone, while the stand-alone seismometer consists of a three-
component geophone and a hydrophone.
In the present study, the DAS dataset acquired during the ship-based air-gun survey is examined and com-
pared with the hydroacoustic observations by the in-situ pressure sensors. We present how the acquired DAS
dataset is processed and calibrated so that it can be regarded as in-situ sensors for the detection of hydroacoustic
signals, connecting the incident hydroacoustic signals with the responding seafloor motion. We also analyze
ocean microseismic background noise and a small regional earthquake observed within the DAS measurements
to prove that the present data processing is performed accordingly and consistent with the conventional sensors.
Results
DAS recording associated with hydroacoustics. A ship-based seismic survey was conducted in
December 2019 to investigate the seismic structure off Honshu, Japan. Some of the survey lines were located
near the DONET observatories as well as the Muroto cable (Fig. 1a). The Muroto cable is 128 km long in total,
reaching 3640 m in depth (Fig. 1b). Submarine cables are assembled with various surrounding structures (inter-
nal and external mechanical strength members) for protecting them against external force depending on the
deployment environments. The submarine cable is protected by an outer armor made of single or double layer of
stranded steel wires to prevent stress damage in shallow water areas. Additionally, near landing stations, cables
often suffer from damages by fishing tools, anchors, trawlers, and so on. For this reason, the Muroto cable has a
buried cable section from 0.35 and 2.14 km distance, with a burial depth of 0.5 to 1.0 m deep below the seafloor.
From the end of this section, the cable is laid and rests due to its own weight on the seafloor. The present DAS
measurement was performed within a 50 km-long section from the landing station with 10-m resolution along
the submarine cable. Thus, for majority of the length, the DAS measurement is performed with the submarine
cable laid on the seafloor. So less coupling to the seafloor is expected compared to on-land observation where
DAS measurement can be performed using buried cable. We keep in mind the DAS sensor’s sensitivity aspects
due to such weak-coupling condition, when we discuss frequency characteristics of the DAS measurement using
the submarine cable in this study.
Two seismic survey lines cross the Muroto cable at a distance of approximately 20 km, and one of the seismic
survey lines (MR01) is very close to two ocean-bottom seismometers (OBS51 and OBS52) (Fig. 1c). A representa-
tive example of a DAS measurement capturing the air-gun shot signal and relevant analyses is shown in Fig. 2.
This shot (Number 1675) was activated along the MR01 line at 09:22:32 UTC on 03 December 2019 near two
OBSs. The horizontal offset distances between the source and OBSs are 119 m and 98 m for OBS51 and OBS52,
respectively. At the same time, this shot is one of the closest sources to the Muroto cable (Fig. 1c). The raw data
was converted to the strain units using the SEAFOM standard conversion formula36,37 and processed by applying
a bandpass filter between 2 and 60 Hz to enhance the air-gun related signals.
Since the water depth beneath the ship is 852 m at the location of the shot number 1675 along the MR01
line, the first arrival of the signal, i.e. hydroacoustic signal (propagation speed 1.48 km/s) is identified 575 ms
after the source initiation near the source area within the 1 km-cable section from the shot (Fig. 2a,b). The first
arrival of signals near the source area is dominated by hydroacoustic signals based on its propagating speed. The
Muroto cable is running almost straight in North-South direction near this source area, and therefore the arrival
of hydroacoustic signals are recorded symmetrically on both sides.
The amplitude of detected signals in the landward section is larger than the seaward section for the same
distance from the source location (Fig. 2a). This can be explained by a bathymetry profile along the submarine
cable. The expected cross-sectional profile along the Muroto cable with cable types is provided in Fig. 2c. The
Muroto cable runs across the edge of a small basin at the section between 10 km through 30 km, and then it
approaches the trough axis (Fig. 1b). This bathymetry change is one possible reason why the cable section up
to 30 km is relatively sensitive compared to the further seaward section. The arrival of a high-speed phase is
recognized at a distance between 2 and 12 km at 09:22:37 UTC, which are refracted waves propagating through
the oceanic crust. Similar phases are visible further seawards, although the amplitude is much smaller. The cable
section at the location around 7 km is less sensitive for DAS measurement as indicated by the diminishing signals.
This quiet characteristic was observed only during the air-gun shots, so this is attributed to the orientation of
the signal source with respect to the sensor array. Another reason (in addition) could be that this cable section
is located in an acoustic shadow area.
The noise level at the near-shore section up to 2 km is considerably high compared to the DAS observation
on the remaining length further offshore and suggests that wind-driven waves and subsea currents continu-
ously force oscillations of the submarine cable (Fig. 2a). Although the submarine cable is protected by double
armored (DA) steel wires as well as buried near the shore line, the internal fibers were affected by the external
force induced by the wind-waves. Root-mean-square (RMS) amplitudes for a period of 1 s with 100-m bins are
compared in Fig. 2d; one measurement curve is taken before the air-gun shot and the other includes its signal.
RMS amplitudes suggest that the noise level at the shallow water area is about 40 dB larger than the offshore area,
which is as large as the air-gun shot (Fig. 2d). According to comparison of the air-gun shot recording (Fig. 2a)
and the RMS amplitude (Fig. 2d), low-sensitivity sections correspond to those of the relatively low RMS ampli-
tudes, e.g. around 7 km, 14 to 17 km, and 20 to 21 km. So DAS may contribute to assess the cable condition at
the seafloor after deployment. We interpreted that the gradual increase of RMS amplitude identified further
than about 30 km distance corresponds primarily to slowly increasing low-frequency wave (or subsea current)
Scientific Reports | (2021) 11:2797 | https://doi.org/10.1038/s41598-021-82093-8 3
Vol.:(0123456789)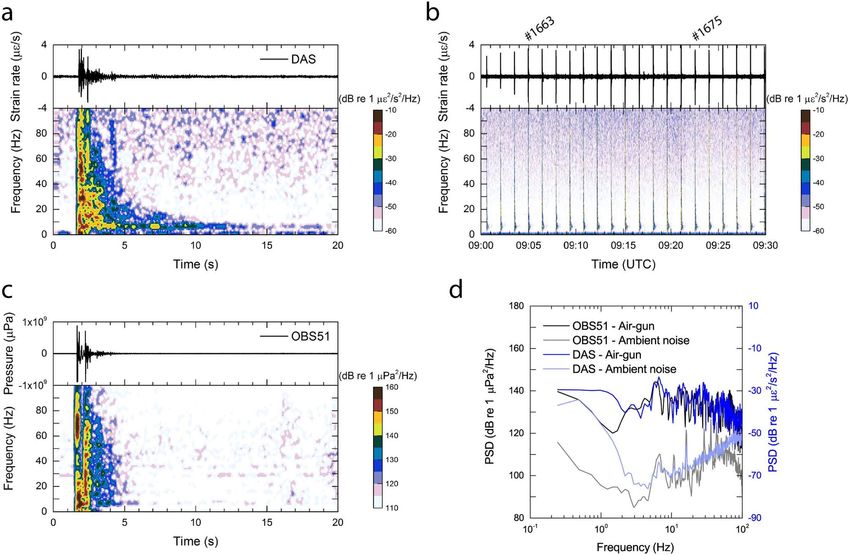
www.nature.com/scientificreports/

                                            Figure 2.  An example of the DAS recordings associated with the air-gun shot. The air-gun shot presented is
                                            number 1675 along the MR01 line indicated in Fig. 1c. (a) 15 s-long recording (a period for 09:22:30 UTC to
                                            09:22:45 UTC on 03 December 2019) of strain along the Muroto cable up to 50 km. A band-pass filter between
                                            2 and 60 Hz is applied to the strain dataset. (b) Enlarged figure focusing on the first arrival of the hydroacoustic
                                            signal at a cable section between 16 and 26 km. Periodic strain fluctuations are observed on both sides of the
                                            arrival. (c) Cross-sectional profile along the Muroto cable with information of submarine cable type. Cable
                                            types of DA, SAM, SAL, and LW mean double armored, single armored medium, single armored light, and light
                                            weight cables, respectively. (d) Root-mean-square (RMS) amplitudes along the Muroto cable. RMS amplitudes
                                            are calculated using 100-m bins. Two different periods between 09:22:30 UTC and 09:22:31 UTC and between
                                            09:22:32 UTC and 09:22:33 UTC are presented. The former and the latter RMS amplitudes are associated with
                                            the ambient noise and the air-gun shot, respectively. (e) Time series of strain rate recording the air-gun shot at a
                                            cable length of 20.8 km. (f) Power spectral density (PSD) of strain rate associated with the air-gun shot.

          Scientific Reports |   (2021) 11:2797 |                https://doi.org/10.1038/s41598-021-82093-8                                                    4

Vol:.(1234567890)
www.nature.com/scientificreports/
actions (Fig. 2a). The distance of 30 km is separated between the small basin slope and the offshore trough slope
(Fig. 1b), so the subsea conditions may be different between these two areas.
Data processing of DAS measurement. In principle DAS measures the phase change between an inci-
dent light pulse and the returned Rayleigh scattered light. The position of the acoustic event along the fiber-optic
cable is determined by the arrival time of the returning backscatter signals. This returning backscatter phase
signals are analyzed and converted to strain units representative of the axial strain in the cable induced by distur-
bance. Our DAS measurement system stores in real-time a continuous dataset of unwrapped phase signal over
time (for each sensor channel).
Our main interest is in detecting hydroacoustic signals efficiently within a submarine cable by using the DAS
technique. Thus, we examine the in-situ data of the DONET observatory during the air-gun shots. The in-situ
pressure at the seafloor is proportional to the vertical acceleration of the seafloor in a frequency range where
the seismic signals are prominent38. It is theoretically studied that the air-gun-induced pressure observed at the
seafloor correlates to the particle acceleration in the shallow water where hydroacoustic waves cannot be driven39.
The in-situ pressure observation of this study is conducted in the deep-sea and in a higher frequency range
than the seismic waves, so the effect of compressible water layer arises. Hydroacoustic pressure is determined
by particle velocity and acoustic impedance; this allows us to relate the in-situ pressure to the seafloor motion.
Consequently, the hydroacoustic signals observed at the seafloor are proportional to particle velocity of the
seafloor motion in a high frequency range where hydroacoustic signals manifested themselves (Supplementary
Fig. 1). For easier comparison with conventional sensors, the dimensional unit of the DAS measurement should
be converted to the particle velocity accordingly as far as hydroacoustic signals are concerned. Phase changes
of the returned Rayleigh scattered light obtained by the DAS measurement are directly related to the distance
changes of the fiber-optic cable in each small section. Thus, we introduce strain rate which is defined by the
temporal derivative of strain.
The resulting processed data (converted to strain rate units) as induced by the air-gun shot at 09:22:32 UTC
and its power spectral density (PSD) are shown in Fig. 2e,f, respectively. The waveform presents time-series data
at a distance of 20.8 km where the first arrival of hydroacoustic signal was identified (Fig. 2b). A large amplitude
signal train was observed at the first arrival of hydroacoustic signal, followed by a short-duration oscillation.
The seismic survey line MR01 runs across the Muroto cable at a distance of 22.7 km in the sea chart (Fig. 1c),
however the first arrival of the hydroacoustic signal is identified at about 1.9 km closer toward the landing sta-
tion. This suggests that the actual submarine cable route and turning points near the seismic survey line MR02
has been located further south than the sea chart suggests. Although further examination may constrain the
actual submarine cable route, this topic is beyond the scope of this study. The comparison with strain units of the
signal of the same shot is provided in Supplementary Fig. 2. Comparing the PSD of the strain rate to the original
strain, frequency contents are similar, however the amplitudes are raised-up and dropped-down in low and high
frequency ranges, as an expression of the temporal derivative (Supplementary Fig. 2b). Consequently, the strain
rate signal characteristics in terms of frequency contents approaches that of the hydroacoustic observations made
by the standard instruments at the seafloor (Supplementary Fig. 1).
Comparison with nearby hydrophone. The air-gun shot (Number 1675 along the MR01 line) at
09:22:32 UTC on 03 December 2019 was the source closest to the two OBSs. Due to the uncertainty regarding
the submarine cable route we assume that the location of the first arrival of the hydroacoustic signal induced by
this air-gun shot is the closest point to the OBSs. Thus, we present the data at a distance of 20.8 km of the Muroto
cable above (Fig. 2). Consequently we process the DAS data at that same position. Since the dynamic range
of the present hydrophone (installed in the OBSs) is relatively narrow, and some of recorded signals induced
by the near-field pressure wave can be clipped, we will focus on signals originated from a certain distant shot.
The spectrogram of the strain rate observed at a cable sensor location of 20.8 km is shown in Fig. 3a, which is
one of the successive air-gun shots blasted at 09:04:56 UTC, corresponding to the shot number 1663 along the
MR01 line (Figs. 1c and 3b). The horizontal distance between the shot and the receiver is approximately 2 km.
The broadband and short duration signals are identified, followed by the tail signal. Peak energy is observed in
frequency range above 5 Hz.
Two OBSs, OBS51 and OBS52, were deployed within a few tens of meters (Fig. 1c); therefore there are no
significant differences in recordings between them. The spectrogram of the OBS51 hydrophone recording associ-
ated with the same shot is shown in Fig. 3c. The analysis of OBS52 is provided in Supplementary Fig. 3 with the
same form of Fig. 3c for further comparison. Two broadband and short-duration signals were identified, whose
characteristics in the frequency-time space are similar as the DAS measurement.
PSDs associated with the same incident signal between the DAS measurement (strain rate) and the in-situ
hydrophone are compared in Fig. 3d. PSDs of the ambient noise between the air-gun shots have been also cal-
culated as a reference in order to clarify how the air-gun shot signal increases PSD in each instrument and how
much is attributable to a sensor’s self-noise. Time-windows for PSDs are set to be 15 s for both the air-gun shot
and the ambient noise, i.e. the first 15 s after the shot signal arrival and the last 15 s to the next shot signal arrival.
A hydrophone sensor is optimized and calibrated (in contrast to DAS strain sensing technology) to observe the
hydroacoustic signals in a frequency range above 1 Hz. Thus, we use it as reference for the true in-situ hydroa-
coustics signals. Our frequency analysis of the hydrophone suggests that the air-gun shot increases the PSD by
30 to 50 dB from the ambient noise level in a broadband frequency range. In the higher frequency range, the
PSD associated with the air-gun shot signal is decreased.
The ambient noise derived from the DAS measurement does not include the signals that the hydrophone
observes in a high frequency range above 5 Hz, except for a few significant, relatively low-frequency signals. The
Scientific Reports | (2021) 11:2797 | https://doi.org/10.1038/s41598-021-82093-8 5
Vol.:(0123456789)www.nature.com/scientificreports/
Figure 3. Comparison of hydroacoustic signals recorded by the DAS measurement and the co-located
hydrophone. (a) Time series recording and its spectrogram of the DAS measurement at a cable length of 20.8
km, recording the air-gun shot number 1663 along the MR01 line. (b) A series of air-gun shots recorded by the
DAS measurement at the same location of (a) at 09:00s UTC on 03 December 2019, when the ship approaching
the Muroto cable and co-located two OBSs. A shot #1663 conducted at 09:04:56 UTC is magnified in (a). A
following shot #1675 conducted at 09:22:32 UTC is also indicated. (c) Hydroacoustic signal originated from the
same explosion of (a) recorded by a hydrophone of OBS51 displayed as the same form of (a). (d) Power spectral
densities (PSDs) of the same signals of the DAS measurement and the hydrophone comparing with the ambient
noise between the air-gun shots.
PSD of the ambient noise can be regarded as sensor self-noise because the PSD increases by a certain rate with
frequency. On the other hand, DAS measures signals associated with the air-gun shots over the entire frequency
range. Comparison of PSDs between the hydrophone and the DAS suggests that the DAS is capable of measur-
ing accurately the hydroacoustic signal associated with the air-gun shots. Overall the distribution of frequency
contents of the DAS is likely to follow the hydrophone at frequency range above 2 Hz. The most predominant
signal of the air-gun shot is present between 5 and 10 Hz, which is demonstrated in the DAS. However, it seems
that each peak of frequency contents is slightly different. The reason for this is that DAS measures the linear strain
along the fiber-optic cable, whereas a hydrophone measures the hydro-pressure omni-directionally. Additionally,
the DAS measured the coda waves scattered under the seafloor (Fig. 3a), while the hydrophone did not record
such long-lasting waves apparently (Fig. 3c). Our analysis suggests that further investigation is needed to quantify
pressure response of DAS in case of using a straightly deployed fiber-optic cable.
Detectability of ocean microseisms. We investigate the detectability of ocean microseisms40 by the DAS
measurement on data portions during periods of the interruption of seismic air-gun survey. Thermal effects in
the fiber-optic cable interrogated by DAS cannot be neglected for such a low frequency noise analysis. There is
no in-situ ground-truth data how the ambient temperature changed on the submarine cable during the present
DAS measurements. It has been reported that the temperature sensors of the pressure gauges of the Muroto cable
observed periodic ambient temperature changes with 0.2 °C variation in a day41. These temperature effects vary
with fiber and cable type. One laboratory experiment suggested that the temperature coefficient impacts the fiber
strain as 1 µε per 0.1 °C42, but we did not observe such large strain deviation (offset) during the data acquisition.
We examined the short time duration of a few tens of seconds to an hour, and therefore we regarded that the
contribution of temperature variation as very small.
As an example of DAS measurement of ocean microseisms, Fig. 4a shows a strain rate time series at a cable
distance of 20.8 km and its spectrogram for 1-h period, i.e. 00:00s UTC on 02 December 2019. An impulsive
signal having low frequency contents recognized in the spectrogram at 00:35 UTC was caused by a regional
Scientific Reports | (2021) 11:2797 | https://doi.org/10.1038/s41598-021-82093-8 6
Vol:.(1234567890)www.nature.com/scientificreports/
Figure 4. DAS recordings associated with the ambient noise and an earthquake. (a) Time series recording
and its spectrogram of 1 h recording (a period of 00:00s UTC on 02 December 2019) at a cable length of 20.8
km. 1-s time window, 1-Hz frequency resolution and 90 % over-lap time are used. (b) Power spectral densities
(PSDs) comparing the DAS measurement and the co-located hydrophone. Note that the PSD of the hydrophone
corrected with the sensor’s response (gray line) is synthesized by extrapolation of a low frequency range down to
10−3 Hz using the same modeling procedure43. (c) DAS recording of the entire Muroto cable during a regional
earthquake with magnitude of 1.7. Band-pass filter between 2 and 20 Hz is applied. Arrows denoted by P, S, and
R represent the arrivals of seismic P-, S-, and Rayleigh- waves identified by the authors, respectively. (d) Time
series recording and its spectrogram at a cable length of 20.8 km during the earthquake. Note that the 1-s time
window is the same to (a), but frequency resolution and over-lap time are 0.1 Hz and 96 %, respectively.
earthquake, while successive signal trains having high frequency contents during the entire period might be
caused by the fishery activities nearby because of the correspondence to their working times. These signals were
identified in the co-located hydrophone (Supplementary Fig. 4), supporting that strain rate is an appropriate unit
to examine hydroacoustic signals in DAS measurements. The PSD of the DAS measurement of the entire period
at 00:00s UTC is shown in Fig. 4b. We examined the data obtained by the co-located hydrophone of OBS51. The
PSDs of the hydrophone are also shown in Fig 4b, in which the sensor response is corrected by extrapolation of
frequency range down to 10−3 Hz43. It shows that the hydrophone observes the ocean microseismic background
noise (ocean microseisms) in the low frequency range below 1 Hz, as typically manifested in the deep o cean40. The
PSD yields 150 dB (in pressure units) at the frequency of the ocean microseisms (Fig. 4b), which is comparable
to other observations at the seafloor or in the water-column40,44. Since the peak frequency observed by the DAS
measurement corresponds to the co-located hydrophone perfectly, it proves that the DAS is capable of observing
ocean microseisms. As we discussed above, we interpreted that the sensor’s self-noise is predominant at a high
frequency range above 5 Hz in the DAS measurement. The PSDs of every one-kilometer along the Muroto cable
are depicted in Supplementary Fig. 5, in which the ocean microseismic background noise can be identified along
the entire cable except for the near-shore section and some short-range sections.
In general, the observed pressure at the seafloor increases with decreasing frequency because the infra-gravity
wave can drive long-period pressure waves in a low frequency range below 10−2 Hz40. Long-period water-wave
change can be regarded as static pressure change of the equivalent water-column45. In a borehole experiment, it
is suggested that very low-frequency pressure oscillation (less than 10−3 Hz ) linearly responds to the fiber strain
(displacement) measured by D AS46. The previous studies suggest that the DAS measurement should be processed
into strain (or displacement) units, to highlight the strain induced by pressure change in the low frequency range.
So we calculate PSD in strain units and plot it in Fig. 4b, in which the peak of ocean microseismic background
noise is aligned between three different units. Strain units at frequency of 10−3 Hz increase the PSD by 40 dB
higher than the peak of the ocean microseismic background noise, which is compatible with the pressure units
of the hydrophone. The comparison of the DAS with the hydrophone suggests that the DAS strain measurement
Scientific Reports | (2021) 11:2797 | https://doi.org/10.1038/s41598-021-82093-8 7
Vol.:(0123456789)www.nature.com/scientificreports/
agrees well with the hydrophone pressure measurement at a frequency range below the ocean microseismic
background noise, i.e. less than 10−1 Hz . The present DAS measurement indicates enough sensitivity in the low
frequency range down to 10−3 Hz , and supports the possibility of detection of such long-period phase changes
in a fiber-optic cable. It has been reported that a long-period strain oscillation induced by the earth tide can be
detected by DAS, albeit being performed in a laboratory experiment47.
Detectability of seismic signals. State-of-the-art interferometry makes it possible to detect an earth-
quake using thousands of kilometers of intercontinental submarine fiber-optic c able48. While this technique
is useful for detecting an earthquake with a long distance fiber-optic cable, it has limitations due to the inter-
ferometric methodology used. It acts as a single sensor over the entire fiber-optic cable, whereas DAS provides
many thousands of sensors, albeit over a shorter distance. Recently, a number of instances of on-land earthquake
observations using the DAS technology have been found in the literatures16,49,50. However it has not been com-
mon to conduct investigations using a submarine cable; only a few field observations have been performed
before26–29. So more applications regarding detection of earthquakes using a submarine cable are indispensable
to prove that the DAS measurement can be achieved reliably in the deep-sea environment. The previous stud-
ies regarding DAS using a submarine cable addressed the far-field (epicentral distance is 16,300 km) or the
regional on-land (epicentral distance varies from 40 to 100 km) earthquakes. In contrast, we focus on a regional
submarine earthquake for which in-situ pressure sensors are available because we assess the effect of incident
seismic signals on the DAS measurement. During the present DAS measurement, a small regional earthquake
with a magnitude of 1.7 occurred at 00:35:18 UTC on 02 December 2019 at the location of 12 km north of one
DONET observatory, MRA04 (Fig. 1b). The entire DAS recording in strain rate with a frequency band between
2 and 20 Hz is shown in Fig. 4c. A very weak phase is identified prior to the main phase in some cable sections,
which is the seismic P wave of the earthquake. The main phase observed from 00:35:32 UTC is the seismic S
wave, according to the association of epicentral distance with the seismic velocity. A weak contrast parallel to
the S wave is recognized after 00:35:37 UTC, which is interpreted that the Rayleigh surface wave arrives because
the time-lag from S wave increases with the epicentral distance. The azimuthal direction (bearing) of the Muroto
cable changes significantly at some locations, e.g. at distances of about 10 km and about 18 km within the DAS
measurement section. The incident seismic wave arrives like a spherical or a plane wave, while the Muroto cable
is not straight, so such a bearing location is characterized by changing the arrival’s phase velocity and the sensi-
tivity pattern. The P wave is attenuated beyond 18 km cable length, which corresponds to the location where the
cable bearing changes from 148.4◦ to 178.4◦ (Fig. 1c), although the possibility that the P wave is relatively weak
compared to the S wave cannot be excluded.
Hydroacoustic signals, the primary topic of this paper, are not recognized in the time-cable length plot due to
two possible reasons. One possible reason is that the earthquake source is not far from the Muroto cable, so it is
difficult to discriminate between seismic wave and hydroacoustic wave in this case; in other words, hydroacoustic
signals might be masked by the seismic wave. The other possible reason is that the earthquake source is located
near the end of the downslope, so the high-angle incident seismic wave to the water-column is not likely to be
coupled to the hydroacoustic w aves51.
A spectrogram of strain rate focusing on the earthquake signals is shown in Fig. 4d as the same form of Fig. 4a.
Although the P wave arrival is not so clear, the S wave is obviously identified at 00:35:34 UTC in the spectrogram.
As for the P wave, only weak signals with low frequency contents below 20 Hz are present, while for the S wave,
strong signals with high frequency contents above 20 Hz are manifested. If a hydroacoustic wave originated from
the earthquake source is observed, it should be exhibited at 00:35:40s UTC, based on the epicentral distance of
39 km and the hydroacoustic speed. Thus, hydroacoustic wave cannot be discriminated from the seismic wave in
the case of this small earthquake. The pressure recording and its spectrogram by the DPG sensor at the DONET
observatory, MRA04, is provided in Supplementary Fig. 6a, indicating that the seismic contribution to a pres-
sure sensor is evident. The PSD indicates that the frequency contents associated with this earthquake is 20 dB in
the maximum larger than the ambient noise level in the frequency range between 2 and 60 Hz (Supplementary
Fig. 6b). The co-located hydrophone recording of OBS51 and its spectrogram is shown in Supplementary Fig. 7a.
When comparing PSDs, the frequency content associated with the earthquake is different between the DAS
and the co-located hydrophone measurement (Supplementary Fig. 7b). One possible reason is that the signal-
to-noise ratio (SNR) is quite different between the air-gun shots and the small earthquake: the pressure signal
amplitude (or PSD) yields 140 dB for the air-gun shots (Fig. 3d and Supplementary Fig. 1c), while it is 100 to
120 dB for the earthquake even in the near-field observation (Supplementary Fig. 6b). Examining the ambient
noise of the hydrophone (Fig. 3d) or the spectrogram before the earthquake (Supplementary Fig. 7a), the pres-
sure amplitude varies 90 to 100 dB within frequency range of 2 to 40 Hz, which is comparable to the pressure
amplitude induced by this small earthquake. The DAS measurement detected the M1.7 earthquake signals suf-
ficiently with an increase in the PSD by 30 dB from ambient noise levels. Although further investigation may
be needed, DAS using a submarine cable is better coupled to the seafloor than temporarily deployed (dropped)
hydrophones. Thus, DAS has a better likelihood of detecting seismic signals. Overall the diminished SNR is
confirmed in the hydrophone recording during the earthquake, however P- and S- waves arrivals can be identi-
fied in the frequency range lower than 20 Hz, apparent at 00:35:27 UTC, and are similarly recognized in the
DAS measurement. Further discussion of sensitivity performed by the DAS measurement in terms of pressure
response is needed. Nevertheless, the general features regarding seismic signals detection by DAS are the same
to the previous studies presented elsewhere, proving that the present data processing is performed properly.
Scientific Reports | (2021) 11:2797 | https://doi.org/10.1038/s41598-021-82093-8 8
Vol:.(1234567890)www.nature.com/scientificreports/
Discussion
Hydroacoustic signals originating in the water-column or near the water-surface were detected for the first time
on DAS measurements using the submarine fiber-optic cable while conducting a marine active source seismic
survey. DAS measurements using a submarine cable have been studied by using the passive sources such as natu-
ral earthquake signals, while in this study active sources (ship-based air-guns) are used. Our examination of the
unique dataset obtained by the DAS technique has provided insights into hydroacoustic monitoring in the ocean.
The raw dataset has been converted to strain rate along a submarine cable, so that hydroacoustics can be
easily compared to standard sensors used in the present study. The sensitivity of the DAS measurement for the
hydroacoustic signals induced by air-gun shots has been investigated, and PSDs show a similar characteristic
in frequency contents to the co-located hydrophones. Since the sensor self-noise of the DAS measurement is
relatively high in the frequency range above 5 Hz compared to other conventional in-situ hydroacoustic sensors,
incident signals should have a good SNR to be detected. Nevertheless, it is worthwhile noting that the ocean
microseismic background noise increases the PSD of the DAS measurement in an appropriate frequency range.
This capability of the detection of the ocean miscroseismic background noise can be identified along the entire
sections of the Muroto cable up to 50 km except for some short-distance sections where submarine cable may
be de-coupled with the seafloor. It has been shown that seismic signals induced by a regional earthquake can
be identified in the DAS measurement. Comparing with the DONET pressure sensors, some discrepancies in
frequency contents and phases of the observations exist, although there is no doubt that the complete seismic
signals themselves were captured.
In general, an explosion in the water-column accompanies a bubble pulse which is characterized by a short-
duration and broadband frequency c ontents52–54. What is the most unique in the present study is the use of
an active explosive source on a ship, and it has been demonstrated that the short-duration and broadband
hydroacoustic signals were detected by the DAS measurement with very similar characteristics to the co-located
hydrophones. This experimental evidence that DAS can detect hydroacoustic signals may contribute to remote
monitor of submarine volcanoes. It has been well known that hydroacoustic observation associated with sub-
marine volcanic eruptions show similar characteristics in a frequency s pace55–57. The most important aspect of
hydroacoustic observation in the ocean is that the hydroacoustic signals can be driven to a distant place through
the Sound and Fixed Ranging (SOFAR) channel axis58,59. In order to allow accurate estimation of direction-of-
arrival (DOA) it is indispensable for remote monitoring of submarine volcanic activity that phase recordings at
different submarine cable sections should be coherent within a few kilometers for an array analysis. It has been
observed that hydroacoustic signals recorded along the Muroto cable are correlated and the phase patterns are
contained within a few kilometers (Fig. 1b). Since the Muroto cable is deployed in a fairly straight line from
the North to the South, some difficulties arise for application of an array analysis. The present study suggests
that the DAS technology can be applied to remote monitoring of inaccessible submarine volcanic activity using
hydroacoustic signals if a submarine cable route is selected accordingly.
Methods
The DAS system and the data processing. The DAS data acquisition system used in the present study
is a long-range DAS Plexus system manufactured by OptaSense Ltd capable of recording with a sensors spacing
of 1 m on a sensing length of 50 km. The raw data is acquired with 1-m channel pitch and and with a gauge length
of 34 m, which corresponds to one of the gauge lengths selectable in the current DAS data acquisition system
software. The gauge length was synthetically increased to 102 m by selection and summation of properly located
sensor channels. The first 34 raw recorded channels were omitted during this process to avoid edge effects. After
that, the raw 1-m pitch data was down-sampled to 10 m channel spacing. A data subset utilizing a 20 m gauge
length was also acquired, for which a suitable summation of five properly selected sensor channels was applied
to create output data with a 100 m gauge length. In both cases a very similar measurement quality was obtained.
In any case, the output of the system consists of unwrapped optical phase difference data with the sampling
interval of 500 Hz.
The strain ε is related to the change in phase dφ by the wavelength = 1550 nm, refractive index of the fiber
used n, the gauge length G, as individual gauge length contributions are suitably summed. In this case it results
in either 102 m or 100 m dependent on the original gauge length. The photoelastic scaling factor for longitudinal
strain in an isotropic material is ξ = 0.78. The ultimate strain is calculated by the following formula36,37.
dφ
ε= (1)
4π nGξ
The DONET seafloor observatory network. The dense ocean-floor network system for earthquakes
and tsunamis (DONET) has been developed by the Japan Agency for Marine-Earth Science and Technology
(JAMSTEC) and operated by the National Research Institute for Earth Science and Disaster Resilience (NIED).
Two DONETs have been deployed off Kii Peninsula and an offshore area between Kii Peninsula and Shikoku
Island. At present, 51 observatories in total are operational by two D ONETs34,35. Each DONET observatory
is connected with the fiber-optic submarine cables, and all dataset are sent to the NIED in real-time. Each
observatory consists of various geophysical in-situ sensors: a three-component broadband seismometer, a three-
component accelerometer, an absolute pressure gauge (PG), a difference pressure gauge (DPG), a hydrophone,
and a thermometer. The sampling frequency of two kinds of seismic sensors, a DPG and a hydrophone is 200
Hz, while that of a PG is 10 Hz.
Scientific Reports | (2021) 11:2797 | https://doi.org/10.1038/s41598-021-82093-8 9
Vol.:(0123456789)www.nature.com/scientificreports/
Data availability
The datasets acquired during on-site expeditions conducted by the JAMSTEC and are open to the public at the
JAMSTEC repository. The datasets used in the present study are available from the corresponding author on
reasonable request. The DONET data is available from the NIED at https://doi.org/10.17598/nied.0008.
Received: 30 September 2020; Accepted: 12 January 2021
References
1. Butter, C. D. & Hocker, G. E. Fiber optics strain gauge. Appl. Opt. 17, 2867–2869. https://doi.org/10.1364/AO.17.002867 (1978).
2. Culshaw, B. & Kingsley, S. A. Thermal phase noise in coherent optical-fiber systems. Electron. Lett. 16, 97–99. https://doi.
org/10.1049/el:19800074 (1980).
3. Posey, J. R., Johnson, G. A. & Vohra, S. T. Strain sensing based on coherent Rayleigh scattering in an optical fibre. Electron. Lett.
36, 1688–1689. https://doi.org/10.1049/el:20001200 (2000).
4. Culshaw, B. & Kersey, A. Fiber-optic sensing: A historical perspective. J. Light. Technol. 26, 1064–1078. https://doi.org/10.1109/
JLT.0082.921915 (2008).
5. Albert, N. et al. Optical fiber magnetic field sensors based on magnetic fluid: A review. Sensors 18, 4325. https://doi.org/10.3390/
s18124325 (2018).
6. Karrenbach, M. et al. Fiber-optic distributed acoustic sensing of microseismicity, strain and temperature during hydraulic fractur-
ing. Geophysics 84, D11–D23. https://doi.org/10.1190/geo2017-0396.1 (2019).
7. Masoudi, A. & Newson, T. P. Contributed review: Distributed optical fibre dynamic strain sensing. Rev. Sci. Instrum. 87, 011501.
https://doi.org/10.1063/1.4939482 (2016).
8. Schenato, L. A review of distributed fibre optic sensors for geo-hydrological applications. Appl. Sci. 7, 896. https: //doi.org/10.3390/
app7090896 (2017).
9. Molenaar, M. M., Hill, D., Webster, P., Fidan, E. & Birch, B. First downhole application of distributed acoustic sensing for hydraulic-
fracturing monitoring and diagnostics. SPE Drilling Completion 27, 140561-PA. https://doi.org/10.2118/140561-PA (2012).
10. Lumens, P. Fiber-optic sensing for application in oil and gas wells. Ph. D. thesis. Technische Universiteit Eindhoven. (2014).
11. Tanimola, F. & Hill, D. Distributed fibre optic sensors for pipeline protection. J. Natural Gas Sci. Eng. 1, 134–143. https://doi.
org/10.1016/j.jngse.2009.08.002 (2009).
12. Nishio, M. & Takeda, N. Shape reconstruction of composite structures with monitoring of modeling changes using Brillouin
scattering based distributed optical fiber strain sensor network. Proc. SPIE 2009 7293, 729314. https://doi.org/10.1117/12.81560
6 (2009).
13. Barrias, A., Casas, J. R. & Villalba, S. A review of distributed optical fiber sensors for civil engineering applications. Sensors 16,
748. https://doi.org/10.3390/s16050748 (2016).
14. Brauner, M., Kogelnig, A., Koenig, U., Neunteufel G. & Schilcher, H. Distributed acoustic monitoring to secure transport infra-
structure against natural hazards – requirements and new developments. Conf. Proc. INTERPRAEVENT 2016 ISBN 978-3-901164-
24-8231-238 (2016).
15. Vidovic, I. & Marschnig, S. Optical fibres for condition monitoring of railway infrastructure—Encouraging data source or errant
effort?. Appl. Sci. 10, 6016. https://doi.org/10.3390/app10176016 (2020).
16. Lindsey, N. et al. Fiber-optic network observations of earthquake wavefields. Geophys. Res. Lett. 44, 11–792. https://doi.
org/10.1002/2017GL075722 (2017).
17. Ajo-Franklin, J. B. et al. Distributed acoustic sensing using dark fiber for near-surface characterization and broadband seismic
event detection. Sci. Rep. 9, 1328. https://doi.org/10.1038/s41598-018-36675-8 (2018).
18. Yu, C. et al. The potential of DAS in teleseismic studies: Insights from the Goldstone experiment. Geophys. Res. Lett. 46, 1320–1238.
https://doi.org/10.1029/2018GL081195 (2019).
19. Lindsey, N. J., Rademacher, H. & Ajo-Franklin, J. B. On the broadband instrument response of fiber-optic DAS arrays. J. Geophys.
Res. Solid Earth https://doi.org/10.1029/2019JB018145 (2020).
20. Walter, F. et al. Distributed acoustic sensing of microseismic sources and wave propagation in glaciated terrain. Nat. Commun. 11,
2436. https://doi.org/10.1038/s41467-020-15824-6 (2020).
21. Blum, J. A., Nooner, S. L. & Zumberge, M. A. Recording earth strain with optical fibers. IEEE Sensors J. 8, 1152–1160. https://doi.
org/10.1109/JSEN.2008.926882 (2008).
22. Daley, T. M., Freifeld, B. M., Ajo-Franklin, J. & Dou, S. Field testing of fiber-optic distributed acoustic sensing (DAS) for subsurface
seismic monitoring. Lead. Edge 32, 699–760. https://doi.org/10.1190/tle32060699.1 (2013).
23. Dou, S. et al. Distributed acoustic sensing for seismic monitoring of the near surface: A traffic-noise interferometry case study.
Sci. Rep. 7, 11620. https://doi.org/10.1038/s41598-017-11986-4 (2017).
24. Papp, B., Donno, D., Martin, J. E. & Harog, A. H. A study of the geophysical response of distributed fibre optic acoustic sensors
through laboratory-scale experiments. Geophys. Prospect. 65, 1186–1204. https://doi.org/10.1111/1365-2478.12471 (2017).
25. Hartog, A. H., Belal, M. & Clare, M. A. Advances in distributed fiber-optic sensing for monitoring marine infrastructure, measur-
ing the deep ocean, and quantifying the risks posed by seafloor hazards. Marine Tech. Soc. J. 52, 58–73. https://doi.org/10.4031/
MTSJ.52.5.7 (2018).
26. Lindsey, N. J., Craig Dawe, T. & Ajo-Franklin, J. B. Illuminating seafloor faults and ocean dynamics with dark fiber distributed
acoustic sensing. Science 366, 1103–1107. https://doi.org/10.1126/science.aay5881 (2019).
27. Williams, E. F. et al. Distributed sensing of microseisms and teleseisms with submarine dark fibers. Nat. Commun. 10, 5778. https
://doi.org/10.1038/s41467-019-13262-7 (2019).
28. Sladen, A. et al. Distributed sensing of earthquakes and ocean-solid earth interactions on seafloor telecom cables. Nat. Commun.
10, 5777. https://doi.org/10.1038/s41467-019-13793-z (2019).
29. Lior, I. et al. On the detection capabilities of underwater DAS. Earth Space Sci. Open Arch. https://doi.org/10.1002/essoar.10504
330.1 (2020).
30. Zhan, Z. Distributed acoustic sensing turns fiber-optic cables into sensitive seismic antennas. Seismol. Res. Lett. 91, 1–15. https://
doi.org/10.1785/0220190112 (2019).
31. Becker, M. et al. Fracture hydromechanical response measured by fiber optic distributed acoustic sensing at milliHertz frequencies.
Geophys. Res. Lett. 44, 7295–7302. https://doi.org/10.1002/2017GL073931 (2017).
32. Goertz, A. & Wuestefeld, A. Real-time passive monitoring with a fibre-optic ocean bottom array. First Break 36(4), 55–61. https
://doi.org/10.3997/1365-2397.n0083(2018).
33. Momma, H. et al. Monitoring system for submarine earthquakes and deep sea environment. Proc. MTS/IEEE OCEANS’97 2,
1453–1459. https://doi.org/10.1109/OCEANS.1997.624211 (1997).
34. Kaneda, Y. et al. Development and application of an advanced ocean floor network system for megathrust earthquakes and tsu-
namis. In Seafloor Observatories (eds Favali, P. et al.) 643–663 (Springer, Berlin, 2015). https://doi.org/10.1007/978-3-642-11374
-1_25.
Scientific Reports | (2021) 11:2797 | https://doi.org/10.1038/s41598-021-82093-8 10
Vol:.(1234567890)www.nature.com/scientificreports/
35. Kawaguchi, K., Kaneko, S., Nishida, T. & Komine, T. Construction of the DONET real-time seafloor observatory for earth-
quakes and tsunami monitoring. In Seafloor Observatories (eds Favali, P. et al.) 211–228 (Springer, Berlin, 2015). https://doi.
org/10.1007/978-3-642-11374-1_10.
36. Hartog, A. H. An introduction to distributed optical fibre sensors (CRC Press, Boca Raton, 2017). https://doi.org/10.1201/97813
15119014.
37. SEAFOM. DAS parameter definitions and tests. SEAFOM MSP-02. https://seafom.com (2018).
38. Filloux, J. H. Tsunami recorded on the open ocean floor. Geophys. Res. Lett. 9, 25–28. https://doi.org/10.1029/GL009i001p00025
(1982).
39. Prior, M. K., Duncan, A. J., Özkan Sertlek, H. & Ainslie, M. A. Modeling acoustical pressure and particle acceleration close to
marine seismic airguns and airgun arrays. IEEE J. Ocean. Eng. 44, 611–620. https://doi.org/10.1109/JOE.2019.2891873 (2019).
40. Webb, S. C. Broadband seismology and noise under the ocean. Rev. Geophys. 36, 105–142. https://doi.org/10.1029/97RG02287
(1998).
41. Inazu, D. & Hino, R. Temperature correction and usefulness of ocean bottom pressure data from cabled seafloor observatories
around Japan for analyses of tsunamis, ocean tides, and low-frequency geophysical phenomena. Earth Planets Space 63, 1133–1149.
https://doi.org/10.5047/eps.2011.07.014 (2011).
42. Zumberge, M. A., Hatfield, W. & Wyatt, F. K. Measuring seafloor strain with an optical fiber interferometer. Earth Space Sci. 5,
371–379. https://doi.org/10.1029/2018EA000418 (2018).
43. Matsumoto, H., Haralabus, G., Zampolli, M. & Özel, N. M. T-phase and tsunami pressure waveforms recorded by near-source
IMS water-column hydrophone triplets during the 2015 Chile earthquake. Geophys. Res. Lett. 43, 12511–12519. https://doi.
org/10.1002/2016GL071425 (2016).
44. Brown, D., Ceranna, L., Prior, M., Mialle, P. & Le Bras, R. J. The IDC seismic, hydroacoustic and infrasound global low and high
noise models. Pure Appl. Geophys. 171, 361–375. https://doi.org/10.1007/s00024-012-0573-6 (2014).
45. Crawford, W. C., Webb, S. C. & Hildebr, J. A. Seafloor compliance observed by long period pressure and displacement measure-
ments. J. Geophys. Res. 96, 16151–16160. https://doi.org/10.1029/91JB01577 (1991).
46. Becker, M. et al. Fluid pressure sensing with fiber-optic distributed acoustic sensing. Leading Edge 36, 1018–1023. https://doi.
org/10.1190/tle36121018.1 (2017).
47. Becker, M. W. & Coleman, T. Distributed acoustic sensing of strain at earth tide frequencies. Sensors 19, 1975. https://doi.
org/10.3390/s19091975 (2019).
48. Marra, G. et al. Ultrastable laser interferometry for earthquake detection with terrestrial and submarine cables. Science 361,
486–490. https://doi.org/10.1126/science.aat4458 (2018).
49. Jousset, P. et al. Dynamic strain determination using fiber-optic cables allows imaging of seismological and structural features.
Nat. Commun. 9, 2509. https://doi.org/10.1038/s41467-018-04860-y (2018).
50. Wang, H. F. et al. Ground motion response to an ML 4.3 earthquake using co-located distributed acoustic sensing and seismometer
arrays. Geophys. J. Int. 213, 2020–2036. https://doi.org/10.1093/gji/ggy102 (2018).
51. Williams, C. M., Stephen, R. A. & Smith, D. K. Hydroacoustic events located at the intersection of the Atlantis (30°N) and Kane
(23°40′N) transform faults with the Mid-Atlantic Ridge. Geochem. Geophys. Geosys. 7, Q06015. https://doi.org/10.1029/2005G
C001127 (2006).
52. Haywood, J. H. The behaviour of underwater explosions. In Applied Mechanics (ed. Görtler, H.) 993–1000 (Springer, Berlin, 1996).
https://doi.org/10.1007/978-3-662-29364-5_131.
53. Hunter, K. S. & Geers, T. L. Pressure and velocity fields produced by an underwater explosion. J. Acoust. Soc. Am. 115, 1483–1496.
https://doi.org/10.1121/1.1648680 (2004).
54. Krieger, J. R. & Chahine, G. L. Acoustic signals of underwater explosions near surfaces. J. Acoust. Soc. Am. 118, 2961–2974. https
://doi.org/10.1121/1.2047147 (2005).
55. Dziak, R. P. et al. Flux measurements of explosive degassing using a yearlong hydroacoustic record at an erupting submarine
volcano. Geochem. Geophys. Geosyst. 13, Q0AF07. https://doi.org/10.1029/2012GC004211 (2012).
56. Heaney, K. D., Campbell, R. L. & Snellen, M. Long range acoustic measurements of an undersea volcano. J. Acoust. Soc. Am. 134,
3299–3306. https://doi.org/10.1121/1.4818844 (2013).
57. Matsumoto, H. et al. Interpretation of detections of volcanic activity at Ioto Island obtained from in situ seismometers and remote
hydrophones of the International Monitoring System. Sci. Rep. 9, 19519. https://doi.org/10.1038/s41598-019-55918-w (2019).
58. Ewing, M., Woollard, G. P., Vine, A. C. & Worzel, J. L. Recent results in submarine geophysics. Bull. Geol. Soc. Am. 57, 909–934.
https://doi.org/10.1130/0016-7606(1946)57[909:RRISG]2.0.CO;2 (1946).
59. Urick, R. J. Low-frequency sound attenuation in the deep ocean. J. Acoust. Soc. Am. 35, 1413–1422. https: //doi.org/10.1121/1.19187
05 (1963).
60. Wessel, P. & Smith, W. H. F. Free software helps map and display data. EOS Trans. AGU72, 441–446. https: //doi.org/10.1029/90EO0
0319 (1991).
Acknowledgements
We thank Chris Minto and Steve Cole (OptaSense Ltd) for providing us technical supports and suggestions in
the data processing. Discussions on hydroacoustics with Mario Zampolli, Georgios Haralabus, Jerry Stanley and
Nurcan Meral Özel (Comprehensive Nuclear Test-Ban-Treaty Orgainzation) were beneficial to the present study.
The DONET data presented in this study were provided by the NIED. The information of a regional earthquake
is provided by the Japan Meteorological Agency (JMA). This study is partly supported by the Grants-in-Aid for
Scientific Research (KAKENHI: JP16KK0155) of the Japan Society for the Promotion of Science (JSPS). We used
the Generic Mapping Tools (GMT) software to produce some of the figures.
Author contributions
H.M. is the main author of the manuscript. H.M. and E.A. are the main contributors to the data processing and
analysis. T.K., T.T., and T.Y. assisted in data acquisition and quality control. G.F., K.S., K.O., R.A., Y.K., Y.N., and
S.K. were responsible for the ship-based seismic survey and the quality control of the OBSs. N.T. was responsible
for data acquisition of the DONET observatories. R.E. and Y.V. operated the DAS system and performed real-
time quality control. M.K. assisted in the preparation of the manuscript and provided technical input regarding
the performance of the DAS measurement.
Competing interests
The authors declare no competing interests.
Scientific Reports | (2021) 11:2797 | https://doi.org/10.1038/s41598-021-82093-8 11
Vol.:(0123456789)You can also read


