More frequent flooding? Changes in flood frequency in the Pearl River basin, China, since 1951 and over the past 1000 years - HESS
←
→
Page content transcription
If your browser does not render page correctly, please read the page content below
Hydrol. Earth Syst. Sci., 22, 2637–2653, 2018
https://doi.org/10.5194/hess-22-2637-2018
© Author(s) 2018. This work is distributed under
the Creative Commons Attribution 4.0 License.

More frequent flooding? Changes in flood frequency in the Pearl
River basin, China, since 1951 and over the past 1000 years
Qiang Zhang1,2,3 , Xihui Gu4 , Vijay P. Singh5 , Peijun Shi1,2,3 , and Peng Sun6
1 Key  Laboratory of Environmental Change and Natural Disaster, Ministry of Education,
Beijing Normal University, Beijing 100875, China
2 State Key Laboratory of Earth Surface Processes and Resource Ecology,

Beijing Normal University, Beijing 100875, China
3 Faculty of Geographical Science, Academy of Disaster Reduction and Emergency Management,

Beijing Normal University, Beijing 100875, China
4 Department of Atmospheric Science, School of Environmental Studies,

China University of Geosciences, Wuhan 430074, China
5 Department of Biological and Agricultural Engineering and Zachry Department of Civil Engineering,

Texas A&M University, College Station, Texas, USA
6 College of Territory Resources and Tourism, Anhui Normal University, Anhui 241000, China

Correspondence: Qiang Zhang (zhangq68@bnu.edu.cn) and Xihui Gu (guxihui421@163.com)

Received: 12 November 2017 – Discussion started: 27 November 2017
Revised: 7 March 2018 – Accepted: 28 March 2018 – Published: 3 May 2018

Abstract. Flood risks across the Pearl River basin, China,       and human activities, such as building of levees, channeliza-
were evaluated using a peak flood flow dataset covering a        tion of river systems, and rapid urbanization; these were the
period of 1951–2014 from 78 stations and historical flood        factors behind the amplification of floods in the middle and
records of the past 1000 years. The generalized extreme          lower Pearl River basin, posing serious challenges for devel-
value (GEV) model and the kernel estimation method were          oping measures of mitigation of flood hazards in the lower
used to evaluate frequencies and risks of hazardous flood        Pearl River basin, particularly the Pearl River Delta (PRD)
events. Results indicated that (1) no abrupt changes or sig-     region.
nificant trends could be detected in peak flood flow series at
most of the stations, and only 16 out of 78 stations exhib-
ited significant peak flood flow changes with change points
around 1990. Peak flood flow in the West River basin in-         1   Introduction
creased and significant increasing trends were identified dur-
ing 1981–2010; decreasing peak flood flow was found in           Climatic extremes are one of the crucial drivers of meteoro-
coastal regions and significant trends were observed dur-        logical and hydrological hazards, such as floods and droughts
ing 1951–2014 and 1966–2014. (2) The largest three flood         (IPCC, 2007; Li et al., 2016). Meanwhile, climate change is
events were found to cluster in both space and time. Gener-      expected to intensify the global hydrological cycle, which
ally, basin-scale flood hazards can be expected in the West      will potentially lead to a general increase in the intensity
and North River basins. (3) The occurrence rate of floods in-    and frequency of extreme climatic events (Ohmura and Wild,
creased in the middle Pearl River basin but decreased in the     2002; Alan et al., 2003; Zhang et al., 2013). This will, in
lower Pearl River basin. However, hazardous flood events         turn, have direct implications for hydrological extremes, such
were observed in the middle and lower Pearl River basin,         as floods and droughts (IPCC, 2013). However, the impacts
and this is particularly true for the past 100 years. However,   of climate change on hydrological extremes are expected to
precipitation extremes were subject to moderate variations       vary across different regions over the globe due to the pre-
                                                                 vailing hydrometeorological regimes and the nature of cli-

Published by Copernicus Publications on behalf of the European Geosciences Union.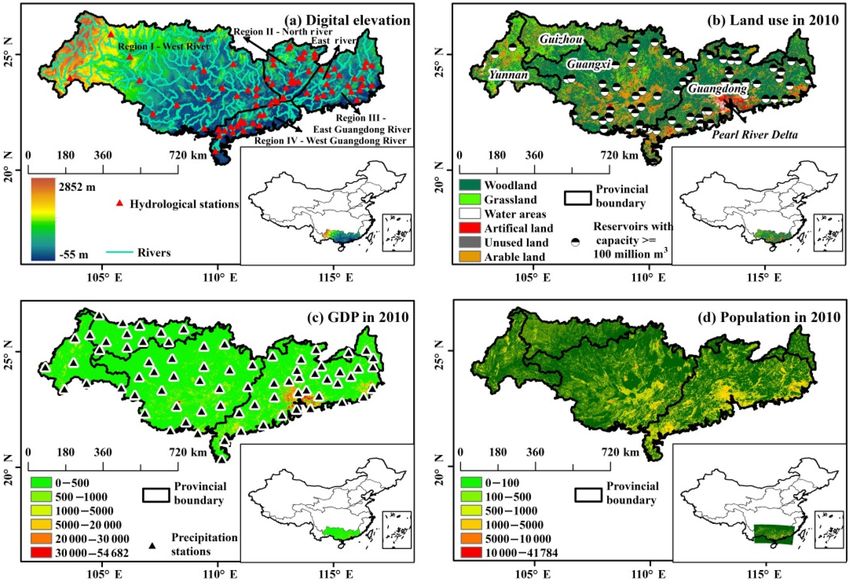
2638                                                                                 Q. Zhang et al.: More frequent flooding?

mate change in specific regions (Beniston and Stephenson,           order to make reliable predictions. Therefore, the question is
2004; Burn et al., 2015).                                           how best to extrapolate limited data to extreme events, when
   Due to remarkable differences in the hydrometeorologi-           no or only short series of such events are available (Kjeldsen
cal processes that generate floods, climate change can in-          et al., 2014). High quality data and analyses of long histori-
crease or decrease the magnitude, duration, frequency and           cal records of peak extreme events are important to determine
even nonstationarity of extreme hydrological events, such as        whether climate is becoming extreme or variable (Nicholls,
floods considered in this study (Gu et al., 2016; Vormoor et        1995). To that end, flood records of 1000 years from Guang-
al., 2016; Zhang et al., 2016). A very recent study by Zhang        dong Province (which covers the lower Pearl River basin)
et al. (2015a) corroborated the changes in hydrological ex-         and Guangxi Province (which covers the middle Pearl River
tremes across China but also found the increasing impact of         basin) were collected to overcome the limitations of short
human activities on fluvial hydrological processes. Changes         gauge-station-based flood records for analyzing floods, and
in hydrometeorological triggers are believed to be the first        this is also the significance of this study.
step to project likely future changes in flood-generating pro-         The historical flood records were collected from two
cesses (Hall et al., 2014; Vormoor et al., 2016). This is partic-   books compiled by Wen and Song (2006) and Wen and
ularly the case with flood processes in the Pearl River basin,      Yang (2007). These two books include abundant records rel-
the second largest river basin in China in terms of flow vol-       evant to various meteorological disasters, such as tropical
ume, in a region with a highly developed economy, a dense           cyclones, droughts, floods, and frosts. The historical flood
population, and important megacities, such as Guangdong,            records should be screened out from these abundant records,
Macau, and Hong Kong. This constituted the motivation for           and this is quite a time-consuming job. Therefore, only a
this study. Hydrometeorological extremes often have disas-          few reports were found concerning flooding changes over a
trous impacts on society, water resources, agricultural activ-      long period such as 1000 years in this study based on his-
ities, urban infrastructure, and also ecosystems (Das et al.,       torical records. In addition, historical flood records in other
2013; Li et al., 2016). Floods, in particular, damage infras-       regions of the globe have been used to analyze the changes
tructure, take away many lives, and are one of the costli-          in flood frequency (e.g., Mudelsee et al., 2003). Mudelsee
est types of natural disaster in economic and human terms           et al. (2003) collected flood records from AD 1000 to AD
(Bouwer and Vellinga, 2003). This is also true for China            2000, and pointed out no upward trends in the occurrence of
where floods tend to have more significant impacts on agri-         extreme floods in central Europe. Mudelsee et al. (2004) in-
culture than droughts (Zhang et al., 2015b).                        dicated that historical flood records can provide reliable and
   Increasing catastrophic losses due to natural hazards have       unique information on heavy floods at least since AD 1500 in
attracted widespread public awareness of extreme events in          the Elbe and Oder rivers, which further emphasized the mer-
recent years (e.g., Beniston and Stephenson, 2004; Zolina et        its of historical records in the study of flooding frequency
al., 2004). By 2100, the mean annual global surface temper-         from a long-term perspective.
ature will increase by 1.4–5.8 ◦ C, and future climatic and hy-        Therefore, the objectives of this study are (1) to quantify
drological extremes will tend to increase and intensify corre-      abrupt changes and trends of flood events; (2) to characterize
spondingly (Beniston et al., 2007; IPCC, 2007). Therefore, it       temporal changes of 10-year flood flow and spatial distribu-
is important to investigate flood behavior, and related stud-       tion of flood magnitude > 10-year flood magnitude (the flood
ies can be of practical value in water resources manage-            peak is expected to occur, on average, once every 10 years);
ment. It should be noted that precipitation extremes have           and (3) to determine frequency and occurrence rate based on
a predominant effect on floods (Jena et al., 2014). Studies         1000-year flood records. Potential causes of spatiotemporal
on precipitation extremes across the Pearl River basin have         patterns of floods across the Pearl River basin and related im-
indicated that the amount of rainfall has changed little but        plications are also discussed. This study provides a clear pic-
the variability has increased over the time interval divided        ture showing the evolution of floods in both space and time in
by change points (Zhang et al., 2009). Further, changes in          a humid river basin and shows the response of hydrological
the characteristics of precipitation extremes across the Pearl      extremes to climate change and human activities.
River basin are similar to those around the globe (Hirsch and
Archfield, 2015); i.e., frequencies of precipitation extremes
are increasing but magnitudes have moderate changes. How-           2     Study region and data
ever, increasing precipitation extremes are observed mainly
in the lower Pearl River basin, including the Pearl River Delta     2.1    Study region
(PRD) region (Zhang et al., 2012), and also partly in the mid-
dle Pearl River basin. Therefore, it can be expected that flood     The Pearl River (97◦ 390 E–117◦ 180 E; 3◦ 410 N–29◦ 150 N)
risk should be higher in the middle and lower Pearl River           (Fig. 1), with a drainage area of 4.42 × 10⁵ km2 , is the sec-
basin or coastal regions (Pino et al., 2016).                       ond largest river in China in terms of flow volume (PRWRC,
   In general, extreme floods are rare and hence there is lim-      1991). It includes three major tributaries: West River, North
ited opportunity to collect adequate samples of such events in      River, and East River. The West River (region I) is the largest

Hydrol. Earth Syst. Sci., 22, 2637–2653, 2018                                     www.hydrol-earth-syst-sci.net/22/2637/2018/
Q. Zhang et al.: More frequent flooding? 2639
Figure 1. Locations of hydrological stations, precipitation gauging stations, and water reservoirs, and spatial patterns of land use, socio-
economy, and population across the Pearl River basin.
tributary, accounting for 77.8 % of the total drainage area of at low-lying altitude and the downstream location, together
the basin. The North River (region II) is the second largest with rapid economic development and population growth
one, with a drainage area of 46 710 km2 . The East River (re- over the past 3 decades, have made the PRD region more
gion III) accounts for 6.6 % of the total area of the Pearl and more vulnerable to natural hazards, such as floods, salin-
River. And region IV, which is beyond the three major trib- ity intrusion, and storm surges. In recent years, engineer-
utaries, is located in the west of the Guangdong Province ing facilities and other modifications of the Pearl River net-
(Fig. 1). The annual mean temperature ranges between 14 work have been designed to strengthen flood protection and
and 22◦ C and the precipitation mainly occurs during April– to cater for huge requirements of building materials.
September (Zhang et al., 2009), accounting for 72–88 % of
the annual precipitation (PRWRC, 1991). 2.2 Data
The Pearl River basin is covered mainly by two provinces,
i.e., Guangdong and Guangxi (Fig. 1b). Numerous water
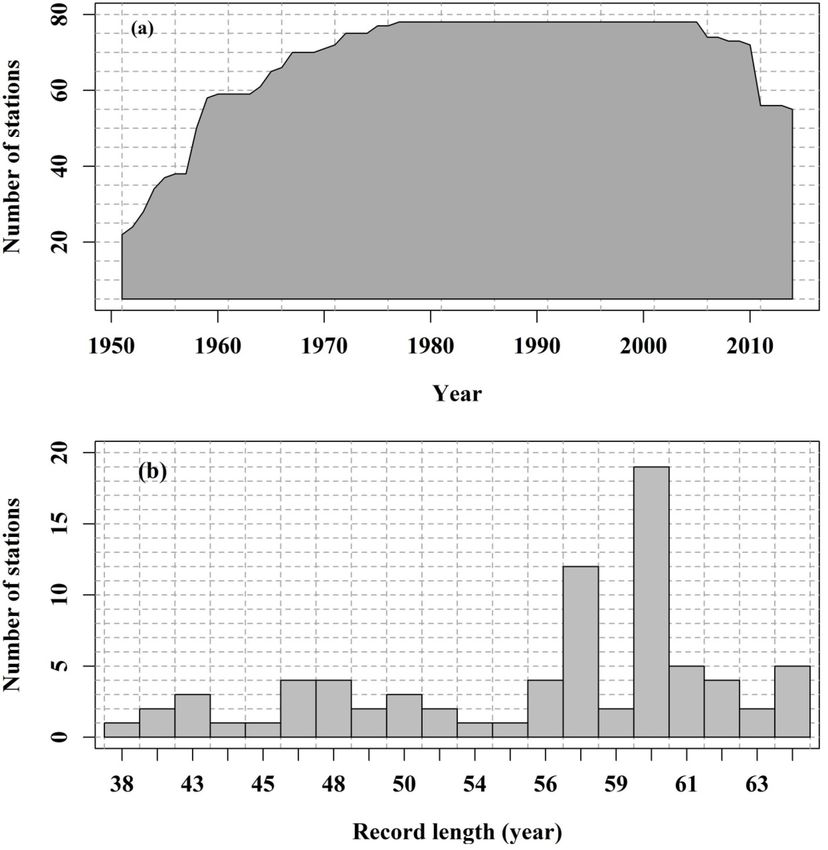
The annual largest 1-day streamflow data (i.e., annual max-
reservoirs have been built in northern, eastern, and western
ima) were collected from 78 hydrological stations across the
Guangdong and also central and southern Guangxi (Fig. 1b).
Pearl River basin (Table 1). Locations of these hydrological
In addition, widespread urbanization can be observed in the
stations are shown in Fig. 1a. Additionally, daily precipita-
PRD, eastern Guangdong, and coastal regions of Guang-
tion data were also collected from 74 stations across the Pearl
dong (Chen et al., 2009) (Fig. 1b), which has a highly de-
River basin and their locations are shown in Fig. 1c. All the
veloped economy (Fig. 1c) and dense population settlements
precipitation and hydrological data cover the period of 1951–
(Fig. 1d). Central and southern Guangxi is dominated by
2014. Detailed information of these hydrological (Table 1)
croplands (Fig. 1b). The streamflow variations of the Pearl
and precipitation data can be found in Fig. 2. The hydrolog-
River basin have a considerable influence on the hydrologi-
ical data were provided by the Water Conservancy Bureau
cal processes of the PRD, one of the most complicated deltaic
of the Pearl River Water Conservancy Commission, and the
drainage systems in the world (Chen et al., 2009). Flat terrain
precipitation data were collected from the National Climate
www.hydrol-earth-syst-sci.net/22/2637/2018/ Hydrol. Earth Syst. Sci., 22, 2637–2653, 2018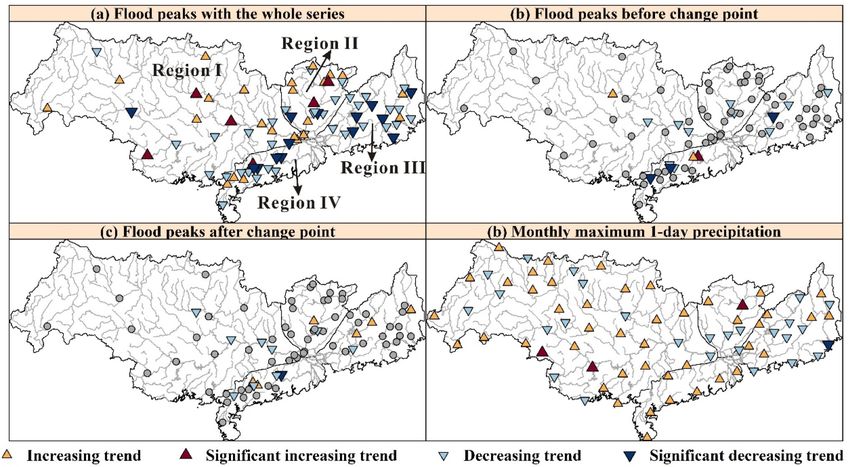
2640                                                                                          Q. Zhang et al.: More frequent flooding?

Table 1. Detailed information of hydrological stations in this study.

                  No.    Station name       Longitude     Latitude      Basin area   Region   Starting   Ending   Record
                                                (◦ E)        (◦ N)          (km2 )                year     year    length
                  1      Qilinzui2             113.85       23.35           2866        III      1954     2014        61
                  2      Pingshi2              113.05       25.28           3567         II      1964     2014        51
                  3      Wenjiang              113.93       24.30           2000         II      1955     2014        60
                  4      Chixi4                113.13       25.38             396        II      1967     2014        48
                  5      Lishi2                113.53       24.85           6976         II      1955     2014        60
                  6      Xiaogulu              114.20       25.07           1881         II      1958     2014        57
                  7      Renhua3               113.75       25.10           1476         II      1964     2014        51
                  8      Jielongwan            114.18       24.90             281        II      1958     2014        57
                  9      Sanshui2              112.83       23.17          46 646        II      1951     2014        64
                  10     Makou                 112.80       23.12         353 100        II      1951     2014        64
                  11     Shuangqiao            112.57       22.97             938         I      1958     2014        57
                  12     Dulin                 109.90       20.83              47       IV       1975     2014        40
                  13     Hedishuiku            110.30       21.72           1495        IV       1965     2014        50
                  14     Gangwajiao3           110.07       21.50           3086        IV       1970     2014        45
                  15     Ruipo                 110.03       21.77             208       IV       1967     2014        48
                  16     Gaozhou4              110.83       21.92           2905        IV       1975     2014        40
                  17     Xinhe                 111.12       21.72             649       IV       1958     2014        57
                  18     Shigushuiku1          111.04       22.07             509       IV       1965     2014        50
                  19     Dabai                 111.15       22.05             394       IV       1967     2014        48
                  20     Huazhoucheng          110.65       21.65           6151        IV       1956     2014        59
                  21     Liangdeshuiku         110.98       22.15             494       IV       1965     2014        50
                  22     Gaoyao                112.47       23.05         351 535         I      1951     2014        64
                  23     Gulan                 111.68       23.57           8273          I      1954     2007        54
                  24     Xiaoluo               111.67       23.25            76.2         I      1977     2014        38
                  25     Lingxia               114.57       23.25          20 557       III      1953     2014        62
                  26     Boluo2                114.30       23.17          25 325       III      1953     2014        62
                  27     Jianshan              115.63       23.67           1578        III      1958     2014        57
                  28     Shuikou2              115.90       23.98           6480        III      1953     2014        62
                  29     Tangjin               116.22       23.98             267       III      1959     2014        56
                  30     Hengshan2             116.35       24.47          12 954       III      1954     2014        61
                  31     Xikou                 116.65       24.53           9228        III      1959     2014        56
                  32     Baokeng               116.42       24.68             437       III      1958     2014        57
                  33     Lantang2              114.93       23.43           1080        III      1958     2014        57
                  34     Shuntian              114.77       24.12           1357        III      1966     2014        49
                  35     Heyuan                114.70       23.73          15 750       III      1951     2014        64
                  36     Longchuan             115.25       24.12           7699        III      1952     2014        63
                  37     Lianping2             114.47       24.37             388       III      1971     2014        44
                  38     Xingfeng2             115.04       24.40             290       III      1972     2014        43
                  39     Jinshan               111.53       22.03             950       IV       1959     2014        56
                  40     Shigushuiku2          111.02       22.05             509       IV       1965     2013        49
                  41     Pomian_qudao          112.00       22.40             768       IV       1958     2014        57
                  42     Pomian3               111.83       22.38             768       IV       1954     2014        61
                  43     Shuangjie             111.80       21.95           4345        IV       1952     2014        63
                  44     Huangjingtang         112.42       24.58             595        II      1958     2014        57
                  45     Gaodao                113.17       24.17           7007         II      1954     2014        61
                  46     Shijiao               112.95       23.57          38 363        II      1954     2014        61
                  47     Mawu2                 113.16       23.85            34.7        II      1972     2014        43
                  48     Damiaoxia             113.50       23.83             472        II      1960     2014        55
                  49     Gaolang2              113.30       23.86             216        II      1972     2014        43
                  50     Chaoan                116.65       23.67          29 077       III      1951     2014        64
                  51     Chikan                116.25       23.68             641       III      1967     2014        48
                  52     Fukou                 115.77       23.40             355       III      1959     2014        56

Hydrol. Earth Syst. Sci., 22, 2637–2653, 2018                                            www.hydrol-earth-syst-sci.net/22/2637/2018/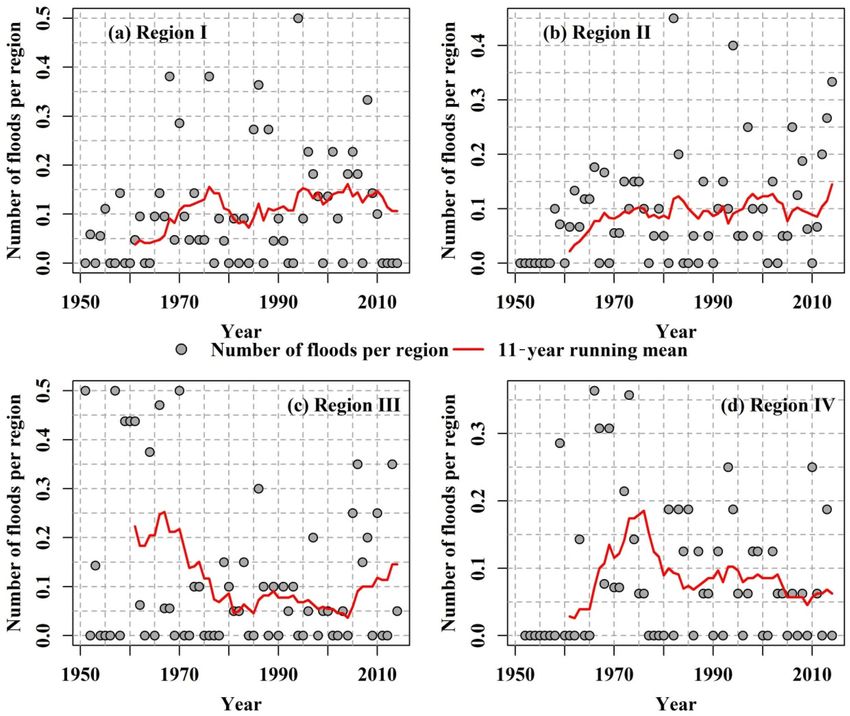
Q. Zhang et al.: More frequent flooding?                                                                                         2641

Table 1. Continued.

                No.    Station name         Longitude   Latitude   Basin area   Region    Starting   Ending    Record
                                                (◦ E)      (◦ N)       (km2 )                 year     year     length
                53     Cijiao                  116.02     23.05          820        III      1955      2014         60
                54     Dongqiaoyuan            116.13     23.48        2016         III      1953      2014         62
                55     Guanliang               111.67     22.83        3164           I      1958      2014         57
                56     Yaogu                   112.28     22.87        1776           I      1958      2014         57
                57     Hejiang2                110.57     21.90        3000         IV       1958      2014         57
                58     Daxiang2                112.15     23.97          671         II      1959      2005         47
                59     Fenghuangshan           112.38     24.83        1084          II      1959      2005         47
                60     Machi                   113.20     23.90          300         II      1959      2005         47
                61     Zhuzhou                 112.35     23.73          553         II      1959      2005         47
                62     Qianjiang               108.97     23.63      128 938          I      1951      2010         60
                63     Dahuangjiangkou         110.20     23.57      288 544          I      1951      2010         60
                64     Wuzhou                  111.30     23.48      327 006          I      1951      2010         60
                65     Jiangbian               103.62     24.00       25 116          I      1951      2010         60
                66     Panjiangqiao            105.38     25.88       14 492          I      1951      2010         60
                67     Zhexiang                106.20     24.92       82 480          I      1951      2009         59
                68     Yongwei                 109.28     25.70       13 045          I      1951      2010         60
                69     Sancha                  108.95     24.47       16 280          I      1951      2010         60
                70     Liuzhou                 109.40     24.32       45 413          I      1951      2010         60
                71     Pingle                  110.67     24.60       12 159          I      1951      2010         60
                72     Baise                   106.63     23.90       21 720          I      1951      2010         60
                73     Xinhe                   107.20     22.45        5791           I      1951      2010         60
                74     Nanning                 108.23     22.83       72 656          I      1951      2010         60
                75     Guigang                 109.62     23.08       86 333          I      1951      2010         60
                76     Jinji                   110.83     23.22        9103           I      1951      2010         60
                77     Changba                 113.68     24.87        6794          II      1951      2010         60
                78     Changle                 109.42     21.83        6645           I      1951      2010         60

                                                                     Center, which can be obtained at http://data.cma.cn/ (last ac-
                                                                     cess: 23 April 2018). The quality of these data was firmly
                                                                     controlled before release.
                                                                        There are fewer than 1 % missing values in daily precip-
                                                                     itation data (Zhang et al., 2018). The missing precipitation
                                                                     data for 1–2 days were filled by the average precipitation of
                                                                     the neighboring days. Consecutive days with missing data
                                                                     were interpolated by the long-term average of the same days
                                                                     of other years. For the objectives of this study, the gap-fill
                                                                     method did not significantly affect the final results. A similar
                                                                     method was used by Zhang et al. (2011) to fill daily miss-
                                                                     ing precipitation values. The annual largest 1-day streamflow
                                                                     data from 78 hydrological stations were directly collected
                                                                     from the Water Conservancy Bureau of the Pearl River Water
                                                                     Conservancy Commission. The annual largest 1-day stream-
                                                                     flow data were compiled before release of the data. The miss-
                                                                     ing values of annual largest 1-day streamflow data were filled
                                                                     by the average value of the neighboring years.
                                                                        Mudelsee et al. (2003) classified floods into three types,
                                                                     based on inundation area and flood-induced losses: (1) floods
                                                                     that occur locally with short duration and little damage; (2)
                                                                     regional floods that have a relatively longer duration and
Figure 2. Information on the peak flood flow dataset.                cause damage to hydraulic infrastructure and also cause casu-
                                                                     alties; and (3) fluvial disastrous floods that have a longer last-

www.hydrol-earth-syst-sci.net/22/2637/2018/                                       Hydrol. Earth Syst. Sci., 22, 2637–2653, 2018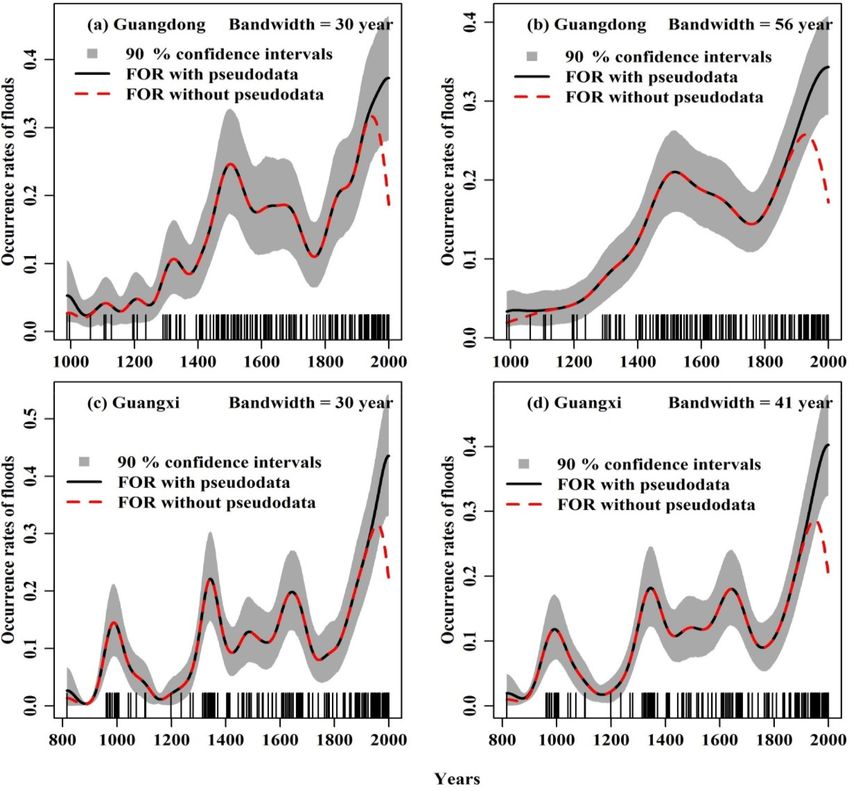
2642                                                                                   Q. Zhang et al.: More frequent flooding?

ing duration (usually days or weeks) and cause serious and          Kendall (MMK) trend test method was used which was pro-
even disastrous damage to hydraulic infrastructure and cause        posed by Hamed and Rao (1998) based on effective or equiv-
massive casualties. In this study, historical flood records were    alent sample size to eliminate the effect of autocorrelation.
collected from documented flood records compiled by Wen             MMK has been used in analyzing the effect of global warm-
and Song (2006) and by Wen and Yang (2007). The docu-               ing on small aquatic ecosystems (Daufresne et al., 2009). In
mented flood records for Guangdong and Guangxi provinces            this study MMK was employed to explore trends in flood se-
covered a period of 383–2000 and 107–2000, respectively.            ries, with the significance level set at 5 %. For the computa-
The disasters were recorded in history books, local chroni-         tion procedure one can refer to Daufresne et al. (2009). The
cles, water conservancy archives, documents, and so on. For         change point and trend detection methods are only applied
the sake of the study on relations between climate change           for the observations during 1951–2014.
and disasters, the group was developed to compile the doc-
umented nature disaster records spanning almost 2000 years          3.2   Generalized extreme value (GEV) model
for each province in China based on multisource information.
The group selected the recorded flood events with mutual            The GEV distribution has been widely used in the analysis of
confirmation in different documents as far as possible. In ad-      hydrometeorological extremes (e.g., Gu et al., 2016) and has
dition, the flood event with more relevant information, such        three parameters, i.e., the location, µ, the scale, α (α > 0),
as magnitude, mortality, flood-damaged and flood-affected           and the shape, κ. In this paper, the GEV is used to calcu-
cropland areas, and flood-induced damaged water conser-             late the return period of flood events. The cumulative density
vancy facilities, is more likely to be selected.                    function (cdf) of a random variable y drawn from a GEV
   The director of the group is Wen, who served as the di-          distribution is given as follows (Cannon, 2010):
rector of the China Meteorological Administration, and one                              "             #
of the group is Ding, who is an academician of the Chinese                                       y − µ 1/κ
Academy of Sciences. The members of the group, who come             F (y; µ, α, κ) = exp − 1 − κ           ,
                                                                                                   α
from a senior government authority or who are famous sci-
entists, can largely ensure the quality of the data. Based on                       y −µ
                                                                      κ 6 = 0, 1 − κ      >0
flood types defined by Mudelsee et al. (2003), only disastrous                        α
flood events were singled out, since floods occurred almost                                        y −µ
                                                                    F (y; µ, α, κ) = exp − exp 1 −         ,
annually. Meanwhile, flood records before AD 1000 were not                                           α
complete and contained missing information; thus disastrous            κ = 0.                                                  (1)
flood records during a period of 1000–2000 were singled out
and analyzed in this study. A flood event, which caused loss
of lives, submersed more than 10 000 farmland areas, or de-
                                                                    3.3   Kernel density estimation of occurrence rates of
stroyed important water conservancy facilities, will be clas-
                                                                          floods
sified as a disastrous flood event.
                                                                    The kernel density estimation method is used to estimate the
                                                                    occurrence rates of historical floods. The estimation of oc-
3     Methods                                                       currence rates of time-dependent extreme events can be com-
                                                                    puted as follows(Mudelsee et al., 2003, 2004):
3.1    Detection of change points and trends
                                                                                 m
                                                                             −1
                                                                                X        t − Ti
                                                                    λ(t) = h        K             ,                          (2)
The Pettitt method (Pettitt, 1979) is a nonparametric test and                             h
                                                                                i=1
enables the detection of change in the mean (median) when
the change point time is unknown. This method has been              where Ti is the timing of the ith flood event with a unit of
widely used in detection of change points (Villarini et al.,        days; m is the number of floods; K(·) is the kernel function;
2009) and was also used in this study. The test is based on the     and h is the width of the kernel function. The Gaussian kernel
Mann–Whitney statistic for testing whether the two samples          function is the widely used kernel function, which can use
X1 ,. . . , Xm and Xm+1 , . . . , Xn come from the same popula-     the Fourier space and produce a smoothed estimation of the
tion. The p value, in statistic testing, is computed using the      occurrence rates of extreme events (Mudelsee et al., 2003,
limiting distribution approximated by Pettitt (1979), which         2004):
is valid for continuous variables (e.g., Villarini et al., 2009).               1
                                                                                        2
                                                                                            y
The 95 % confidence level was used to evaluate the signifi-         K(y) = √ exp −               ,                             (3)
                                                                                2π          2
cance of change point in the study.
   Trends were tested by nonparametric trend detection meth-        where y = (t − Ti ) h−1 . The occurrence rate of an extreme
ods which are less sensitive to outliers than parametric statis-    event, λ(t), denotes the number of an extreme event exceed-
tics are. In this study, the modified version of the Mann–          ing threshold values given a certain time interval, t. The time

Hydrol. Earth Syst. Sci., 22, 2637–2653, 2018                                     www.hydrol-earth-syst-sci.net/22/2637/2018/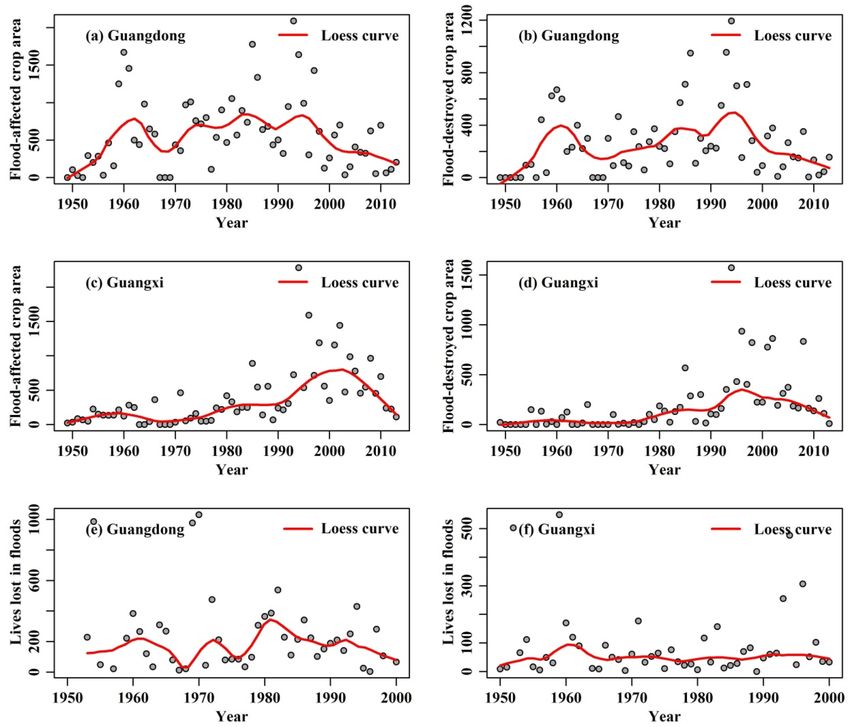
Q. Zhang et al.: More frequent flooding?                                                                                            2643

Figure 3. Spatial distribution of change points using the Pettitt test for peak flood flow changes.

interval of time series is [t1 , tm ]. Since no data are available             1. Based on the extended data series, Ti∗ , the simulated
outside of the time interval, i.e., [t1 , tm ], λ(t) near the bound-              T + of the same series length can be obtained using the
aries of the time interval is usually underestimated. In this                     bootstrap technique.
case, a kind of pseudodata is used to reduce the error as a
                                                                               2. The occurrence rates, λ+ (t), of sample extreme events,
result of underestimated λ(t). A mapping technique is used
                                                                                  T + , can be computed using Eq. (5).
to produce the pseudodata (Mudelsee et al., 2004). pT is the
pseudodata outside of the time interval of [t1 , tm ] for the flood            3. Steps 2 and 3 above will be repeated 2000 times, and
series. For t < t1 , pT[i] = t1 − [Ti − t1 ]; and the same proce-                 λ+ (t) of 2000 samples can be obtained.
dure was done for t > tm . The extended series is 1.5 times
longer than the original one. The computation of λ(t) based                    4. The 90 % confidence interval for λ+ (t) will be obtained
on the extended data series was based on                                          using the quantile method.
             m∗
         −1
             X         t − Ti
λ(t) = h         K              ,                                (4)
             i=1
                         h                                                 4     Results

where Ti is the timing of the ith flood event based on the ex-             4.1    Change points and trends of peak flood flow
tended data series with a unit of day; m∗ is the sample size
of the extended data series. Also, the selection of window                 Analyses of change points and trends were only applied
width, h, is important for the estimation of λ(t). Too small               in observed flood events (i.e., annual maxima of period of
a window width, h, selected for the computation of λ(t) will               1951–2014). Figure 3 illustrates spatial patterns of stations
substantially influence the randomness of λ(t); too large a                with different change points of peak flood flow. It can be ob-
window width, h, may cause over-smoothing of the data se-                  served from the figure that only 16 out of 78 stations, ac-
ries, and hence details in information may be excluded. The                counting for 20.5 % of the total stations, were characterized
cross-validation method was used to determine the width of                 by significant change points of peak flood flow changes, and
the window (Mudelsee et al., 2003). The kernel density esti-               most of these stations are found in the middle and lower
mation method is only applied for the historical floods.                   Pearl River basin. In the coastal regions of the lower Pearl
                                                                           River basin, 10 out of 16 stations with significant change
3.4   Confidence interval by Bootstrap technique                           points were observed, accounting for 62.5 % of the total
                                                                           stations, characterized by significant change points of peak
The bootstrap technique and Eq. (4) can be combined to en-                 flood flow. Generally, flooding in the Pearl River basin is
able uncertainty analysis of the occurrence rate of floods,                mainly attributed to precipitation extremes which were ob-
λ(t), using the following procedure (Mudelsee et al., 2004).               served mainly in the middle and lower Pearl River basin

www.hydrol-earth-syst-sci.net/22/2637/2018/                                                Hydrol. Earth Syst. Sci., 22, 2637–2653, 2018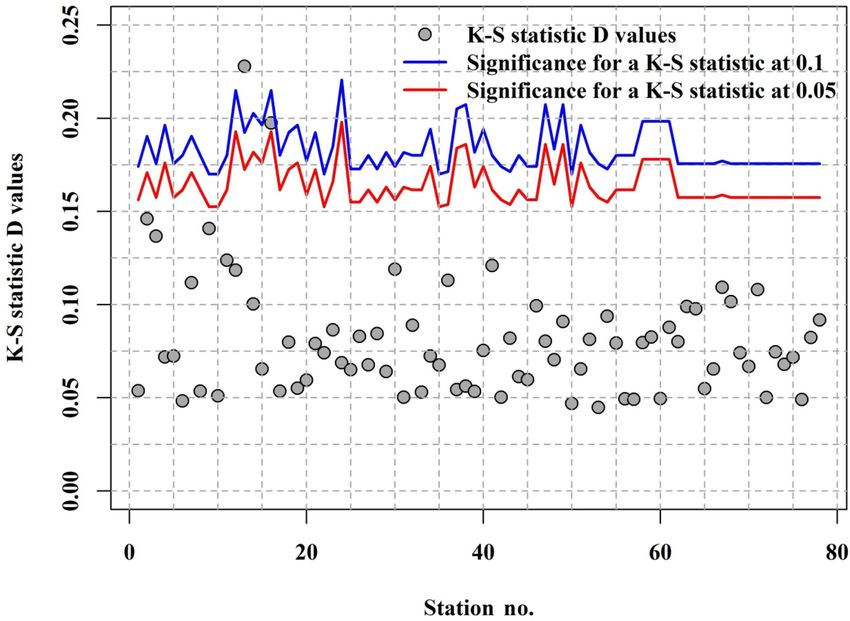
2644                                                                                         Q. Zhang et al.: More frequent flooding?

Figure 4. Trends in (a) flood peaks with the whole series, (b) flood peaks before the change point, (c) flood peaks after the change point, and
(d) precipitation extremes. The gray dots in (b) and (c) indicate the stations without a change point.

and particularly in the lower Pearl River basin (Zhang et al.,            West River basin and the northern North River basin, and
2012). Results of change points of precipitation maxima by                significant decreasing precipitation extremes were detected
Zhang et al. (2009) indicated that precipitation maxima were              in the East River basin. Hence, spatial patterns of peak flood
dominated by significant change points during 1980–1993,                  flow matched those of precipitation extremes (Fig. 4a, d), im-
and significant change points of peak flood flow series de-               plying that floods in these regions were impacted mainly by
tected in this study were during 1986–1995, showing signif-               precipitation extremes. The southeastern West River basin
icant impacts of precipitation extremes on flooding. These                and rivers in the west parts of region III were dominated
results showed that significant change points of flood pro-               by significant increasing precipitation extremes but signifi-
cesses were found mainly in the middle Pearl River basin                  cant decreasing peak flood flow (Fig. 4). Human activities
and particularly in the lower Pearl River basin. In addition,             exerted considerable impacts on flood processes in these re-
human impacts on flood processes cannot be ignored, and                   gions. Cropland in the Guangxi Province was found mainly
this is particularly the case for the East River basin (Zhang et          in the southeastern Jiangxi Province (Fig. 1b), and irrigated
al., 2015c), where three large water reservoirs were built that           cropland showed a significant increase (Zhang et al., 2015b).
controlled 11 700 km2 of drainage area.                                   The volume of water withdrawal for agricultural irrigation
   Significant increasing peak flood flow was observed                    during 2014 only reached 2.09 × 110 m3 . Meanwhile, the to-
mainly in the northeastern West River basin, the mainstream               tal water storage capacity of water reservoirs of the Guangxi
of the Pearl River basin, the northern North River basin,                 Province reached 6.74 × 10¹⁰ m3 , and more than half of the
the southeastern West River basin, and the southern North                 reservoirs were built in the southeastern West River basin
River. Significant decreasing peak flood flow was observed                (Fig. 1b). The western parts of the region III were also domi-
mainly in the southeastern West River, the southern North                 nated by croplands and large-scale reservoirs (Fig. 1b), agri-
River basin, and also parts of rivers along the coastal regions           cultural water consumption reached 2.24 × 10¹⁰ m3 , and the
of the lower Pearl River basin (Fig. 4a). Most stations show              total storage capacity of reservoirs reached 4.48 × 10¹⁰ m3
decreases in flood peaks both before and after the change                 during 2014. These human activities greatly decreased peak
point, especially in regions I and IV (Fig. 4b, c). However, the          flood flow volume in these regions. Therefore, increasing hu-
flood peaks in region III changed from a decreasing trend be-             man impacts on flood processes should attract considerable
fore the change point to an increasing trend after the change             concern for the management of water resources and mitiga-
point, suggesting shifted and/or modified physical mecha-                 tion of flood hazards (Zhang et al., 2015a).
nisms behind flood generation processes. Significant increas-                To determine trends of peak flood flow during specific time
ing precipitation extremes were found in the northeastern                 intervals, multi-scale trend analysis was done (Fig. 5). Trends

Hydrol. Earth Syst. Sci., 22, 2637–2653, 2018                                            www.hydrol-earth-syst-sci.net/22/2637/2018/
Q. Zhang et al.: More frequent flooding?                                                                                            2645

Figure 5. Percentage of stations with significant trends in peak flood flow.

were identified by changing the time interval by shifting the             had moderate changes without statistically detectable trends
beginning and ending time of the interval by a time step of               (Fig. 5). Significant decreasing peak flood flow can be ob-
5 years. The shortest time interval was 15 years to ensure                served at the stations in the East River basin or eastern parts
the validity of statistical analysis. The percentages of sta-             of the region III, and stations with significant decreasing peak
tions with significant trends were also analyzed (Fig. 5). The            flood flow during 1951–1980 and 1951–2014 accounted for
percentage of stations with significant trends in almost all              20–25 and 25–30 % of the total stations (Fig. 5). Stations
time intervals was relatively low, being about 15 % and even              with significant decreasing peak flood flow were fewer in
lower. However, stations with significant decreasing trends of            number after 1981 (Fig. 5), implying amplified flood regimes
peak flood flow during 1966–2005 accounted for 20–25 % of                 after 1981 in the eastern parts of the region III. Larger chang-
the total stations considered in the study (Fig. 5). Significant          ing variability of peak flood flow in the western parts of the
increasing peak flood flow was identified during 1981–2010                region III was observed. Stations with significant increasing
in the West River basin, and stations with significant increas-           peak flood flow during 1951–1975 accounted for 30–35 %,
ing peak flood flow during 1981–2010 accounted for 25–                    and fewer stations were characterized by significant increas-
35 % of the total stations. Stations with significant decreasing          ing peak flood flow after 1966. Peak flood flow after 1966
peak flood flow during 1966–1990 accounted for 25–30 % of                 turned out to be significantly decreasing (Fig. 5); stations
the total stations (Fig. 5). Peak flows in the North River basin

www.hydrol-earth-syst-sci.net/22/2637/2018/                                            Hydrol. Earth Syst. Sci., 22, 2637–2653, 2018
2646 Q. Zhang et al.: More frequent flooding?
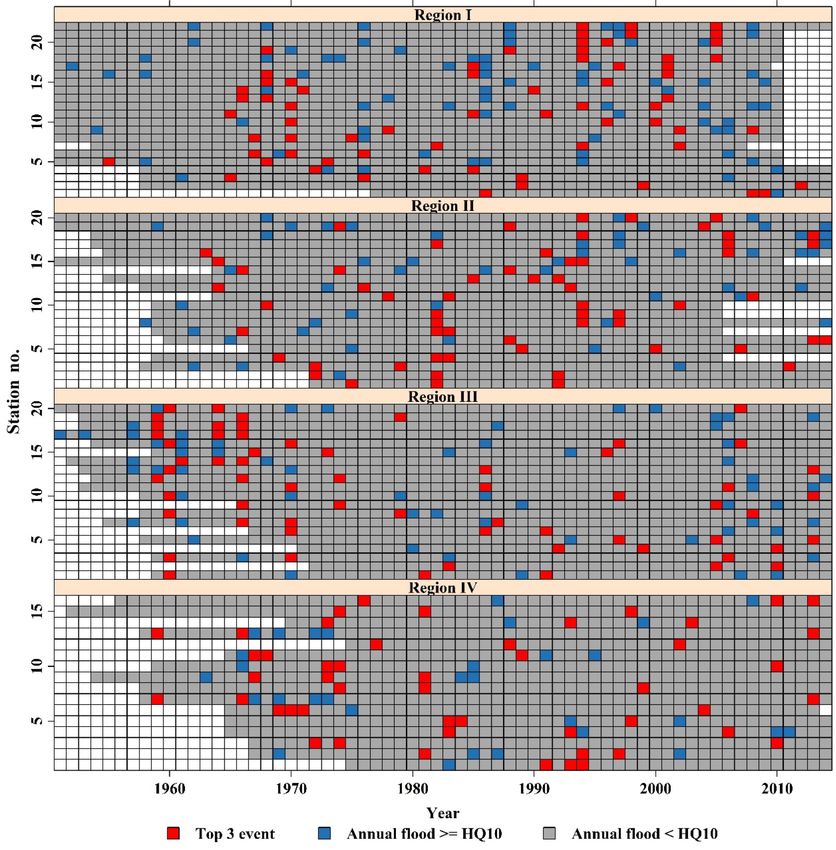
1970 and 1993–2002 (i.e., 90 of total 236) (Fig. 7). This is
particularly true of region I, where 38 out of 66 three largest
floods occurred at 22 stations during these two time intervals
(region I in Fig. 7). There was no temporal clustering ob-
served for the three largest floods that occurred in the North
River basin, but the spatial concentration was identified (re-
gion II in Fig. 7). Taking the great floods that occurred during
May 1982 across the entire North River basin as an example,
flood events > 10-year floods were observed at 9 out of 20
stations, and the largest three floods measured were observed
at 7 stations.
The survey of floods across the West and North River
basins indicated that higher probability was expected for the
simultaneous occurrence of floods in both North and West
River basins. For example, 1994 was a serious flooding year
and floods that occurred in the West River basin at 11 sta-
Figure 6. K–S test results of performance of GEV fitting of peak tions were larger than 10-year floods and 7 out of 11 stations
flood flow of the Pearl River basin.
were dominated by the largest three floods of the recorded
floods. Meanwhile, peak flood flows at 8 stations in the North
with significant decreasing peak flood flow accounted for 35– River basin were larger than 10-year flood and 6 out of 8 sta-
50 % of the total stations. tions were dominated by the three largest floods recorded.
The detailed information of flood events that occurred in The occurrence of large floods in the east parts of region III
the past 60 years can be used to verify the observed results in was evidently uneven in time and the measured largest three
Fig. 5. For example, we observed significant increasing peak floods occurred mainly during 1958–1969, and decreased
flood flow during 1981–2010 in the West River basin. The occurrence rates were observed for large floods after 2005.
recorded flood events also showed that the floods with high However, floods > 10-year floods were amplified after 2005.
magnitude intensively occurred in this period (i.e., 1981– The occurrence of large floods in the eastern parts of region
2010). During 20 years from 1981 to 2000 only, the West III was also subject to spatial clustering, and floods > 10-
River basin was hit by five floods with return periods larger year floods were usually observed at numerous stations at
than 20 years: (1) a flood during 18–23 June 1983, which the same time (region III in Fig. 7). Moreover, large floods
caused 147 deaths; (2) a flood during 21 August–September occurred in a clustering manner during 1966–1974 and oc-
1988, which caused 58 deaths; (3) a flood during 12–17 June currence rates of large floods after 1980 exhibited moderate
1994, which caused 224 deaths; (4) a flood during 16–19 July changes (region IV in Fig. 7).
1996, which caused 252 deaths; and (5) a flood during 16–26 The percentage of stations with flood regimes > 10-year
June 1998, which caused 81 deaths. floods to the total stations for each region was counted and
trends were evaluated by the 11-year moving average method
4.2 GEV-based flood frequency (Fig. 8), with the aim to determine the occurrences of large
floods in both space and time. It can be seen from Fig. 8a
The GEV model was used to fit peak flood flow series that the percentage of stations dominated by the occurrence
(i.e., annual maxima of period of 1951–2014) and the of large floods in West River basin had moderate changes
Kolmogorov–Smirnov (K–S) statistic D was used to evaluate with a slight increasing tendency (Fig. 8a), and particularly
the goodness of fit of GEV-based fitting performance (Fig. 6). after 1990. The percentage of stations dominated by the oc-
Figure 6 indicated that peak flood flow series at almost all currence of large floods had an increasing tendency, and this
stations, except two stations, was well modeled by the GEV increasing tendency was maintained during the entire time
at 0.05 significance level. The peak flood flow series at these interval considered in this study (Fig. 8b). The percentage of
two stations were also modeled by the GEV at the 0.1 sig- stations with the occurrence of large floods followed similar
nificance level. Therefore, the GEV was used for flood fre- changing patterns, i.e., increase and then decrease, implying
quency analysis across the Pearl River basin. Return periods enhanced risks of floods across the entire region (Fig. 8c ,d).
of floods at all hydrological stations were estimated and spa-
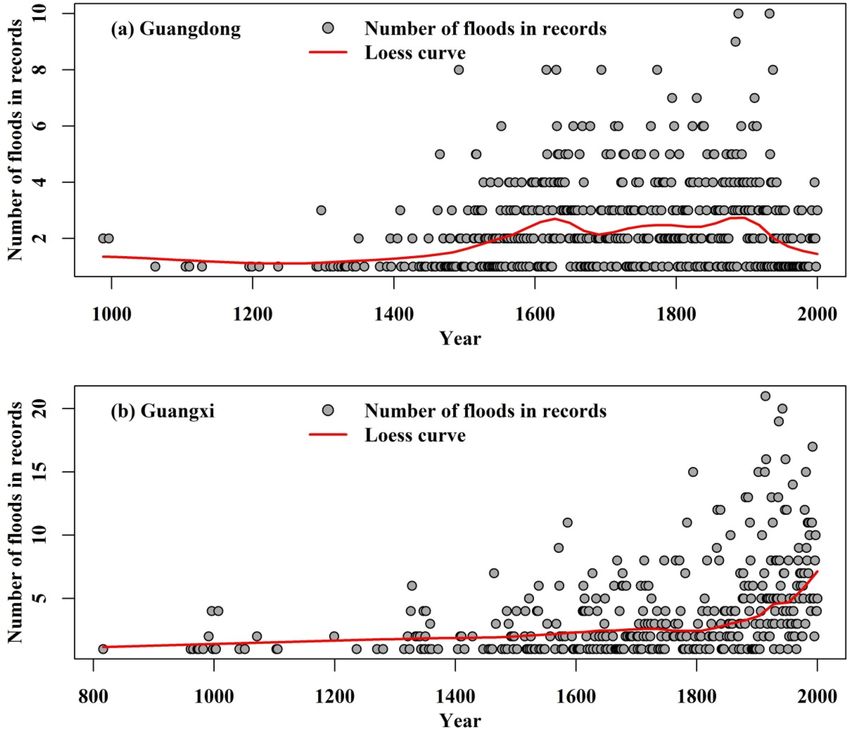
tial patterns were also characterized across the basin. It can 4.3 Flood risks based on historical flood records
be observed from Fig. 7 that floods of > 10-year flood magni-
tude occurred with high frequency. However, large floods oc- Based on historical flood records, the occurrence rates of
curred in a clustering manner at the annual timescale. About floods during the past 1000 years in the Guangdong and
40 % of the total number of the three largest flood events of Guangxi provinces were analyzed, and a local polynomial
all stations occurred during two time intervals, i.e., 1965– regression fitting technique was used to smooth the series. It
Hydrol. Earth Syst. Sci., 22, 2637–2653, 2018 www.hydrol-earth-syst-sci.net/22/2637/2018/Q. Zhang et al.: More frequent flooding? 2647 Figure 7. GEV-model-based estimated return periods of peak flood flow at hydrological stations considered in this study across the Pearl River basin. can be observed from Fig. 9a that the occurrences of floods based on the cross-validation method (Fig. 10b, d). More- had increasing trends before AD 1600 and reached the peak over, the time window of 30 years was used to have a closer value in about AD 1600 in Guangdong Province. The oc- look at the occurrence rates of hazardous floods (Fig. 10a, currences of floods had moderate variations during 1600– c). It can be seen from Fig. 10 that hazardous floods had an 1900 with moderate variability. These results will be fur- increasing tendency in general, except the time interval of ther evaluated using the kernel density estimation method 1400–1800, which was characterized by decreasing occur- in the next section. However, the occurrence of floods in rence rates. The past 200 years witnessed a sharp amplifica- Guangxi Province told another story when compared to those tion of floods in the Guangxi and Guangdong provinces. Sig- in Guangdong Province (Fig. 9b). A moderate increasing ten- nificant amplification of floods in the middle and lower Pearl dency of occurrence rates of floods was observed before 1800 River basin, and particularly in the past 200 years, should AD and the time interval after AD 1800 witnessed abruptly attract considerable concern. elevating occurrence rates of floods, and this is particularly Because the period of the past 60 years is a segment in the the case during the past 100 years, i.e., 1900–2000 (Fig. 9b). past 1000 years, analyzing the historical flood records is ben- Basin-scale hazardous flood events were identified based eficial for understanding the changes in flooding during the on the flood criterion defined by Mudelsee et al. (2003, past 60 years. For example, we observed increasing trends 2004). Meanwhile, flood risks of the past 1000 years were in floods in region I (most parts in Guangxi Province) dur- evaluated using the kernel estimation method (Fig. 10). The ing the past 60 years. Actually, basin-scale hazardous flood width of the time window was 56 years and 41 years for events have shown a sharp amplification in the past 200 years hazardous floods in the Guangdong and Guangxi provinces in Guangxi Province. As we all know, the influences of hu- www.hydrol-earth-syst-sci.net/22/2637/2018/ Hydrol. Earth Syst. Sci., 22, 2637–2653, 2018
2648                                                                                     Q. Zhang et al.: More frequent flooding?

Figure 8. Temporal changes of percentage of stations with flood events of magnitude of > 10-year flood magnitude.

man activities on flood generations are considerable smaller           the mean are complicated and unclear. The influence of hy-
in the past 200 years (except for the past 60 years) than in           draulic facilities is considerable. However, after the 1990s
the past 60 years and are even neglected. However, human-              a few hydraulic facilities were constructed and their influ-
induced climate change has enhanced continually in the past            ence can be ignored. Analysis of precipitation extremes in
200 years when the world experienced the industrial revolu-            the Pearl River basin indicated that the amount of rainfall
tion. Therefore, the increasing flooding in the past 60 years,         changed little but its variability increased over the time in-
beginning in the past 200 years in Guangxi Province, is very           terval divided by change points. Abrupt changes of precipi-
likely caused by climate change.                                       tation maxima shifted in different seasons. However, change
                                                                       points of precipitation maxima in summer occurred in 1990,
                                                                       1988, and 1991, which are in line with changes points of
5   Discussions                                                        flood peaks of the West River basin. It should be noted that
                                                                       floods mainly occur during the summer season. Therefore, it
Change points and trends analyses showed that only a few               can be tentatively stated that abrupt changes of flood peaks of
stations showed a change point or significant trend in the             the West River basin are mainly the result of abrupt behav-
flood peaks. In other words, the flood peaks are stationary            ior of precipitation maxima. However, due to spatiotempo-
in most of the stations considered in this study. Our pre-             ral patterns of precipitation maxima in the Pearl River basin
vious study has also detected the trends in flood peaks be-            and the production and confluence of flood streamflow, the
fore and after the change points, indicating that no signifi-          abrupt behavior of flood peaks usually does not match that
cant trends have been found (e.g., Zhang et al., 2014). Tak-           of precipitation maxima. Moreover, human interference also
ing change points in the West River as an example, change              introduces considerable uncertainty and causes obscure rela-
points of flood peaks in the mainstream of the West River oc-          tions between abrupt changes of flood peaks and precipita-
curred in approximately 1990 in spite of a few differences.            tion maxima. This analysis implies abrupt changes of flood
The flood peaks of the West River basin are heavily influ-             peaks due to various influencing factors.
enced by the confluences of tributaries on the upstream of                The Guangdong Province is dominated by high urbaniza-
the West River, and the factors causing abrupt changes in              tion, a highly developed socio-economy, and a high popula-

Hydrol. Earth Syst. Sci., 22, 2637–2653, 2018                                        www.hydrol-earth-syst-sci.net/22/2637/2018/
Q. Zhang et al.: More frequent flooding? 2649 Figure 9. Temporal changes in occurrence rates of flood hazards of the past 1000 years in Guangdong (a) and Guangxi provinces (b). tion density, and this is particularly the case for the PRD re- when compared to Guangdong Province, Guangxi Province gion (Fig. 1b, c, and d). Intense human activities, such as in- was dominated by lower urbanization and a lower popula- channel sand dredging, building of levees, and fast urbaniza- tion density (Fig. 1d); human activities did not exert signifi- tion, have greatly altered physical and geographical features cant impacts on floods. Increasing precipitation extremes and of underlying surfaces and hence modified the flooding pro- particularly increasing precipitation concentration (Zhang et cesses. The volume of sand dredged during the 1990s in the al., 2012, 2013) triggered discernable amplification of floods North and East River basins was, respectively, 3.38×10⁶ and in the Guangxi Province. Therefore, the past 200 years also 1.50×10⁶ m3 year−1 , causing deepening of the river channel witnessed the intensification of hazardous floods, which un- (e.g., Luo et al., 2007). Massive building of levees and sim- doubtedly posed a challenge for the mitigation of flood haz- plification of river channel systems have caused widespread ards in the lower Pearl River basin, particularly the PRD re- gathering of floodwaters and hence amplification of floods. gion. Although the fluvial disastrous floods may be ignored Taking the PRD as an example, during the past 60 years, in earlier time periods, the increases in the number of extreme more than 20 000 levees were combined with 400 levees, floods are significant and sharp. The lack of reported flood and the length of river channel was reduced from 10 000 to events in earlier years may be one of the reasons for these 5000 km. In addition, the construction of large-scale reser- sharp increases. However, we think it is not enough to explain voirs greatly reduced the occurrence rates and magnitude of this. Taking Guangxi Province as an example, the signifi- floods (Fig. 11a, b and c). However, fast and massive ur- cant increase is continual, especially for the past 200 years banization, such as the urbanization rate of the Guangdong (Fig. 9b). In the past 200 years, the lack of reported extreme Province reaching 67.67 %, caused fast production of floods floods did not make so much difference and the number of and hence enhanced flood risk (Fig. 10a). Increasing flood floods was still significantly increasing. When researchers magnitudes in the past 60 years (Fig. 3a) and increasing try to use historical flood records, the lack of reported flood occurrence rates of floods in the past 100 years (Fig. 9b) events is the problem that all users must face; it was not only caused increased losses of agricultural production and in- a problem for us but also for Mudelsee et al. (2003). In ad- creased numbers of casualties (Fig. 11c, d, and f). However, dition, the time span is larger, the problem is more difficult www.hydrol-earth-syst-sci.net/22/2637/2018/ Hydrol. Earth Syst. Sci., 22, 2637–2653, 2018
2650                                                                                    Q. Zhang et al.: More frequent flooding?

Figure 10. Temporal variations of frequency of flood hazards during the past 1000 years in Guangdong and Guangxi provinces.

to solve. Nevertheless, historical flood information can def-         major cause behind abrupt behavior of peak flood flow in the
initely provide valuable information to improve our under-            coastal regions.
standing of the changes in flood frequency.                              The northern parts and mainstream of the West River basin
                                                                      and northern North River basin were dominated by signif-
                                                                      icant increasing peak flood flow, implying amplification of
                                                                      floods. Peak flood flow in the East River basin however had
6   Conclusions
                                                                      significant decreasing trends which were attributed to the
                                                                      changes in precipitation extremes. It should be emphasized
Evaluation of flood risks was done in both space and time
                                                                      that precipitation extremes were increasing in the southeast-
across the Pearl River basin, China, based on peak flood flow
                                                                      ern West River basin and western parts of the coastal regions,
data from 78 hydrological stations during the period of 1951–
                                                                      and peak flood flow in these regions was decreasing. Ex-
2014 and 1000-year flood hazard records. The following con-
                                                                      panding agricultural irrigation and hydrological regulation of
clusions can be drawn from this study.
                                                                      reservoirs were the causes of decreasing peak flood flow in
   No statistically significant changes can be detected in the
                                                                      these regions. A closer look at the abrupt behavior of peak
peak flood flow series at most of the stations, but signifi-
                                                                      flood flow indicated that significant increasing peak flood
cant changes were observed at 16 out of 78 stations. Stations
                                                                      flow was identified during 1981–2010 at 25–35 % of the sta-
with significant peak flood flow changes were found in the
                                                                      tions in the West River basin; significant decreasing peak
mainstream of the West River basin, the East River basin,
                                                                      flood flow was observed during 1951–2014 at 25–30 % of the
and rivers in the western parts of the coastal regions, and the
                                                                      stations in the East River basin; and 30–35 % of the stations
change points were mainly during the 1990s. Abrupt changes
                                                                      in the western parts of the coastal region were dominated
of peak flood flow in the West River basin were attributed to
                                                                      by significant increasing peak flood flow during 1951–1975,
the abrupt behavior of precipitation extremes. The construc-
tion of large-scale hydraulic facilities and reservoirs was the

Hydrol. Earth Syst. Sci., 22, 2637–2653, 2018                                       www.hydrol-earth-syst-sci.net/22/2637/2018/
Q. Zhang et al.: More frequent flooding? 2651
Figure 11. Temporal changes of flood-hazard-induced crop areas and mortality in Guangdong and Guangxi provinces.
and 35–50 % of the stations were dominated by significant Data availability. The annual largest 1-day streamflow data (i.e.,
decreasing peak flood flow. annual maxima) were collected from the Water Conservancy Bu-
The largest three flood events were concentrated during reau of the Pearl River Water Conservancy Commission. These
two time intervals, i.e., 1965–1970 and 1993–2002. The per- datasets are not publicly accessible due to governmental restric-
centage of stations characterized by floods > 10-year floods tions, but can be obtained by writing to the corresponding authors.
Daily precipitation data were provided by the National Climate
increased after 1975. The East River basin was dominated
Center, China, which can be publicly accessed at http://data.cma.cn/
by the concentrated occurrence of the three largest flood (last access: 23 April 2018). The information from historical flood
events during 1958–1969, and the percentage of stations with records was collected from two books, i.e., Collections of meteoro-
floods > 10-year floods increased after 2000. Results indi- logical hazards in China: Guangdong volume and Guangxi volume
cated temporal and spatial clustering of flood hazards. This (Wen and Song, 2006; Wen and Yang, 2007). Both of these books
point should attract considerable concern for the mitigation have been published in public.
to flood hazards.
Historical flood records of the past 1000 years have told an
interesting story about flood risks in basin-scale hazardous Competing interests. The authors declare that they have no conflict
flood events from a long-term perspective. Flood risks of the of interest.
middle and lower Pearl River basin were enhanced, and this
is particularly the case in the past 100 years. Particularly, the
flood risks in the middle and lower Pearl River basin in terms Acknowledgements. This work is financially supported by the
of disastrous flood regimes increased, posing serious chal- Fund for the National Natural Science Foundation of China (grant
lenges for the mitigation of flood hazards in the PRD region. no. 41771536), the National Science Foundation for Distinguished
Young Scholars of China (grant no. 51425903), the Creative
www.hydrol-earth-syst-sci.net/22/2637/2018/ Hydrol. Earth Syst. Sci., 22, 2637–2653, 20182652 Q. Zhang et al.: More frequent flooding?
Research Groups of the National Natural Science Foundation of Blöschl, G.: Understanding flood regime changes in Europe: a
China (41621061), and the Fundamental Research Funds for the state-of-the-art assessment, Hydrol. Earth Syst. Sci., 18, 2735–
Central Universities, China University of Geosciences (Wuhan) 2772, https://doi.org/10.5194/hess-18-2735-2014, 2014.
(grant no. CUG180614). In addition, our cordial gratitude should Hirsch, M. R. and Archfield, S. A.: Not higher but more often, Nat.
be extended to the editor, Fuqiang Tian, two anonymous reviewers, Clim. Change, 5, 198–199, 2015.
and Natascha Töpfer as well for their professional and pertinent IPCC: Climate change: The physical science basis, United King-
comments and suggestions, which were greatly helpful for further dom and New York, NY, USA, Cambridge University Press,
quality improvement of this manuscript. Detailed information such 2007.
as data can be obtained by writing to the corresponding author at IPCC: Summary for policymakers, in: The Physical Science Basis,
zhangq68@mail.sysu.edu.cn. Contribution of Working Group I to the Fifth Assessment Re-
port of the Intergovernmental Panel on Climate Change, edited
Edited by: Fuqiang Tian by: Stocker, T. F., Qin, D., Plattner, G.-K., Tignor, M., Allen, S.
Reviewed by: two anonymous referees K., Boschung, J., Nauels, A., Xia, Y., Bex, V., Midgley, P. M.,
Cambridge University Press, 2013.
Jena, P. P., Chatterjee, C., Pradhan, G., and Mishra, A.: Are recent
frequent high floods in Mahanadi basin in eastern India due to
References increase in extreme rainfalls?, J. Hydrol., 517, 847–862, 2014.
Kjeldsen, T. R., Macdonald, N., Lang, M., Mediero, L., Albu-
Alan, D. Z., Justin, S., Edwin, P. M., Bart, N., Eric, F. W., and Den- querque, T., Bogdanowicz, E., Brazdil, R., Castellarin, A., David,
nisa, P. L.: Detection of intensification in global- and continental- V., Fleig, A., Gul, G. O., Kriauciuniene, J., Kohnova, S., Merz,
scale hydrological cycles: Temporal scale of evaluation, J. Cli- B., Nicholson, O., Roald, L. A., Salinas, J. L., Sarauskiene,
mate, 16, 535–547, 2003. D., Šraj, M., Strupczewski, W., Szolgay, J., Toumazis, A., Van-
Beniston, M. and Stephenson, D. B.: Extreme climatic events neuville, W., Veijalainen, N., and Wilson, D.: Documentary evi-
and their evolution under changing climatic conditions, Global dence of past floods in Europe and their utility in flood frequency
Planet. Change, 44, 1–9, 2004. estimation, J. Hydrol., 517, 963–973, 2014.
Beniston, M., Stephenson, D. B., Christensen, O. B., Ferro, C. A. Li, J., Chen,Y. D., Zhang, L., Zhang, Q., and Chiew, F. H. S.: Future
T., Frei, C., Goyette, S., Halsnaes, K., Holt, T., Jylhä, K., Koffi, changes in floods and water availability across China: Linkage
B., Palutikof, J., Schöll, R., Semmler, T., and Woth, K.: Future with changing climate and uncertainties, J. Hydrometeorol., 17,
extreme events in European climate: an exploration of regional 1295–1314, 2016.
climate model projections, Climatic Change, 81, 71–95, 2007. Luo, X. L., Zeng, E. Y., Ji, R. Y., and Wang, C. P.: Effects of in-
Bouwer, L. and Vellinga, P.: Changing climate and increasing costs- channel sand excavation on the hydrology of the Pearl River
implications for liability and insurance climatic change: impli- Delta, China, J. Hydrol., 343, 230–239, 2007.
cations for the hydrological cycle and for water management, Mudelsee, M., Börngen, M., Tetzlaff, G., and Grünewald, U.: No
edited by: Beniston, M., Springer, Netherlands, 429–444, 2003. upward trends in the occurrence of extreme floods in central Eu-
Burn, D. H. and Whitfield, P. H.: Changes in floods and flood rope, Nature, 425, 166–169, 2003.
regimes in Canada, Can. Water Resour. J., 1784, 1–12, 2015. Mudelsee, M., Börngen, M., Tetzlaff, G., and Grünewald, U.: Ex-
Cannon, A. J.: A flexible nonlinear modelling framework for non- treme floods in central Europe over the past 500 years: Role
stationary generalized extreme value analysis in hydroclimatol- of cyclone pathway “Zugstrasse Vb”, J. Geophys. Res., 109,
ogy, Hydrol. Process., 24, 673–685, 2010. D23101, https://doi.org/10.1029/2004JD005034, 2004.
Chen, Y. D., Zhang, Q., Xu, C.-Y., and Yang, T.: Change-point al- Nicholls, N.: Long-term climate monitoring and extreme events,
terations of extreme water levels and underlying causes in Pearl Climatic Change, 31, 231–245, 1995.
River Delta, China, River Res. Appl., 25, 1153–1168, 2009. Ohmura, A. and Wild, M.: Is the hydrological cycle accelerating?,
Das, T., Maurer, E. P., Pierce, D. W., Dettinger, M. D., and Cayan, Science, 298, 1345–1346, 2002.
D. R.: Increases in flood magnitudes in California under warming Pettitt, A. N.: A non-parametric approach to the change-point prob-
climates, J. Hydrol., 501, 101–110, 2013. lem, Appl. Stat., 28, 126–135, 1979.
Daufresne, M., Lengfellner, K., and Sommer, U.: Global warming Pino, D., Ruiz-Bellet, J. L., Balasch, J. C., Romero-León, L.,
benefits the small in aquatic ecosystems, P. Natl. Acad. Sci. USA, Tuset,J., Barriendos, M., Mazon, J., and Castelltort, X.: Meteo-
106, 12788–12793, 2009. rological and hydrological analysis of major floods in NE Iberian
Hamed, H. K. and Rao, R. A.: A modified Mann-Kendall trend test Peninsula, J. Hydrol., 541, 63–89, 2016.
for autocorrelated data, J. Hydrol., 204, 182–196, 1998. PRWRC (Pearl River Water Resources Committee): The Zhu-
Gu, X., Zhang, Q., Singh, V. P., and Liu, L.: Nonstationarity in the jiang Archive, vol 1, Guangdong Science and Technology Press,
occurrence rate of floods in the Tarim River basin, China, and Guangzhou, 1991 (in Chinese).
related impacts of climate indices, Global Planet. Change, 142, Villarini, G., Serinaldi, F., Smith, A. J., and Krajewski, F. W.: On
1–13, 2016. the stationarity of annual flood peaks in the continental United
Hall, J., Arheimer, B., Borga, M., Brázdil, R., Claps, P., Kiss, A., States during the 20th century, Water Resour. Res., 45, W08417,
Kjeldsen, T. R., Kriauciuniene, J., Kundzewicz, Z. W., Lang, https://doi.org/10.1029/2008WR007645, 2009.
M., Llasat, M. C., Macdonald, N., McIntyre, N., Mediero, L., Vormoor, K., Lawrence, D., Schlichting, L., Wilson, D., and Wong,
Merz, B., Merz, R., Molnar, P., Montanari, A., Neuhold, C., W. K.: Evidence for changes in the magnitude and frequency of
Parajka, J., Perdigão, R. A. P., Plavcová, L., Rogger, M., Sali-
nas, J. L., Sauquet, E., Schär, C., Szolgay, J., Viglione, A., and
Hydrol. Earth Syst. Sci., 22, 2637–2653, 2018 www.hydrol-earth-syst-sci.net/22/2637/2018/You can also read