Riviera Investor Presentation August 23, 2018

Page created by Paul Goodwin
 
CONTINUE READING
Riviera Investor Presentation August 23, 2018
Riviera Investor Presentation
August 23, 2018
Riviera Investor Presentation August 23, 2018
Forward-Looking Statements and Risk Factors
Statements made in this presentation that are not historical facts are “forward-looking statements.”
These statements are based on certain assumptions and expectations made by Riviera
Resources, Inc. (“Riviera” or the “Company”) which reflect management’s experience, estimates
and perception of historical trends, current conditions, and anticipated future developments. Such
statements are subject to a number of assumptions, risks and uncertainties, many of which are
beyond the control of the Company, which may cause actual results to differ materially from those
implied or anticipated in the forward-looking statements. These include risks relating to financial
and operational performance and results of the Company, continued low or further declining
commodity prices and demand for oil, natural gas and natural gas liquids, ability to hedge future
production, ability to replace reserves and efficiently develop current reserves, the capacity and
utilization of midstream facilities and the regulatory environment. These and other important
factors could cause actual results to differ materially from those anticipated or implied in the
forward-looking statements. Please read “Risk Factors” in the Company’s Registration Statement
on Form S-1 and other public filings. We undertake no obligation to publicly update any forward-
looking statements, whether as a result of new information or future events.

Reserve Estimates
The Securities and Exchange Commission (the “SEC”) permits oil and natural gas companies, in
their filings with the SEC, to disclose only proved, probable and possible reserves that meet the
SEC’s definitions for such terms. The Company may use terms in this presentation that the SEC’s
guidelines strictly prohibit in SEC filings, such as “estimated ultimate recovery” or “EUR,”
“resources,” “net resources,” “total resource potential” and similar terms to estimate oil and natural
gas that may ultimately be recovered. These estimates are by their nature more speculative than
estimates of proved, probable and possible reserves as used in SEC filings and, accordingly, are
subject to substantially greater uncertainty of being actually realized. These estimates have not
been fully risked by management. Actual quantities that may be ultimately recovered will likely
differ substantially from these estimates. Factors affecting ultimate recovery include the scope of
the Company’s actual drilling program, which will be directly affected by the availability of capital,
drilling and production costs, commodity prices, availability of drilling services and equipment,
lease expirations, transportation constraints, regulatory approvals, field spacing rules, actual
drilling results and recoveries of oil and natural gas in place, and other factors. These estimates
may change significantly as the development of properties provides additional data.
Riviera Investor Presentation August 23, 2018
Non-GAAP Measures

Adjusted EBITDAX
The non-GAAP financial measure of adjusted EBITDAX, as defined by the Company, may not be
comparable to similarly titled measures used by other companies. Therefore, this non-GAAP
measure should be considered in conjunction with net income (loss) and other performance
measures prepared in accordance with GAAP. Adjusted EBITDAX should not be considered in
isolation or as a substitute for GAAP. Adjusted EBITDAX is a measure used by Company
management to evaluate the Company's operational performance and for comparisons to the
Company's industry peers. Management also believes this information may be useful to investors
and analysts to gain a better understanding of the Company's financial results.

EBITDA
The non-GAAP financial measure of EBITDA, as defined by the Company, may not be comparable
to similarly titled measures used by other companies. Therefore, this non-GAAP measure should
be considered in conjunction with net income (loss) and other performance measures prepared in
accordance with GAAP. EBITDA should not be considered in isolation or as a substitute for GAAP.
EBITDA is a measure used by Company management to evaluate the Company's operational
performance and for comparisons to the Company's industry peers. Management also believes
this information may be useful to investors and analysts to gain a better understanding of the
Company's financial results.

PV-10
PV-10 represents the present value, discounted at 10% per year, of estimated future net cash
flows. The Company’s calculation of PV-10 herein differs from the standardized measure of
discounted future net cash flows determined in accordance with the rules and regulations of the
SEC in that it is calculated before income taxes and including the impact of helium, rather than
after income taxes and not including the impact of helium, using the average price during the 12-
month period, determined as an unweighted average of the first-day-of-the-month price for each
month. The Company’s calculation of PV-10 should not be considered as an alternative to the
standardized measure of discounted future net cash flows determined in accordance with the rules
and regulations of the SEC.
Riviera Investor Presentation August 23, 2018
Table of Contents                                       Slides

Riviera Resources, Inc. Overview
       Company Overview                                  5-8
       Upstream Asset Overview                            9
       Proved Reserves                                   10
       Upstream Benchmarking                            11-14
       Blue Mountain Midstream Overview                 15-16
       Balance Sheet and Buybacks                       17-18
Riviera Upstream Overview                                20
       Upstream Growth Assets
               NW STACK                                 22-25
               Arkoma                                   26-28
               East Texas                               29-32
               North Louisiana                          33-35
       Upstream Long Life Low Decline Assets
               Hugoton / Jayhawk Plant                  37-38
               Michigan / Illinois                       39
               Uinta Basin (Drunkards Wash)              40
Blue Mountain Midstream LLC (wholly owned subsidiary)
       Business Overview                                42-45
       Operational Overview                             46-47
       Commercial Overview                              48-49
       Financial Overview                               50-51
Guidance Update                                         53-56
Commodity Hedge Portfolio                               57-58
Capital Structure                                        59
Leadership                                              60-61
Riviera Investor Presentation August 23, 2018
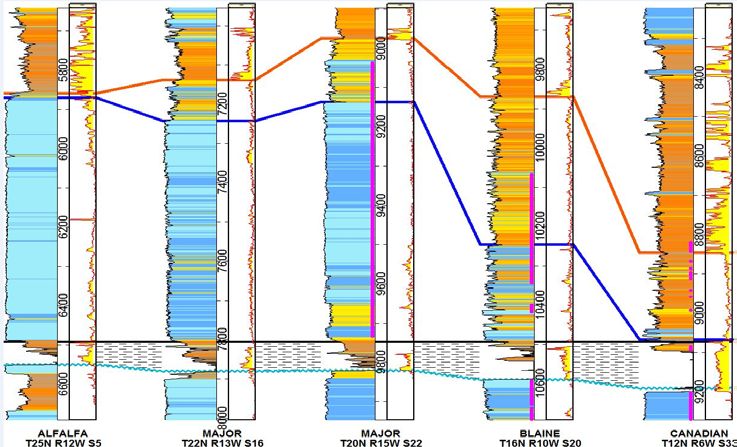
Riviera Resources – Recent Developments

   Riviera Resources (Riviera or RVRA) recently spun-out from Linn Energy, Inc (LNGG) to unlock the sum of the
    parts Net Asset Value
         Riviera is a newly formed independent company focused on efficiently operating its mature low-decline
          production, developing its growth-oriented assets (including Blue Mountain Midstream LLC), and returning
          capital to shareholders
         Based on recent trading, we believe RVRA is trading at a discount to its sum of the parts Net Asset Value

   The Riviera Board approved a $100 million share buyback program

   Due to encouraging offset activity, Riviera Upstream is initiating a NW STACK drilling program starting Q4 2018
         Blue Mountain is working with Riviera Upstream to provide a midstream solution in the NW STACK

   Riviera Upstream is evaluating potential development of its other growth assets, such as Arkoma, East Texas
    and North Louisiana

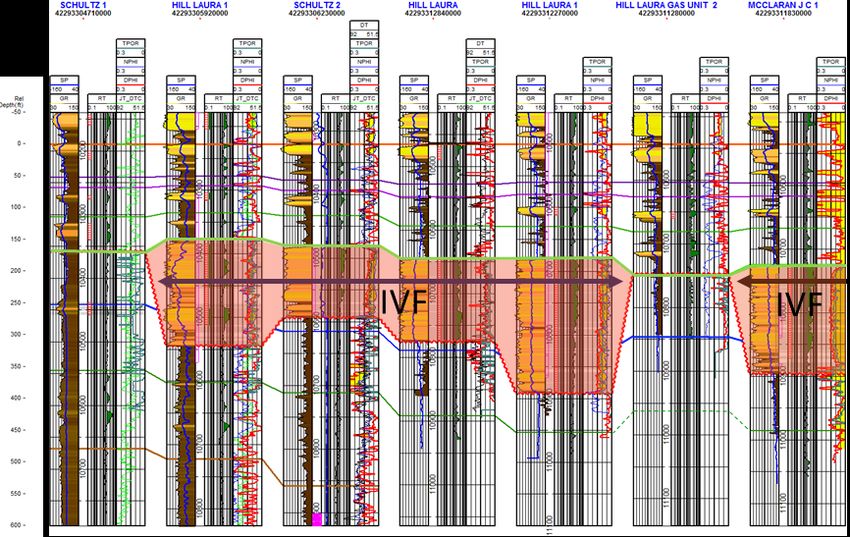
   Blue Mountain recently brought a state of the art cryogenic processing plant on-line and is currently processing
    ~150 mmcf/d

   Due to rapidly ramping throughput, Blue Mountain has initiated the engineering and design of a second plant
    targeting total throughput of 500 mmcf/d in 2H 2019 to meet projected demand

   Blue Mountain has established a stand-alone $200 million credit facility with current capacity of $70 million

   LNGG share buyback program has reduced outstanding share count to 76.2 million shares as of the Spin
    Transaction
                                                                                                                       5
Riviera Investor Presentation August 23, 2018
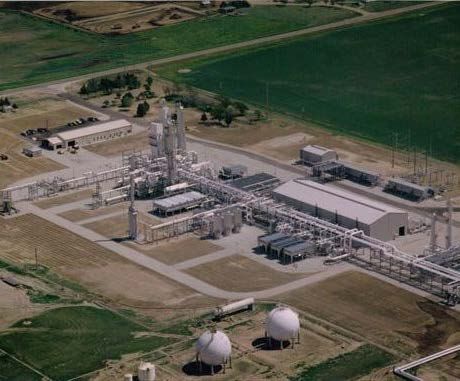
Riviera Resources - Overview

          Riviera Upstream has 1.6 Tcfe of long life proved developed reserves with a Mid-Year adjusted PV-10 value of $963 million(1)
                    312 mmcfe/d second quarter 2018 average production
                    11% base production decline(2) (mature asset base declines: Hugoton 6%, Michigan/IL 4%; Uinta 11%)
                    15 year proved developed reserves to production ratio

          Additionally, Riviera Upstream has a large undeveloped acreage position in several active basins
                    NW STACK (~60,000 net acres in Core Focus Area), Arkoma (~37,000 net acres), East Texas (~110,000 net acres), North
                     Louisiana (~100,000 net acres)
                    More than 900 potential net locations identified with expected internal rates of return (IRRs) >40%(3)
                    NW STACK operated rig starting in Q4 2018
                    Evaluating deployment of additional rigs in other growth basins

          Blue Mountain Midstream is a growth-oriented midstream business in the heart of the Merge/SCOOP/STACK play in central OK
                    More than 80,000 acres dedicated to the system
                    Anchor producer is well-capitalized and currently running 8 rigs
                    State of the art cryogenic processing plant with current capacity of 150 mmcf/d growing up to 250 mmcf/d in Q4 2018
                    Initiated engineering and design of a second plant with additional capacity up to 250 mmcf/d servicing the rapidly growing
                     Merge play
                    Targeting additional 3rd party gas gathering, crude gathering, terminals and water handling

          Strong balance sheet with no debt, up to $495(4) million of available borrowing capacity, and approximately $100 million in
           projected cash as of 9/30/2018
(1)   YE 2017 proved reserves as of 8/1/18 with updated pricing of $2.85 per MMBtu for natural gas and $65.00 per bbl for oil, and adjusted for basis pricing, including helium revenue, $7.5MM per year of
      third party operating margin at Jayhawk Plant (PV-10 of $75MM) and excluding income taxes. See “Non-GAAP Measures - PV-10” for more information.
(2)   Base decline includes both mature and growth assets
(3)   Assumed Pricing: $2.85 per MMBtu for natural gas and $65.00 per bbl for oil                                                                                                                             6
(4)   Includes Riviera Upstream $425 million credit facility, and $70 million of Blue Mountain Midstream LLC $200 million credit facility
Riviera Investor Presentation August 23, 2018
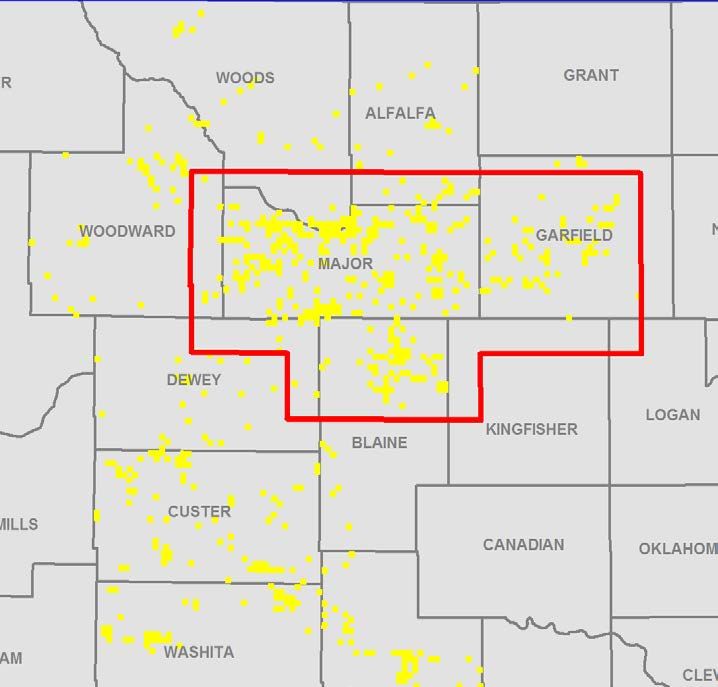
Riviera Resources – Sum of the Parts

                                                            1                                                                        2                                                                          3
                                                                                                                                                                  Balance
                                                                                                                                                                   Sheet
                                                                             Current                 Additional                                           Cash                Upstream                   BMM
      Mature / Cash-                                                                                                            Future
                                          Growth Assets                      Acreage                 Business                                                                  Credit                   Credit
      Flowing Assets                                                                                                            Basins
                                                                            Dedication                 Lines                                                                   Facility                 Facility

             Hugoton                         NW STACK                                                                                                                                                   $200 MM
             Michigan                                                       Chisholm Trail
                                                Arkoma                         System                   Crude                                                                                         credit facility
          Drunkards Wash                      East Texas                                              Gathering /                                       $100 MM                                       with $70MM
                                                                                                      Terminals,             NW STACK /                                         $425 MM                 currently
                                            North Louisiana                     Future                                                               projected as of
          Jayhawk Plant                                                                                 Water                  Other                                          credit facility           available
                                                                              Expansions                                                                 9/30/18

                                                                             •    80,000 Acre Dedication
                                                                             •    Current throughput of ~150 mmcf/d
      •    Proved Developed PV-10: $963            Million(1)
                                                                             •    Initiated engineering and design of 2nd                             •    No Debt
      •    More than 900 Net Development Locations >
                                                                                  cryogenic plant targeting on-line in 2H 2019                        •    $100 MM of cash projected as of 9/30/18
           40% IRR(2)
                                                                             •    Would increase total processing capacity up
                                                                                  to 500 mmcf/d
(1)   YE 2017 proved reserves as of 8/1/18 with updated pricing of $2.85 per MMBtu for natural gas and $65.00 per bbl for oil, and adjusted for basis pricing, including helium revenue, $7.5MM per year of third       7
      party operating margin at Jayhawk Plant (PV-10 of $75MM) and excluding income taxes. See “Non-GAAP Measures - PV-10” for more information.
(2)   Assumed Pricing: $2.85 per MMBtu for natural gas and $65.00 per bbl for oil
Riviera Investor Presentation August 23, 2018
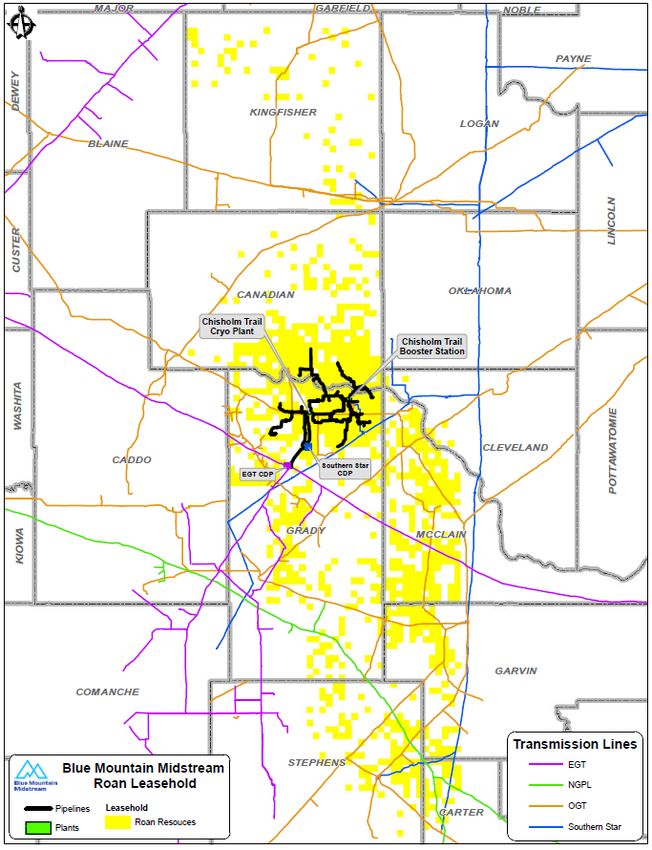
Riviera Resources – Value Proposition

   Income Generating             Growth Oriented Assets
    Assets Requiring               Funded by Strong
     Minimal Capital                 Balance Sheet

                                     Northwest STACK
        Hugoton                           Arkoma
       Michigan/IL                        East TX
          Uinta                          North LA
                                  Blue Mountain Midstream

       Free Cash Flow
                                             NAV
      Returned Through
                                           Growth
     Share Repurchases,
                                           Realized
      Dividends, and/or
           Tenders

                     Shareholder Returns
                                                            8
Riviera Investor Presentation August 23, 2018
1            Riviera Upstream – Asset Detail

                                                                                                                              Proved Developed(2)                                          Proved Developed
                                                                                           Net Production(1)                                                           R/P(3)
                                                                                                                                   Reserves                                                     PV-10(2)
       Upstream Assets                                         Net Acres
                                                                                                (MMcfe/d)                                                           (in Years)
                                                                                                                                         (Bcfe)                                                ($ in millions)

       Hugoton                                                ~1,100,000                             136                                  842                            19                           $529

       East Texas                                              ~110,000                               51                                  242                            13                           $137

       North Louisiana                                         ~100,000                               27                                   61                             7                            $78

       Michigan / Illinois                                     ~200,000                               27                                  233                            23                            $85

       Arkoma                                                   ~37,000                               25                                  111                            12                            $61

                                                                                                                                           64
       NW STACK / other Oklahoma                               ~110,000                               24                                                                  7                            $51

       Uinta                                                    ~50,000                               22                                   40                             6                            $21

       Total                                                  ~1,707,000                             312                                 1,593                           15                           $963

(1)   Average daily second quarter 2018 actual production
(2)   YE 2017 proved reserves as of 8/1/18 with updated pricing of $2.85 per MMBtu for natural gas and $65.00 per bbl for oil, and adjusted for basis pricing, including helium revenue, $7.5MM per year of third
      party operating margin at Jayhawk Plant (PV-10 of $75MM) and excluding income taxes. See “Non-GAAP Measures - PV-10” for more information.
(3)   R/P is based on proved developed reserves divided by 2018 forecasted production
                                                                                                                                                                                                                    9
Riviera Investor Presentation August 23, 2018
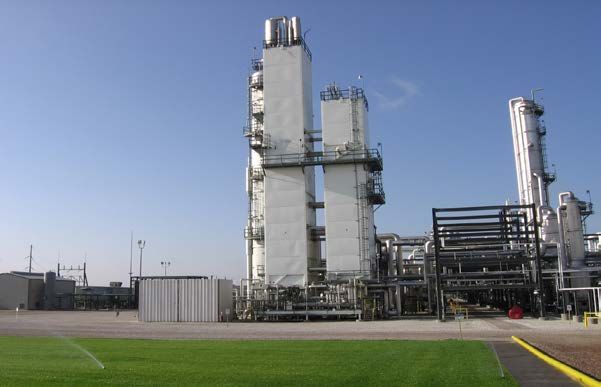
1            Riviera Upstream - Proved Reserves(1)

                                                                                                                                                            Total Proved
          76% Natural Gas                                        ~1.6 Tcfe of Proved Reserves                                                          PV-10 of ~$1.021 Billion
                                                                                         6%
                                                                                                    4%                                                              4% 6%
           22%

       2%

                                                                                                                          90%                                                                               90%
                                            76%
       Natural Gas                     Oil           NGL                            PDP            PDNP                PUD                                    PDP             PDNP               PUD

      Proved Reserves
      as of August 1, 2018                                             Natural Gas                       Oil                      NGL                        Total                         PV-10
                                                                           Bcf                          MMBbl                    MMBbl                       Bcfe                     ($ in Millions)

      PDP                                                                    1,115                           4                       58                      1,491                           $918

      PDNP                                                                     96                            1                        1                       102                             $45

      Total Proved Developed                                                 1,211                           5                       59                      1,593                           $963

      PUD                                                                      54                            0                        1                        60                             $58

      Total Proved                                                           1,265                           5                       60                      1,653                         $1,021

(1)   YE 2017 proved reserves as of 8/1/18 with updated pricing of $2.85 per MMBtu for natural gas and $65.00 per bbl for oil, and adjusted for basis pricing, including helium revenue, $7.5MM per year of third
      party operating margin at Jayhawk Plant (PV-10 of $75MM) and excluding income taxes. See “Non-GAAP Measures - PV-10” for more information.                                                                    10
1
                      Riviera Upstream - Benchmarking
                      Reserve Life

                                             Proved Developed Reserves / Production
                                                                                (in years)
             15

                              11
                                              10               10
                                                                                 9
                                                                                                  8
                                                                                                                   7
                                                                                                                                   6                6

                                                                                                                                                                4

            RVRA         Company D        Company I       Company B        Company A        Company C        Company H        Company E          Company F   Company G

               Riviera Upstream has the highest ratio of PD reserves to production compared to peers;
                To maintain PD reserves, Riviera only needs to replace 7% of its PD reserves annually
Notes:
• Sourced from company 10-K’s and guidance; Proved Developed reserve volumes are from disclosed 2017 SEC reserves; Production is 2018 guidance
• Peers include CHK, CNX, GPOR, LGCY, NFX, RRC, SD, SWN, UNT
                                                                                                                                                                         11
1
                     Riviera Upstream - Benchmarking
                     PDP Reserve Value vs. Adjusted EBITDAX

       7.0x
                                                        PDP Reserve Value / Adjusted EBITDAX
                                                                                            (multiple)

                         4.8x

                                          3.6x              3.5x              3.5x
                                                                                               3.1x

                                                                                                                 1.9x

                                                                                                                                   N/A              N/A               N/A
       RVRA           Company I        Company C        Company A         Company B         Company D        Company G         Company E        Company F         Company H

                           Due to Riviera Upstream’s long life reserves, the company should trade
                                   at a higher multiple of adjusted EBITDAX versus peers
Notes:
• Sourced from company 10-K’s and guidance; PDP reserve values are from 2017 10-K filings of SEC reserves. RVRA YE 2017 proved reserves as of 8/1/18 with updated pricing of $2.85 per
   MMBtu for natural gas and $65.00 per bbl for oil, and adjusted for basis pricing, including helium revenue, $7.5MM per year of third party operating margin at Jayhawk Plant (PV-10 of
   $75MM) and excluding income taxes. See “Non-GAAP Measures - PV-10” for more information; adjusted EBITDAX is 2018 company provided guidance                                            12
• Peers include CHK, CNX, GPOR, LGCY, NFX, RRC, SD, SWN, UNT
1               Riviera Upstream - Benchmarking
                      Enterprise Value Vs. PDP Reserve Value

                                                      Enterprise Value / PDP Reserve Value
                                                                                      (multiple)
               2.3x
                                 2.1x
                                                                                                                                        Avg. = 1.7x
                                                   1.7x
                                                                     1.5x
                                                                                       1.4x

                                                                                                         1.0x

                                                                                                                            N/A          N/A        N/A
            Company G         Company A         Company I         Company B         Company C         Company D         Company E      Company F   Company H

             If Riviera Upstream’s enterprise value to PDP reserve value was at the midpoint of peers
                     (1.7x), it would imply a $1.6 billion valuation for the upstream business only
Notes:
• Enterprise Value sourced from Bloomberg and Yahoo Finance as of 8/16/2018; PDP reserve values are from disclosed 2017 SEC reserves
• Peers include CHK, CNX, GPOR, LGCY, NFX, RRC, SD, SWN, UNT                                                                                                   13
1
                    Riviera Upstream - Benchmarking
                    G&A Vs. Production

                                                                       G&A / Production
                                                                                 ($ / mcfe)
                                                                                                                                                          $0.59

                                                                                                                                              $0.52

                                                                                                                                    $0.38
                                                                                                                $0.34

                                                                                               $0.27

                                             $0.21            $0.21            $0.22
                            $0.18

            $0.13

        Company G        Company A        Company C        Company I       Company F           RVRA          Company B       Company H      Company E   Company D

                    On a production basis, Riviera Upstream’s G&A is expected to be in-line with peers
Notes:
• Sourced from company 10-K’s and guidance; Riviera G&A is pro-forma for 2019 ($30MM annually); peers’ G&A based on 2018 guidance
• Peers include CHK, CNX, GPOR, LGCY, NFX, RRC, SD, SWN, UNT                                                                                                        14
2           Blue Mountain Midstream –
                Overview
•   Blue Mountain Midstream, LLC (“Blue Mountain”), a wholly owned
    subsidiary of Riviera, is a growth-oriented midstream business located
    in the heart of the Merge/SCOOP/STACK play in central Oklahoma

•   Blue Mountain’s first cryogenic processing plant was brought on-line
    in June 2018
     –    The plant has current throughput of ~150 mmcf/d
     –    At 250 mmcf/d throughput, plant should generate between
          $100-$125 million of run-rate EBITDA
•   Blue Mountain recently initiated the design and engineering of a
    second cryogenic plant to service its rapidly growing throughput
     –    Targeting 2H 2019 start-up
     –    Total processing capacity will increase up to 500 mmcf/d
•   Proven management team focused on expanding midstream footprint
    by leveraging:
     –    Existing infrastructure base
     –    Acreage dedications
     –    Strong commercial relationships
     –    Well-funded and active customer base

•   Future growth opportunities include:
     –    Recently approved capacity expansions in Merge play
     –    Additional business lines (e.g., crude gathering / storage, water
          and purity NGLs)
     –    Extend reach across Merge/SCOOP/STACK/NW STACK plays

•   Independent capital structure to self-fund future growth opportunities
    either as a part of RVRA or as a stand-alone business
                                                                              15
Blue Mountain Midstream –
                           Key Statistics
                      Estimated Operating Margin(1) (in millions)                                                        Capital Forecast(2) (in millions)

           200                                                                                         200

                                                                                                  $22
           175
                                                                                                                                                            $32
                                                                                                       170
           150
                                                                           140
                                                                                                  $18
           125
                                                                           125
                                                                                                                                                            $75
  MMcf/d

           100

                                                                                                                                         $53
            75
                                                     62
                              61
            50
                                                                           $6
                                                                                                                                                            $53
            25                                                                                                                           $43
                            $1                                             $3                                            $33
                                                    $0
             0
                      Q1 2018 A               Q2 2018 E               Q3 2018 E               Q4 2018 E                 2016A           2017A              2018E

                                 Estimated Throughput MMcf / Day - Upper Range                                                  Field   Cryo I   Cryo II
                                 Estimated Throughput MMcf / Day - Lower Range

                                 Plant Operating Margin Estimate - Lower Range

                                 Plant Operating Margin Estimate - Upper Range

(1)   Operating margin is all Blue Mountain Midstream revenue less direct operating expenses and does not include G&A
(2)   Field includes refrigeration facilities 1 and 2                                                                                                              16
3             Riviera Resources – Pro-Forma Cash 9/30/18
                    ($ in millions)

                                       $17                  ($13)
               $301                   $301                  $304
                                                                                   ($50)

                                                                                   $254
                                                                                                          ($40)

                                                                                                          $214                                                       Approximately
                                                                                                                                                                      76.2 million
                                                                                                                                                                        shares
                                                                                                                                ($115)                                outstanding

                                                                                                                                                                           $85-$100

                                                                                                                                 $100                  ($15)                   $15
                                                                                                                                                        $85                    $85

            LNGG Cash           LNGG / RVRA            LNGG / RVRA            LNGG / RVRA                LNGG               LNGG Share                Working           RVRA Projected
              Balance             Adjusted              Severance                Capital                Cash (1)            Repurchase                Capital /             Cash
             6/30/2018         EBITDAX before                                   Spending                                      through                  Other               Balance
                                 Severance                                                                                 Spin-Off 8/7/18                                 9/30/18 (1)

(1)   Prior to the spin-off of Riviera from LNGG (the “Spin-off”), $40 million of cash was remaining at LNGG available for use by LNGG to fund certain obligations of the Company arising
      after the Spin-Off and prior to any consolidation with Roan Resources LLC (“Roan Resources”). LNGG will transfer any such remaining cash to Riviera (assumed to be $15MM)
      prior to any consolidation of LNGG and Roan Resources.
                                                                                                                                                                                            17
3            Riviera Resources – Share Buybacks

                                                         Through August 7, 2018
                                         LNGG returned approximately $800 million to shareholders
                                                                                         ($ in millions)
                                                                                                                               2018 Open Market
                                                                                                                              Share Repurchases
                                2017 Open Market                                                      Retirement of Profits and Employee Liquidity
                               Share Repurchases                         Tender Offer                  Interest Shares (1)        Program(2)                                              Total

                                                                                                                                                                                          $799

                                                                                                                                                      $256

                                                                                                                  $20
                                                                                                                  $523                                $543

                                                                              $325

                                          $198                                $198

      Number of
                                         5,690,192                               6,770,833                         470,630                           6,371,234                         19,303,389
       Shares
Average Price
                                           $ 34.85                                 $ 48.00                          $ 42.34                            $40.18                             $ 41.40
  Per Share

(1)    Class A-2 units of LINN Energy HoldCo LLC held by management retired as a result of common stock repurchases, inclusive of tender offer process
(2)    Employee liquidity program repurchases represents 1,331,082 vesting restricted stock units of LNGG (“RSUs”) settled in cash prior to shares being issued, 2,598,663 shares previously issued as a
       result of vested RSUs and A-2 units converted to Class A common stock of LNGG and subsequently repurchased 1,837,469 shares of Class A common stock of LNGG retired in open market
       purchases, and 604,520 RSUs settled in cash for statutory tax withholdings prior to shares being issued                                                                                             18
Riviera Upstream
Asset Overview
Focus on Existing Basins
                    Riviera Upstream Asset Map

                              Growth
                             Mid-Continent                              312 MMcfe/d                     ~1.6 Tcfe                         11%(1)
       Net Production of ~49 MMcfe/d                                    Second Quarter 2018        Proved Developed Reserves           Approximate
       NW STACK                                                           Net Production                76% Natural Gas              Base Decline Rate
        • Core acreage position of ~60,000 net acres heavily                                                22% NGL
            concentrated in Blaine, Major and Garfield counties, with
            significant offset activity
       Arkoma
        • ~37,000 net acres, 100% held by production (“HBP”)
            with large inventory of remaining horizontal locations

                               East Texas
          Net Production of ~51 MMcfe/d
          ~ 110,000 net acres HBP
          Bossier and Cotton Valley development potential                                                            Michigan / IL
          Two successful horizontal wells drilled in 2017

                            North Louisiana                                             Uinta
       Net Production of ~27 MMcfe/d
       ~ 100,000 net acres HBP
       Four operated horizontal wells drilled in 2016/2017 with                                  Hugoton
        excellent results

                Long Life, Low Decline
                                 Hugoton                                                                                         Arkoma
                                                                                       NW STACK
       Net Production of ~136 MMcfe/d
       Base decline of ~ 6%
       More than 3,400 infill drilling locations economic at varying
        prices above $3.00 per mcf                                                                                                    NLA
       Jayhawk Plant derives significant value from helium recovery
        and third party processing

                           Michigan / Illinois                                                              ETX

       Net Production of ~27 MMcfe/d
       Base decline of ~4%

                                   Uinta
       Net Production of ~22 MMcfe/d
       Base decline of ~ 11%
       Non-Operated position

(1)       Base decline includes both mature and growth assets                                                                                             20
Growth Assets

•   NW STACK
•   Arkoma
•   East Texas
•   North Louisiana
NW STACK - Overview

                               NW STACK Position
                                                                          •   Approximately 60,000 core net acres within
                                                                              Riviera’s focus area of Major, Blaine, and
                                                                              Garfield counties
                                                                               – Acreage is ~100% HBP and ~75%
                                                                                   operated(1)
                                                                               – Acreage located in black oil window
                                                                               – Shallow drilling depths of ~7,500 –
                                                                                   ~9,500 feet result in significantly lower
                                                                                   drilling costs than STACK play south of
                                                                                   our core area
                                                                               – Expected wells costs range from
                                                                                   $3.8MM to $5.8MM
                                                                               – Potential inventory of >825 net
                                                                                   locations with IRRs >40%(2)

                                                                          •   Additional acreage outside of the core is
                                                                              being delineated by offset operators

                                                                          •   Riviera has participated in 59 non-operated
                                                                              wells

                     NW STACK Core Focus Area
                                                                          •   Plan to initiate operated drilling program in
                                                                              Q4 2018
(1)   Operation control assumed if leasehold >/= 200 acres in a section
(2)   Assumed Pricing: Gas: $2.85/Mmbtu; Oil: $65.00/bbl                                                                       22
NW Stack – Regional Geology Plays & Targets

                           N     GR DPHI                                                       S

    N
         MISS LIME

                                       Osage
        NW STACK

    STACK                                                                       Woodford

            MERGE    S         Miss Lime       NW STACK   NW STACK      STACK         MERGE
                                Platform

                           •       Merge to NW STACK is continuous petroleum system
                           •       Massive hydrocarbon column with economic production
                                   throughout
                   SCOOP             – Vertical production from Hunton up through Penn
                                     – Established horizontal success in Meramec and
                                        Osage across core acreage
                           •       Target shallows to the north resulting in higher oil cuts
                                   and lower drilling costs

                                                                                               23
NW Stack –                                                            Osage

                                                                                                    Meramec
                                                                                                                        Rig Activity

                                                                                                                        Permit
                                                                                                                                           Analogs

                              Offset Activity
      Hedrick 3-1H (Comanche)                     Elwell 29-1H (Comanche)   Childress 1-26H (Fairway)          Newton 1-31H (Fairway)                 Regier 7-2H (Fairway)
        IP30/1000ft:124 Boe/d                         IP30/1000ft: 229           IP30/1000ft: 82                  IP30/1000ft: 189                       IP30/1000ft: 91
              Oil: 50%                                     Oil: 51%                 Oil: 56%                          Oil: 67%                              Oil: 74%

  Shepherd 24-25-1H (Comanche)                                                                                                                       Martens 5-35 (Red Bluff)
      IP30/1000ft: 147 Boe/d                                                                                                                             IP30/1000ft: 161
             Oil: 63%                                                                                                                                        Oil: 66%

       Mounds 16-1H (Carrera)                                                                                                                    Schoeppel 16-2 1H (Chesapeake)
          IP30/1000ft: 150                                                                                                                               IP30/1000ft: 179
              Oil: 61%                                                                                                                                       Oil: 54%

   Smart 24-20-17 1H (Tapstone)                                                                                                                 Gerken 2205 1UMH-33 (Chaparral)
         IP30/1000ft: 242                                                                                                                                IP30/1000ft: 240
             Oil: 37%                                                                                                                                        Oil: 53%

       Fenton 17-1H (Corlena)                                                                                                                  Barbee 2105 1LMH-4 (Chaparral)
          IP30/1000ft: 131                                                                                                                             IP30/1000ft: 241
              Oil: 56%                                                                                                                                     Oil: 68%

      Olive Lee 1H-22 (Devon)                                                                                                                   White Oak 2206 1UMH-36 (Chaparral)
          IP30/1000ft: 377                                                                                                                               IP30/1000ft: 153
              Oil: 20%                                                                                                                                       Oil: 15%

   Dennis 28-19-1 1H (Tapstone)                                                                                                                  Osmus 22&15-20 1H (Chesapeake)
         IP30/1000ft: 375                                                                                                                                 IP30/1000ft: 91
             Oil: 15%                                                                                                                                        Oil: 71%

   Medill 2015 1-27H (Sandridge)                                                                                                                  Willamette 30 & 1H (Chesapeake)
           IP30/1000ft: 184                                                                                                                              IP30/1000ft: 122
               Oil: 82%                                                                                                                                      Oil: 63%

  Campbell 2015 1-26H23H (Sandridge)             Joyce 14-1H (Comanche)     Burrell 5-33 MH (Red Bluff)       Scheffler 1H-9X (Newfield)        Hoskins 5-19-1 1H (Chesapeake)
            IP30/1000ft: 98                           IP30/1000ft: 94            IP30/1000ft: 185                  IP30/1000ft: 163                    IP30/1000ft: 204
               Oil: 82%                                  Oil: 71%                     Oil: 56%                         Oil: 77%                            Oil: 57%
                                                                                                                                                                                24
Note: Rig and permit data sourced from DrillingInfo as of August 20, 2018
NW STACK - Current Inventory

                 Type Log                                                 NW STACK Inventory
                        Formations        •   Base case: 4 wells per section in Meramec and Lower Osage
                                                •   Gross locations: ~1,950
                                                •   Net locations: ~825
                            Meramec
                                          •   Upside case: 7 wells per section in Meramec, Upper Osage, Lower Osage
                                                •   Gross locations: ~5,100
                                                •   Net locations: ~2,170

                                                                 1 Mile
Mississippian

                            Upper Osage

                                                                                                     Base    Upside
                                                                                                     Case     Case
                                                                                      Formation      Wells   Wells    Total
                                                                                      Meramec         4        3        7
                            Lower Osage
                                                                                      U. Osage        0        7        7

                                                                                      L. Osage        4        3        7
                            Woodford
                                                                                      Woodford        Additional Potential

                            Hunton

                                                                                                                             25
Arkoma - Overview

                                    Arkoma Position
                                                              •   Approximately 37,000 net acres mainly in
                                                                  Hughes and Coal counties, OK
                                                                   – Acreage is ~100% HBP and ~46%
                                                                      operated
                                                                   – Position is fully de-risked in the
                                                                      Woodford shale with ~420 horizontal
                                                                      wells drilled on Riviera's acreage
                                                                   – Base inventory of ~90 net Woodford
                                                                      locations with average IRR ~30%(1)
                                                                   – Significant upside in the emerging
                                                                      Mayes, Caney, and Cromwell plays

                                                              •   Gas production is very liquids rich with
                                                                  ~27% of revenue coming from NGLs

                                                              •   Substantial recent offset operations with
                                                                  ~230 horizontal wells drilled since 2015
                                                                  and 9 rigs currently running in the area

Note: Rig data sourced from DrillingInfo as of July 30 2018

  (1) Assumed Pricing: Gas: $2.85/Mmbtu; Oil: $65.00/bbl                                                      26
Rig Activity    Analogs
                   Arkoma – Offset Activity                                                                                    Permit

                   Sherry Pad (BP)                      Pauline Pad (Trinity Operating)             Emma Pad (Trinity Operating)                     Stewart Pad (BP)
                3 Wells drilled in 2015                      4 Wells drilled in 2017                     2 Wells drilled in 2017                   4 Wells drilled in 2017
            5,174’ Average Lateral Length                10,298’ Average Lateral Length              7,923’ Average Lateral Length             9,448’ Average Lateral Length
           5,802 Mcfd Average Peak IP-30                6,311 Mcfd Average Peak IP-30               6,810 Mcfd Average Peak IP-30             4,621 Mcfd Average Peak IP-30

                    Ina Pad (BP)                                                                                                                  Hunt-Garrett Pad (BP)
                3 Wells drilled in 2015                                                                                                            3 Wells drilled in 2016
            5,646’ Average Lateral Length                                                                                                      8,099’ Average Lateral Length
           5,656 Mcfd Average Peak IP-30                                                                                                      8,679 Mcfd Average Peak IP-30

                  Binns Pad (BP)                                                                                                             Sandmann 1H-9X Well (Newfield)
               4 Wells drilled in 2017                                                                                                                 Drilled in 2015
           5,288’ Average Lateral Length                                                                                                           10,709’ Lateral Length
           6,995 Mcfd Average Peak IP-30                                                                                                      12,095 Mcfd Average Peak IP-30

                  Phillips Pad (BP)                                                                                                          Payden 1H-12XX Well (Newfield)
                2 Wells drilled in 2015                                                                                                               Drilled in 2015
            5,927’ Average Lateral Length                                                                                                         10,807’ Lateral Length
           6,854 Mcfd Average Peak IP-30                                                                                                     14,856 Mcfd Average Peak IP-30

           HB 1-11 Well (Canyon Creek)                                                                                                             Ellis Pad (Newfield)
                   Drilled in 2017                                                                                                                2 Wells drilled in 2015
                8,099’ Lateral Length                                                                                                         11,619’ Average Lateral Length
           2,876 Mcfd Average Peak IP-30                                                                                                     12,674 Mcfd Average Peak IP-30

              LDC Pad (Canyon Creek)                                                                                                           Persall 1-8/17H Well (Bravo)
                2 Wells drilled in 2017                                                                                                                Drilled in 2017
            8,984’ Average Lateral Length                                                                                                          8,934’ Lateral Length
           2,607 Mcfd Average Peak IP-30                                                                                                      6,783 Mcfd Average Peak IP-30

            Lackey Pad (Bravo Arkoma)                                                                                                              Resh 2-8H Well (BP)
                2 Wells drilled in 2016                                                                                                               Drilled in 2017
            7,515’ Average Lateral Length                                                                                                          5,790’ Lateral Length
           2,474 Mcfd Average Peak IP-30                                                                                                      6,524 Mcfd Average Peak IP-30

        Bellettini Trust Pad (Bravo Arkoma)                                                                                                          Smalley Pad (BP)
                3 Wells drilled in 2015                                                                                                            3 Wells drilled in 2015
           9,247’ Average Lateral Length                                                                                                       5,555’ Average Lateral Length
          4,869 Mcfd Average Peak IP-30                                                                                                       6,945 Mcfd Average Peak IP-30

             Ward Pad (Bravo Arkoma)                                          McEntire Pad (Bravo Arkoma)                                             Bowen Pad (BP)
                2 Wells drilled in 2016                                            3 Wells drilled in 2016                                         3 Wells drilled in 2015
            9,883’ Average Lateral Length                                      9,177’ Average Lateral Length                                   7,354’ Average Lateral Length
           7,619 Mcfd Average Peak IP-30                                      4,421 Mcfd Average Peak IP-30                                   6,786 Mcfd Average Peak IP-30
                                                                                                                                                                               27
Note: Rig and permit data sourced from DrillingInfo as of July 30, 2018
Arkoma - Current Inventory

Type Log                                        Arkoma Inventory
                   •   Base case: 5 wells per section in Woodford
                         •   Gross locations: ~230
                         •   Net locations: ~90

       Cromwell    •   Upside: 5 wells per section in Mayes & Caney

                   •   Additional Potential: Cromwell emerging play

                                     1 Mile
       Jefferson

                                                                         Base    Upside
                                                                         Case     Case
       Caney                                                 Formation   Wells   Wells    Total
                                                             Cromwell     Additional Potential
                                                             Caney        0        5        5
                                                             Mayes        0        5        5
                                                             Woodford     5        0        5
       Mayes

       Woodford

       Hunton
                                                                                                  28
East Texas – Overview

              East Texas Position        •   Approximately 110,000 net acres
                                             mainly in Limestone, Freestone, and
Personville
                                             Smith counties, TX
                                              – Acreage is ~98% HBP and ~86%
                                                 operated
                                              – Significant upside horizontal
                                                 development of the Bossier and
                                                 Cotton Valley formations
                                              – Significant inventory of >60 net
                                                 locations with attractive returns at
                                                 current commodity prices

                                         •   Recently completed integration of 3D
                                             seismic into Bossier mapping to identify
                               Overton
                                             additional inventory in the Personville
                                             field
                                               – Bossier well drilled in 2017
                                                   yielded excellent results with EUR
                                                   ~1.5 Bcf/1,000ft

                                         •   Overton field is seeing increased
                                             horizontal activity directly offset the
                                             position

                                                                                        29
East Texas – Personville Field

•   Bossier target of incised valley fill sandstones                               Personville Type Log
•   3D seismic tied to well control using waveform modeling combined with
    amplitude mapping provide high probability in prediction of IVF sand
    presence
                                                                                                 Bossier
•   Current inventory of 27 net Bossier wells
•   Cotton Valley Lime infill horizontal developement provides additional upside
                                                                                                 IVF
      Bossier – Incised Valley Fill (IVF) Sandstones – Cross Section

                                                                                                 Cotton Valley
                                                                                                 Lime

                                                                                                 Buckner
                                                                                                             30
East Texas – Overton Field

                                                                      Type Log
•   Overton Field is currently a vertical
    producing Cotton Valley field

•   There have been 72 offset horizontal
    wells drilled in the Cotton Valley Taylor
    Sands                                                                        Taylor L1

                                                Cotton Valley Sands
•   Significant amount of offset horizontal
    activity generating attractive returns at
    current prices                                                               Taylor L2

•   Approximately 45 net horizontal
    development locations identified within                                      Taylor L3
    Riviera's acreage position
                                                                                 Taylor L4
•   Economics of development benefit from
    high liquid yields of approximately 30
    bbls/mmcf

                                                                                        31
Rig Activity   Analogs
                          Overton – Offset Activity                                                          Permit

                                                                          CV Taylor Sand Gross Isopach Map
   McElroy-Swann Moore 1H (Tanos)
      Completion Date: 7/3/2017
        Peak IP-30: 5.7 MMCFD
               LL: 6,737’                                                                                                          Burns 3HR (Valence)
                                                                                                                                 Completion Date: 6/9/2018
   McElroy ‘A’- Wilkinson 1H (Tanos)                                                                                              Peak IP-30: Too Recent
      Completion Date: 3/23/2017                                                                                                        LL: 5,313’
        Peak IP-30: 6.1 MMCFD
                LL: 4,803’                                                                                                       Burns-Poole 1H (Valence)
                                                                                                                                 Completion Date: 6/10/2018
     Maldonado-Murray 1H (Tanos)                                                                                                  Peak IP-30: Too Recent
      Completion Date: 3/20/2018                                                                                                         LL: 7,281’
        Peak IP-30: 5.8 MMCFD
               LL: 4,910’                                                                                                            Burton 2H (Jamex)
                                                                                                                                  Completion Date: 8/3/2017
     McElroy ‘A’- Murray 1H (Tanos)                                                                                                Peak IP-30: 4.7 MMCFD
       Completion Date: 3/12/2018                                                                                                         LL: 5,636’
        Peak IP-30: 3.5 MMCFD
               LL: 4,478’                                                                                                     Reagan-Black Stone-Wilkinson 2H
                                                                                                                                           (Tanos)
         Pond-Gray 1H (Tanos)                                                                                                     Completion Date: 1/3/2017
        Completion Date: 6/4/2017                                                                                                  Peak IP-30: 7.8 MMCFD
         Peak IP-30: 5.4 MMCFD                                                                                                            LL: 6,807’
                LL: 3,837’
                                                                                                                                 Steele Gas Unit 1H (Jamex)
           Pond 2H (Tanos)                                                                                                       Completion Date: 6/20/2018
        Completion Date: 5/24/2017                                                                                                 Peak IP-30: Too Recent
         Peak IP-30: 7.1 MMCFD                                                                                                           LL: 5,943’
                LL: 4,950’
                                                                                                                                   McElroy 3H (Valence)
     Wilkinson Gas Unit 1H (Jamex)                                                                                                Completion Date: 6/5/2018
      Completion Date: 07/17/2018                                                                                                  Peak IP-30: Too Recent
         Peak IP-30: Too Recent                                                                                                          LL: 7,675’
               LL: 6,524’
                                                                                                                              Cecil Martin Gas Unit 1H (Jamex)
      Johnson Gas Unit 2H (Jamex)                                                                                                Completion Date: 8/3/2017
        Completion Date: 6/4/2018                                                                                                  Peak IP-30: 6.5 MMCFD
         Peak IP-30: Too Recent                                                                                                           LL: 6,019’
               LL: 6,914’

                                RVRA’s position has very thick CV Taylor Sand compared to offset results
                                                                                                                                                              32
Note: Rig and permit data sourced from DrillingInfo as of July 30, 2018
North Louisiana - Overview

                                  North Louisiana Position
                                                             •   Approximately 100,000 net acres
                                                                 across northern Louisiana
                        Ruston Field
                                                                  – Acreage is ~99% HBP and
                                                                      ~63% operated

                                                             •   Ruston field is direct offset to
                                                                 prolific Terryville field
                                                                  – Significant upside of the
                                                                       stacked benches of Bossier
                                                                       (Poole) Sands
                                                                  – 4 horizontal wells drilled on
                                                                       Riviera’s acreage with 3
                                                                       Middle Poole wells average
                                                                       IRR >100%(1)
                                                                  – Inventory of ~15 net
                                                                       locations with exceptional
                                                                       returns

                                                             •   Additional upside potential exists
                                                                 throughout position

(1) Assumed Pricing: Gas: $2.85/Mmbtu; Oil: $65.00/bbl                                                33
North Louisiana - Ruston Field

•        Growth faults isolate the sands on downthrown block of faults providing a three way trap
•        High maturity of Bossier source rocks provides overpressure reservoir
•        Recent development has been horizontal wells targeting the Middle and Lower Bossier
         (Poole) Sands, proving dual bench development
•        The 4 recent wells drilled on Riviera’s acreage have yielded excellent returns

                                                                                                    Upper Poole Sand
           – Development downthrown of Terryville Fault with ~15 net remaining locations
           – Additional potential upside north of Terryville Fault

                     Ruston RVRA Operated Horizontal Wells

                                                                                                    Middle Poole Sand
    J P Graham 2H 2 Alt (RVRA)

                                                                                                    Lower Poole Sand
        Target: Middle Poole
        EUR: 5.4 BCF/1,000’

    Elliott Etal 1-11HC 1 (RVRA)
         Target: Middle Poole          Elliott Etal 1H 1 Alt (RVRA)   Carter Etal 6H 1 Alt (RVRA)
         EUR: 3.7 BCF/1,000’               Target: Lower Poole           Target: Middle Poole
                                           EUR: 1.9 BCF/1,000’           EUR: 3.9 BCF/1,000’

                                                                                                                        34
North Louisiana –                                                                          Rig Activity   Analogs

                                                                                                                       Permit
                           Ruston Offset Activity
 Lewis 21-16-9 HC 2 Alt (Range)                                                                                                            Autry 25-36 HC 3 Alt (Range)
   Completion Date: 1/19/2017                                                                                                               Completion Date: 2/7/2017
    Peak IP-30: 19 MMCFD                            Terryville/Ruston Wells Drilled Since 1/2017 &                                            Peak IP-30: 25 MMCFD
           LL: 6,522’                                                                                                                                LL: 8,026’
                                                                Riviera Operated Wells
 Standifer 16-21 HC 1 Alt (Range)                                                                                                         Autrey 25-36 HC 4 Alt (Range)
    Completion Date: 5/28/2017                                                                                                              Completion Date: 2/7/2017
     Peak IP-30: 19 MMCFD                                                                                                                    Peak IP-30: 22 MMCFD
             LL: 6,158’                                                                                                                             LL: 7,952’

  Tatum 19-30 HC 1 Alt (Range)                                                                                                             Autry 25-36 HC 2 Alt (Range)
    Completion Date: 8/6/2017                                                                                                               Completion Date: 2/7/2017
     Peak IP-30: 21 MMCFD                                                                                                                     Peak IP-30: 24 MMCFD
           LL: 4,800’                                                                                                                                LL: 7,952’

   Tatum 19-30 HC 2 Alt (Range)                                                                                                                Elliott Etal 1H 1 Alt (LINN)
     Completion Date: 8/6/2017                                                                                                                 Completion Date: 7/9/2017
      Peak IP-30: 17 MMCFD                                                                                                                      Peak IP-30: 13 MMCFD
            LL: 7,781’                                                                                                                                  LL: 3,797’

   Tatum 19-30 HC 3 Alt (Range)                                                                                                            Harrison 7-6 HC 2 Alt (N&G)
     Completion Date: 8/6/2018                                                                                                             Completion Date: 10/8/2017
      Peak IP-30: 25 MMCFD                                                                                                                   Peak IP-30: 17 MMCFD
            LL: 7,816’                                                                                                                              LL: 3,367’

Lamar Dowling 28-33 H 2 (Range)                                                                                                                Carter Etal 6H 1 Alt (LINN)
  Completion Date: 11/25/2017                                                                                                                  Completion Date: 1/3/2017
    Peak IP-30: 20 MMCFD                                                                                                                        Peak IP-30: 15 MMCFD
           LL: 8,160’                                                                                                                                  LL: 4,021’

Lamar Dowling 28-33 H 1 (Range)                                                                                                          Christian Etal 5-8HC 1 Alt (N&G)
  Completion Date: 11/27/2017                                                                                                               Completion Date: 5/7/2017
    Peak IP-30: 21 MMCFD                                                                                                                      Peak IP-30: 20 MMCFD
           LL: 8,247’                                                                                                                               LL: 6,115’

   Barnett 26-35HC 1 Alt (Range)                                                                                                           J P Graham 2H 2 Alt (LINN)
    Completion Date: 2/27/2017                                                                                                             Completion Date: 8/17/2017
      Peak IP-30: 22 MMCFD                                                                                                                   Peak IP-30: 16 MMCFD
             LL: 10,348’                                                                                                                           LL: 4,403’

  Fallin 23-26-35 HC 2 Alt (Range)                           Burnett 35-2 HC 1 Alt (Range)   Smith Etal 34-3-10 HC 2 Alt (N&G)              Elliott Etal 1-11HC 1 (LINN)
    Completion Date: 2/18/2017                                Completion Date: 2/14/2017        Completion Date: 8/18/2017                  Completion Date: 2/20/2016
       Peak IP-30: 18 MMCFD                                     Peak IP-30: 29 MMCFD              Peak IP-30: 45 MMCFD                        Peak IP-30: 29 MMCFD
             LL: 10,154’                                               LL: 8,752’                        LL: 7,658’                                   LL: 6,503’
Note: Rig and permit data sourced from DrillingInfo as of July 30, 2018                                                                                                       35
Long-Life, Low-Decline Assets

• Hugoton
   – Jayhawk Plant
• Michigan / Illinois
• Uinta
Hugoton – Overview

                             •      Net Production of ~136 MMcfe/d(1) (66% Natural Gas, 34% NGL)                                                                           Hugoton Position
                             •      ~1.1 million net acres that are 99%+ held by production(2)
                             •      Very mature, low decline, highly delineated natural gas field
                             •      Focus on Chase and Council Grove formations which produce
                                    significant revenue from NGLs and helium                                                                                                    Jayhawk Plant
                                                                                                                                                                             450 MMcf/d Capacity
                             •      Extensive gathering infrastructure and a significant midstream /
                                    processing investment
                             •      100% interest in the Jayhawk processing plant with capacity of 450
                                    MMcf/d (currently at ~56% utilization)
                             •      More than 3,400 infill drilling locations economic at varying prices
                                    above $3.00 per mcf
                             •      Estimate a minimal amount of capital to offset base decline
                                                                                                                                                                                                    Jayhawk Plant
                                                                                                                                                                                                 450 MMcf/d Capacity
                                                     Historical Production Trend
                                   180
                                   160                                                        Decline Rate of ~6%
                                                                                                                                                                             Price Sensitivity
Net Production (Mmcfe/day)

                                   140                                                                                                                        Number of drilling locations greater than 20% ROR
                                   120                                                                                                            $2.75
                                                                                                                    Natural Gas Price ($/MMBtu)

                                   100                                                                                                            $3.00
                                    80                                                                                                            $3.25
                                                           Average annual capital of ~$2 million
                                    60
                                                                                                                                                  $3.50
                                    40
                                                                                                                                                  $3.75
                                    20
                                     0                                                                                                            $4.00
                                      Jul-15 Nov-15 Mar-16 Jul-16 Nov-16 Mar-17 Jul-17 Nov-17 Mar-18
                                                                                                                                                          0       500    1,000   1,500   2,000    2,500   3,000   3,500
                             (1)    Volumes are average daily second quarter 2018 actual production                                                                                                                       37
                             (2)    Acreage as of year end 2017
Hugoton - Jayhawk Plant Overview

                             •   Commissioned April 1998 – 100% Riviera owned
                             •   Cryogenic Plant with high NGL recoveries and ethane rejection capability
                             •   Capacity of 450 MMcf/day; current throughput approximately 256 MMcf/day
                             •   Electric driven compression
                             •   Propane fractionator
                             •   Helium Recovery & Nitrogen Rejection capability
                             •   Two NGL outlets: ONEOK & Enterprise
                             •   Residue outlet: Southern Star Central
                             •   Helium outlets: Praxair & BLM Pipeline
                             •   3rd Party annual Adjusted EBITDA of $7MM - $10MM

                                             Jayhawk Plant Historical Throughput
                                                                                                    Berry      ~256,000
                             300,000                    XTO / Pioneer                             separation     mcf/d
                                                          Hugoton                 Satanta plant
                                       ~170,000
                                                         Acquisitions              shutdown
                                         mcf/d
                             250,000

                                                                                                                          45% of
                             200,000                                                                                        total
                                                                                                                          through
                  MMcf/day

                                                                                                                             put
                             150,000

                             100,000
                                                                                                                          55% of
                                                                                                                            total
                                                                                                                          through
                              50,000                                                                                         put

                                  0

                                                   Equity Volumes       Third Party Gas                                     38
Michigan / Illinois – Overview

                                                                                                         Michigan/IL Position
 •                       Net Production of ~27 MMcfe/d(1) (97% Natural Gas, 3% Oil)

 •                       ~ 200,000 net acres

 •                       Base decline of approximately 4%

 •                       Michigan is a low decline, biogenic natural gas asset

 •                       Illinois is a mature waterflood

                               Michigan Historical Production Trend
                                                                                                              MI
                         35
                                                                           Decline Rate of ~4%
                         30
Net Production (Mcfed)

                         25

                         20
                                                                                                    IL
                         15
                                           Average annual capital of ~$1.6 million
                         10

                          5

                         -
                             Jan-15   Jul-15   Jan-16    Jul-16    Jan-17     Jul-17       Jan-18

                                                                                                                                39
           (1)           Volumes are average daily second quarter 2018 actual production
Uinta – Overview

         Asset Highlights                                                                                 Uinta Position
                          •         ~22 MMcfe/day net          production(1)

                          •         ~50,000 net acres, majority HBP

                          •         Base decline of ~11%

                          •         Non-operated position acquired through Devon
                                    acquisition in 2014

                          •         Extensive salt water disposal infrastructure

                                      Uinta Historical Production Trend
                               30

                               25                                             Decline Rate of ~11%
Net Production (Mcfed)

                               20

                               15

                               10
                                                Average annual capital of ~$0.166 million
                               5

                               0
                               Jan-15      Jul-15    Jan-16     Jul-16    Jan-17     Jul-17      Jan-18

                                                                                                                           40
                         (1)   Volumes are average daily second quarter 2018 actual production
Blue Mountain Midstream
Overview
Blue Mountain History

Key Highlights      February 2016 – Executed GPA with Linn Energy Holdings, LLC (“LEH”) and approved
                    capital for construction of first refrigeration facility with 30 mmcf/d of processing capacity

                    October 2016 – Capital plan approved, including additional compression and second
                    refrigeration facility, adding 30 mmcf/d of processing capacity

                    November 2016 – Second refrigeration facility operational for total processing capacity of
                    60 mmcf/d

                    May 2017 – Supplemental capital approved to build Cryo Plant I with 250 mmcf/d of
                    processing capacity

                    June 2017 – Start of construction for Cryo Plant I

                    September 2017 – Amended GPA with LEH, dedicating ~70,000 acres to Blue Mountain
                    system

                    December 2017 – Other third-party dedicates ~7,200 acres to Blue Mountain system

                    April 2018 – Current management team joins Blue Mountain

                    June 2018 – Start up of Cryo Plant I

                    August 2018 – Initiated design and engineering of Cryo Plant II

       Today Blue Mountain system has more than 80,000 acres dedicated and is currently
                processing ~150 mmcf/d of natural gas and 9,800 bbl/d of NGLs
                                                                                                                     42
Blue Mountain Company Overview

•   Growth-oriented midstream company focused on
    Merge/SCOOP/STACK plays in Oklahoma
•   System located in core of prolific Merge play, currently a leading
    operating area in U.S.
•   More than 80,000 net acres dedicated to system
     –    LINN Energy’s acreage contributed to Roan Resources is
          dedicated to the Blue Mountain system
     –    Other third-party dedication accelerating growth of business
•   Cryo Plant I is catalyst for future growth
     –    Estimated 2018 exit-rate of 170-200 mmcf/d and expect to
          reach full capacity 250 mmcf/d in mid-2019
     –    At full capacity, Cryo Plant I forecasted to generate
          annualized EBITDA between $100-125 million
•   Significant growth expected from increased throughout from
    current customers and additional third-party volumes
     –    Initiating design and engineering of Cryo Plant II for up to
          250 MMcf/d to meet growing demand
•   Commercially focused on diversifying asset and revenue bases
     –    Crude gathering would provide commodity diversification
     –    Future expansion into NW STACK with new counterparties
•   Connected to major pipelines out of basin to liquid Midwest & Gulf
    Coast markets

               Current footprint and sizeable dedication provide ample growth opportunities
                                                                                              43
Blue Mountain
                Executive Management Team
                             •   Most recently served as President, Gas Pipelines & Processing for Enbridge Energy from January 2014 to April 2017
C. Gregory Harper            •   Formerly SVP of Midstream for Southwestern Energy, SVP and Group President of CenterPoint Energy Pipelines and Field
                                 Services, President & CEO of Spectra Energy Partners, and multiple executive leadership roles for Duke Energy
President and Chief
Executive Officer            •   Currently serves on the board of Sprague Resources, and has served on the boards of Midcoast Holdings L.L.C., Enbridge
                                 Energy Company, Inc., Enbridge Energy Management, L.L.C, and Spectra Energy Partners

                             •   Over 35 years of energy industry experience with roles ranging from the field to executive leadership
David A. Weathers
                             •   Prior to Blue Mountain, served as Vice President of Business Development for Enbridge’s U.S. Gathering & Processing
Executive Vice President         business unit
and Chief Commercial         •   Former Senior Director for NextEra Energy and held various roles of increasing responsibility for over 20 years with Duke
Officer                          Energy

Brad D. Reese                •   Over 36 years of energy industry experience, with over 25 years concentrated in midstream infrastructure development
Executive Vice President     •   Most recently was President of Enbridge Canadian Gathering & Processing, and served on the boards of Alliance Pipeline and
                                 Aux Sable companies
and Chief Development &
                             •   Prior to Enbridge, held various leadership roles for over 29 years with Targa Resources, Spectra Energy and DCP Midstream
Corporate Services Officer

                             •   Over 36 years of energy industry experience with roles in engineering / construction, operations, and commercial development
Christopher T. Ditzel        •   Prior to Blue Mountain, served as Vice President of Commercial Operation for Enable Midstream
Chief Operating Officer      •   Over 28 years served in multiple leadership roles in engineering, operations and business development for Panhandle Eastern,
                                 Duke Energy and Spectra Energy

Noor S. Kaissi               •   Most recently held numerous finance leadership roles for Enbridge Energy, including Controller of Enbridge’s U.S. asset base
                             •   Principal accounting officer for Enbridge Energy Management, Enbridge Energy Partnership and Midcoast Energy Partnership
Vice President of
Accounting and Finance       •   Prior to Enbridge, held leadership positions with Dynegy, Enron and Arthur Andersen

                 High-quality executive team supported by accomplished, commercially-focused
                                        technical and financial teams
                                                                                                                                                                44
Blue Moutain Key Priorities

 Cryo Plant I in-service June 2018

 Capture incremental third-party volumes to system

 Ensure sufficient take-away capacity for system volumes

 Design and engineering of Cryo Plant II commenced August 2018

 Diversification of products, service offerings, and reach into new basins

 Stand-up organization, processes and finances for standalone platform

  Blue Mountain team focused on achievable, highly value-driven opportunities
                                                                                45
Initial Blue Mountain System Overview

                                                                                     • 250 mmcf/d of designed processing capacity with Cryo Plant I
                                                                                     • ~87,000 HP of total compression
                                                                                     • 110 miles of gathering pipe
                                                                                     • Supported by dedicated acreage position of more than 80,000 net
                                                                                       acres under long-term contracts
                                                                                     • Interconnections into Southern Star Central, Enable Gas
                                                                                       Transmission and ONEOK Gas Transportation pipelines
                                                                                     • At full capacity, Cryo Plant I forecasted to generate annualized
                                                                                       EBITDA between $100-125 million

                                  Blue Mountain system strategically positioned to capture and provide market
                                                 access for producer volumes
Note: Processing capacity, compression and pipeline mileage shown are for fully-built system at year-end 2018                                             46
Blue Mountain Midstream –
           Cryo Plant I Update

• State of the art cryogenic processing facility in-
  service June 2018

• Initial operating capacity of 150 mmcf/d and
  62,000 horsepower of compression now online

• Full 250 mmcf/d to become available by 4Q
  2018, with the addition of 25,000 HP of
  compression
                                                                           Forecasted Throughput vs. Plant Capacity
                                                                300,000
• ONEOK Hydrocarbon providing NGL                               250,000
  transportation from the facility                              200,000

                                                       mmcf/d
                                                                150,000

• Facility is fully staffed and operating 24/7                  100,000

                                                                 50,000

                                                                     0
                                                                      Jul-18       Aug-18        Sep-18         Oct-18       Nov-18         Dec-18
• 80-acre site provides ample space for additional
                                                                               Forecasted Throughput (Upper Range)
  trains to meet growing demand                                                Actuals Through August 2018; Forecasted Throughput (Lower Range)
                                                                               Plant Capacity

              Blue Mountain system built by experience operations staff; focus now
                       moves to design and engineering of Cryo Plant II
                                                                                                                                                     47
Merge / SCOOP Play Overview

                   Active Rigs by Operator in Merge / SCOOP(1)                               Merge / SCOOP Rig Activity(1)
      14    13
      12
      10
                    8
       8
       6
       4                  3    3    3
                                          2       2     2        2
       2                                                             1   1     1     1   1
       0

                 Horizontal Drilling Permits in the Merge(2)
                                                            136                125
                                                             3
                                                            20
                                                            20                  56
                                   61

                                    35                      93
              14                                                                69
                                    11
                                    15
             2015                  2016                 2017                 2018 YTD
                        Other Operators          LNGG        Citizen     Roan

                           Blue chip operators surround premier Merge / SCOOP acreage position
(1)   Source: Drilling Info as of August 2018
(2)   Source: IHS; 2018 YTD is as of July 2018                                                                               48
Customer Acreage Dedication

      More than 80,000 acres dedicated to Blue Mountain
      System
      •     Roan Resources is anchor producer (1)
               –     Pure play operator in Merge/SCOOP/STACK
                     formed by LINN Energy and Citizen Energy
               –     Largest position in the Merge play
               –     Producing ~45,000 Boe/d and forecasting
                     61,000 Boe/d by end of 2018
               –     Running 8 rigs on dedicated acreage

      •     Received other third-party dedication in December
            2017
               –     Private company
               –     Dedicated acreage located in close proximity
                     to system
               –     Expect to add 10 new wells to system in 2018

      •     In active talks to gain additional third-party
            dedications

      Decision made on Cryo Plant II with up to 250 mmcf/d of addition capacity, based on producer
            commitments and anticipated production growth from Roan and other producers

(1)   Guidance from Roan Resources Investor Update July 2018 and current production and rig count from Roan Resources   49
Blue Mountain Key Statistics

                       Estimated Operating Margin(1) (in millions)                                                       Capital Forecast (2) (in millions)

           200                                                                                         200

                                                                                                  $22
           175
                                                                                                       170                                                  $32
           150
                                                                           140
                                                                                                  $18
           125
                                                                           125
           100
  mmcf/d

                                                                                                                                                            $75
            75
                                                     62
            50                61                                                                                                         $53
                                                                           $6
            25
                            $1                                             $3
                                                    $0
             0
                      Q1 2018 A               Q2 2018 E               Q3 2018 E               Q4 2018 E                                                     $53
                                                                                                                                         $43
                                                                                                                         $33
                                 Estimated Throughput MMcf / Day - Upper Range

                                 Estimated Throughput MMcf / Day - Lower Range
                                                                                                                        2016A           2017A              2018E
                                 Plant Operating Margin Estimate - Lower Range

                                 Plant Operating Margin Estimate - Upper Range                                                  Field   Cryo I   Cryo II

                       Blue Mountain systems designed for speed and efficient deployment of capital

(1)   Operating margin is all Blue Mountain Midstream revenue less direct operating expenses and does not include G&A                                              50
(2)   Field includes refrigeration facilities 1 and 2
Blue Mountain Key Takeaways

   Deep         Experienced management team in place with proven track record of
 Midstream      successful execution in midstream energy infrastructure
 Expertise

                Strong believers in Anadarko Basin and current asset footprint well-
Leading G&P
                positioned to capitalize on growth opportunities in prolific Merge/
  Position
                SCOOP/STACK/NW STACK plays

   Strong
Commercial      Closely aligned with our key customer – Roan Resources
Relationships

                Aggressive ramp up in volumes and EBITDA strengthens cash flow in near-
  Financial
                term; secured $200 million line of credit with $70 million currently available
  Strength
                provides funding for growth

  Multiple      Key focus on securing future growth projects; beginning design and
Avenues for     engineering of Cryo Plant II and evaluating other scalable business growth
  Growth        opportunities

                                                                                                 51
Financial and Management
Update
2019 Guidance to be
                 2018 Guidance                                                                                          Provided Following
                                                                                                                          Budget Approval

                                                                                                  Q3 2018E                                   Q4 2018E                                      FY 2018E

Net Production (MMcfe/d)                                                                        275 – 305                                    270 – 305                                     314 – 330
         Natural gas (MMcf/d)                                                                   225 – 250                                    220 – 248                                     237 – 250
         Oil (Bbls/d)                                                                         1,300 – 1,500                                1,300 – 1,500                                3,200 – 3,300
         NGL (Bbls/d)                                                                         6,900 – 7,700                                7,000 – 8,000                                9,600 – 10,000

Other revenues, net (in thousands) (1)                                                     $ 9,000 - $ 13,000                           $ 25,000 - $ 31,000                          $ 52,000 – $ 63,000
         Blue Mountain Midstream business                                                   $ 3,000 - $ 6,000                           $ 18,000 - $ 22,000                          $ 22,000 – $ 29,000
         Other                                                                              $ 6,000 - $ 7,000                            $ 7,000 - $ 9,000                           $ 30,000 – $ 34,000

Costs (in thousands)                                                                      $ 48,000    – $ 54,000                        $ 47,000   – $ 54,000                      $ 223,000 – $ 236,000
          Lease operating expenses                                                        $ 23,000    – $ 25,000                        $ 23,000   – $ 26,000                      $ 118,000 – $ 123,000
          Transportation expenses                                                         $ 19,000    – $ 21,000                        $ 18,000   – $ 20,000                        $ 77,000 – $ 81,000
          Taxes, other than income taxes                                                   $ 6,000    – $ 8,000                          $ 6,000   – $ 8,000                         $ 28,000 – $ 32,000

Adjusted general and administrative expenses            (2)                               $ 22,000 – $ 24,000                           $ 15,000 – $ 17,000                          $80,000 – $ 84,000
Severance expenses                                                                        $ 12,000 – $ 14,000                            $ 3,000 – $ 5,000                           $ 33,000 – $ 37,000

Costs per Mcfe (Mid-Point)                                                                         $ 1.91                                      $ 1.91                                        $ 1.95
         Lease operating expenses                                                                  $ 0.90                                      $ 0.93                                        $ 1.03
         Transportation expenses                                                                   $ 0.75                                      $ 0.72                                        $ 0.67
         Taxes, other than income taxes                                                            $ 0.26                                      $ 0.26                                        $ 0.25

Targets (Mid-Point) (in thousands)
         Adjusted EBITDAX                                                                         $ 4,000(3)                                 $ 39,000(3)                                   $ 94,000(3)
         Interest expense (4)                                                                        $—                                         $—                                            $—
         Oil and natural gas capital                                                              $ 16,000                                    $ 33,000                                      $ 66,000
         Blue Mountain Midstream capital                                                          $ 29,000                                    $ 41,000                                     $ 160,000
         Total capital                                                                            $ 50,000                                    $ 76,000                                     $ 235,000

Weighted Average NYMEX Differentials
Natural gas (MMBtu)                                                                         ($ 0.47) – ($ 0.38)                         ($ 0.45) – ($ 0.35)                           ($ 0.40) – ($ 0.35)
Oil (Bbl)                                                                                   ($ 5.05) – ($ 4.55)                         ($ 3.00) – ($ 2.70)                           ($ 4.00) – ($ 2.00)
NGL price as a % of crude oil price                                                            36% – 41%                                   36% – 41%                                     34% – 38%
Unhedged Commodity Price Assumptions                                                        Jul                 Aug              Sep                Oct               Nov                Dec               2018E
Natural gas (MMBtu)                                                                       $3.00                $2.82            $2.94              $2.95              $2.98             $3.07              $2.92
Oil (Bbl)                                                                                $70.58                $67.63          $67.63              $66.94            $66.54             $66.21             $66.51

  (1)       Includes other revenues and margin on marketing activities
  (2)       Excludes share-based compensation expenses and severance expenses
  (3)       Includes a reduction to Adjusted EBITDAX for certain non-recurring G&A expenses, including estimated severance expenses of $35mm, estimated spin transaction costs of $7.5mm, estimated land diligence costs of
            $3.6mm, divestiture related expenses of $1.1mm                                                                                                                                                                    53
  (4)       Excludes non cash amortization of deferred financing costs
Pro-Forma Adjusted Riviera Upstream
                               2018 Adjusted EBITDAX Outlook
                                                                                                                                                                                              Adjusted
                                                                                                                                                                                               Riviera
                                2018                       Pro-forma                                                                                                                          Upstream
                               Riviera                     Estimates                                                                                                                          Guidance
                              Resources
            $140              Guidance

            $120

                                                                                                                                                                       $52
            $100
$ in Millions

                $80                                         ($23)

                                                                                                                                                                                                 $132
                $60                                                                                                                          $35
                                                                                       ($26)
                                   $94
                $40                                                                                                                                                    $80
                                                             $71

                $20                                                                     $45                       $45                        $45

                 $0
                          FY 18 Guidance Pre-Close Adjusted FY18 Operating                                Implied Riviera               Severance               Expected G&A             Pro-Forma FY18
                                           EBITDAX from     Margin from Blue                              Upstream Pro-                  Expense                Reductions (3)               Estimate
                                           Asset Sales (1)     Mountain                                   Forma FY 18 E
                                                             Midstream (2)

                (1)   Represents Adjusted EBITDAX before closing for the following: OK Waterfloods closed 2/28/18, TX Panhandle Shallow closed 2/28/18, Permian Conventional W TX closed 3/29/18, Altamont
                      Bluebell closed 4/4/18, Permian NM closed 4/10/18
                (2)   Only includes the Chisholm Trail business, and excludes G&A
                (3)   Further G&A reductions, including Blue Mountain G&A, that will result in a pro-forma run-rate of approximately $30 million annually                                                    54
FY 2018 Capital Allocation

                                                                    Total Capital $235 million
                                                                                   ($ in millions)
                                                                                                                                                                       Drilling =          $45MM
                                                                                                                                                                       Seismic =           $ 8MM
                                                                                                                                                                       Leasing =           $11MM
                                                                                                                                                                       Total   =           $64MM

                                                                                                          Upstream Assets Oil
                                                                                                           & Gas Capital (1)
                                                                   Blue Mountain                                  $64
                                                                  Midstream 1H'18
                                                                        $90

                                                                                                                                                        Asset Sales (2)
                                                                                                                                                               $2
                                                                                                                                                       Other P&P / Admin
                                                                                                                                                               $9
                                                                                            Blue Mountain
                                                                                           Midstream 2H'18
                                                                                                 $70

(1)   Assets include Hugoton, Michigan, Uinta, Arkoma, NW STACK, North Louisiana, and East Texas
(2)   Asset Sales include Oklahoma Waterfloods and Texas Panhandle closed 2/28/18, Permian Conventional West TX closed 3/29/18, Altamont Bluebell closed 4/4/18, and Permian NM closed 4/10/18.    55
2018 Capital Bridge – Full Year
                   ($ in millions)

                                                                           Blue Mountain Midstream Capital Bridge
                                             $160
                                                                                                                   $32                $160
                                             $120                                                 $8
                                                                    $120                         $120              $128
                                               $80

                                               $40

                                                  $0
                                                            Prior Guidance                Plant 1 Field /         Plant 2     Current Guidance
                                                                                            Other (1)

                                                                                    Riviera Upstream Capital Bridge
            $80
                                                                                                                            $4                $1

            $60                                                                                             $14
                                                                                       $8                   $56
                                                            $8                        $48
            $40                                                                                                                                        $75
                                $40                        $40

            $20

              $0
                        Prior Guidance               NW STACK                   NW STACK                NW STACK        Arkoma Non-          Other    Current
                                                      Seismic                    Leasing              Operated Drilling   Operated                   Guidance

(1)   Represents acceleration of capital previously forecasted in 2019 to increase plant 1 capacity
                                                                                                                                                                56
Commodity Hedge Portfolio –
                                Henry Hub and WTI

                                Natural Gas Positions                                         Oil Positions

                          200       191                                             2000

                          175                                                       1750
                                                                                           1500
Volume Hedged (MMbtu/d)

                          150                                                       1500

                                                           Volume Hedged (bbls/d)
                          125                                                       1250

                          100      $3.02
                                                                                    1000

                          75                                                         750   $54.07
                                                    61
                                                                                                               500
                          50                                                         500

                          25                       $2.89                             250                      $64.00

                           0                                                           0
                                    2018           2019                                    2018                2019

                                                                                                                       57
Commodity Hedge Portfolio –
                                Natural Gas Basis
                                PEPL Basis Positions                                                                         NGPL TXOK Basis Positions
                          100                                                                                           25

                                                                                              Volume Hedged (MMbtu/d)
Volume Hedged (MMbtu/d)

                                                                                                                        20
                          75
                                    60                                          60
                                                                                                                        15
                          50
                                                                                                                                   10
                                                                                                                        10
                                  ($0.659)                                    ($0.659)
                          25
                                                                                                                         5       ($0.185)

                                                                                                                                                 0
                           0                                                                                             0
                                   2018                                        2019                                               2018          2019

                                                                            Michcon Basis Positions
                                                                       25
                                             Volume Hedged (MMbtu/d)

                                                                       20

                                                                       15

                                                                                10                           10
                                                                       10

                                                                        5     ($0.200)       ($0.200)

                                                                        0
                                                                               2018               2019                                                   58
Capital Structure

                                                    • Approximately 76.2 million shares issued and outstanding at record date
        Common Equity
                                                    • Approximately 0.5 million shares of restricted shares(1)

                                                    • Interest on borrowings determined by reference to either LIBOR +250 to 350
                                                      or ABR +150 to 250, depending on utilization
    Riviera Upstream
  $425 Million Revolver                             • $0 million drawn on RBL post Spin-Off
                                                    • Redeterminations semi-annually every April and October

     Blue Mountain                                  • Interest on borrowings determined by reference to either LIBOR +200 to 300
       Midstream                                      or ABR +100 to 200, depending on leverage ratio
  $200 Million Revolver                             • $70 million available post Spin-Off, up to $200 million total availability

(1)   Originally granted pursuant to the Linn Energy 2017 Omnibus Incentive Plan and converted to Riviera Resources 2018 Omnibus Inventive Plan at Spin-Off   59
Board of Directors

                       Evan Lederman is a Managing Director, Co-Head of Restructuring and Partner on the Investment Team at Fir Tree Partners. Mr. Lederman focuses on
                       the funds’ distressed credit and special situation investment strategies, including co-managing its energy restructuring initiatives. Prior to joining Fir Tree
Evan Lederman          Partners in 2011, Mr. Lederman worked in the Business Finance and Restructuring groups at Weil, Gotshal & Manges LLP and Cravath, Swaine &
                       Moore LLP. Mr. Lederman, in his capacity as a Fir Tree Partners employee, is currently a member of the boards of Riviera Resources, Inc. (Chairman),
Director               Ultra Petroleum Corp. (Chairman), Amplify Energy Corp., New Emerald Energy LLC, Roan Resources LLC and Deer Finance, LLC. Mr. Lederman
                       received a J.D. degree with honors from New York University School of Law and a B.A., magna cum laude, from New York University.

                       Matthew Bonanno joined York Capital Management (“York”) in July 2010 and is a Partner of the firm. Mr. Bonanno joined York from the Blackstone
                       Group, where he worked as an associate focusing on restructuring, recapitalization and reorganization transactions. Prior to joining the Blackstone
Matthew Bonanno        Group, Mr. Bonanno worked on financing and strategic transactions at News Corporation and as an investment banker at JP Morgan and Goldman
                       Sachs. Mr. Bonanno, in his capacity as a York employee, is currently a member of the boards of Riviera Resources, Inc., Rever Offshore AS, all entities
Director               incorporated pursuant to York’s partnership with Costamare Inc., Augustea Bunge Maritime, Next Decade LLC, Vantage Drilling Co. and Roan
                       Resources LLC.

Phil Brown             Philip Brown is a Partner of P. Schoenfeld Asset Management (“PSAM”), where he focuses on credit-oriented investments across various industries.
                       Prior to joining PSAM in 2009, Mr. Brown held positions at Sun Capital Partners, Inc., an operationally-focused private equity firm, and Buckeye Capital
Director               Partners, an event-driven hedge fund. Mr. Brown began his career as an investment banking analyst at Wasserstein Perella & Co.

                       Andy Taylor is a member of the investment team of Elliott Management Corporation (“Elliott”), a New York-based investment firm, where he is
                       responsible for various corporate investments. Prior to joining Elliott in 2015, Mr. Taylor held similar positions in BlackRock’s Distressed Products
Andy Taylor            Group, R3 Capital Partners and the Global Principal Strategies team at Lehman Brothers. Mr. Taylor, in his capacity as an Elliott employee, is currently
Director               a member of the boards of Riviera Resources, Inc., Linn Energy Inc., Roan Resources LLC, Birch Permian Holdings Inc. and Cordero Energy Holdings,
                       LLC. Mr. Taylor received a B.S. in mechanical engineering from Rose-Hulman Institute of Technology and his M.B.A. with honors from the University of
                       Chicago.

David Rottino          David Rottino is President and Chief Executive Officer and a director of Riviera Resources. Prior to Riviera Resources’ spin-off from LINN Energy, Inc.,
                       he served as LINN Energy’s Executive Vice President and Chief Financial Officer and as a member of the board of directors. Mr. Rottino has over 25
President and Chief    years of total experience and over 20 years of experience in the oil and natural gas industry. Prior to joining LINN in June 2008, he served at El Paso
                       Energy, ConocoPhillips and Burlington Resources in various finance, accounting and strategic planning roles. Mr. Rottino earned a bachelor’s degree in
Executive Officer      business administration from Texas Tech University and an M.B.A. from Texas Christian University.

                       Greg Harper has served as the President and CEO of Blue Mountain Midstream since 2018. Prior to Blue Mountain Midstream, Mr. Harper served as
Greg Harper            President, Gas Pipelines and Processing and as the principal executive officer of Midcoast Holdings L.L.C., an Enbridge Inc. affiliate. Before joining
                       Enbridge, Mr. Harper served in various Senior Executive positions including Senior Vice President of Midstream of Southwestern Energy Company,
President and Chief    Senior Vice President and Group President of CenterPoint Energy Pipelines and Field Services, and President, Chief Executive Officer and Director of
Executive Officer of   Spectra Energy Partners, LP. Mr. Harper currently serves on the board of Sprague Resources where he has served as the chair of the audit committee
Blue Mountain          since Sprague’s initial public offering in 2013, and previously served on the boards of Midcoast Holdings, L.L.C., Enbridge Energy Company, Inc. and
                       Enbridge Energy Management, L.L.C. Mr. Harper received his Bachelor’s degree in mechanical engineering from the University of Kentucky and his
Midstream              M.B.A from the University of Houston.

                                                                                                                                                                                         60
You can also read