2021 Investor Update DECEMBER 8, 2020 - CREATING VALUE & IMPROVING LIVES THROUGH SUSTAINABLE AND RESPONSIBLE MINING

Page created by Bertha Mack
 
CONTINUE READING
2021 Investor Update DECEMBER 8, 2020 - CREATING VALUE & IMPROVING LIVES THROUGH SUSTAINABLE AND RESPONSIBLE MINING
2021 Investor Update
                CREATING VALUE & IMPROVING LIVES            DECEMBER 8, 2020
                THROUGH SUSTAINABLE AND
                RESPONSIBLE MINING

2021 INVESTOR UPDATE                                         NEWMONT CORPORATION   1
2021 Investor Update DECEMBER 8, 2020 - CREATING VALUE & IMPROVING LIVES THROUGH SUSTAINABLE AND RESPONSIBLE MINING
Cautionary Statement
CAUTIONARY STATEMENT REGARDING FORWARD LOOKING STATEMENTS:
This presentation contains “forward-looking statements” within the meaning of Section 27A of the Securities Act of 1933, as amended, and Section 21E of the Securities Exchange Act of 1934, as amended, which are
intended to be covered by the safe harbor created by such sections and other applicable laws. Where a forward-looking statement expresses or implies an expectation or belief as to future events or results, such
expectation or belief is expressed in good faith and believed to have a reasonable basis. However, such statements are subject to risks, uncertainties and other factors, which could cause actual results to differ
materially from future results expressed, projected or implied by the forward-looking statements. Forward-looking statements often address our expected future business and financial performance and financial
condition; and often contain words such as “anticipate,” “intend,” “plan,” “will,” “would,” “estimate,” “expect,” “believe,” “target,” “indicative,” “preliminary,” or “potential.” Forward-looking statements in this
presentation may include, without limitation, (i) estimates of future production and sales, including production outlook and average future production; (ii) estimates of future costs applicable to sales and all-in
sustaining costs; (iii) estimates of future capital expenditures, including without limitation development capital expenditures for Tanami Expansion 2, Subika Underground SLS, Ahafo North, Yanacocha Sulfides and
other projects; (iv) estimates of future cost reductions, full potential savings, value creation, improvements, synergies and efficiencies; (v) expectations regarding the project pipeline, including, without limitation,
with respect to Tanami Expansion 2, Subika Underground SLS, Ahafo North, Yanacocha Sulfides and other projects, and the development, growth and exploration potential of the Company’s other operations,
projects and investments, including, without limitation, returns, IRR, schedule, decision dates, mine life and mine life extensions, commercial start, first production, average production, average costs, impacts of
improvement or expansion projects and upside potential; (vi) expectations regarding future investments, including in connection with climate change targets and initiatives; (vii) expectations regarding free cash
flow, and returns to stockholders, including with respect to future dividends and future share repurchases; (viii) expectations regarding future mineralization, including, without limitation, expectations regarding
reserves and recoveries; (ix) estimates of future closure costs and liabilities; (x) expectations regarding the timing and/or likelihood of future borrowing, future debt repayment, financial flexibility and cash flow; (xi)
expectations regarding climate change initiatives and reduction of greenhouse gas emissions; and (xii) expectations regarding the impact of the COVID-19 pandemic. Estimates or expectations of future events or
results are based upon certain assumptions, which may prove to be incorrect. Such assumptions, include, but are not limited to: (i) there being no significant change to current geotechnical, metallurgical,
hydrological and other physical conditions; (ii) permitting, development, operations and expansion of operations and projects being consistent with current expectations and mine plans, including, without
limitation, receipt of export approvals; (iii) political developments in any jurisdiction in which the Company operates being consistent with its current expectations; (iv) certain exchange rate assumptions being
approximately consistent with current levels; (v) certain price assumptions for gold, copper, silver, zinc, lead and oil; (vi) prices for key supplies being approximately consistent with current levels; (vii) the accuracy of
current mineral reserve and mineralized material estimates; and (viii) other planning assumptions. Uncertainties relating to the impacts of COVID-19, include, without limitation, general macroeconomic uncertainty
and changing market conditions, changing restrictions on the mining industry in the jurisdictions in which we operate, the ability to operate following changing governmental restrictions on travel and operations
(including, without limitation, the duration of restrictions, including access to sites, ability to transport and ship doré, access to processing and refinery facilities, impacts to international trade, impacts to supply
chain, including price, availability of goods, ability to receive supplies and fuel, impacts to productivity and operations in connection with decisions intended to protect the health and safety of the workforce, their
families and neighboring communities), and the impact of additional waves of the pandemic or increases of incidents of COVID-19 in the areas and countries in which we operate. See endnote regarding outlook
assumptions and note that outlook estimates used herein represent a range of +/- 5 percent unless otherwise indicated. Investors are reminded that only the third quarter has been declared by the Board of
Directors at this time. Future dividends have not yet been approved or declared by the Board of Directors, and an annualized dividend has not been declared by the Board. Investors are cautioned that the
Company’s dividend framework is non-binding. Management’s expectations with respect to future dividends are “forward-looking statements” and non-binding. The declaration and payment of future dividends
remain at the discretion of the Board of Directors and will be determined based on Newmont’s financial results, balance sheet strength, cash and liquidity requirements, future prospects, gold and commodity
prices, and other factors deemed relevant by the Board. The duration, scope and impact of COVID-19 presents additional uncertainties with respect to future dividends and no assurance is being provided that the
Company will pay future dividends at the current payment level. For a more detailed discussion of risks and other factors that might impact future looking statements, see the Company’s Annual Report on Form
10-K for the year ended December 31, 2019 filed with the U.S. Securities and Exchange Commission (the “SEC”), under the heading “Risk Factors”, as well as the COVID-19 related “Risk Factor” in the Quarterly Report
on Form 10-Q for the quarter ended March 31, 2020, filed with the SEC, available on the SEC website or www.newmont.com. The Company does not undertake any obligation to release publicly revisions to any
“forward-looking statement,” including, without limitation, outlook, to reflect events or circumstances after the date of this presentation, or to reflect the occurrence of unanticipated events, except as may be
required under applicable securities laws. Investors should not assume that any lack of update to a previously issued “forward-looking statement” constitutes a reaffirmation of that statement. Continued reliance
on “forward-looking statements” is at investors’ own risk.

 2021 INVESTOR UPDATE                                                                                                                                                                NEWMONT CORPORATION                       2
2021 Investor Update DECEMBER 8, 2020 - CREATING VALUE & IMPROVING LIVES THROUGH SUSTAINABLE AND RESPONSIBLE MINING
Tom Palmer
                                                              PRESIDENT &
                CREATING VALUE & IMPROVING LIVES
                THROUGH SUSTAINABLE AND            CHIEF EXECUTIVE OFFICER
                RESPONSIBLE MINING

2021 INVESTOR UPDATE                                       NEWMONT CORPORATION   3
2021 Investor Update DECEMBER 8, 2020 - CREATING VALUE & IMPROVING LIVES THROUGH SUSTAINABLE AND RESPONSIBLE MINING
The Industry’s Best Portfolio in Top-Tier Jurisdictions
                                                                                                                                                                  World’s Leading Gold Company
                                                                                                                                                                   Nine world-class assets in top-tier
                                                                                                                                Musselwhite
                                                                                                                                                                    Jurisdictions*
                                                                                                                                                                   Industry’s largest gold reserves of
                                                             Nevada Gold Mines***                                                        Éléonore                   96Moz and 63Moz in GEO reserves
                                                             Turquoise Ridge/Twin Creeks                                                                           Stable production of ~8M GEOs*
                                                                   Goldstrike/Carlin
                                                                                                                                      Porcupine                     annually through 2030+
                                                                        Cortez

                                                                                                                                    Pueblo Viejo***
                                                                                 CC&V

                                                                                                                                                      Merian

                                                                                                                                                                                Akyem
                                                                                                 Peñasquito
                                Tanami

                        Tanami Expansion 2
                                                                                                                                                                                Ahafo

                                                                                                                                                                            Ahafo North**
                                                                                                              Yanacocha

                                                                                                         Yanacocha Sulfides**

                         Boddington                                                                                                    Cerro Negro       LEGEND
                                                                                                                                                           = Operations       = Near-term Projects         = Joint Ventures
*See endnotes re definition of world-class asset and calculation of Gold Equivalent Ounces (GEOs)
** Yanacocha Sulfides and Ahafo North are included in Newmont’s outlook but remain subject to approval
                                                                                                                                                               = World-Class Asset          = Emerging World-Class Asset
***Newmont’s ownership interest is 38.5% of Nevada Gold Mines and 40% of Pueblo Viejo

 2021 INVESTOR UPDATE                                                                                                                                                                NEWMONT CORPORATION              4
2021 Investor Update DECEMBER 8, 2020 - CREATING VALUE & IMPROVING LIVES THROUGH SUSTAINABLE AND RESPONSIBLE MINING
Steady Long-Term Production with Improving Costs
      INDICATIVE 10-YEAR GOLD PRODUCTION PROFILE *
      (ATTRIBUTABLE MOZ PER YEAR)
      9
                           Total GEOs **
      8

      7

      6                   South America***
      5                    Africa
      4
                           Australia
      3

      2                   North America***

      1

    -
          2021                         2022                         2023                          2024                         2025                          2026                          2027            2028         2029            2030

                                    World’s leading gold company with ~8M GEOs per year for the next decade
*Indicative production profile includes existing assets, Ahafo North and Yanacocha sulfides which remain subject to approval, resource conversion and high confidence inventory. See endnote re reserves
**Gold and GEO production assumptions as of December 8, 2020; see endnote re calculation of GEOs
***Includes Newmont’s ownership interest of 38.5% in Nevada Gold Mines (North America) and 40% in Pueblo Viejo (South America)

  2021 INVESTOR UPDATE                                                                                                                                                                                            NEWMONT CORPORATION          5
2021 Investor Update DECEMBER 8, 2020 - CREATING VALUE & IMPROVING LIVES THROUGH SUSTAINABLE AND RESPONSIBLE MINING
Creating Value and Improving Lives
2020 HIGHLIGHTS

  Protecting the wellbeing of our               Delivered superior operational     Right-sized portfolio with nine
   workforce and communities                      execution from a proven           world-class assets in top-tier
    throughout Covid response                         operating model                       jurisdictions

    Recognized as top gold miner                  Generated record financial        Delivered superior shareholder
    for ESG; achieved board gender            performance; $2.2B in attributable   returns and announced leading
      parity and set 2030+ climate             free cash flow* through Q3 2020           dividend framework
                 targets
*See endnote re attributable free cash flow

2021 INVESTOR UPDATE                                                                           NEWMONT CORPORATION   6
2021 Investor Update DECEMBER 8, 2020 - CREATING VALUE & IMPROVING LIVES THROUGH SUSTAINABLE AND RESPONSIBLE MINING
Foundation for 2021 and Longer-Term Outlook

 Applying Newmont rigor and discipline

 Conservative $1,200/oz gold price assumption*

 Increasing production & improving costs through 2025

 Tanami Expansion 2, Ahafo North and Yanacocha
  Sulfides included

 Musselwhite resumes full production

 Full Potential* value of >$300M in 2021

 Industry-leading dividend framework

 $500 million fund to support climate change targets

                                                                    Cripple Creek & Victor

*See slide 2 and endnotes regarding forward-looking statements.

 2021 INVESTOR UPDATE                                             NEWMONT CORPORATION        7
2021 Investor Update DECEMBER 8, 2020 - CREATING VALUE & IMPROVING LIVES THROUGH SUSTAINABLE AND RESPONSIBLE MINING
Applying Rigor and Discipline to Managing Covid-19

         Overcoming challenges            Wide-ranging controls                Focused on community
         with agility and resolve      continue across the business       resiliency through partnerships

                                                           Spotlight on Mexico

                                                           18         Testing centers

                                                                      56       Nurses in-country

                                           Peñasquito
                                                                            >50k Tests performed
         Placing the health, safety and wellbeing of our employees & communities above all else
2021 INVESTOR UPDATE                                                                    NEWMONT CORPORATION   8
2021 Investor Update DECEMBER 8, 2020 - CREATING VALUE & IMPROVING LIVES THROUGH SUSTAINABLE AND RESPONSIBLE MINING
Leading Approach to Climate Resiliency

                     Climate Commitments by 2030*

                         1. Absolute Emissions:
             30% reduction of combined emissions (Scope 1 & 2)

                        2. Emissions Intensity:
      30% reduction of combined emissions intensity (Scope 1 & 2)

                           3. Scope 3 Emissions:
              15% reduction from supply chain and partnerships

                 4. Electric Generation Emissions:
      10% replacement of fossil fuel-based with renewables-based

       Goal of achieving net zero emissions by 2050

 Registered under Science-based Target Initiative
  (SBTi), aligned with Paris Agreement
 Publishing inaugural Climate Strategy report in 2021
  aligned with the Task Force for Climate Related
  Financial Disclosures (TCFD)
                                                                                 Porcupine
*2030 target from 2018 baseline year

 2021 INVESTOR UPDATE                                               NEWMONT CORPORATION      9
2021 Investor Update DECEMBER 8, 2020 - CREATING VALUE & IMPROVING LIVES THROUGH SUSTAINABLE AND RESPONSIBLE MINING
Directing $500M to Climate Initiatives over 5 Years
  Renewable energy                Energy efficiency     Fuel switching               Carbon capture

PATHWAYS TO LOWER CARBON FOOTPRINT                     INITIATIVES UNDER CONSIDERATION

 Funds directed to support 2030 climate targets and    Solar and wind projects at Peñasquito, Ahafo,
  goal of net zero carbon emissions by 2050              Boddington and Cerro Negro
 Capital decisions integrated into new climate         Microgrid improvements at Merian, Porcupine and
  investment standard                                    Tanami
 Piloting new technologies                             Integrated energy data and metrics systems to drive
                                                         efficiency and performance

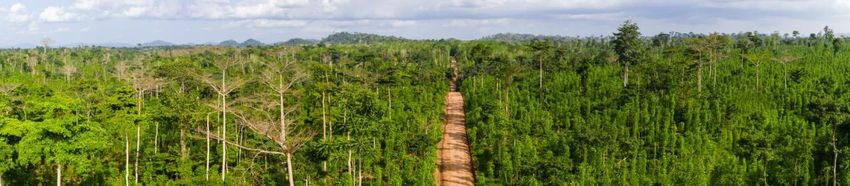
                                                                                        Reforestation near Akyem

2021 INVESTOR UPDATE                                                                     NEWMONT CORPORATION   10
Improving Margins and Investing in Our Future

    ATTRIBUTABLE PRODUCTION & AISC * (MOZ & $/OZ)
                                                                                                                                                                                                    6.2 – 7.0 million ounces
                                                                                                                                                                                                     per year through 2025* *
                                                                                                                                                                                          $1,500
       8.0
                         Total GEOs                                                                                                                                                                 Ahafo North and
                                                                                                                                                                                          $1,300     Yanacocha Sulfides
                                                                                                                                                                                                     ramping up in 2024
       7.0

                         AISC                                                                                                                                                             $1,100    Additional 1.2 – 1.6
                                                                                                                                                                                                     million gold equivalent
       6.0                                                                                                                                                                                           ounces (GEOs)** per year
                                                                                                                                                                                          $900
                                                                                                                                                                                                    Improving AISC to
                                                                                                                                                                                                     between $800 – $900/oz
       5.0
                                                                                                                                                                                          $700

       4.0                                                                                                                                                                                $500
                         2020E                       2021E                      2022E                       2023E                      2024E                       2025E

* AISC is a non-GAAP measure, see endnotes; outlook for CAS is $760/oz for 2020, $750/oz for 2021, $650/oz - $750/oz for 2022, $625/oz - $725/oz 2023, and $600 - $700/oz for 2024 and 2025
** See endnotes re Outlook and GEOs; attributable gold production includes the Company’s equity method investment in Pueblo Viejo (40%)

 2021 INVESTOR UPDATE                                                                                                                                                                                     NEWMONT CORPORATION   11
Full Potential Demonstrates Newmont’s Discipline
 >$3B OF VALUE DELIVERED SINCE 2014*
                                                                                            2020 PEÑASQUITO ACCOMPLISHMENTS
        Program engrained in Newmont's                                                      Delivered >$200M in Full Potential value over last 12 months
         operating model and culture
                                                                                             Debottlenecked Augmented Feed Circuit
        Delivering >$300M of value in 2021
                                                                                             Improved quality of crushed ore provided to the SAG mills
        2021 focus areas include:
                                                                                             Further optimized SAG mill tuning
              Advancing technology initiatives
                                                                                            2021 PEÑASQUITO FOCUS AREAS
              Expanding operational support
                                                                                               Sustaining mill throughput improvements
               networks
                                                                                               Improving flotation circuit performance
              Continuing total cost of ownership
                                                                                               Optimizing approach to processing harder ore in future years
              Integrating technical solutions

        Program refreshes in Australia and                                                 TONNES PROCESSED           GEO PRODUCTION               FLOTATION
         Africa

                                                                                                +18%                     +25%                    ~$10M
                                                                                                Improvement vs          Increase over 2020       Incremental value in
                                                                                                  baseline **                                           2021
*See endnote re Full Potential. **Baseline annual tonnes processed of 33.3M (2016 – 2018)

 2021 INVESTOR UPDATE                                                                                                                        NEWMONT CORPORATION        12
Project Pipeline to Sustain Production into 2040’s
                         7+ YEARS                4 TO 7 YEARS                  0 TO 3 YEARS                                     EXECUTION

                                                                                Yanacocha Sulfides                             Tanami Expansion 2
                                                                                                                               Australia – Gold
Definitive                                                                      Peru – Gold/Copper

Feasibility                                                                     Ahafo North                                    Goldrush Declines
                                                                                Ghana – Gold
                                                                                                                               (NGM JV)
                                                                                Pueblo Viejo Expansion JV                      USA – Gold
                                                                                Dominican Republic – Gold
                                                                                                                               Turquoise Ridge Shaft
                                                                                Pamour (Porcupine)                             (NGM JV)
                                                  Coffee
                          Galore Creek JV                                       Canada – Gold                                  USA – Gold
                                                  Canada – Gold
                          Canada – Gold/Copper

                                                  Akyem Underground
Prefeasibility/           Norte Abierto JV
                                                  Ghana – Gold

Feasibility               Chile – Gold/Copper
                                                  Oberon (Tanami)
                                                  Australia – Gold
                          Nueva Unión JV
                          Chile – Gold/Copper      Long Canyon Phase 2
                                                   (NGM JV)                                                   LEGEND*
                          Apensu Underground       USA – Gold
                                                                                                                    $1.0B Investment
                          (Ahafo)
                          Ghana – Gold
                                                                                                                    $500M - $1.0B Investment
                          CC&V Underground        Sabajo Extension (Merian)
Conceptual/               USA – Gold              Suriname – Gold
                                                                                                                         Greenfield                       Brownfield
Scoping                   Cerro Negro District
                                                  Subika Underground (Ahafo)
                          Expansions              Ghana – Gold
                                                                                                            *Attributable basis; JV projects not managed under Newmont investment system.
                                                                                                            Pueblo Viejo capital of ~$520M not reported in development capital outlook.
                          Argentina – Gold
  2021 INVESTOR UPDATE                                                                                                NEWMONT CORPORATION                                       13
World-Class Exploration in Top-Tier Jurisdictions
                                                                                                                                                      Exploration Investment**
                                                                          Coffee

                                                                       Galore Creek                                                                                          20%

                                                                                        Musselwhite                 Éléonore
                                                                                                                                                               $250M
                              Japan                                                                              Porcupine                                         in 2021
                                                               Nevada Gold Mines*
                                                                                                  CC&V                                                       80%

                                                                                   Peñasquito
                                                                                                    Mexico

                                                                                                                                                              Ethiopia
                                                                                                             Merian          Espérance        Akyem
                                                                                                                                         Ahafo
                                                                                                Yanacocha

    Tanami
                                                                                                         Andes
 Centralian
                                                                                                                                                                              LEGEND
Boddington                          Lachlan
                                                                                                                                                          LEGEND               Greenfield

    *Newmont’s ownership interest is 38.5% of Nevada Gold Mines                                                     Cerro Negro                                                Brownfield
    **On an attributable basis and includes both expense and capital

     2021 INVESTOR UPDATE                                                                                                                                 NEWMONT CORPORATION           14
Robust Near-Mine Exploration Opportunities
                            NORTH AMERICA
                                            Peñasquito: Large resource base and prospective land package with potential to
                                            extend mine life to 2040
                                            Éléonore: New district targets for 2021 with
Rob Atkinson
                CREATING VALUE & IMPROVING LIVES   CHIEF OPERATING OFFICER
                THROUGH SUSTAINABLE AND
                RESPONSIBLE MINING

2021 INVESTOR UPDATE                                        NEWMONT CORPORATION   16
Well-Positioned with Industry-Leading Portfolio

AUSTRALIA                       NORTH AMERICA                SOUTH AMERICA                 AFRICA                         NEVADA GOLD MINES
Growing Margins &               Unlocking Value              Investing in Future Growth    Investment to Deliver Record   (38.5%)
Production                                                                                 Performance

 Boddington sustains strong     Peñasquito delivers         Cerro Negro improves         Akyem extending life          Production of 1.2 - 1.4Moz
  mill performance; AHS to        higher grades and co-        production and costs          through next layback           through 2023
  extend life and lower costs     products                     from Full Potential          Production and cost
 Tanami continues as world-     Musselwhite resumes full    Merian delivering steady      improvements from
  class asset with >500Koz        operations with conveyor     production despite harder     Subika Underground SLS
  gold per year                   and materials handling       ore                          Ahafo North expands
 Tanami Expansion 2             Porcupine benefits from     Yanacocha focused on          existing footprint in
  secures future to 2040 and      higher grades from           leach operations,             Ghana and provides           PUEBLO VIEJO
  provides platform for           Borden                       developing first phase of     significant upside           (40%)
  growth                                                       Sulfides deposits             potential
                                 Éléonore improving costs
                                                                                                                           Production of 325 -
                                  and production
                                                                                                                            375Koz through 2023
                                 CC&V layback to extend
                                  mine life

             Delivering long-term value through superior operating model and technical capabilities
 2021 INVESTOR UPDATE                                                                                                     NEWMONT CORPORATION            17
Australia Growing Margins and Production

   ATTRIBUTABLE PRODUCTION & GOLD AISC * OUTLOOK (KOZ & $/OZ)
                                                                                                                                Boddington sustains improved mill
                                                                                                                                 throughput (40.5Mtpa); accessing
   2,000
                                                                                                                                 higher gold and copper grades in
                                                                                                                      $1,600     South Pit
   1,600                                                                                                                        Autonomous Haulage to reach
                                                                               1,400 - 1,500          1,400 - 1,500              commercial production in 2021
                                                                                                                      $1,200
                                                                    1,330
   1,200                                                                                                                        Tanami maintains production of
                               1,180
                                                                                                                                 >500Koz per year
                                $900
                                                                                                                      $800
       800                                                            $860
                                                                                                                                Tanami Expansion 2 to increase
                                                                                $650 - $750            $650 - $750               production and improve costs
       400                                                                                                            $400

           0                                                                                                          $0
                              2020E                                 2021E         2022E                  2023E
                                       Attributable Production                 Range           GEOs          AISC

*Non-GAAP measure, see endnote re AISC and slide 35 for regional CAS outlook

 2021 INVESTOR UPDATE                                                                                                                        NEWMONT CORPORATION     18
Tanami Growing Position as a World-Class Asset

OPERATIONAL EFFICIENCY IMPROVES MARGINS                                    TANAMI EXPANSION 2 BUILDING ON SOLID BASE
 Replicating successes & leveraging best practices                         Supports Tanami’s future as a long-life, low-cost producer

 Optimized mine plans, improved throughput & recovery                      Extends mine life beyond 2040 & provides platform for
                                                                             future growth
 Unlocking operational bottlenecks & reducing costs
                                                                            Increases annual gold production ~150Koz - 200Koz/year
 Step-change improvement from 2013 to 2023: AISC ~45%                       for first five years
  lower & production ~80% higher
                                                                            Improves operating costs by ~10%
INDICATIVE TANAMI PRODUCTION PROFILE (KOZS)
                                                                                                                          Tanami Expansion 2
800
                                                                                                                          Tanami Base
                                                                                                                          Actuals
600

400

200

  0
   2012      2013       2014   2015   2016   2017   2018   2019   2020   2021   2022   2023   2024   2025   2026   2027   2028      2029   2030

 2021 INVESTOR UPDATE                                                                                               NEWMONT CORPORATION           19
North America Unlocking Value

 ATTRIBUTABLE PRODUCTION & GOLD AISC OUTLOOK
                                                                                                         Peñasquito delivers higher gold
 (KOZ & $/OZ)
                                                                                                          grade & Full Potential improvements
 3,000                                                                                         $1,600     in 2021; stripping in Chile Colorado
                                                                                                          in 2022 produces higher silver & lead
                                                                                                          in 2023
 2,400
                                                                                               $1,400    Musselwhite ramping up to full
                                                                                                          production; reaching higher grade in
                                         1,760
 1,800                                                                                                    2022 & 2023 in PQ deeps
                   1,410                             1,450 - 1,550                             $1,200
                                                                              1,300 - 1,400
                                                                                                         Éléonore delivers steady production
 1,200                                                                                                    & improving costs while transitioning
                                                                                                          to lower mine levels in 2022
                                                                             $1,000 - $1,100   $1,000
   600                 $1,040                                                                            Porcupine increasing production
                                                    $900 - $1,000                                         with higher Borden grades through
                                         $915
                                                                                                          2022; Hollinger open pit ramping
      0                                                                                        $800       down in 2023
                   2020E                2021E          2022E                    2023E
                                                                                                         CC&V adding resource layback;
                          Attributable Production   Range            GEO's          AISC
                                                                                                          extends life to 2030+

2021 INVESTOR UPDATE                                                                                                    NEWMONT CORPORATION      20
South America Investing in Future Growth

   ATTRIBUTABLE PRODUCTION * & GOLD AISC OUTLOOK
   (KOZ & $/OZ)                                                                                                                                    Cerro Negro delivering Full Potential
                                                                                                                                                    mine productivity improvements
                                                                                                                                         $1,500     including higher development rates
   1,200
                                                                                                       1,050 - 1,150
                                                                                                                                                   Cerro Negro primarily mining from
                               1,135
                                                                      1,075
                                                                                                                         1,000 - 1,100   $1,200     Marianas & Emilia while developing
                                                                                                                                                    Eastern Districts
                               $1,105
      800                                                           $1,035                                                                         Merian delivers steady production &
                                                                                                                         $950 - $1,050   $900
                                                                                                       $900 - $1,000
                                                                                                                                                    costs despite mining harder rock

                                                                                                                                         $600      Yanacocha developing first phase of
                                                                                                                                                    Sulfides deposits; transitioning to
      400
                                                                                                                                                    primarily leach-only operations in
                                                                                                                                         $300       2021

          0                                                                                                                              $0
                              2020E                                 2021E                                 2022E               2023E
                                                    Attributable Production                                 Range      AISC

* Attributable gold production includes the Company’s equity method investment in Pueblo Viejo (40%)

 2021 INVESTOR UPDATE                                                                                                                                             NEWMONT CORPORATION       21
Yanacocha Sulfides Advances Towards 2021 Approval

   INDICATIVE YANACOCHA PRODUCTION PROFILE *                                                                                                                  First phase focuses on Yanacocha
   (GEO ** KOZS, 100%)                                                                                                                                         Verde and Chaquicocha deposits to
                                                                                                                                                               profitably extend Yanacocha
    800                                                                                                                                                        operations beyond 2040
    700
                                                                                                                                                              Decision to proceed expected in
    600                                                                                                                                                        2021 with three year development
                                                                                                                                                               schedule
    500
                                                                                                                                                              ~$2B investment for incremental
    400
                                                                                                                                                               average production of ~500kGEO’s
    300                                                                                                                                                        per year for the first five full years
                                                                                                                                                               (2026-2030)
    200
                                                                                                                                                              First five year average CAS of $500-
    100
                                                                                                                                                               $600/GEO and AISC of $700-
       -                                                                                                                                                       $800/GEO (2026-2030)

                                                                                                                                                              Second and third phases could
                  Gold Production (Base)                                                          Gold Production (Sulfides*)                                  further extend mine life for multiple
                  Copper Co-Product GEOs** (Sulfides*)                                            Silver By-Product GEOs** (Sulfides*)                         decades
*Not yet approved but included in outlook. See endnote re Outlook.
** Copper represented as a co-product (included in production) and silver represented as a by-product (offset to CAS). See endnote re calculation of GEOs.

 2021 INVESTOR UPDATE                                                                                                                                                        NEWMONT CORPORATION        22
Africa Investment to Deliver Record Performance

 ATTRIBUTABLE PRODUCTION & GOLD AISC OUTLOOK
 (KOZ & $/OZ)                                                                                       Akyem delivering higher production
                                                                                                     & improved costs in 2021 ahead of
                                                                                          $1,500     stripping campaign in 2022
 1,200
                                                                          1,100 - 1,200             Akyem improves value with
                                                        1,000 – 1,100                     $1,200     additional layback to extend life
                                       915
                       850                                                                          Ahafo reaching higher grades in
   800                                                                                    $900       Subika open pit in 2021and Subika
                                                        $900 - $1,000
                       $870           $900
                                                                          $800 - $900
                                                                                                     UG in 2022

                                                                                          $600      Subika UG SLS ramping up to
                                                                                                     improve production & costs through
   400
                                                                                                     2023+
                                                                                          $300
                                                                                                    Expanding world class Ahafo district
                                                                                                     with Ahafo North in 2023
      0                                                                                   $0
                   2020E             2021E                 2022E               2023E
                              Attributable Production        Range      AISC

2021 INVESTOR UPDATE                                                                                               NEWMONT CORPORATION      23
Ahafo North – Best Unmined Deposit in West Africa

   INDICATIVE AHAFO NORTH PRODUCTION PROFILE (KOZS)                                                   Open pit mine, stand-alone mill for
                                                                                                       processing 3.5Mozs of Reserve and
                                                                                                       1.0Mozs of Resource*
   1,600
                                                                                                      Full funds decision expected 2021
   1,400
                                                                                                      Investment of $700-$800M with
   1,200
                                                                                                       three year development timeline
   1,000
                                                                                                      Incremental 250,000ozs/yr over 13
     800                                                                                               year mine life with ~300,000ozs/yr
     600
                                                                                                       for first five years (2024-2028)

     400                                                                                              First five year CAS of $450-$550/oz
                                                                                                       and AISC of $600-$700/oz (2024-
     200                                                                                               2028)
         0
                                                                                                      Mineralization is open in all
                                                                                                       directions along 14km strike with
                                  Actuals           Ahafo South Base Case   Ahafo North Base Case*
                                                                                                       significant upside potential

*Not yet approved but included in outlook. See endnote re Outlook. .

 2021 INVESTOR UPDATE                                                                                               NEWMONT CORPORATION      24
Nevada Gold Mines (38.5%)

 ATTRIBUTABLE PRODUCTION & GOLD AISC OUTLOOK
 (KOZ & $/OZ)
      1,600                                                                                          $1,500

                                                                                 1,300 - 1,400
                        1,375       1,370                                                            $1,200
                                                          1,200 - 1,300
      1,200

                                     $960                                                            $900
                                                          $900 - $1,000
                       $880                                                      $850 - $950
        800

                                                                                                     $600

        400
                                                                                                     $300

           0                                                                                         $0
                       2020E        2021E                    2022E                 2023E
                                Attributable Production    Range          AISC

2021 INVESTOR UPDATE                                                                             NEWMONT CORPORATION   25
Nancy Buese
                CREATING VALUE & IMPROVING LIVES   CHIEF FINANCIAL OFFICER
                THROUGH SUSTAINABLE AND
                RESPONSIBLE MINING

2021 INVESTOR UPDATE                                       NEWMONT CORPORATION   26
Investing in Our Future and Reducing Support Costs

    Consolidated capital & expense outlook (+/-5%)                                                                                 2020E                                                         2021E
    Sustaining Capital ($M)                                                                                                           900                                                        1,000
    Development Capital ($M)                                                                                                          475                                                          900
    Exploration & Advanced Projects ($M)                                                                                              350                                                          390
    G&A ($M)                                                                                                                          265                                                          260
    Interest expense ($M)                                                                                                             300                                                          275
    DD&A ($M)                                                                                                                       2,250                                                        2,500
    Adjusted tax rate                                                                                                         38% – 42%*                                                    34% – 38%*
   *Assuming average gold price of $1,400 per ounce for 2020 and $1,500 per ounce for 2021. 2020 federal tax rate of 29-33% and mining taxes of 8-10%; 2021 federal tax rate of 27-30% and mining taxes of 6-9%.

2021 INVESTOR UPDATE                                                                                                                                                                              NEWMONT CORPORATION   27
Superior Free Cash Flow Generation Across Cycles
ATTRIBUTABLE FREE CASH FLOW INCREASES WITH HIGHER GOLD PRICE*
(INCREMENTAL FROM $1,200 BASE)

                                                                                                                                                                                                                                      ~$21.5B
                                                                                                                                                                                                                                       +$3,600M

                                                                                                                                                                       ~$15.5B
                                                                                                                                                                         +$2,400M

                                                                                                   ~$9.5B
                                                                                                  +$1,200M

                              ~$3.5B

                                                                                                   (+171%)                                                                (+343%)                                                       (+514%)

                                $1,200                                                               $1,500                                                              $1,800                                                        $2,100
                                                                                       5 Year Cumulative Attributable Free Cash Flow**
 *Free Cash Flow assumptions as of December 8, 2020; **$1,200 gold price base generates ~$3.5 billion of Free Cash Flow from our five-year outlook. Includes impacts from approved projects and Ahafo North and Yanacocha Sulfides.
See endnotes re outlook, Free Cash Flow, Attributable Free Cash Flow and Dividends.

 2021 INVESTOR UPDATE                                                                                                                                                                                                             NEWMONT CORPORATION   28
Disciplined Capital Allocation Priorities
RESILIENT AND FLEXIBLE CAPITAL STRUCTURE ACROSS CYCLES

                           INVESTING IN                                                                                    RETURNING CASH                                MAINTAINING
                           ORGANIC GROWTH                                                                                  TO SHAREHOLDERS                               FINANCIAL FLEXIBILITY

 Sustaining capital of ~$1B per year                                                            Industry-leading dividend and                                Liquidity of $7.8B and cash position
                                                                                                  framework                                                     of $4.8B
 Average attributable development
  capital of $600 to $800M per year                                                              Completed $1B 2020 share-                                    Net debt to adjusted EBITDA** ratio of
 Exploration & advanced projects                                                                 repurchase program at ~$45 per                                0.4x
  investment of ~$400M per year                                                                   share
                                                                                                                                                               Credit rating upgraded by Moody’s;
                                                                                                 On track to return >$2.7B through                             positive outlook with S&P
                                                                                                  dividends and share buybacks in
                                                                                                  2019 and 2020*

*See endnote re returns to shareholders and cautionary statement; returns include dividends and share repurchases **See slide 43 for additional information

 2021 INVESTOR UPDATE                                                                                                                                                           NEWMONT CORPORATION      29
Industry-leading Dividend Framework
 Leading $1.00/share sustainable base dividend                                                                                          ANNUALIZED DIVIDEND PAYOUT

 Targeting 40% – 60% of incremental attributable Free                                                                                                                            $2.80 - $3.70
  Cash Flow above $1,200/oz returned to shareholders
 Evaluating gold price increments of approximately
  $300/oz                                                                                                                                                  $2.20 - $2.80

 Targeting stability and predictability
 Approved quarterly by Board of Directors
                                                                                                                                           $1.60 - $1.90
                 Annualized dividend payout framework*
                       $1.00/share sustainable base dividend
                                      (payable at $1,200/oz gold price)

                         + $0.60/share incremental payment
                      (Q3 2020 dividend set assuming ~40% of incremental
                            attributable FCF at $1,500/oz gold price)                                                                          $1.00           $1.00                  $1.00
               = $1.60/share annualized dividend payout*

*Investors are reminded that Newmont’s divided framework is non-binding and an annualized dividend has not been declared by the Board.
Dividends beyond the third quarter dividend remain subject to future consideration and declaration in the discretion of the Board. See
                                                                                                                                            $1,500/oz        $1,800/oz              $2,100/oz
endnote re dividends and returns to shareholders.

 2021 INVESTOR UPDATE                                                                                                                                                      NEWMONT CORPORATION    30
Tom Palmer
                CREATING VALUE & IMPROVING LIVES   PRESIDENT & CHIEF EXECUTIVE OFFICER
                THROUGH SUSTAINABLE AND
                RESPONSIBLE MINING

2021 INVESTOR UPDATE                                                   NEWMONT CORPORATION   31
The World’s Leading Gold Company
#1 gold producer with ~8M GEOs/yr through
  2030 and significant exposure to other metals

Industry’s best portfolio of world-class
  assets in top-tier jurisdictions

Recognized sustainability leader committed
  to creating value and improving lives

Proven operating model and deep bench of
  experienced leaders with strong track record

Strong Free Cash Flow generation with
  significant leverage to rising gold prices

Focused on industry-leading returns to
  shareholders with disciplined capital
  allocation through the cycle

2021 INVESTOR UPDATE                              NEWMONT CORPORATION   32
Questions

2021 INVESTOR UPDATE   NEWMONT CORPORATION   33
Free Cash Flow Sensitivities*

                                                                                                                                                                                FCF
                                                                          Price                                           Change                                                                                 Attributable FCF ($M)
                                                                                                                                                                               ($M)
Gold ($/oz)                                                              $1,200                                            +$100                                             +$415                                             +$400
Australian Dollar                                                         $0.75                                            -$0.05                                              +$45                                              +$45
Canadian Dollar                                                           $0.77                                            -$0.05                                              +$30                                              +$30
Zinc ($/lb)                                                               $1.05                                            +$0.10                                              +$30                                              +$30
Oil ($/bbl)                                                                 $50                                              -$10                                              +$20                                              +$15
Silver ($/oz)                                                            $22.00                                            +$1.00                                              +$15                                              +$15
Lead ($/lb)                                                               $0.90                                            +$0.10                                              +$10                                              +$10
Copper ($/lb)                                                             $2.75                                            +$0.25                                              +$15                                              +$15
 *All other variables held constant (i.e. Free Cash Flow for flexed gold price does not include changes to other economic assumptions); assuming a 35% incremental tax rate. Included within the attributable free cash flow sensitivity is a royalty impact
 of approximately $20 million (or $3/oz) for every $100 per ounce change in gold price.

2021 INVESTOR UPDATE                                                                                                                                                                                          NEWMONT CORPORATION                          34
2021 Regional Guidance

                                                                                                                                          Attributable          Attributable
                       *
2021 Outlook metric                               Attributable                                     CAS                            AISC     sustaining           development
                                                          **
(+/- 5%)                                       production (Moz)                                   ($/oz)                         ($/oz)      capital               capital
                                                                                                                                              ($M)                  ($M)

North America                                               1.76                                   $730                          $915        $300                    $25

South America                                               1.08                                   $850                          $1,035      $100                   $150

Australia                                                   1.33                                   $650                          $860        $235                   $400

Africa                                                      0.92                                   $715                          $900        $115                   $160

Nevada Gold Mines                                           1.37                                   $760                          $960        $210                   $130

Newmont                                                     6.50                                   $750                          $970        $950                   $850
 *See endnote re outlook ** Attributable gold production includes the Company’s equity method investment in Pueblo Viejo (40%)
2021 INVESTOR UPDATE                                                                                                                                     NEWMONT CORPORATION   35
Five Year Cost and Production Outlook

Guidance metric (+/- 5%)                                              2021E                                     2022E                                    2023E          2024E                    2025E
                        *
Gold production (Mozs)                                                  6.5                                   6.2 – 6.7                                 6.2 – 6.7      6.5 – 7.0                6.5 – 7.0
                                    **
Other metal production (Mozs)                                           1.3                                   1.2 – 1.4                                 1.4 – 1.6      1.4 – 1.6                1.4 – 1.6

Total GEO production (Mozs)                                             7.8                                   7.5 – 8.0                                 7.7 – 8.2      8.0 – 8.5                8.0 – 8.5

CAS*** ($/oz)                                                          $750                                $650 – $750                               $625 –$725      $600 – $700              $600 – $700

AISC*** ($/oz)                                                         $970                                $850 – $950                               $825 –$925      $800 – $900              $800 – $900
                            *
Sustaining capital ($M)                                                $950                               $900 – $1,100                             $900 – $1,100   $900 – $1,100             $900 – $1,100
                                *
Development capital ($M)                                               $850                              $1,000 – $1,200                            $900 – $1,100    $200 – $400              $100 – $300
                   *
Total capital ($M)                                                   $1,800                              $2,000 – $2,200                          $1,900 – $2,100   $1,200 – $1,400          $1,100 – $1,300
*Attributable basis; **Attributable co-product gold equivalent ounces; includes copper, zinc, silver and lead; ***Consolidated basis for gold; ****See endnotes

 2021 INVESTOR UPDATE                                                                                                                                                           NEWMONT CORPORATION         36
2021 Outlooka by Region
                                                                                                                                 Consolidated             Consolidated              Attributable            Attributable
                                                                                                      Consolidated All-            Sustaining             Development                 Sustaining            Development
                                     Consolidated        Attributable                                   in Sustaining                Capital                   Capital                  Capital                  Capital
                                                                                                                     b
2021 Outlook +/- 5%                   Production          Production        Consolidated CAS                 Costs               Expenditures             Expenditures              Expenditures             Expenditures
                                    (Koz, GEOs Koz)     (Koz, GEOs Koz)             ($/oz)                   ($/oz)                    ($M)                     ($M)                     ($M)                     ($M)
North America                           1,760               1,760                    730                      915                      300                        25                      300                       25
South America                           1,000               1,075                    850                     1,035                     125                       200                      100                      150
Australia                               1,330               1,330                    650                      860                      235                       400                      235                      400
Africa                                   915                 915                     715                      900                      115                       160                      115                      160
                            c
Nevada Gold Mines                       1,370               1,370                     760                      960                      210                      130                      210                      130
             d                                                                                                                                e                                                 e
Total Gold                              6,400               6,500                    750                      970                      1000                      900                      950                      850

                       f
Total Co-products                       1,300               1,300                    600                      880

                                                                 a)    2021 outlook projections used in this presentation are considered forward-looking statements and represent management’s good faith estimates or
                                                                       expectations of future production results as of December 8, 2020. Outlook is based upon certain assumptions, including, but not limited to, metal prices, oil
2021 Consolidated Expense Outlook ($M) +/-5%                           prices, certain exchange rates and other assumptions. For example, 2021 Outlook assumes $1,200/oz Au, $22/oz Ag, $2.75/lb Cu, $1.05/lb Zn, $0.90/lb Pb, $0.75
General and Administrative                       260                   USD/AUD exchange rate, $0.77 USD/CAD exchange rate and $50/barrel WTI; AISC and CAS estimates do not include inflation, for the remainder of the year.
                                                                       Production, CAS, AISC and capital estimates exclude projects that have not yet been approved, except for Ahafo North and Yanacocha Sulfides which are
Interest Expense                                 275                   included in Outlook as the development projects are expected to reach execution stage in 2021. The potential impact on inventory valuation as a result of lower
                                                                       prices, input costs, and project decisions are not included as part of this Outlook. Assumptions used for purposes of Outlook may prove to be incorrect and
Depreciation and Amortization                   2,500                  actual results may differ from those anticipated, including variation beyond a +/-5% range. Outlook cannot be guaranteed. As such, investors are cautioned not
                                                                       to place undue reliance upon Outlook and forward-looking statements as there can be no assurance that the plans, assumptions or expectations upon which
Exploration and Advanced Projects                390                   they are placed will occur. Amounts may not recalculate to totals due to rounding. See cautionary at the beginning of this presentation.
                           g,h
Adjusted Tax Rate                           34%-38%              b)    All-in sustaining costs or AISC as used in the Company’s Outlook is a non-GAAP metric; see below for further information and reconciliation to consolidated
                                                                       2021 CAS outlook.
                   h
Federal Tax Rate                            27%-30%              c)    Represents the ownership interest in the Nevada Gold Mines (NGM) joint venture. NGM is owned 38.5% by Newmont and owned 61.5% and operated by
                                                                       Barrick. The Company accounts for its interest in NGM using the proportionate consolidation method, thereby recognizing its pro-rata share of the assets,
Mining Tax Rate h                               6%-9%                  liabilities and operations of NGM. Production, CAS & AISC for the Company’s 38.5 percent ownership interest in NGM as provided by Barrick Gold Corporation
                                                                       based on a $1,200/oz gold price assumption.
                                                                 d)    Attributable gold production outlook includes the Company’s equity investment (40%) in Pueblo Viejo with ~325oz in 2021; does not include the Company’s
                                                                       other equity investments. Attributable gold production outlook represents the Company’s 51.35% interest for Yanacocha and a 75% interest for Merian.
                                                                 e)    Total sustaining capital includes ~$20 million of corporate and other spend.
                                                                 f)    Gold equivalent ounces (GEO) is calculated as pounds or ounces produced multiplied by the ratio of the other metal’s price to the gold price, using Gold
                                                                       ($1,200/oz.), Copper ($2.75/lb.), Silver ($22/oz.), Lead ($0.90/lb.), and Zinc ($1.05/lb.) pricing.
                                                                 g)    The adjusted tax rate excludes certain items such as tax valuation allowance adjustments.
                                                                 h)    Assuming average prices of $1,500 per ounce for gold, $22 per ounce for silver, $2.75 per pound for copper, $0.90 per pound for lead, and $1.05 per pound for
                                                                       zinc and achievement of current production and sales volumes and cost estimates, we estimate our consolidated adjusted effective tax rate related to
                                                                       continuing operations for 2021 will be between 34%-38%.
2021 INVESTOR UPDATE                                                                                                                                                                 NEWMONT CORPORATION                          37
2021 Site Outlooka as of December 8, 2020
                                                                                                         Consolidated   Consolidated   a)   2021 outlook projections shown above are considered forward-looking statements and represent
                                                                                     Consolidated All-    Sustaining    Development         management’s good faith estimates or expectations of future production results as of December 8,
                                    Consolidated   Attributable                        in Sustaining        Capital        Capital
                                                                                                                                            2020. Outlook is based upon certain assumptions, including, but not limited to, metal prices, oil
                                                                                                  b                                         prices, certain exchange rates and other assumptions. For example, 2021 Outlook assumes
                                     Production     Production    Consolidated CAS        Costs          Expenditures   Expenditures
                                                                                                                                            $1,200/oz gold, $22/oz silver, $2.75/lb copper, $1.05/lb zinc, $0.90/lb lead, $0.75 USD/AUD exchange
                                        (Koz)          (Koz)           ($/oz)             ($/oz)            ($M)           ($M)
                                                                                                                                            rate, $0.77 USD/CAD exchange rate and $50/barrel WTI; AISC and CAS estimates do not include
                                                                                                                                            inflation, for the remainder of the year. Production, CAS, AISC and capital estimates exclude projects
CC&V                                    260            260              865               1,000               25            —               that have not yet been approved, except for Ahafo North and Yanacocha Sulfides which are included
Éléonore                                270            270              825               1,040               45            —               in Outlook as the development projects are expected to reach execution stage in 2021. The potential
Peñasquito                              660            660              575                750               155            —               impact on inventory valuation as a result of lower prices, input costs, and project decisions are not
Porcupine                               360            360              785                940                35            25              included as part of this Outlook. Assumptions used for purposes of Outlook may prove to be
Musselwhite                             200            200              855               1,100               40            —               incorrect and actual results may differ from those anticipated, including variation beyond a +/-5%
                                                                                                                                            range. Outlook cannot be guaranteed. As such, investors are cautioned not to place undue reliance
Other North America
                                                                                                                                            upon Outlook and forward-looking statements as there can be no assurance that the plans,
                                                                                                                                            assumptions or expectations upon which they are placed will occur. Amounts may not recalculate to
Cerro Negro                             270            270              775                975               50              75             totals due to rounding. See cautionary at the beginning of this presentation.
Yanacochac                              315            160             1,050              1,350              25             125        b)   All-in sustaining costs or AISC as used in the Company’s Outlook is a non-GAAP metric; see below for
         c
Merian                                  425            320              725                855               50              —              further information and reconciliation to consolidated 20201 CAS outlook.
Pueblo Viejo                            —              325              —                   —                —              —          c)   Consolidated production for Yanacocha and Merian is presented on a total production basis for the
Other South America                                                                                                                         mine site; attributable production represents a 51.35% interest for Yanacocha and a 75% interest for
                                                                                                                                            Merian.
                                                                                                                                       d)   Represents the ownership interest in the Nevada Gold Mines (NGM) joint venture. NGM is owned
Boddington                              830            830              735                915               145             50
                                                                                                                                            38.5% by Newmont and owned 61.5% and operated by Barrick. The Company accounts for its
Tanami                                  500            500              515                725                85            350
                                                                                                                                            interest in NGM using the proportionate consolidation method, thereby recognizing its pro-rata
Other Australia                                                                                               5                             share of the assets, liabilities and operations of NGM.
                                                                                                                                       e)   Gold equivalent ounces (GEO) is calculated as pounds or ounces produced multiplied by the ratio of
Ahafo                                   515            515              800                990               80              40             the other metal’s price to the gold price, using Gold ($1,200/oz.), Copper ($2.75/lb.), Silver ($22/oz.),
Akyem                                   400            400              600                765               35              10             Lead ($0.90/lb.), and Zinc ($1.05/lb.) pricing.
Ahafo North                              —              —                —                  —                —              115
Other Africa

Nevada Gold Minesd                     1,370          1,370             760                960               210            130

Corporate/Other                                                                                              20

Peñasquito - Co-products (GEO)e        1,120          1,120             575                825
                                e
Boddington - Co-product (GEO)           180            180              765                990

Peñasquito - Zinc (Mlbs)                475            475
Peñasquito - Lead (Mlbs)                190            190
Peñasquito - Silver (Moz)                30             30
Boddington - Copper (Mlbs)               80             80

 2021 INVESTOR UPDATE                                                                                                                                                                               NEWMONT CORPORATION                             38
Longer-term Outlooka
 Outlook                                                                                         2021E (+/- 5%)                        2022E                            2023E                            2024E                            2025E
 Attributable Production (koz)                                                                       6,500                          6,200 - 6,700                    6,200 - 6,700                    6,500 - 7,000                    6,500 - 7,000
 Attributable Co-products (GEOs Koz)                                                                 1,300                          1,200 - 1,400                    1,400 - 1,600                    1,400 - 1,600                    1,400 - 1,600
 Consolidated Gold CAS ($/oz)                                                                         750                             650 - 750                        625 - 725                        600 - 700                        600 - 700
 Consolidated Gold All-in Sustaining Costs ($/oz)                                                     970                             850 - 950                        825 - 925                        800 - 900                        800 - 900
 Attributable Sustaining Capital Expenditures ($M)                                                    950                            900 - 1,100                      900 - 1,100                      900 - 1,100                      900 - 1,100
 Attributable Development Capital Expenditures ($M)                                                   850                           1,000 - 1,200                     900 - 1,100                       200 - 400                        100 - 300
 Consolidated Sustaining Capital Expenditures ($M)                                                   1,000                           900 - 1,100                      900 - 1,100                      900 - 1,100                      900 - 1,100
 Consolidated Development Capital Expenditures ($M)                                                   900                           1,300 - 1,500                    1,200 - 1,400                      400 - 600                        100 - 300

a)   2021 outlook projections used in this presentation are considered forward-looking statements and represent management’s good faith estimates or expectations of future production results as of December 8, 2020. Outlook is based upon certain
     assumptions, including, but not limited to, metal prices, oil prices, certain exchange rates and other assumptions. For example, 2021 Outlook assumes $1,200/oz Au, $22/oz Ag, $2.75/lb Cu, $1.05/lb Zn, $0.90/lb Pb, $0.75 USD/AUD exchange rate,
     $0.77 USD/CAD exchange rate and $50/barrel WTI; AISC and CAS estimates do not include inflation, for the remainder of the year. Production, CAS, AISC and capital estimates exclude projects that have not yet been approved, except for Ahafo
     North and Yanacocha Sulfides which are included in Outlook as the development projects are expected to reach execution stage in 2021. The potential impact on inventory valuation as a result of lower prices, input costs, and project decisions are
     not included as part of this Outlook. Assumptions used for purposes of Outlook may prove to be incorrect and actual results may differ from those anticipated, including variation beyond a +/-5% range. Outlook cannot be guaranteed. As such,
     investors are cautioned not to place undue reliance upon Outlook and forward-looking statements as there can be no assurance that the plans, assumptions or expectations upon which they are placed will occur. Amounts may not recalculate to
     totals due to rounding. See cautionary at the beginning of this presentation.
b)   All-in sustaining costs or AISC as used in the Company’s Outlook is a non-GAAP metric; see below for further information and reconciliation to consolidated 2021 CAS outlook.
c)   Represents the ownership interest in the Nevada Gold Mines (NGM) joint venture. NGM is owned 38.5% by Newmont and owned 61.5% and operated by Barrick. The Company accounts for its interest in NGM using the proportionate consolidation
     method, thereby recognizing its pro-rata share of the assets, liabilities and operations of NGM.
d)   Attributable gold production outlook includes the Company’s equity investment (40%) in Pueblo Viejo with ~325Koz in 2021; does not include the Company’s other equity investments.
e)   Gold equivalent ounces (GEO) is calculated as pounds or ounces produced multiplied by the ratio of the other metal’s price to the gold price, using Gold ($1,200/oz.), Copper ($2.75/lb.), Silver ($22/oz.), Lead ($0.90/lb.), and Zinc ($1.05/lb.) pricing.

 2021 INVESTOR UPDATE                                                                                                                                                                                             NEWMONT CORPORATION                           39
All-in Sustaining Costs
Newmont has developed a metric that expands on GAAP measures, such as cost of goods sold, and non-GAAP measures, such as costs applicable to sales per ounce, to provide visibility into the economics of our mining operations related to expenditures, operating
performance and the ability to generate cash flow from our continuing operations.

Current GAAP measures used in the mining industry, such as cost of goods sold, do not capture all of the expenditures incurred to discover, develop and sustain production. Therefore, we believe that all-in sustaining costs is a non-GAAP measure that provides additional
information to management, investors and analysts that aid in the understanding of the economics of our operations and performance compared to other producers and provides investors visibility by better defining the total costs associated with production.

All-in sustaining cost (“AISC”) amounts are intended to provide additional information only and do not have any standardized meaning prescribed by GAAP and should not be considered in isolation or as a substitute for measures of performance prepared in accordance
with GAAP. The measures are not necessarily indicative of operating profit or cash flow from operations as determined under GAAP. Other companies may calculate these measures differently as a result of differences in the underlying accounting principles, policies applied
and in accounting frameworks such as in International Financial Reporting Standards (“IFRS”), or by reflecting the benefit from selling non-gold metals as a reduction to AISC. Differences may also arise related to definitional differences of sustaining versus development (i.e.
non-sustaining) activities based upon each company’s internal policies.

The following disclosure provides information regarding the adjustments made in determining the all-in sustaining costs measure:

Costs applicable to sales. Includes all direct and indirect costs related to current production incurred to execute the current mine plan. We exclude certain exceptional or unusual amounts from Costs applicable to sales (“CAS”), such as significant revisions to recovery
amounts. CAS includes by-product credits from certain metals obtained during the process of extracting and processing the primary ore-body. CAS is accounted for on an accrual basis and excludes Depreciation and amortization and Reclamation and remediation, which is
consistent with our presentation of CAS on the Condensed Consolidated Statements of Operations. In determining AISC, only the CAS associated with producing and selling an ounce of gold is included in the measure. Therefore, the amount of gold CAS included in AISC is
derived from the CAS presented in the Company’s Condensed Consolidated Statements of Operations less the amount of CAS attributable to the production of other metals at our Peñasquito and Boddington mines. The other metals CAS at those mine sites is disclosed in
Note 4 to the Condensed Consolidated Financial Statements. The allocation of CAS between gold and other metals at the Peñasquito and Boddington mines is based upon the relative sales value of gold and other metals produced during the period.

Reclamation costs. Includes accretion expense related to reclamation liabilities and the amortization of the related Asset Retirement Cost (“ARC”) for the Company’s operating properties. Accretion related to the reclamation liabilities and the amortization of the ARC assets
for reclamation does not reflect annual cash outflows but are calculated in accordance with GAAP. The accretion and amortization reflect the periodic costs of reclamation associated with current production and are therefore included in the measure. The allocation of
these costs to gold and other metals is determined using the same allocation used in the allocation of CAS between gold and other metals at the Peñasquito and Boddington mines.

Advanced projects, research and development and exploration. Includes incurred expenses related to projects that are designed to sustain current production and exploration. We note that as current resources are depleted, exploration and advanced projects are necessary
for us to replace the depleting reserves or enhance the recovery and processing of the current reserves to sustain production at existing operations. As these costs relate to sustaining our production, and are considered a continuing cost of a mining company, these costs
are included in the AISC measure. These costs are derived from the Advanced projects, research and development and Exploration amounts presented in the Condensed Consolidated Statements of Operations less incurred expenses related to the development of new
operations, or related to major projects at existing operations where these projects will materially benefit the operation in the future. The allocation of these costs to gold and other metals is determined using the same allocation used in the allocation of CAS between gold
and other metals at the Peñasquito and Boddington mines.

General and administrative. Includes costs related to administrative tasks not directly related to current production, but rather related to support our corporate structure and fulfill our obligations to operate as a public company. Including these expenses in the AISC metric
provides visibility of the impact that general and administrative activities have on current operations and profitability on a per ounce basis.

Other expense, net. We exclude certain exceptional or unusual expenses from Other expense, net, such as restructuring, as these are not indicative to sustaining our current operations. Furthermore, this adjustment to Other expense, net is also consistent with the nature of
the adjustments made to Net income (loss) attributable to Newmont stockholders as disclosed in the Company’s non-GAAP financial measure Adjusted net income (loss). The allocation of these costs to gold and other metals is determined using the same allocation used in the
allocation of CAS between gold and other metals at the Peñasquito and Boddington mines

Treatment and refining costs. Includes costs paid to smelters for treatment and refining of our concentrates to produce the salable metal. These costs are presented net as a reduction of Sales on our Condensed Consolidated Statements of Operations. The allocation of
these costs to gold and other metals is determined using the same allocation used in the allocation of CAS between gold and other metals at the Peñasquito and Boddington mines.

Sustaining capital and finance lease payments. We determined sustaining capital and finance lease payments as those capital expenditures and finance lease payments that are necessary to maintain current production and execute the current mine plan. We determined
development (i.e. non-sustaining) capital expenditures and finance lease payments to be those payments used to develop new operations or related to projects at existing operations where those projects will materially benefit the operation and are excluded from the
calculation of AISC. The classification of sustaining and development capital projects and finance leases is based on a systematic review of our project portfolio in light of the nature of each project. Sustaining capital and finance lease payments are relevant to the AISC
metric as these are needed to maintain the Company’s current operations and provide improved transparency related to our ability to finance these expenditures from current operations. The allocation of these costs to gold and other metals is determined using the same
allocation used in the allocation of CAS between gold and other metals at the Peñasquito and Boddington mines.

 2021 INVESTOR UPDATE                                                                                                                                                                                                            NEWMONT CORPORATION                              40
Free Cash Flow
Management uses Free Cash Flow as a non-GAAP measure to analyze cash flows generated from operations. Free Cash Flow is Net cash provided by (used in) operating activities less Net cash provided by (used in)
operating activities of discontinued operations less Additions to property, plant and mine development as presented on the Condensed Consolidated Statements of Cash Flows. The Company believes Free Cash
Flow is also useful as one of the bases for comparing the Company’s performance with its competitors. Although Free Cash Flow and similar measures are frequently used as measures of cash flows generated
from operations by other companies, the Company’s calculation of Free Cash Flow is not necessarily comparable to such other similarly titled captions of other companies.

The presentation of non-GAAP Free Cash Flow is not meant to be considered in isolation or as an alternative to net income as an indicator of the Company’s performance, or as an alternative to cash flows from
operating activities as a measure of liquidity as those terms are defined by GAAP, and does not necessarily indicate whether cash flows will be sufficient to fund cash needs. The Company’s definition of Free
Cash Flow is limited in that it does not represent residual cash flows available for discretionary expenditures due to the fact that the measure does not deduct the payments required for debt service and other
contractual obligations or payments made for business acquisitions. Therefore, the Company believes it is important to view Free Cash Flow as a measure that provides supplemental information to the
Company’s Condensed Consolidated Statements of Cash Flows.

The following table sets forth a reconciliation of Free Cash Flow, a non-GAAP financial measure, to Net cash provided by (used in) operating activities, which the Company believes to be the GAAP financial measure
most directly comparable to Free Cash Flow, as well as information regarding Net cash provided by (used in) investing activities and Net cash provided by (used in) financing activities.

                                                                                                      Three Months Ended                    Nine Months Ended
                                                                                                         September 30,                        September 30,
                                                                                                      2020               2019               2020              2019
                                  Net cash provided by (used in) operating activities           $       1,596      $         791      $       3,196      $      1,661
                                       Less: Net cash used in (provided by) operating
                                       activities of discontinued operations                                 1                  2                  8                 7
                                     Net cash provided by (used in) operating activities of
                                     continuing operations                                              1,597                793              3,204             1,668
                                     Less: Additions to property, plant and mine
                                     development                                                         (296)              (428)              (904)            (1,033)
                                  Free Cash Flow                                                $       1,301      $         365      $       2,300      $        635

                                  Net cash provided by (used in) investing activities (1)       $        (337)     $        (438)     $        502       $       (817)
                                  Net cash provided by (used in) financing activities           $        (242)     $         530      $      (1,119)     $      (1,506)

                                1.      Net cash provided by (used in) investing activities includes Additions to property, plant and mine development, which is included in the Company’s
                                        computation of Free Cash Flow.​

2021 INVESTOR UPDATE                                                                                                                                                              NEWMONT CORPORATION               41
Attributable Free Cash Flow
Management uses Attributable Free Cash Flow as a non-GAAP measure to analyze cash flows generated from operations that are attributable to the Company. Attributable Free Cash Flow is Net cash provided by
(used in) operating activities after deducting net cash flows from operations attributable to noncontrolling interests less Net cash provided by (used in) operating activities of discontinued operations after
deducting net cash flows from discontinued operations attributable to noncontrolling interests less Additions to property, plant and mine development after deducting property, plant and mine development
attributable to noncontrolling interests. The Company believes that Attributable Free Cash Flow is useful as one of the bases for comparing the Company’s performance with its competitors. Although Attributable
Free Cash Flow and similar measures are frequently used as measures of cash flows generated from operations by other companies, the Company’s calculation of Attributable Free Cash Flow is not necessarily
comparable to such other similarly titled captions of other companies.

The presentation of non-GAAP Attributable Free Cash Flow is not meant to be considered in isolation or as an alternative to Net income attributable to Newmont stockholders as an indicator of the Company’s
performance, or as an alternative to Net cash provided by (used in) operating activities as a measure of liquidity as those terms are defined by GAAP, and does not necessarily indicate whether cash flows will be
sufficient to fund cash needs. The Company’s definition of Attributable Free Cash Flow is limited in that it does not represent residual cash flows available for discretionary expenditures due to the fact that the
measure does not deduct the payments required for debt service and other contractual obligations or payments made for business acquisitions. Therefore, the Company believes it is important to view
Attributable Free Cash Flow as a measure that provides supplemental information to the Company’s Condensed Consolidated Statements of Cash Flows.

The following table sets forth a reconciliation of Attributable Free Cash Flow, a non-GAAP financial measure, to Net cash provided by (used in) operating activities, which the Company believes to be the GAAP
financial measure most directly comparable to Attributable Free Cash Flow, as well as information regarding Net cash provided by (used in) investing activities and Net cash provided by (used in) financing
activities.

                                                                                                                                                        Three Months Ended September 30,
                                                                                                                                2020                                                                         2019
                                                                                                                          Attributable to             Attributable to                                  Attributable to           Attributable to
                                                                                                    Consolidated          noncontrolling                Newmont                Consolidated            noncontrolling              Newmont
                                                                                                                                       (1)
                                                                                                                           interests                   Stockholders                                     interests (1)             Stockholders
  Net cash provided by (used in) operating activities                                           $               1,596 $                      (50) $               1,546    $                791 $                       (84) $                 707
   Less: Net cash used in (provided by) operating activities of discontinued operations                             1                           -                     1                       2                            -                     2
  Net cash provided by (used in) operating activities of continuing operations                                  1,597                        (50)                 1,547                     793                         (84)                   709
    Less: Additions to property, plant and mine development (2)                                                  (296)                        13                   (283)                   (428)                         26                   (402)
  Free cash flow                                                                                $               1,301 $                      (37) $               1,264    $               365     $                    (58) $                307

  Net cash provided by (used in) investing activities (3)                                       $               (337)                                                      $               (438)
  Net cash provided by (used in) financing activities                                           $               (242)                                                      $               530

      (1) Adjustment to eliminate a portion of Net cash provided by (used in) operating activities, Net cash provided by (used in) operating activities of discontinued operations and Additions to property, plant and mine development

      attributable to noncontrolling interests, which relate to Yanacocha (48.65%) and Merian (25%).
      (2) For the three months ended September 30, 2020 and 2019, Yanacocha had total consolidated Additions to property, plant and mine development of $24 and $44, respectively, on a cash basis. For the three months ended

      September 30, 2020 and 2019, Merian had total consolidated Additions to property, plant and mine development of $8 and $18, respectively, on a cash basis.
      (3) Net cash provided by (used in) investing activities includes Additions to property, plant and mine development, which is included in the Company’s computation of Free Cash Flow.​

 2021 INVESTOR UPDATE                                                                                                                                                                                      NEWMONT CORPORATION                        42
You can also read