Financial Overview & Path to Creating Value in Colombia Value Creation & Ecuador - February 2020 - Gran Tierra Energy
←
→
Page content transcription
If your browser does not render page correctly, please read the page content below
Financial Overview
Creating Value & Path to
 in Colombia
Value Creation
& Ecuador
February 2020

 1
General Advisory opportunities, including free cash flow growth; our possible creation of new core areas; our prospects
 and leads and the Company’s targeted IRR on investments; the plans, objectives, expectations and
The information contained in this presentation does not purport to be all-inclusive or contain all intentions of the Company regarding production, exploration and exploration upside, drilling, permitting,
information that readers may require. You are encouraged to conduct your own analysis and review of testing, development and EOR projects; transportation capacity and infrastructure; prospects in
Gran Tierra Energy Inc. (“Gran Tierra”, “GTE”, or the “Company”) and of the information contained in Colombia and Ecuador, including potential E&P rounds and favorable contract terms; Gran Tierra’s
this presentation. Without limitation, you should read the entire record of publicly filed documents 2020 capital program including the changes thereto along with the expected costs and the expected
relating to the Company, consider the advice of your financial, legal, accounting, tax and other allocation of the capital program; Gran Tierra’s 2020 guidance and 5-year and 10-year core asset
professional advisors and such other factors you consider appropriate in investigating and analyzing outlooks; and Gran Tierra’s financial position and the future development of the Company’s business,
the Company. You should rely only on the information provided by the Company and not rely on parts including the Company’s approach to value creation. Statements respecting reserves are forward-
of that information to the exclusion of others. The Company has not authorized anyone to provide you looking statements as they involve the implied assessment, based on estimates and assumptions, that
with additional or different information, and any such information, including statements in media articles the reserves and resources described exist in the quantities predicted or estimated and can be
about Gran Tierra, should not be relied upon. No representation or warranty, express or implied, is profitably produced in the future. Unrisked prospective resources are highly speculative and do not
made by Gran Tierra as to the accuracy or completeness of the information contained in this document, represent current reserves, future production or even future possible reserves.
and nothing contained in this presentation is, or shall be relied upon as, a promise or representation by
Gran Tierra. Estimates of future production, cash flow guidance, operating netback, EBITDA and certain expenses
 may be considered to be future-oriented financial information or a financial outlook for the purposes of
An investment in the securities of Gran Tierra is speculative and involves a high degree of risk that applicable Canadian securities laws. Financial outlook and future-oriented financial information
should be considered by potential purchasers. Gran Tierra’s business is subject to the risks normally contained in this presentation about prospective financial performance, financial position or cash flows
encountered in the oil and gas industry and, more specifically, certain other risks that are associated are based on assumptions about future events, including economic conditions and proposed courses of
with Gran Tierra’s operations and current stage of development. An investment in the Company’s action, based on management’s assessment of the relevant information currently available, and to
securities is suitable only for those purchasers who are willing to risk a loss of some or all of their become available in the future. In particular, this presentation contains projected production and
investment and who can afford to lose some or all of their investment. You should carefully consider the operational and financial information for 2020 and beyond. These projections contain forward-looking
risks described under the heading “Risk Factors” in the Company’s Annual Report on Form 10-K and in statements and are based on a number of material assumptions and factors set out above. Actual
the Company’s other SEC filings available at www.grantierra.com. results may differ significantly from the projections presented herein. These projections may also be
In this presentation, unless otherwise indicated, all dollar amounts are expressed in US dollars. All considered to contain future-oriented financial information or a financial outlook. The actual results of
production, reserves and resources are working interest before royalties (“WI”). Please see the Gran Tierra’s operations for any period will likely vary from the amounts set forth in these projections,
appendices to this presentation for important advisories relating to the Company’s presentation of oil and such variations may be material. See above for a discussion of the risks that could cause actual
and gas information and financial information, including the presentation of non-GAAP measures, results to vary. The future-oriented financial information and financial outlooks contained in this
Current market values are based on a NYSE share price of US$0.89 as at close February 24, 2020 and presentation have been approved by management as of the date of this presentation. Readers are
367.0 million issued and outstanding shares as of December 31, 2019. cautioned that any such financial outlook and future-oriented financial information contained herein
 should not be used for purposes other than those for which it is disclosed herein. The Company and its
Forward-Looking Information Cautionary Advisory management believe that the prospective financial information has been prepared on a reasonable
 basis, reflecting management’s best estimates and judgments, and represent, to the best of
This presentation contains forward-looking statements within the meaning of the United States Private
 management’s knowledge and opinion, the Company’s expected course of action. However, because
Securities Litigation Reform Act of 1995, Section 27A of the Securities Act of 1933, as amended, and
 this information is highly subjective, it should not be relied on as necessarily indicative of future results.
Section 21E of the Securities Exchange Act of 1934, as amended, and financial outlook and forward
looking information within the meaning of applicable Canadian securities laws (collectively, “forward-
looking statements”). All statements other than statements of historical facts included in this
presentation regarding our financial position, estimated quantities and net present value of reserves
and resources, business strategy, plans and objectives for future operations, capital spending plans
and those statements preceded by, followed by or that otherwise include the words “believe”, “expect”,
“intend”, “anticipate”, “forecast”, “will”, “estimate”, “guidance”, “target”, “project”, “goal”, “plan”, “should”
or similar expressions are forward-looking statements. Such forward-looking statements include, but
are not limited to, statements about: future projected or target production and the growth of production
including the product mix of such production and expectations respecting production growth;
prospective resources; our ability to grow in both the near and long term and the funding of our growth
Forward-Looking Information Cautionary Advisory (continued)
The forward-looking statements contained in this presentation are based on certain assumptions made
by Gran Tierra based on management’s experience and perception of historical trends, current
conditions, anticipated future development and other factors believed to be appropriate. Such
statements are subject to a number of assumptions, risks and uncertainties, many of which are beyond
Gran Tierra’s control, which may cause actual results to differ materially from those implied or
expressed by the forward-looking statements. These include the factors discussed or referenced under
the heading “Part 1. Item 1A. Risk Factors” in Gran Tierra’s Annual Report on Form 10-K, under the
heading “Part II. Item 1A. Risk Factors” in Gran Tierra’s Quarterly Reports on Form 10-Q and in the
other reports and filings with the Securities and Exchange Commission.
All forward-looking statements speak only as of the date on which such statements are made, and Gran
Tierra undertakes no obligation to correct or update any forward-looking statements, whether as a
result of new information, future events or otherwise, except as required by applicable law. Gran
Tierra’s forward-looking statements are expressly qualified in their entirety by this cautionary statement.
Although the current guidance, capital spending program and long term strategy of Gran Tierra are
based upon the current expectations of the management of Gran Tierra, should any one of a number of
issues arise, some of which cannot be anticipated and are outside the control of management, Gran
Tierra may find it necessary to alter its business strategy and/or capital spending program and there
can be no assurance as at the date of this press release/presentation as to how those funds may be
reallocated or strategy changed and how that would impact Gran Tierra’s results of operations and
financing position.

Unaudited Financial Information
Certain financial and operating results included in this presentation, including debt, net debt, working
capital, capital expenditures, and production information, are based on unaudited estimated results.
These estimated results are subject to change upon completion of the Company's audited financial
statements for the year ended December 31, 2019, and changes could be material. Gran Tierra
anticipates filing its audited financial statements and related management's discussion and analysis for
the year ended December 31, 2019 on or before February 27, 2020.
GRAN TIERRA SNAPSHOT
Independent international exploration & production company
focused in Colombia & Ecuador, attractive investment destinations

Production 2016 2017 2018 2019
 WI Production (boepd) 1 26,216 31,426 36,209 34,817
 Middle
 Magdalena
 Valley Llanos
Financials 2016 2017 2018 2019
 Adjusted EBITDA (US $MM)2 123 228 376 326
 Funds Flow from Operations (US $MM) 2 105 220 306 272

2019 Reserves3 1P 2P 3P
 MMBOE 79 142 186 Putumayo

 RLI (years)4 7 12 15
 Oriente
 NPV10 BT (US $bn) $1.5 $2.9 $3.8
 NPV10 AT (US $bn) $1.3 $2.3 $2.9

Market Values
 Market Capitalization (February 24, 2020) US$ 0.33 bn
 Net Debt5 US$ 0.63 bn NYSE AMEX 100% Diversified +95%
 Enterprise Value US$ 0.96 bn
 LSE
 TSX
 GTE Oil High-quality
 asset base
 Operated
 Production
 Avg 30-day combined trading volume 3.6 MM shares

 Right people & right assets in place - high quality, diversified portfolio - 100% oil & over 95% operated
 1. Colombia WI annual average production
 2. Adjusted EBITDA and funds flow from operations are non-GAAP measures and do not have a standardized meaning under GAAP. Refer to "Non-GAAP Measures" in the appendix. 4
 3. Based on GTE McDaniel December 31, 2019 Reserves Report. See appendix for McDaniel Brent oil price forecast.
 4. Calculated using average fourth quarter 2019 WI production of 32,924 BOEPD
 5. Based on Q4 2019 net debt of $627 million, comprised of working capital of $91 million, high yield bonds of $600 million, and $118 million drawn on the reserves-based credit facility.
REASONS TO INVEST IN GRAN TIERRA Sustainable business model with significant value in booked reserves base 1P reserves underpin value; clear path to 2P and 3P exploitation; world class hydrocarbon basins Technically focused team, experts at implementing and executing waterfloods 83% of 1P reserves are in four conventional fields (low cost) all under an active waterflood (low decline) Free cash flow generation in 2020; flexible discretionary capital programs Focused on balance sheet strength, shareholders returns, reinvestment Low capital intensity ($35/bbl sustaining Brent price, 2020 free cash flow prioritized towards debt reduction) Flexible capital program (operate > 95% of blocks, core assets self-funding and free cash flow generating) Consistent track record of value creation through opportunistic acquisitions Disciplined approach, selective on quality, building platforms for self-funded organic growth Completed eight corporate and property acquisitions Successfully bid and won four blocks in Colombia and three blocks in Ecuador World class development and low risk exploration in four proven onshore basins Extensive seismic and well data across expansive acreage position Over 2.8 million acres and the number one land holder in the most underexplored basin in Colombia Significant 3D coverage across the Oriente basin (> 5,000km 2 3D) and 2,000km2 across the Putumayo Top-tier assets with strong free cash flow generation in world-class onshore basins 5

ENVIRONMENTAL, SOCIAL, GOVERNANCE FACT SHEET
 Safety Environmental Economic Opportunities
In 2019, Gran Tierra had its BEST Gran Tierra has committed to reforesting Almost 16,000 local labour opportunities
SAFETY RECORD in terms of Lost Time 1,000 hectares of land and securing and created by GTE over the past 3 years
Injuries and Total Recordable Injuries maintaining 18,000 hectares of forest
 through the NaturAmazonas project Gran Tierra hired 623 local suppliers in
 2019, approximately 20% more than 2018
 Social Gran Tierra’s total NaturAmazonas investment
 in the Andes-Amazon is USD$13 million Gran Tierra issued 2,109 contracts in 2019
More than 60% of Gran Tierra’s social to local suppliers for goods and services
investments for 2019 were voluntary GTE has planted 560,112 trees and has
 conserved, preserved or reforested 1,367 The Emprender Paga project has supported
Over 92,000 people benefited from hectares of land more than 275 local entrepreneurs, of which
GTE’s social investments in 2019 over 68% of the beneficiaries are women
 The NaturAmazonas project will sequester
More than 1,700 questions and concerns ~8.7 million tonnes of CO2 over its lifetime
resolved in GTE’s Te Escucha offices
 For the last 4 years Gran Tierra has
More than 3,000 children and 36 schools voluntarily released an assessment of its
have participated in PetrolCopa School greenhouse gas emissions
Challenge
 Gran Tierra has completed Gas-To-Power
 projects at its Costayaco, Moqueta and
 Acordionero fields

 Gran Tierra tests water quality at over 154
 ground water monitoring locations

 6
Financial Overview & Path to
Value Creation

 7
GRAN TIERRA’S FOCUSED STRATEGY

 STRATEGY TACTICS
 Proven, Under-Explored Conventional Apply Proven Technology
 Hydrocarbon Basins GTE has been able to reduce
 World-class exploration program targeting large prospect drilling times/costs by ~40%
 inventory across proven plays in Colombia & Ecuador

 Access to Established Infrastructure
 Large spare capacity in pipelines & trucking, leads to Maintain Strong
 strong oil prices linked to Brent, short cycle times &
 quick access to world markets Colombia & Financial Position
 GTE’s existing producing assets are
 Ecuador forecast to generate free cash flow1 of after
 development expenditures & taxes over
Strong, Stable Economic Environment an ideal fit the next five years of ~$2.1bn for 2P
Pro-Western governments that ensure contract sanctity, for GTE reserves
rule of law & encourage FDI and resource development

 Maintain Flexibility & Control
 Highly Competitive Fiscal Regime the Allocation of Capital
 Flexible, progressive fiscal regimes with sliding scale royalty 95%+ operated asset base allows
 or contractor take that are among the best in the world disciplined capital allocation, pace setting

 Colombia & Ecuador are an excellent fit for Gran Tierra’s strategy and tactical plan
 1. “Free cash flow in this context is not a defined term under GAAP and is called future net revenue in the GTE McDaniel Reserves Report. The non-GAAP term of free cash flow, after development expenditures and taxes over the next five years, reconciles to the
 nearest GAAP term of oil and gas sales, which is called sales revenue in the GTE McDaniel Reserves Report. Refer to "Future Net Revenue" in this press release for the reconciliations between sales revenue and future net revenue. Gran Tierra is unable to provide a
 8
 quantitative reconciliation of free cash flow after development expenditures, taxes, interest and G&A costs over the next five years to its most directly comparable forward-looking GAAP measure because management cannot reliably predict certain of the necessary
 components of such forward-looking GAAP measure. Refer to "Non-GAAP Measures" in the appendix.
PATH TO VALUE CREATION
 5 Year Look Back1 Forward Outlook
 RESERVES GROWTH

 $1,767MM2
 234% 133MM 2P 5-year cash flow after development
 expenditures, interest, tax and G&A
 Proved + Probable (“2P”) reserves Barrels added over the past 5 years

 8 317%
 Growth in 2P
 27 3 $2,365MM3
Accretive corporate & Blocks Blocks
property acquisitions NPV10 BT of added in added in
 assets Colombia Ecuador
 2P EBITDA over the next 5 years

ACREAGE GROWTH IN
 PROVEN BASINS High Impact Exploration -
 594k Putumayo 166% 194% test ~700MM barrels of
 unrisked prospective
 138k Oriente 2P Net Asset Value 3P Net Asset Value
 Before Tax per share Before Tax per share resources over the
 804k Llanos
 next 5 years
 114k MMV Despite a 16% lower Brent price forecast

 1. Based on GTE McDaniel December 31, 2019 Reserves Report . See appendix for “Presentation of Oil & Gas Information” in respect of reserves information that is not as at December 31, 2019 9
 2. See slide “GTE Reserve summary (1P & 2P)” for breakdown
 3. Based on GTE McDaniel Reserves Report and GTE internal interest and G&A assumptions. See slide “GTE Reserve summary (1P & 2P)” for breakdown
 4. McDaniel’s YE19 price deck assumes Brent: 2020 -$67.00/bbl, 2021 – $67.83/bbl, 2022 - $69.19/bbl, 2023 -$70.57/bbl, 2024 – 71.98/bbl
FINANCIAL PHILOSOPHY AND POLICIES

 CAPITAL MAINTENANCE OF DISCIPLINED DYNAMIC RISK
 ALLOCATION AMPLE LIQUIDITY APPROACH TO MANAGEMENT
 MANAGE LEVERAGE PROGRAM
 o Investments target a o Committed reserves- o Fund growth program o Primary exposures are
 minimum IRR of 20% based bank facility due through internally to Brent and Colombian
 (AT) full cycle in November 2022 generated cash flows peso (COP)
 (development &
 o New investments must o Operate >95% of asset exploration) o Hedging strategy is
 compete for capital base, allows strong considered in the
 o Financial guardrails:
 against other visibility on timing of context of the flexibility
 - Net Debt /EBITDA
 opportunities in our inflows and outflows of GTE’s capital
 1.0x - 2.0x (sub 1.5x
 extensive portfolio program and balance
 preferred)
 sheet
 - Net Debt Target:
 < $500 MM

 GTE’s focus on financial discipline is key to growing value, not just production and reserves
 10
VALUE CREATION BEYOND THE BASE PLAN FRAMEWORK

 Discretionary Free Cash Flow

 STRENGTHEN RETURN ACCELERATE REINVEST
 BALANCE SHEET CAPITAL DEVELOPMENT IN ASSET BASE
 o Reduce net debt o Share buybacks o Develop prior o Conversion of
 exploration discoveries captured resource into
 o Increase liquidity o Initiation of dividend
Alternatives o Enhance booked
 reserves / production
 reserves base o Inorganic additions

 o Retain adequate cash o Market versus Intrinsic o Optimize pace of o Optimize pace of
 to fund base plan and value development development
 maintain flexibility in a
 o Impact on trading o Consistent criteria for o Consistent criteria for
 Decision down-cycle
 liquidity all forms of resource all forms of resource
 Criteria o Weighed against additions additions
 o Views on commodity
 alternative uses of
 price; structural vs o Compounding free o Compounding free
 capital
 cyclical dislocations cash flow cash flow

 Disciplined approach to value creation: strengthen, return, accelerate, reinvest
 11
CORE ASSET FINANCIAL SUMMARY (2P)1
 2P Reserves 5 Year Free Cash Flow (FCF)2 B.T. NPV 10
(MMBOE) (US$MM) (US$MM)

 - $238 - $327 -
 29
 $309
 $328
 11 142 75 $2.1 $2.9
 MMBOE Billion $1,161 $434 Billion
 $1,844
 $337
 28

 Acordionero Chaza Suroriente Other

 Self-funded assets drive majority of value, cash flow and booked reserves
 1. Based on GTE McDaniel December 31, 2019 Reserves Report 12
 2. Free cash flow is derived from McDaniel Reserves Report (Revenue – Royalties – OPEX – Abandonment – Capex – Tax = Free Cash Flow)
 “Free cash flow” is a non-GAAP measure and does not have a standardized meaning under GAAP. Free cash flow is defined as “net cash provided by operating activities” less projected capital spending. Refer to "Non-
 GAAP Measures" in the appendix.
MCDANIEL RESERVES1

 ACORDIONERO COSTAYACO MOQUETA SURORIENTE
 Reserves by Category Reserves by Category Reserves by Category Reserves by Category
100 25 14 15
 12
80 20
 23 10 14
 92 10
60 15 8
 12
 75 18 10 11
40 10 6 7
 5 7
 41 10 4
20 5
 2
 0 0 0 0
 1P 2P 3P 1P 2P 3P 1P 2P 3P 1P 2P 3P

 (MMBOE) 1P 2P 3P (MMBOE) 1P 2P 3P (MMBOE) 1P 2P 3P (MMBOE) 1P 2P 3P
 December 31, 2018 32 76 96 December 31, 2018 12 19 27 December 31, 2018 7 9 11 December 31, 2018 2 3 4

 Production 6 6 6 Production 2 2 2 Production 1 1 1 Production 1 1 1

 Additions 15 5 2 Additions 1 2 -2 Additions 2 2 2 Additions 6 10 11

 December 31, 2019 41 75 92 December 31, 2019 10 18 23 December 31, 2019 7 10 12 December 31, 2019 7 11 14

 Change 28% (1%) (4%) Change (12%) (4%) (15%) Change 11% 12% 8% Change 424% 429% 387%

 1. Based on GTE McDaniel December 31, 2019 Reserves Report 13
GTE RESERVE SUMMARY - 1P & 2P1
Highlights Annual Production
 (mboe/d)
o Low declines and minimal capital expenditures result in 70 5 year Cumulative production: 1P of 57 mmbbls, 2P of 82 mmbbls
 significant free cash flow generation in all reserve cases 60

 50
o 113 MMBOE of 2P reserves and forecasted free cash 40
 flow of $3.4Bn are generated from GTE’s four core assets
 30

 20
o Stable 1P base with material 2P and 3P upside
 10

 0
 2020 2021 2022 2023 2024 2025 2026 2027 2028 2029
 1P 2P
 1P Cash Flow (Cumulative 5 year outlook)1 2P Cash Flow (Cumulative 5 year outlook)1
(US$MM) (US$MM)
3,500 3,500

3,000 3,000

2,500 2,500
 1,767
2,000 2,000

1,500 1,097 1,500 3,101

1,000 1,988 1,000 566
 385
 500 500 472
 210
 170 170
 0 126 126
 2 3 3 0
 2 3 3
 Operating Interest G&A Income Tax Development Discretionary Operating Interest G&A Income Tax Development Discretionary
 Netback Capital Free Cash Netback Capital Free Cash
 Flow Flow

 Portfolio expected to generate $1Bn to $1.7Bn of FCF in the next 5 years
 1. Based on GTE McDaniel December 31, 2019 Reserves Report
 2. Operating Netback is based on McDaniel’s Net Operating Income (Revenue – Royalty – OPEX – Abandonment = Net Operating Income) from the GTE McDaniel December 31, 2019 Reserves Report 14
 3. Interest and G&A costs are based on GTE Internal estimate
 “Operating netback” and “free cash flow” are non-GAAP measures and do not have a standardized meaning under GAAP. Operating netback is defined as oil and gas sales less projected operating and transportation
 expenses. Free cash flow is defined as net revenue in the GTE McDaniel Reserves Report. The non-GAAP term of free cash flow reconciles to the nearest GAAP term of oil and gas sales, which is called sales revenue in
 the GTE McDaniel Reserves Report. Refer to "Non-GAAP Measures" in the appendix.
FLAT $60/BBL BRENT CASE SUSTAINABILITY
 2P $60/bbl Cash Flow (Cumulative 5 year outlook)1 2P $60/bbl Cash Flow (Cumulative 10 year outlook)1
(US$MM) (US$MM)

3,500 3,500

3,000 3,000

2,500 2,500 1,975

2,000 2,000
 1,352
 3,474
1,500 1,500
 2,531 566
1,000 1,000
 566
 562
 500 318 500
 126 170 126 245
 0 0
 2 3 3 3 3
 Operating Interest G&A Income Tax Development Discretionary Operating 2 Interest G&A Income Tax Development Discretionary
 Netback Capital Free Cash Netback Capital Free Cash
 Flow Flow

 o Conventional assets under waterflood drive significant free cash flow

 o Over the next 10 years at $60/bbl Brent price, after deducting interest, G&A, income tax and development capital,
 the 2P portfolio is forecasted to generate free cash flow of $1.9 billion ($5.07/share)

 1. Based on GTE McDaniel December 31, 2019 Reserves Report, sensitivity @ 60/bbl
 2. Operating Netback is based on McDaniel’s Net Operating Income (Revenue – Royalty – OPEX – Abandonment = Net Operating Income) from the GTE McDaniel December 31, 2019 Reserves Report 15
 3. Interest and G&A costs are based on GTE Internal estimate
 “Operating netback” and “free cash flow” are non-GAAP measures and do not have a standardized meaning under GAAP. Operating netback is defined as oil and gas sales less projected operating and transportation expenses. Free cash flow is defined as net revenue in
 the GTE McDaniel Reserves Report. The non-GAAP term of free cash flow reconciles to the nearest GAAP term of oil and gas sales, which is called sales revenue in the GTE McDaniel Reserves Report. Refer to "Non-GAAP Measures" in the appendix.
CORE ASSET PORTFOLIO: MARKET VS. INTRINSIC VALUE
 Net Asset Value Before Tax1 Net Asset Value After Tax1
(US$MM) (US$MM)

3,500 3,500
 $8.69/Sh

3,000 $3,188 3,000

 $901
2,500 2,500 $6.18/Sh
 $6.23/Sh

 $2,287 $2,269
2,000 2,000 $621
 $4.49/Sh

 $1,368 1,500 $1,649
1,500
 $1,546 $627
 $1,298 $978
 $2.50/Sh 1,000 $627
1,000
 $1.83/Sh
 $919
 500 $671
 500
 $0.89/sh
 $0.89sh
 0
 0 Proved Net Debt 1P NAV Probable 2P NAV Possible 3P NAV
 Proved Net Debt 1P NAV Probable 2P NAV Possible 3P NAV Dec.31/2019
 Dec.31/2019

 GTE shares currently trade at a significant discount to self-funded NAV
 1. Based on GTE McDaniel December 31, 2019 Reserves Report 16
Waterflood Update

 17
WATERFLOODING – IMPROVED OIL RECOVERY Water flooding practiced since the 1920’s, widest practiced secondary recovery method GTE utilizes waterflood technology in several key pools, improves recovery by: – Displacing / sweeping oil towards producing wells Typical Waterfloods Significantly Increase Production, – Maintaining / increasing reservoir pressure Recovery Factors & Reserves2 Waterflood Oil Recovery Process Schematic1 Acordionero Cohembi Costyaco Fill Up & Moqueta Start Injection Increased pressure helps push oil to producing wells Decline Period Incline Period Increasing PIP4 Gas collapse BOPD Secondary Oil Primary Oil % Waterflood Life Waterflooding is a technique that can typically double ultimate recovery3 1. Source: SNF Floerger Oil & Gas – “Enhanced Oil Recovery” 18 2. Copyright 1991, SPE, from JPT, October 1991 3. https://www.spe.org/en/industry/increasing-hydrocarbon-recovery-factors/ 4. PIP: Pump Intake Pressure
WATERFLOODING – CANDIDATE SCREENING All of Gran Tierra’s assets currently under waterflood greatly exceed success factors as per Willhite’s waterflood screening criteria1 Gran Tierra’s assets rank as world-class candidates for waterflooding GRAN TIERRA ASSETS UNDER WATERFLOOD2 Factors Favorable for Waterflooding1 Acordionero Costayaco Moqueta Cohembi Initial Oil Saturation > 40% 78% 86% 78% 90% Oil-Zone Thickness > 15 ft 330 ft 114 ft 160 ft 125 ft Permeability (Average) > 10 mD 750 mD 225 mD 275 mD 2,500 mD Reservoir Depth > 1,000 ft 8,000 ft 8,400 ft 3,150 ft 9,100 ft Viscosity < 15,000 cP 230 cP 1.5 cP 3.6 cP 28 cP Gran Tierra’s asset characteristics are excellent for waterflooding 1. Willhite. Paul G. Waterflooding. SPE Textbook Series Volume 3. Society of Petroleum Engineers. Richardson, Texas. 1986, p. 112. 19 2. Based on GTE McDaniel December 31, 2019 Reserves Report
WATERFLOODING – MAXIMIZING EXISTING FIELD RECOVERY1
 Size of the bubble represents OOIP in MMBOE under waterflood 2P Original Oil-In-Place2
 (MMbbls)
 100%
 76
 Costyaco
 178
 75% Cohembi MM 178
 MQT
 180
 76 381
 MM
 MM
Water Cut (%)

 180
 50%

 Acordionero Cohembi
 INCREASING WF
 25% Costayaco Moqueta
 Acordionero
 381
 MATURITY
 CMP/ MM

 0%
 QND
 80
 MM
 ~815 MMbbls 1

 Original Oil-In-Place (OOIP)
 0% 10% 20% 30% 40%
 under waterflood in GTE’s
 Recovery Factor (%) four biggest oil fields

 Waterflood value creation is significant with material remaining recovery available
 1. Based on GTE McDaniel December 31, 2019 Reserves Report 20
 2. Based on McDaniel 2P OOIP
COSTAYACO WATERFLOOD PERFORMANCE - HISTORICAL
 60,000
 Oil Prod. Rate
 Water Prod. Rate Current watercuts:
Production and Injection Rate (barrels per day)

 Water Inj. Rate
 50,000 1P - GLJ YE2010
 1 ~25% ACR ~85% CYC
 1 (early life flood ) (later life flood )
 2P - GLJ YE2010
 1
 3P - GLJ YE2010

 40,000

 30,000 Started
 injection

 20,000
 Waterflood Incremental
 Above 1P YE2010 GLJ

 10,000

 0
 Jan-07 Jan-08 Jan-09 Jan-10 Jan-11 Jan-12 Jan-13 Jan-14 Jan-15 Jan-16 Jan-17 Jan-18 Jan-19 Jan-20

 2010 YE GLJ - Original Production to YE19
 Recoverable (MMbbl) (MMbbl) Water injection through water flooding
 1P 2P 3P YE19 (McDaniel)
 moves 2P and 3P reserves to 1P 21
 36.5 41.2 50.5 56.5
 1. See appendix for “Presentation of Oil & Gas Information” in respect of reserves information that is not as at December 31, 2019
Acordionero Review

 22
ACORDIONERO 34% OOIP GROWTH IN 3 YEARS1

 PDN March 2016 GTE April 2018 GTE Jan 20201
MCD YE2016 2P OOIP 280 MMBBL2 MCD YE2018 2P OOIP 332 MMBBL2 MCD YE2019 2P OOIP 381 MMBBL2

 Acordionero continues to grow highlighting early nature of field development and available running room
 Lisama A Depth 200 foot C.I. 1km grid 23
 1. Based on GTE McDaniel December 31, 2019 Reserves Report
 2. Based on McDaniel 2P OOIP
 3. See appendix for “Presentation of Oil & Gas Information” in respect of reserves information that is not as at December 31, 2019
SURVEILLANCE: VOIDAGE REPLACEMENT RATIO (VRR) One of the key diagnostics for monitoring waterflood performance and conformance is Voidage Replacement Ratio (VRR) VRR is a simple material balance for the reservoir VRR = Gas 1 BBL WATER IN 1 BBL OIL OUT VRR < 1.0 under-injecting VRR = 1.0 replacing voidage Source NETL 2010 VRR > 1.0 replacing voidage and re-pressuring the reservoir Voidage Replacement Ratio is how we monitor waterflood management 24
MANAGING 2020 ACORDIONERO WF PERFORMANCE

Actively managing patterns
 by sector allows for
optimum water placement
 and field performance

 Significant improvement
 in field VRR in second
 half of 2019
 3 additional injector conversions
 budgeted for 2020

 Instantaneous Cumulative
 Jun-19 Current Jun-19 Current

 0.40 1.11 0.10 0.28
Field

Lisama-A 0.60 0.94 0.14 0.36

Lisama-C 0.29 1.45 0.07 0.18

 Actively managing Voidage Replacement Ratio (VRR) improves performance
 25
PIP1 INCREASES & PRODUCTION GAINS
 Acordionero-26 Acordionero-27
 1,600 60.0 2,000 60.0

 Rate (STB/day) - PIP (psi)
 Rate (STB/day) - PIP (psi)

 1,400 50.0
 50.0

 ESP Frequency (Hz)
 ESP Frequency (Hz)
 1,600
 1,200
 40.0 40.0
 1,000 1,200
 800 30.0 30.0
 600 800
 20.0 20.0
 400
 10.0 400 10.0
 200
 0 0.0 0 0.0

 10/1/2018
 11/1/2018
 12/1/2018

 10/1/2019
 11/1/2019
 12/1/2019
 9/1/2018

 1/1/2019
 2/1/2019
 3/1/2019
 4/1/2019
 5/1/2019
 6/1/2019
 7/1/2019
 8/1/2019
 9/1/2019

 1/1/2020
 10/1/2019

 11/1/2019

 12/1/2019
 4/1/2019

 5/1/2019

 6/1/2019

 7/1/2019

 8/1/2019

 9/1/2019

 1/1/2020

 Oil Rate (STB/day) PIP (psi) Freq. (Hz) Oil Rate (STB/day) PIP (psi) Freq. (Hz)

900-psi increase in PIP, production still increasing 200-psi increase in PIP, +300STB/day in production

 Acordionero: waterflood response is evident in pump intake pressure (PIP) and oil rate increases in wells
 1. PIP = Pump Intake Pressure 26
 2. Freq. (Hz) = Frequency in Hertz
AVERAGE ACORDIONERO WELL WATERFLOOD RESPONSE
 1,000 50,000
 Following the recent increase in water
Average Acordionero Pump Intake

 950 injection, material pressure increase is 45,000

 900 being observed in producing wells 40,000

 Injection Rate (bwipd)
 850 35,000
 Pressure (psi)

 800 30,000

 750 25,000

 700 20,000

 650 15,000
 Water injection and
 600 10,000
 downhole pressures
 550 are well correlated 5,000

 500 0
 Jan-19 Feb-19 Mar-19 Apr-19 May-19 Jun-19 Jul-19 Aug-19 Sep-19 Oct-19 Nov-19 Dec-19

 Average Pump Intake Pressure Field Water Injection Rate
 Pump Intake Pressures (PIP) in wells are increasing in response to increased water injection
 27
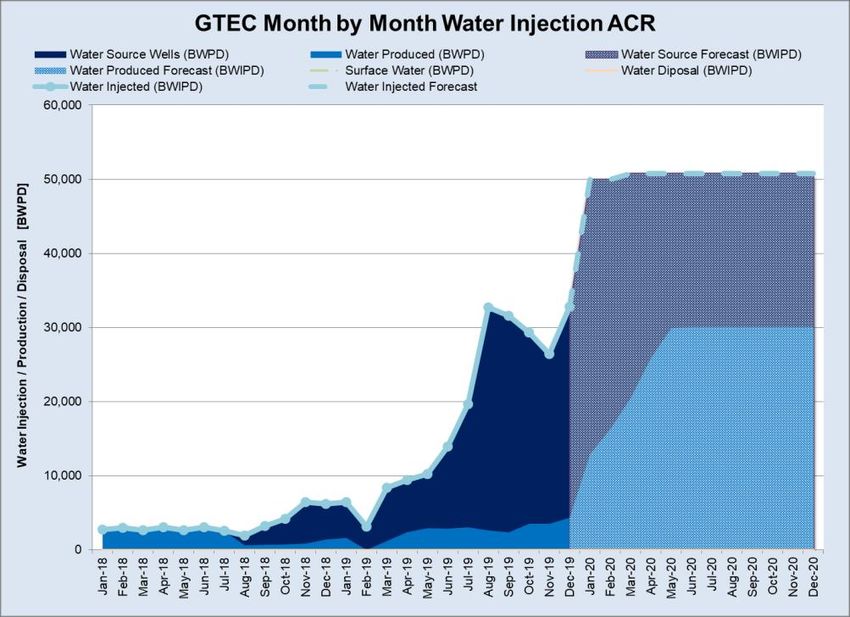
HOW WE ARE MANAGING 2020 ACR WF PERFORMANCE

 2019 CPF expansion
 and South Pad water
 infrastructure has
 provided 60,000 bbl/d
 of injection capacity

 In 2020, work will
 continue to convert
 wells to injection and
 increase water
 handling capacity and
 distribution to the field

 Actively managing Voidage Replacement Ratio (VRR) improves performance
 28
Transportation

 29
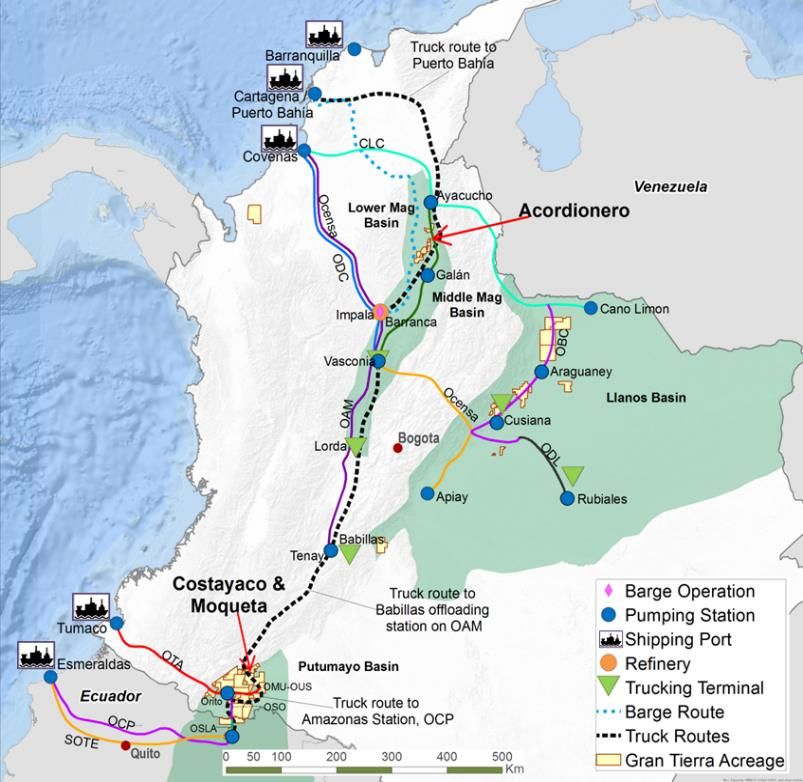
ACCESS TO EXISTING TRANSPORTATION INFRASTRUCTURE Gran Tierra benefits from large spare capacity in pipelines & trucking throughout Colombia & Ecuador, which leads to: Strong oil prices linked to Brent Narrow oil price differentials Short cycle times Quick access to world markets through major export terminals Transportation Export Point Truck + pipeline Esmereldas (Ecuador) Putumayo (Costayaco, Moqueta, Pipeline Tumaco (Colombia) Others) Truck + pipeline Coveñas (Colombia) Truck or truck + barge Cartagena (Colombia) Middle Truck Barranquilla (Colombia) Magdalena (Acordionero, Others) Truck + pipeline Coveñas (Colombia) Gran Tierra benefits from significant oil takeaway capacity & no infrastructure bottlenecks 30
Exploration Overview

 31
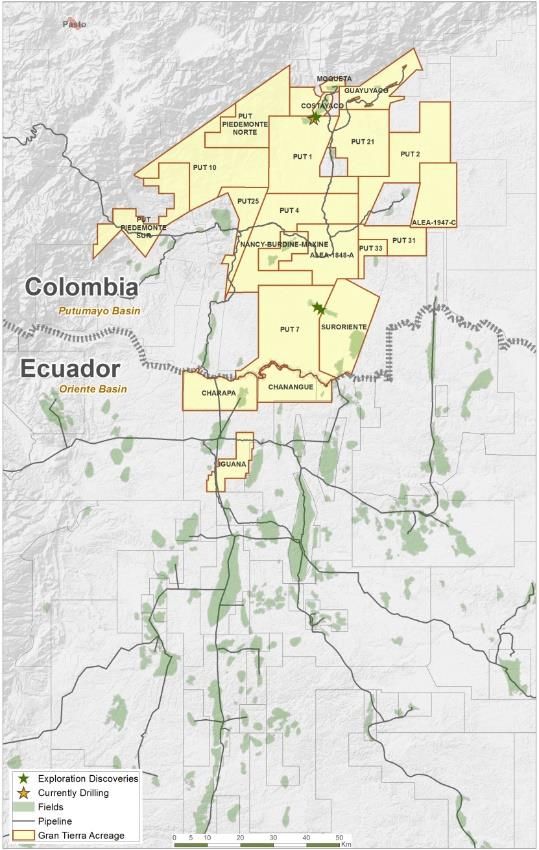
JANUARY 1, 2015 JANUARY 1, 2020
 WHERE WE ARE NOW1 Putumayo Putumayo +
 Oriente

Total Net Acres
(M acres)
 303%
 2,174
 540
 Middle Middle
 Dec/2015 Dec/2019 Mag. Mag.
 Putumayo Llanos Middle Mag Ecuador

# of Prospects and Leads2 153
 364%
 33 Llanos Llanos

 Dec/2015 Dec/2019
 Putumayo Llanos Middle Mag Ecuador

 A transformed exploration portfolio, focused in areas of competitive advantage
 1. See appendix for “Presentation of Oil & Gas Information” in respect of resources information that is not at December 31, 2019 32
 2. Internal Management Estimate
VALUE OF 3D SEISMIC COVERAGE

Regional 2D Seismic Coverage 3D Seismic Coverage Advanced Processing

 3D seismic enhances image quality and improves prospect definition and drilling chance of success
 33
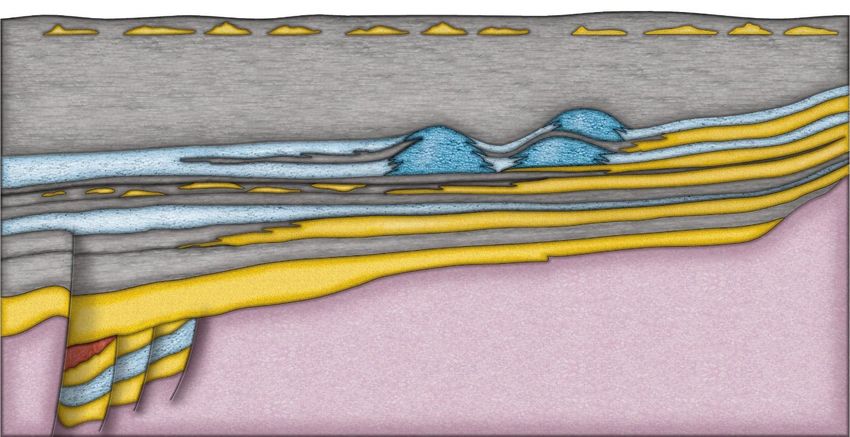
PUTUMAYO / ORIENTE: SCHEMATIC STRATIGRAPHIC SECTION
A Charapa Pomorroso Costayaco Confianza Cohembi Miraflor A’
 Datum:
 N Sst N Sst N Sst
 VILLETA FORMATION

 M2 Lmst
 A Lmst A Lmst A Lmst
 U Sst U Sst
 B Lmst T Sst

 Basement
 Caballos
 COL
 Oil proven in carbonate and clastic
 Jurassic reservoirs; trapped in structural and A A’
 Graben Fill stratigraphic reservoirs
 Sst = Sandstone ECU
 Lmst = Limestone

 Stacked reservoirs maximize value of each exploration opportunity
 34
PUTUMAYO & ORIENTE – UNDEREXPLORED, PROVEN BASINS Colombia’s Putumayo basin is underexplored due to past above-ground security issues, now mitigated by Peace Agreement Same geology as Ecuador, where almost 6 billion bbls of oil produced1 – 7 times the area for seismic coverage in the Oriente 3,100 km2 vs 20,600 km2 – 3 times higher well density 14 wells/10,000km2 vs 43 wells/10,000km2 – 10 times more fields >20 MMBO 6 vs 60 Total Basin GTE Cumulative 2019 Net Land Production 2P Reserves2 Production3 Position Basin1 (Bn bbls) (Bn bbls) (Kbbls/day) (MM acres) Putumayo (Colombia) 0.6 0.7 29 1.2 Oriente (Ecuador) 6.1 10 535 0.1 GTE has built a dominant position across the proven & high-potential Putumayo & Oriente Basins 1. IHS Edin 35 2. Average January 2019 through October 2019 http://www.anh.gov.co/estadisticas-del-sector/sistemas-integrados-de-operaciones/estadisticas-de-produccion 3. Average https://www.controlhidrocarburos.gob.ec/wp-content/uploads/Produccio%CC%81n-Mensual-Acumulada-Enero-Septiembre-2019-1.pdf 4. Certain information in this slide may constitute “analogues information” as defined in NI 51-101. Refer to appendix for “Presentation of Oil & Gas Information – Analogous Information”
Financial Overview & Path to
Appendix
 Value Creation

 36
MCDANIEL PRICE DECKS

 Jan 1, 2020 Oil Price (US$/bbl) Brent Comparison (US$/bbl)

 McDaniel, Jan 1, 2020 McDaniel, Jan 1, 2019
 Brent WTI SEC Brent
 SEC Brent, Jan 1, 2020 SEC Brent, Jan 1, 2019
90 90

85 83.1
 85 81.4
 79.8
 77.9 78.3
80 76.4 80 76.7
 74.9 75.3
 73.4 73.7
75 72.0 75
 70.6 70.7 77.9
 69.2 76.4
 67.0 67.8 74.4 67.9 74.9
70 72.9 70 73.4
 71.5 72.0
 70.1 70.6 64.2
65 68.7 65 69.2
 67.4 67.0
 65.5 67.8
60 63.2 64.2 60
 61.0
55 55
50 50
 2020 2021 2022 2023 2024 2025 2026 2027 2028 2020 2021 2022 2023 2024 2025 2026 2027 2028

 37
GLOSSARY OF TERMS – NON GAAP NON-GAAP TERMS Operating netback: Oil and gas sales less operating and transportation expenses. Operating netback per boe as presented is defined as oil and gas sales price less forecasts of transportation and quality discount, royalties, operating costs and pipeline transportation from the Brent oil price forecast. EBITDA: Net income adjusted for DD&A expenses, interest expense and income tax expense or recovery. Cash from operations (CFO): Cash provided by operating activities excluding the impact from operating working capital. Estimated CFO assumes no operating working capital changes, and therefore CFO equals cash provided by operating activities. Free cash flow (FCF): GAAP "net cash provided by operating activities" less projected capital spending. Management believes that free cash flow is a useful supplemental measure for management and investors to in order to evaluate the financial sustainability of the Company's business. Net debt: Comprised of working capital surplus, senior notes (gross), and reserves-based credit facility (gross). Reserve Life Index (RLI): means the reserves for the particular reserve category divided by annualized 2019 fourth quarter production Net asset value (NAV) per share: NAV per share is calculated as NPV discounted at 10% (before or after tax, as applicable) minus estimated net debt, divided by the number of shares of Gran Tierra's common stock issued and outstanding. Management uses NAV per share as a measure of the relative change of Gran Tierra's net asset value over its outstanding common stock over a period of time. These non-GAAP measures do not have a standardized meaning under GAAP. Investors are cautioned that these measures should not be construed as an alternative to net income or loss or other measures of financial performance as determined in accordance with GAAP. Gran Tierra's method of calculating these measures may differ from other companies and, accordingly, it may not be comparable to similar measures used by other companies. These non-GAAP financial measures are presented along with the corresponding GAAP measure so as to not imply that more emphasis should be placed on the non-GAAP measure. 38
GLOSSARY OF TERMS – OIL & GAS OIL & GAS TERMS Barrel (bbl) Barrels of oil per day (bopd) Thousand cubic feet (Mcf) Barrels of oil equivalent (BOE) Barrels of oil equivalent per day (BOEPD) Million barrels of oil (MMBO) Billion barrels of oil (BNBO) Net after royalty (NAR) Net present value before tax (NPV BT) Net present value after tax (NPV AT) Internal rate of return (IRR) 39
NON-GAAP MEASURES
EBITDA & Adjusted EBITDA
EBITDA, as presented, is defined as net income (loss) adjusted for depletion, depreciation and accretion ("DD&A") expenses, interest expense and income tax expense. Adjusted
EBITDA is defined as EBITDA adjusted for loss on redemption of Convertible Notes, trading securities loss, investment gain, asset impairment and loss on sale of business units and
gain on acquisition. Management uses this financial measure to analyze performance and income or loss generated by Gran Tierra's principal business activities prior to the
consideration of how non-cash items affect that loss, and believes that this financial measure is also useful supplemental information for investors to analyze performance and the
Company's financial results. 2020 EBITDA as presented is defined as 2020 net income adjusted for DD&A expenses, interest expense and income tax expense or recovery.
Management uses this financial measure to analyze performance and income or loss generated by our principal business activities prior to the consideration of how non-cash items
affect that income, and believes that this financial measure is also useful supplemental information for investors to analyze performance and our financial results. Gran Tierra is unable
to provide a quantitative reconciliation of forward-looking EBITDA to its most directly comparable forward-looking GAAP measure because management cannot reliably predict certain of
the necessary components of such forward-looking GAAP measure. A reconciliation from net (loss) income to EBITDA and Adjusted EBITDA is as follows:
 Twelve Months Ended Twelve Months Ended Twelve Months Ended Twelve Months Ended
 December 31, December 31, December 31, December 31,

Adjusted EBITDA - Non-GAAP Measure ($000s) 2019 2018 2017 2016

Net Income (loss) $ 38,690 $ 102,616 $ (31,708) $ (465,565)

Adjustments to reconcile net income (loss) to
EBITDA and Adjusted EBITDA

DD&A expenses 225,033 197,867 131,335 139,535
Interest expense 43,268 27,364 13,882 14,145

Income tax expense (recovery) 57,285 48,871 69,038 (184,669)

EBITDA - Non-GAAP Measure $ 364,276 $ 376,718 $ 182,547 $ (496,554)

Loss on redemption of Convertible Notes 11,501 -

Trading securities loss - - - 3,925
Investment gain (49,884) (786) (111) -
Asset impairment - - 1,514 616,649
Loss on sale of business units and (gain) on
 - - 44,385 (929)
acquisition
Adjusted EBITDA $ 325,893 $ 375,932 $ 228,335 $ 123,091

 40
NON-GAAP MEASURES Funds Flow from Operations Funds flow from operations, as presented, is defined as net income (loss) adjusted for DD&A expenses, asset impairment, deferred tax expense (recovery), stock-based compensation (recovery) expense, amortization of debt issuance costs, cash settlement of RSUs, non-cash lease expense, lease payments, unrealized foreign exchange gains or losses, financial instruments gains or losses, loss on redemption of Convertible Notes, cash settlement of financial instruments and loss on sale of business units and gain on acquisition. Management uses this financial measure to analyze liquidity and cash flows generated by Gran Tierra's principal business activities prior to the consideration of how changes in assets and liabilities from operating activities and cash settlement of asset retirement obligation affect those cash flows, and believes that this financial measure is also useful supplemental information for investors to analyze Gran Tierra's liquidity and financial results. Free cash flow as presented is defined as GAAP "net cash provided by operating activities" less projected 2020 capital spending. Management believes that free cash flow is a useful supplemental measure for management and investors to in order to evaluate the financial sustainability of the Company's business. Gran Tierra is unable to provide a quantitative reconciliation of forward-looking free cash flow to its most directly comparable forward-looking GAAP measure because management cannot reliably predict certain of the necessary components of such forward-looking GAAP measure. Operating netback as presented is defined as 2020 oil and gas sales less operating and transportation expenses. Operating netback per boe as presented is defined as oil and gas sales price less 2020 forecasts of transportation and quality discount, royalties, operating costs and pipeline transportation from the 2020 budget Brent oil price forecast as outlined in the table above. Management believes that operating netback and operating netback per boe are useful supplemental measures for management and investors to analyze financial performance and provides an indication of the results generated by our principal business activities prior to the consideration of other income and expenses. Gran Tierra is unable to provide a quantitative reconciliation of either forward-looking operating netback or operating netback per boe to its most directly comparable forward-looking GAAP measure because management cannot reliably predict certain of the necessary components of such forward-looking GAAP measures. Gran Tierra is unable to provide forward-looking net income and oil and gas sales, the GAAP measures most directly comparable to the non-GAAP measures EBITDA and operating netback, respectively, due to the impracticality of quantifying certain components required by GAAP as a result of the inherent volatility in the value of certain financial instruments held by the Company and the inability to quantify the effectiveness of commodity price derivatives used to manage the variability in cash flows associated with the forecasted sale of its oil production and changes in commodity prices. 41
NON-GAAP MEASURES
 Funds Flow from Operations
 A reconciliation from net cash provided by operating activities to funds flow from operations is as follows:

 Twelve Months Ended December 31, Twelve Months Ended December 31, Twelve Months Ended December 31, Twelve Months Ended December 31,

Funds flow from operations - (Non-GAAP) Measure
 2019 2018 2017 2016
($000s)
Net Income (loss) $ 38,690 $ 102,616 $ (31,708) $ (465,565)

Adjustments to reconcile net income (loss) to funds
flow from operations

DD&A expenses 225,033 197,867 131,335 139,535
Asset impairment - - 1,514 616,649

Deferred tax expense (recovery) 40,227 4,968 44,716 (204,791)

Stock-based compensation expense 1,430 8,299 9,775 6,339

Amortization of debt issuance costs 3,376 3,183 2,415 5,691

Cash settlement of RSUs - (360) (564) (1,234)
Non-cash lease expense 1,806 - - -
Lease payments (1,969) - - -

Unrealized foreign exchange loss (gain) 1,803 11,511 837 (1,428)

Financial instruments (gain) loss (46,215) 12,296 15,929 10,279

Loss on redemption of Convertible Notes 11,501 - - -

Cash settlement of financial instruments (3,273) (33,931) 1,563 438
Loss on sale of business units and (gain) on
 - - 44,385 (929)
acquisition
Funds flow from operations $ 272,409 $ 306,449 $ 220,197 $ 104,984

 42
PRESENTATION OF OIL & GAS INFORMATION
Presentation of Oil & Gas Information
BOEs (Barrel of Oil Equivalent) may be misleading particularly if used in isolation. A BOE conversion ratio of 6 thousand cubic feet of gas to 1 barrel of oil is based on an energy equivalency conversion method
primarily applicable at the burner tip and does not represent a value equivalency at the wellhead. In addition, given that the value ratio based on the current price of oil as compared with natural gas is significantly
different from the energy equivalent of six to one, utilizing a BOE conversion ratio of 6Mcf:1bbl would be misleading as an i ndication of value. Unless otherwise specified, in this presentation, all production is
reported on a working interest (“WI”) basis (operating and non-operating) before the deduction of royalties payable. Per BOE amounts are based on WI sales before royalties.
Well test results should be considered as preliminary and not necessarily indicative of long-term performance or of ultimate recovery. Well log interpretations indicating oil and gas accumulations are not necessarily
indicative of future production or ultimate recovery. If it is indicated that a pressure transient analysis or well-test interpretation has not been carried out, any data disclosed in that respect should be considered
preliminary until such analysis has been completed.
 In this presentation:
• “2P” are 1P reserves plus probable reserves.
• “3P” are 1P plus 2P plus possible reserves.
• “FDC” means future development costs.
• “GAAP” means generally accepted accounting principles in the Unites States of America.
• “Net debt” based on Q4 2019 net debt of $627 million, comprised of working capital of $91 million, high yield bonds of $600 million, and $118 millio n drawn on the reserves-based credit facility. Debt at
 December 31, 2019, prepared in accordance with GAAP.
• “NPV” means net present value.
• “NPV10” means NPV discounted at 10%.
• “possible reserves” are those additional reserves that are less certain to be recovered than probable reserves. There is a 10% probability that quantities actually recovered will equal or exceed sum of proved
 plus probable plus possible reserves. Possible reserves may be developed or undeveloped.
• “probable reserves” are those unproved reserves that are less certain to be recovered than proved reserves. It is equally likely that actual remaining quantities recovered will be greater or less than sum of
 estimated proved plus probable reserves. Probable reserves may be developed or undeveloped.
• “prospective resources” are those quantities of petroleum estimated, as of a given date, to be potentially recoverable from undiscovered accumulations by application of future development projects. There is
 no certainty that any portion of the prospective resources will be discovered. If discovered, there is no certainty that it will be commercially viable to produce any portion of the prospective resources.
 Prospective resources have both an associated chance of discovery and a chance of development. Not all exploration projects will result in discoveries. Chance that an exploration project will result in
 discovery of petroleum is referred to as “chance of discovery.” Thus, for an undiscovered accumulation, chance of commerciality is product of two risk components: chance of discovery and chance of
 development.
• “proved developed reserves” are those proved reserves that are expected to be recovered from existing wells and installed facilities or, if facilities have not been installed, that would involve a low expenditure
 (e.g., when compared to cost of drilling a well) to put reserves on production. Developed category may be subdivided into producing and non-producing.
• “proved reserves” or “1P” are those reserves that can be estimated with a high degree of certainty to be recoverable. It is l ikely that actual remaining quantities recovered will exceed estimated proved reserves.
• “proved undeveloped reserves” or “PUD” are those proved reserves expected to be recovered from known accumulations where a si gnificant expenditure (e.g., when compared to cost of drilling a well) is
 required to render them capable of production.
• “reserves” are estimated remaining quantities of oil and natural gas and related substances anticipated to be recoverable from known accumulations, as of a given date, based on: (a) analysis of drilling,
 geological, geophysical and engineering data; (b) use of established technology; and (c) specified economic conditions, which are generally accepted as being reasonable. Reserves are classified according to
 degree of certainty associated with estimates.
Certain terms used in this presentation but not defined are defined in NI 51-101, CSA Staff Notice 51-324 - Revised Glossary to NI 51-101 Standards of Disclosure for Oil and Gas Activities (“CSA Staff Notice 51-
324”) and/or the COGEH and, unless the context otherwise requires, shall have the same meanings herein as in NI 51-101, CSA Staff Notice 51-324 and the COGEH, as the case may be.

 43
PRESENTATION OF OIL & GAS INFORMATION
Reserves and Prospective Resources Information
Unless otherwise expressly stated, all reserves and resources values, future net revenue, ancillary information and any measure of oil and gas activities contained in this presentation is as at December 31, 2019 and has been prepared and
calculated in accordance with Canadian National Instrument 51-101 – Standards of Disclosure for Oil and Gas Activities (“NI 51-101”) and the Canadian Oil and Gas Evaluation Handbook (“COGEH”) and derived, in the case of reserves,
from a report with an effective date of December 31, 2019 prepared by McDaniel & Associates Consultants (“McDaniel”), Gran Tierra’s independent qualified reserves evaluator and auditor (the “GTE McDaniel December 31, 2019
Reserves Report”), in the case of prospective resources related to the Alguacil Deep Prospect and the Gaitas Prospect, from a report with an effective date of December 31, 2017 prepared by McDaniel (the “GTE McDaniel December 31,
2017 Prospective Resources Report”) and in the case of prospective resources related to the Ayombero Prospect, from a report with an effective date of April 30, 2018 prepared by McDaniel (the “GTE McDaniel April 30, 2018 Ayombero
Prospective Resources Report”).
Gran Tierra's Statement of Reserves Data and Other Oil and Gas Information on Form 51-101F1 dated effective as at December 31, 2019, which will include further disclosure of its oil and gas reserves and other oil and gas information in
accordance with NI 51-101 forming the basis of certain items included in this presentation, will be available on SEDAR at www.sedar.com on or before February 27, 2020.
Estimates of reserves provided in this presentation are estimates only and there is no guarantee that estimated reserves will be recovered. Actual reserves may be greater than or less than estimates provided in this presentation and
differences may be material. Estimates of net present value of future net revenue attributable to the Company’s reserves do n ot represent fair market value and there is uncertainty that net present value of future net revenue will be realized
and such estimates and future net revenue for individual properties may not reflect same confidence level as estimates of reserves and future net revenue for all properties, due to effects of aggregation. There is no assurance that forecast
price and cost assumptions applied by McDaniel in evaluating Gran Tierra’s reserves will be attained and variances could be material.
All evaluations of future net revenue contained in this presentation are after the deduction of royalties, operating costs, development costs, production costs and abandonment and reclamation costs but before consideration of indirect costs
such as administrative, overhead and other miscellaneous expenses. It should not be assumed that the estimates of future net revenues presented in this presentation represent the fair market value of the reserves. There are numerous
uncertainties inherent in estimating quantities of crude oil, reserves and the future cash flows attributed to such reserves. The reserve and associated cash flow information set forth in this presentation are estimates only.
References to thickness of “oil pay” or of a formation where evidence of hydrocarbons has been encountered is not necessarily an indicator that hydrocarbons will be recoverable in commercial quantities or in any estimated volume.
The estimates of prospective resources provided in this presentation are estimates only and there is no guarantee that the estimated prospective resources will be recovered. Actual resources may be greater than or less than the estimates
provided in this in this presentation and the differences may be material. There is no assurance that the forecast price and cost assumptions applied by McDaniel or the GTE Management Evaluator, as applicable, in evaluating Gran
Tierra's prospective resources will be attained and variances could be material.
Estimates of prospective resources are by their nature more speculative than estimates of proved reserves and would require substantial capital spending over a significant number of years to implement recovery. Actual locations drilled
and quantities that may be ultimately recovered from our properties will differ substantially. In addition, GTE has made no commitment to drill, and likely will not drill, all of the drilling locations that have been attributable to these quantities.
The following classification of prospective resources is used in this presentation:
• Mean Estimate represents the arithmetic average of the expected recoverable volume. It is the most accurate single point representation of the volume distribution.
• Low Estimate means there is at least a 90 percent probability (P90) that the quantities actually recovered will equal or exceed the low estimate.
• Best Estimate means there is at least a 50 percent probability (P50) that the quantities actually recovered will equal or exceed the best estimate.
• High Estimate means there is at least a 10 percent probability (P10) that the quantities actually recovered will equal or exceed the high estimate.
Given the uncertainty of discovery associated with the prospective resources described in this presentation, costs and timelines to production, as well as recovery technologies, were not able to be determined at the time of the applicable
estimates.
For a discussion of Gran Tierra’s s interest in the prospective resources related to the GTE McDaniel December 31, 2017 Prospective Resources Report, the location of such prospective resources, the product type reasonably expected,
the risks and level of uncertainty associated with recovery of the resources, the significant positive and negative factors relevant to the estimate of such prospective resources, a description of the applicable projects maturity
subcategories and other relevant information regarding such prospective resources estimate, please see the Company’s Statement of Reserves and Other Oil and Gas Information on Form 51-101F1 effective as at December 31,
2017 available on SEDAR at www.sedar.com. For a discussion of Gran Tierra’s s interest in the prospective resources related to the GTE McDaniel April 30, 2018 Ayombero Prospective Resources Report, the location of such prospective
resources, the product type reasonably expected, the risks and level of uncertainty associated with recovery of the resources, the significant positive and negative factors relevant to the estimate of such prospective resources, a
description of the applicable projects maturity subcategories and other relevant information regarding such prospective resources estimate, please Gran Tierra’s press release dated November 1, 2018.

 44
You can also read