Q4 & preliminary full year 2020 report - Nordic Semiconductor
←
→
Page content transcription
If your browser does not render page correctly, please read the page content below
Q4
& preliminary full year
2020 report
Content
3     Q4 & 2020 highlights

4     Key figures

5     Q4 & FY2020 review
       Operational review
       Revenue
       Financial results
       Financial position
       Cash flow
       Risk and uncertainty

16    Outlook

18    Condensed financial information

22    Notes to the condensed consolidated
      financial statements

26    Alternative performance measures
NORDIC SEMICONDUCTOR | Q4 & PRELIMINARY 2020 (UNAUDITED)
Q4 & 2020 HIGHLIGHTS
Revenue of USD 127.1 million in Q4 (+53%) Acquired Wi-Fi development team and Wi-Fi
EBITDA of USD 26.9 million (+120%) and pre-tax
technology assets from Imagination Technologies
profit of USD 16.7 million in Q4 (+213%) Full-year 2020 revenue of USD 405.2 million (+41%),
Record order backlog of USD 492 million (+361%) with gross margin of 52.8% (50.9%)
Full-year 2020 EBITDA of USD 76.8 million (+134%)
and pre-tax profit of USD 42.9 million (+342%)
Revenue EBITDA
USD million Revenue USD million EBITDA
140.0 35.0
127.1
119.4 28.6
120.0 30.0
26.9
100.0 25.0
88.5
83.1
80.0 70.2 20.0
16.0
60.0 15.0 12.2
40.0 10.0
5.2
20.0 5.0
0.0 0.0
Q4 2019 Q1 2020 Q2 2020 Q3 2020 Q4 2020 Q4 2019 Q1 2020 Q2 2020 Q3 2020 Q4 2020
Gross margin EBITDA margin
Gross Margin EBITDA Margin
24.0%
56% 25%
54.1%
21.1%
54% 52.7%
51.6% 51.9% 51.9% 20% 18.1%
52%
14.7%
50% 15%
48%
46% 10% 7.5%
44%
5%
42%
40% 0%
Q4 2019 Q1 2020 Q2 2020 Q3 2020 Q4 2020 Q4 2019 Q1 2020 Q2 2020 Q3 2020 Q4 2020
3
NORDIC SEMICONDUCTOR | Q4 & PRELIMINARY 2020 (UNAUDITED)

KEY FIGURES
Q4 & FY2020 financial summary

                                                       Q4                               Full year

 Amount in USD million                       2020          2019    Change      2020         2019    Change
 Revenue                                      127.1         83.1    52.9%      405.2       288.4      40.5%

 Gross profit                                 67.0          42.9    56.3%       213.9       146.8     45.8%

 Gross margin %                             52.7%          51.6%    1.1 p.p.   52.8%       50.9%     1.9 p.p.

 EBITDA                                       26.9          12.2    120.2%      76.8         32.8    134.0%

 EBITDA %                                    21.1%         14.7%   6.5 p.p.    18.9%        11.4%    7.6 p.p.

 Operating profit (EBIT)                      18.6           5.4   248.0%       45.7          9.3    393.0%

 Operating profit % (EBIT)                  14.7%          6.4%    8.2 p.p.    11.3%        3.2%     8.1 p.p.

 Net profit after tax                         19.3           4.4   340.9%       38.4          7.3   424.0%

 Cash and cash equivalents                                                     242.5        90.6      167.6%

 Order backlog                                                                 491.8        106.6    361.4%

 LTM opex excluding depreciation/                                              33.8%       39.5%    -5.7 p.p.
 LTM revenue

 Net working capital / LTM revenue                                             19.4%       24.3%    -4.9 p.p.

 Equity ratio                                                                  78.0%       72.9%     5.1 p.p.

 Number of employees                                                             978          767     27.5%

                                                                                                                4
NORDIC SEMICONDUCTOR | Q4 & PRELIMINARY 2020 (UNAUDITED)

Q4 & FY2020 REVIEW
Revenues amounted to USD 127.1 million in the fourth quarter 2020, an
increase of 53% from the fourth quarter last year. Revenue for the full year
amounted to USD 405.2 million, which was an increase of 41% from 2019.
Order backlog increased almost fivefold to a record high USD 492 million at
the end of the year, reflecting strong demand across all end-user markets
both from large tier-1 customers and the broad market. Nordic has placed
early orders for wafer volumes that would allow for a significant increase in
production volumes in 2021, although an increasingly unbalanced demand/
supply situation through the semiconductor value chain limits the supply of
wafers required to take full advantage of the current strong demand.
Operational review                                           Proprietary revenue grew 27% in 2020. Proprietary
Nordic Semiconductor remained fully operational and          growth was driven by a strong demand from PC
in full compliance with national and local Covid-19          accessory customers throughout 2020 as an effect of
regulations also during the second wave that hit             increased home office related purchases. Nordic also
the markets in Q4 2020, and the company and its              saw increased demand for proprietary both in fitness
partners have been able to uphold well-functioning           related products and gaming. For 2021, Nordic sees
supply, production and distribution chains. Nordic has       stable proprietary demand from PC accessory customers
also proceeded as planned with all internal product          when comparing to 2020. However, looking at the total
development projects with strengthened online                overall revenue from proprietary, the company still
developer and customer support to compensate for             expects a high single-digit percentage drop. As earlier
restrictions on travels and physical meetings.               communicated, the general trend in the industry is the
                                                             transition from proprietary products over to Bluetooth.
Step change in order backlog
As Nordic saw strong demand across all its main market
verticals throughout 2020, further accentuated in the
order backlog in Q4. The order backlog increased from
USD 107 million at the end of 2019 to USD 123 million at
the end of Q1 2020 and USD 202 million at the end of
Q2 2020. This increased further to USD 288 million at        Based on the high demand, Nordic placed early orders
the end of Q3 2020, before the company saw a step            for wafer volumes that would allow for a significant
change in order inflow in the final quarter of the year.     production increase also in 2021.
The order backlog of USD 492 million at the end of 2020
represents almost a fivefold increase from the level at      Given constraints in the supply chain, the company has
the end of 2019 and stretches out over the full year 2021.   been informed by its main wafer supplier in Taiwan of
                                                             limitations in wafer allocation for 2021. Current forecasts
The order backlog reflects strong demand across the          for wafer deliveries indicate that Nordic will have room
range of end-user applications in the broad market, as       to increase production by a minimum of 25% from 2020
well as more contracts with major tier-1 customers with      to 2021.
significantly higher volume potential than the average
customer. These customers are typically placing orders       The wafer shortage is expected to have the largest
with longer timeframes.                                      impact in Q2 2021, with higher volumes expected in the
                                                             second half of the year.
The high order volume in Q4 2020 may also be an
indication that some customers placed early orders to        Nordic has established excess capacity in crucial areas
secure supply throughout 2021 and into 2022.                 such as in-house testing capabilities to ensure sufficient
                                                             backend production capacity to meet increased
The Bluetooth revenue growth of 43% in 2020 exceeded         demand.
the medium-term 20%-30% annual growth rate
previously indicated for this technology.

                                                                                                                           5
NORDIC SEMICONDUCTOR | Q4 & PRELIMINARY 2020 (UNAUDITED)

FCC data compiled by DNB Markets show that Nordic
had a market share of 45% of new design certifications
in the Bluetooth Low Energy market both in the fourth
quarter and the full year 2020. Nordic accounted for 141
of the 316 new Bluetooth Low Energy designs that were
certified during the fourth quarter, and for 535 of the
1.188 that were certified during 2020.

Nordic sees high activity in its DevZone developer
community and continued growth in developer kit
shipments. Total kit shipments increased by 9% to
95,000 in 2020, with more than 50,000 kits shipped in
the second half of the year.

Steady stream of new product launches
The flow of new product launches with Nordic inside
continued also in the final quarter of the year, with        Platform companies embracing multiprotocol
product launches across its entire range of Bluetooth        solutions
Systems-on-a-Chip (SoCs) from the entry level nRF52805       The smart home market continues to grow rapidly, with
to the top-of-the-line nRF52840.                             major global platform companies now beginning to
                                                             enable multiprotocol solutions on their smart home hubs
                                                             and speakers.

                                                             Apple in the second half launched a new HomePod Mini
                                                             that added the Thread network protocol to its Bluetooth
                                                             5.0, Wi-Fi and ultra-wideband wireless capabilities.
                                                             Nordic’s long-standing customer Eve Systems became the
                                                             first brand to take advantage of this market opportunity.
As usual, the launches cover a very wide variety of          Eve products powered by Nordic’s multiprotocol
applications, showing the ubiquitous nature of the           nRF52840 SoC – such as the latest generation of the
technology. Customers within consumer electronics            Eve Thermo temperature sensor– can now connect to
launched products like gaming keyboards, smart               Apple HomeKit over Thread with a simple over-the-air
presentation pointers, remote controls and temperature/      firmware update.
humidity sensors for music instruments, whereas
examples in the Wearables market include new smart
watches, wireless instrument control, and wearable
proximity monitors to secure social distancing.

The company also saw several new Building & Retail
products coming to the market, including beacons for
pallet tracking, a module for direction and precision
positioning, and a module for a mesh network building
automation platform. Several companies also launched
new modules specifically designed for space constrained
industrial IoT products.

In Healthcare the list included a disinfection thermometry
pen, a temperature sensor for continuous infection
monitoring and Covid-19 testers. Notably, US and
Australia-based Ellume in December launched an FDA-
approved home tester for Covid-19 infections, which the
company believes will ship in tens of millions of units.

                                                                                                                         6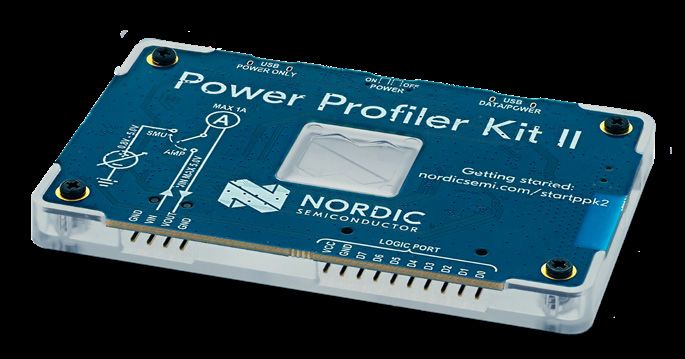
NORDIC SEMICONDUCTOR | Q4 & PRELIMINARY 2020 (UNAUDITED)
In November, Nordic announced that its nRF Connect Industry first in deploying machine learning and
Software Development Kit (SDK) offers application AI on SoCs
software development support to accelerate time-to- After the end of the year, Nordic announced a
market for Alexa gadgets working with Amazon Echo partnership with Edge Impulse that will enable Nordic’s
devices. Other recent initiatives include cooperation nRF52 and nRF53 customers to be the first to add AI
on Amazon Common Software (ACS), a platform to and machine learning features to Bluetooth Low Energy
help accelerate the development of smart home and applications. Edge Impulse is a leading provider of
other wireless products, and on Bluetooth Low Energy ‘TinyML’ machine learning tools for resource constrained
solutions for Amazon Sidewalk. semiconductor devices.
The two companies have in 2020 co-operated on a
wildlife tracker project in Africa, as suppliers to a joint
initiative of Avnet community, Hackster.io and the
wildlife conservation organization Smart Parks.
As described in previous interim reports, Nordic is a
member of Project Connected Home over IP (CHIP), which AI and machine learning capabilities will also be included
is working to develop a common unified connectivity in the next generation of the BBC micro:bit educational
protocol for smart home solutions that will complement tool for young aspiring coders and developers.
Bluetooth Low Energy, Thread, Zigbee and Wi-Fi.
Cellular IoT moving forward
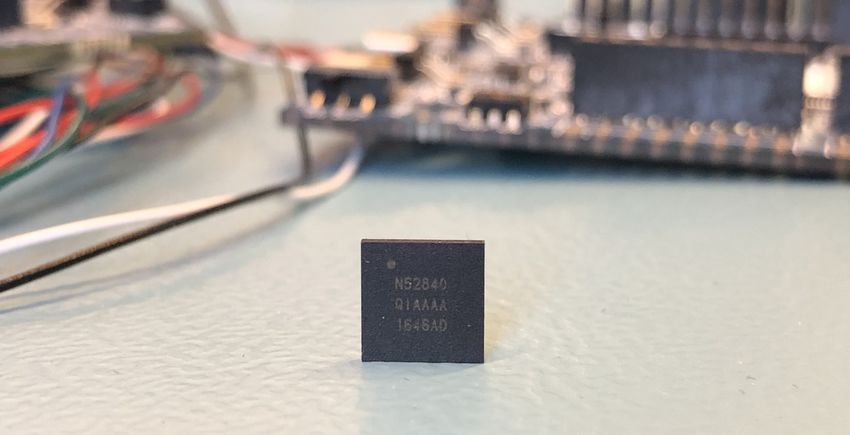
nRF53 moving into commercial production Nordic continued to broaden the carrier certification
Nordic’s first product in the nRF53 generation -the program for its nRF9160 cellular IoT System-in-Package
dual-processor nRF5340- entered commercial volume (SiP) in the fourth quarter, adding certifications from
production in December, and Nordic in January KDDI and Softbank in Japan and LGU+ in South Korea.
announced that Laird Connectivity in the US has chosen
the new SoC for a module addressing applications that The nRF9160 SiP has earlier been certified by Verizon
require the highest possible performance and security. and AT&T in the US, Bell in Canada, Telstra in Australia,
China Telecom in China and globally by Deutsche
Telecom and Vodafone.
The dual core nRF5340 supports Bluetooth 5.2/
Bluetooth Low Energy, Bluetooth mesh, Thread, and
Zigbee. Designed for highly complex applications, the During the fourth quarter Nordic also expanded the
SoC also meets the requirements of LE Audio and will global cellular IoT coverage for nRF9160 by partnering
enable multi-stream synchronized audio streaming over up with UK-based M2M managed services provider
Bluetooth Low Energy. Arkessa, who offers extensive European and global
coverage for both LTE-M and NB-IoT networks. Focusing
on global cellular IoT connectivity for enterprises, Arkessa
eliminates the need for Nordic’s customers to negotiate
cellular IoT data connectivity contracts with individual
carriers. The company will offer technical support and
easy access to trial packs for global connectivity testing
and evaluation.
7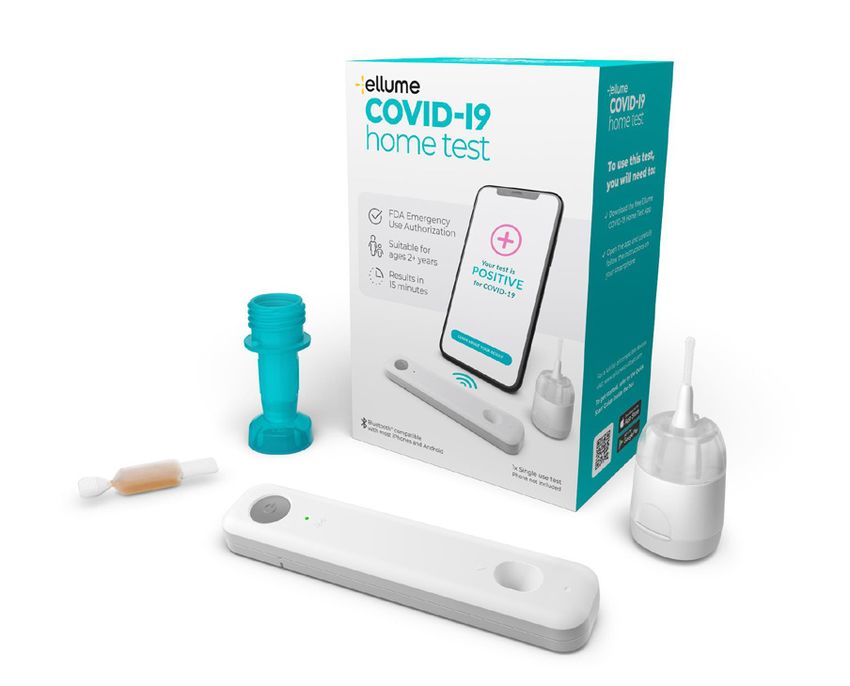
NORDIC SEMICONDUCTOR | Q4 & PRELIMINARY 2020 (UNAUDITED)

Developers of new cellular IoT applications will also        Q4 2020 customer product launches with nRF9160
benefit from Nordic’s launch of the faster and more          included a smart utility meter combining cellular IoT,
cost-efficient Power Profile Kit II for real-time power      LoRaWan and the European industry standard M-Bus
measurement during wireless product development. The         (Meter-Bus), a tracker and gateway location monitor, a
new kit is available across all Nordic Development Kits      standalone contactless POS/payment terminal, and a
and custom designs, including the nRF9160.                   real-time healthcare monitoring system combining wireless
                                                             sensors at hand sanitizers and employee ID cards.

                                                             Expanding into Wi-Fi
                                                             At the end of November, Nordic press-released the
                                                             acquisition of the entire Wi-Fi development team, core
                                                             Wi-Fi expertise and the Wi-Fi IP technology assets of
                                                             Imagination Technologies Group. The Wi-Fi assets
                                                             include Wi-Fi 4, 5, and 6, and a large patent portfolio.

Nordic in December announced that Ericsson and Sigma
Connectivity had chosen nRF9160 and the advanced
multiprotocol SoC nRF52840 to provide LTE-M, NB-IoT
and Bluetooth connectivity for their joint ‘ARDESCO’
reference IoT design. ARDESCO is designed to help
enterprises develop, deploy and manage cellular IoT
solutions over the entire product lifecycle.

Japanese Braveridge in December chose the nRF9160
for the ‘Sonicboard’ development kit, which is designed
to help firmware engineers and developers speed up
prototyping and time-to-market for cellular IoT solutions.   Given that Nordic has established strong positions in
                                                             Bluetooth Low Energy and multiprotocol solutions and
Avnet Asia chose to integrate nRF9160 and nRF52840           the emerging Cellular IoT market, WiFi has been the
for their new ‘AVT9152’ module, which will be the smallest   main missing capability requested by customers. The
available module combining LTE-M/NB-IoT, Bluetooth           acquisition makes Nordic one of few companies offering
and GPS.                                                     all three of the world’s most popular IoT technologies:
                                                             Bluetooth, Wi-Fi and cellular IoT.
Dutch engineering and design specialist, SODAQ,
is using a Nordic nRF9160 in the world’s first solar-        The acquisition will enable Nordic to create a
powered, perpetual operation cellular IoT asset tracker.     development platform unifying all the wireless
SODAQ makes turn-key solutions for companies                 technologies in future generations of Nordic products,
wanting to deploy low power, low-cost generic asset          which could expand Nordic’s addressable market
tracking devices. SODAQ has three different trackers         significantly.
with different features using nRF9160.
                                                             The acquisition increases Nordic's R&D staff by 81
Nordic’s end-user customers are working on cellular          people across several locations in the UK, Sweden,
IoT projects across a wide variety of verticals, including   India and Taiwan. The team also includes Bluetooth Low
smart cities, logistics and asset tracking, industrial and   Energy specialists who will further strengthen Nordic's
agricultural monitoring systems, metering, parking and       existing R&D team in this area. Nordic expects annual
payment systems, etc.                                        R&D spend to increase by USD 10-12 million due to the
                                                             acquisition and expects to see a meaningful revenue
                                                             contribution from Wi-Fi products within three years.

                                                                                                                         8
NORDIC SEMICONDUCTOR | Q4 & PRELIMINARY 2020 (UNAUDITED)

INCOME STATEMENT
Revenue
                                                                                     Full year    Full year
 Amounts in USD thousand                     Q4 2020          Q4 2019    Change                                 Change
                                                                                         2020          2019

 Bluetooth                                      97 603         65 524      49.0%       316 020       221 151      42.9%

 Proprietary wireless                           25 315         16 344      54.9%        76 144      59 944        27.0%

 Short range wireless components               122 917         81 868       50.1%     392 163      281 094        39.5%

 Cellular IoT                                    2 663            160    1 564.4%        6 527        1 046      524.3%

 ASIC components                                  1 547          1 105     40.0%         6 297       6 039         4.3%

 Consulting services                                  -              -           -         230          216        6.6%

 Total revenue                                  127 127        83 133      52.9%       405 217     288 395        40.5%

Nordic Semiconductor (Nordic or the Group) reported             figures reflect continued high demand for home office
total revenue of USD 127.1 million in Q4 2020. This was         equipment and PC accessories. Proprietary revenue
an increase of 53% from USD 83.1 million in Q4 2019.            accounted for 20% of total revenue in the quarter.

Revenue was slightly above the guidance range                   Cellular IoT remains in the early stages of
provided in the financial report for the third quarter.         commercialization and reported revenue of USD 2.7
The continued high revenue growth reflects accelerated          million in Q4 2020. This was an increase from USD 0.2
technology adoption and demand increases from both              million in Q4 2019. Current revenues reflect both sales of
tier-1 customers and the broad market across all end-           development kits and initial sales of end-user products.
user markets.
                                                                For the full-year 2020, revenue amounted to USD
Nordic classifies revenues into the following technologies:     405.2 million, which was an increase of 41% from USD
Short-range wireless components, long range (cellular           288.4 million in 2019. Bluetooth revenue increased by
IoT) wireless components, ASIC components, and                  43% to USD 316.0 million, whereas Proprietary revenue
Consulting services. Short-range wireless components            increased by 27% to USD 76.1 million. Cellular revenue
are in turn split between Bluetooth and multiprotocol           amounted to USD 6.5 million, compared to USD 1.0
solutions and Proprietary solutions.                            million in 2019, whereas ASIC revenues increased by 4%
                                                                to USD 6.3 million.
Bluetooth revenue amounted to USD 97.6 million in Q4
2020, an increase of 49% from USD 65.5 million in Q4 2019.      Nordic reports its short-range wireless component
Bluetooth share of total revenue was 77% in the quarter.        revenues based on the following end-product markets:
                                                                Consumer electronics, Wearables, Healthcare, Building
Proprietary revenue was USD 25.3 million in Q4 2020,            and retail, and Others.
which was an increase of 55% year-on-year. The

 Revenues by end-product markets                                                     Full year    Full year
 Amounts in USD thousand                       Q4 2020        Q4 2019    Change          2020          2019    Change

 Consumer Electronics                            53 736        33 797       59.0%       163 131     119 409      36.6%

 Wearables                                       18 094         16 107      12.3%       62 967      50 386       25.0%

 Building/Retail                                 26 967         16 611      62.3%        81 871      51 595       58.7%

 Healthcare                                      10 593         4 969      113.2%       37 830       19 725       91.8%

 Others                                           13 527       10 384      30.3%       46 364        39 979       16.0%

 Short range wireless components                 122 917       81 868       50.1%      392 163     281 094       39.5%

                                                                                                                             9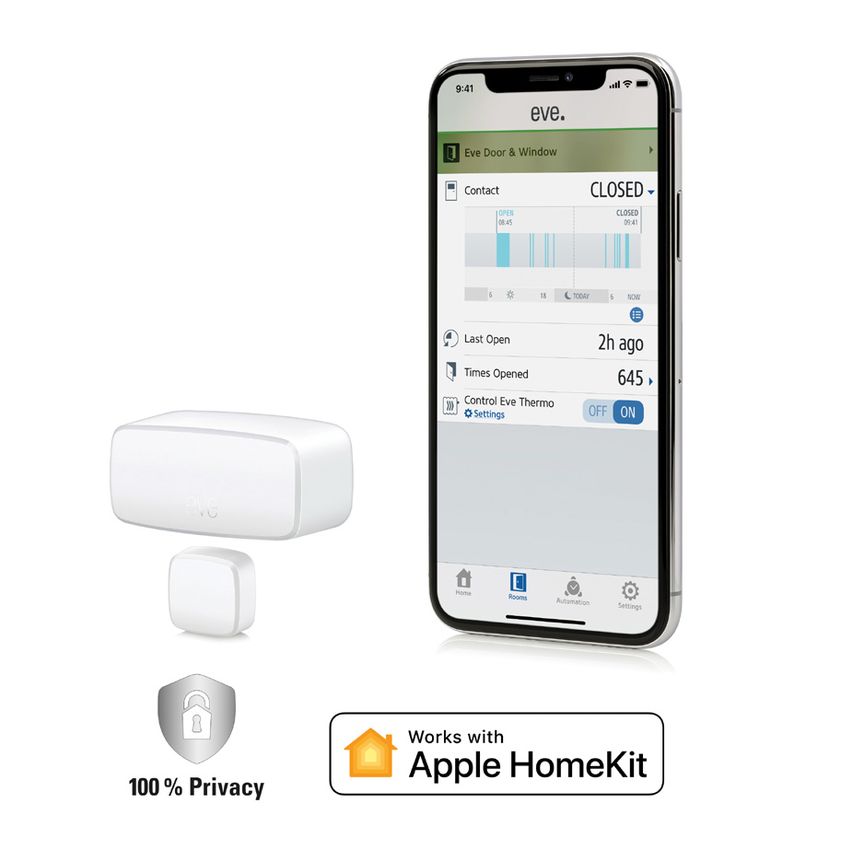
NORDIC SEMICONDUCTOR | Q4 & PRELIMINARY 2020 (UNAUDITED)

                                                                 USD million                  X
                                                                30.0
                                                                                                                       27.0

Consumer Electronics remained the largest end-product           25.0                                         22.9
market, generating 59% revenue growth to USD 53.7
                                                                20.0                                18.8
million in Q4 and 37% growth to USD 163.1 million for
                                                                         16.6
the full year 2020. The revenue growth reflects both
increased Bluetooth sales and continued high deliveries         15.0                   13.2

of Bluetooth and proprietary products for PC accessories
                                                                10.0
for a growing home office market. Gaming accessories
have also become a key revenue driver in Consumer
                                                                 5.0
Electronics over the last year.

USD million                   X                                  0.0
                                                                       Q4 2019      Q1 2020       Q2 2020   Q3 2020   Q4 2020
60.0                                         55.4               Revenue - Building/Retail
                                                       53.7

50.0
                                                                Healthcare revenue increased by 113% year over year
                                                                to USD 10.6 million in Q4 2020 and by 92% to USD 37.8
40.0
          33.8                                                  million for the full year 2020. This reflects deliveries for
                                   29.5                         directly Covid-19 related applications, and the pandemic
30.0
                       24.5                                     has also accelerated the adoption of connected
20.0                                                            healthcare devices in general. As previously highlighted
                                                                by the company, Nordic sees the Healthcare segment as
10.0                                                            a market with potentially disruptive growth and as one
                                                                of the key growth drivers for combined short-range and
 0.0                                                            long-range products and solutions.
        Q4 2019       Q1 2020     Q2 2020   Q3 2020   Q4 2020
                                                                USD million                   X
Revenue - Consumer Electronics
                                                                16.0
                                                                                                   14.0
Wearables revenues increased by 12% to USD 18.1 million         14.0
in Q4 2020, and by 25% to USD 63.0 million for the full         12.0
                                                                                                                       10.6
year 2020. Nordic has established a particularly strong
                                                                10.0
position in the premium domestic market in China.
                                                                                                              7.8
USD million                   X                                 8.0

                                                                6.0                    5.5
25.0                                                                     5.0

                                                                4.0
                                             19.4
20.0                                                    18.1    2.0
          16.1
                                    14.1                        0.0
15.0
                                                                       Q4 2019     Q1 2020        Q2 2020   Q3 2020   Q4 2020
                       11.4
                                                                Revenue - Healthcare
10.0

                                                                Revenues in the ‘Others’ category increased 30% year-
 5.0
                                                                over-year to USD 13.5 million in Q4 2020 and by 16% for
                                                                the full year 2020. This mainly reflects sales to module
 0.0                                                            manufacturers servicing many end-products in all
        Q4 2019       Q1 2020     Q2 2020   Q3 2020   Q4 2020
                                                                markets and regions.
Revenue - Wearables                                              USD million                  X
                                                                16.0
Building & Retail revenues increased by 62% year over
                                                                14.0                                                   13.5
year to USD 27.0 million in Q4 2020, and by 59% to
                                                                                       12.1
USD 81.9 million for the full year 2020. The increase           12.0
                                                                         10.4                                10.7
reflects continued growth for both industrial and home                                              10.1
                                                                10.0
automation applications such as smart lighting systems,
alarm systems, smoke detectors, temperature controls,           8.0
smart locks and share-bikes.
                                                                6.0

                                                                4.0

                                                                2.0

                                                                0.0
                                                                       Q4 2019     Q1 2020        Q2 2020   Q3 2020   Q4 2020

                                                                Revenue - Others

                                                                                                                                10
NORDIC SEMICONDUCTOR | Q4 & PRELIMINARY 2020 (UNAUDITED)
Financial results
Full year Full year
Amounts in USD thousand Q4 2020 Q4 2019 Change 2020 2019 Change
Gross profit 67 033 42 901 56.3% 213 943 146 753 45.8%
Gross margin 52.7% 51.6% 1.1 p.p. 52.8% 50.9% 1.9 p.p.
Operating expenses excl. depreciation
40 169 30 703 30.8% 137 165 113 946 20.4%
and amortization
EBITDA 26 865 12 198 120.2% 76 778 32 807 134.0%
EBITDA % 21.1% 14.7% 6.5 p.p. 18.9% 11.4% 7.6 p.p.
Depreciation and amortization 8 240 6 846 20.4% 31 063 23 535 32.0%
EBIT 18 625 5 352 248.0% 45 714 9 272 393.0%
Gross profit primarily reflects a larger workforce to handle higher
Gross profit increased by 56% to USD 67.0 million in Q4 activity, future growth, and portfolio investments.
2020 (42.9), and by 46% to USD 213.9 million for the full
year 2020 (146.8). Nordic capitalized a total of USD 1.7 million in
development expenses in Q4 2020, of which USD 1.0
Gross margin was 52.7% in Q4 2020 (51.6%), and 52.8% million related to cellular IoT investments and USD 0.7
for the full year 2020 (50.9%). million to the short-range business. Expenses related to
equity compensation was USD 1.0 million in Q4 2020.
The margin levels reflect good demand for high-end,
high-margin SoCs, positive scale effects, and continuous Total cash operating expenses amounted to USD 40.9
cost improvements on recently launched products. This million in Q4 2020, when adding back capitalized
was only partly offset by the negative gross margin development expenses and deducting depreciation
effects of a larger number of tier-1 customers and and equity-based compensation from total operating
cellular IoT revenue with lower gross margin. expenses. This compares to USD 33.3 million in Q4 2019.
Operating expenses USD 29.9 million of cash operating expenses were
Operating expenses amounted to USD 40.2 million in personnel expenses (23.4), mainly reflecting 17% growth
Q4 2020, excluding depreciation and amortization, in the number of employees to 897 over the past year. This
compared to USD 30.7 million in Q4 2019. The increase excludes 81 employees added through the acquisition of
11NORDIC SEMICONDUCTOR | Q4 & PRELIMINARY 2020 (UNAUDITED)
the Wi-Fi development team of Imagination Technologies EBITDA for the full year 2020 amounted to USD 76.8
Group in Q4 2020. Including this acquisition, the number million, compared to USD 32.8 million in 2019, with
of employees was 978 at year end. the EBITDA-margin improving to 18.9% from 11.4%
last year. Short-range EBITDA was USD 106.9 million
The company continues to invest and add new employees (57.6), with a corresponding EBITDA-margin of 26.8%
to support a higher activity level, strengthen customer for 2020 (20.0%).
relations, and further develop the technology footprint.
The number of employees in R&D increased 18% to 665 Depreciation and amortization increased to USD 8.2
and increases further to 746 when including the newly million in Q4 2020, with the year-over-year increase
acquired Wi-Fi business. The Sales & Marketing staff from USD 6.8 million mainly reflecting that Nordic
increased 10% to 125, with the supply chain organization started amortizing cellular IoT intangibles towards the
increasing by 24% to 57 employees to support the higher end of 2019. Amortization of internally developed R&D
revenue. overall amounted to USD 2.1 million and amortizing of
leased assets to USD 1.4 million.
Other cash operating expenses were USD 10.9 million
(10.0), with less travel due to Covid-19 offsetting general For the full year depreciation and amortization amounted
cost increases over the past year. to USD 31.1 million, up from USD 23.5 million in 2019.
Cash operating expenses for cellular IoT isolated were Net financial costs amounted to USD 1.9 million in Q4
USD 11.1 million in Q4 2020, compared to USD 8.2 million 2020, primarily reflecting foreign exchange losses of
in Q4 2019. USD 2.2 million. For the full year net financial costs
amounted to USD 2.8 million, whereof foreign exchange
For the full year 2020, total operating expenses were USD losses accounted for USD 2.0 million. This compares to a
137.2 million, excluding depreciation and amortization, net financial gain of USD 0.4 million in 2019.
up from USD 113.9 million in 2019.
Profit before tax was USD 16.7 million in Q4 2020,
Total cash operating expenses were USD 141.2 million, compared to a profit before tax of USD 5.3 million in
up from USD 123.4 million in 2019, of which USD 102.6 Q4 2019. The company booked a tax income of USD 2.6
million in personnel expenses (86.3). million in the quarter (-1.0). The tax income is a result of
foreign exchange losses in the statutory NOK accounts
Profits and tax deduction on option gain payments.
EBITDA was USD 26.9 million in Q4 2020, compared to
USD 12.2 million in Q4 2019. The reported EBITDA margin Net profit was hence USD 19.3 million in Q4 2020,
increased to 21.1% from 14.7% in the same quarter last year. compared to a net profit of USD 4.4 million in Q4 2019.
Short-Range EBITDA was USD 36.2 million in Q4 2020, For the full year 2020, profit before tax was USD 42.9
and the EBITDA-margin for the short-range business million (9.7), and net profit after tax USD 38.4 million
29.0%. This compares to USD 19.8 million and 23.8% in (7.3). Tax expense for the full year was USD 4.5 million
Q4 2019. (2.4), and the tax rate 10.5% (24.5%). The company’s
statutory tax rate is 22%. The low tax rate primarily
reflects of foreign exchange losses in the statutory NOK
accounts and tax deduction on option gain payments.
12NORDIC SEMICONDUCTOR | Q4 & PRELIMINARY 2020 (UNAUDITED)
Financial Position
Amounts USD thousand 31.12.2020 31.12.2019
Capitalized development expenses 34 563 33 990
Total non-current assets 113 906 98 770
Inventory 61 955 53 067
Cash and cash equivalents 242 547 90 645
Total current assets 401 909 219 589
Total assets 515 814 318 359
Total equity 402 492 232 205
Equity percentage 78.0% 72.9%
Total liabilities 113 323 86 155
Total equity and liability 515 814 318 359
Total shareholders’ equity amounted to USD 402.5 Inventory increased to USD 62.0 million at the end of
million at the end of 2020, up from USD 232.2 million a 2020 from USD 53.1 million a year ago. Inventories are
year ago. The Group equity ratio was 78.0% of a total low relative to the activity level. Inventory declined
asset base of USD 515.8 million, compared to 72.9% of a from 18% to 15% of last 12 months revenue. Accounts
total asset base of USD 318.4 million at the end of 2019. receivable increased to USD 88.0 million from USD 64.5
million at the end of 2019. Total current assets amounted
The significantly strengthened equity position during to USD 401.9 million (219.6).
2020 primarily reflects earnings in 2020 and a private
placement where the company in September issued 13 Non-current assets increased to USD 113.9 million at the
million new shares at a subscription price of NOK 88 end of 2020 (98.8), mainly reflecting intangible Wi-Fi
per share. The transaction generated gross proceeds assets acquired from Imagination Technologies Group
of approximately USD 125 million. Following the in Q4 2020.
transaction, Nordic has 192,781,600 shares outstanding.
Non-current liabilities were relatively flat at USD 21.7
The equity issue supported an increase in cash and cash million (20.2), whereas current liabilities increased to
equivalents to USD 242.5 million at the end of 2020, up USD 91.7 million from USD 66.0 million at the end of
from USD 90.6 million at the end of 2019. 2019. The increase in current liabilities comes as an effect
of higher activity, including higher accounts payable,
Net working capital increased slightly to USD 78.5 payable taxes, public duties, and current lease liabilities.
million at the end of 2020, up from USD 70.2 million at
the end of 2019. This represents a decline of USD 25.1
million from the end of Q3 2020, reflecting mainly high
customer payments. Measured as a percentage of last
12 months revenue, net working capital declined to 19.4%
from 24.3% at the end of 2019.
13NORDIC SEMICONDUCTOR | Q4 & PRELIMINARY 2020 (UNAUDITED)
Cash Flow
Full year Full year
Amounts in USD thousand Q4 2020 Q4 2019 2020 2019
Cash flows from operations 51 046 10 361 65 292 19 678
Cash flows from investing activities -20 203 -8 434 -38 035 -31 454
Cash flows from financing activities -4 281 1 583 123 622 -1 494
Change in cash and cash equivalents 27 722 3 920 151 902 -13 232
Cash and cash equivalents at end of the period 242 547 90 645 242 547 90 645
Cash flow from operating activities was USD 51.0 million Cash flow from operating activities amounted to USD
in Q4 2020 (10.4). The strong operating cash flow was 65.3 million for the full year 2020, up from USD 19.7
a result of a combination of improved earnings and low million in 2019. Cash outflow from investing activities
working capital leading to improved cash conversion. increased to USD 38.0 million from USD 31.5 million,
mainly explained by the business combination. Cash
Cash flow from investing activities was an outflow of flow from financing activities increased to USD 123.6
USD 20.2 million in Q4 2020, compared to an outflow million from an outflow of USD 1.5 million in 2019, mainly
of USD 8.4 million in Q4 2019. This included USD 13.2 reflecting the share issue in September 2020.
million related to the acquisition of Wi-Fi technology
and IP-assets from Imagination Technologies Group. Funding
The Group’s cash position was USD 242.5 million at the
Capital expenditures amounted to USD 5.4 million (5.3), end of 2020, up from USD 90.6 million at the end of
and capitalized development expenses of USD 1.7 million 2019. The cash is mainly kept in the Group’s functional
(3.1). As described in the interim report for the third currency USD, in order to minimize the impact of
quarter, a delivery of manufacturing test equipment was currency fluctuations.
moved from the third to the fourth quarter.
Available cash including credit and overdraft facilities
Cash flow from financing activities was an outflow amounted to USD 319.5 million, including Nordic’s right
of USD 4.3 million, compared to an inflow of USD 1.6 to borrow USD 65 million at any time under a Revolving
million in Q4 2019. This mainly reflected cash settlement Credit Facility (RCF), and EUR 10 million overdraft facility
of employee options in the quarter. with the company’s main bank.
14NORDIC SEMICONDUCTOR | Q4 & PRELIMINARY 2020 (UNAUDITED)
Risk and uncertainity semiconductor companies who have placed forward
The supply of and demand for semiconductors and orders with the wafer suppliers, and the amount of
electronic products is sensitive to global economic potential additional capacity that the wafer suppliers
conditions and international trade flows. While the can put onstream in the short-term.
underlying long-term market trends point towards
increasing demand for Nordic’s products, the operations The wafer shortage did not affect production volumes
are exposed to a variety of factors with real or perceived in Q4 2020 and will not impact deliveries in Q1 2021.
impact on the economy. The largest impact is expected in Q2 2021, with higher
volumes expected in the second half of the year.
Supply chain risks
The focus in the first half of 2020 was on the direct and Product and organizational risks
indirect effects of Covid-19, which created uncertainties Nordic's products are complex and any undetected
with regards to both end-user product demand and vulnerabilities during product development and
the efficiency of the supply, production and distribution manufacturing may entail risks for both Nordic and its
chain. As it turned out, end-product demand was customers. Although customer contracts regulate and
stronger than expected, and Nordic’s asset light and limit Nordic's responsibilities, there is a risk that legal
flexible organization and world-class subcontractors actions could affect the company’s financial results.
and distribution partners have overall handled the Nordic continuously invests in strengthening and
Covid-19 logistic challenges very well. improving the product portfolio.
Moving into the latter part of the year, the focus has shifted With regards to its own organization, Nordic has
to the effects of supply risk due to increasing demand maintained full operations in both its R&D and sales
forecasts. As described under Risk and Uncertainty in organizations during Covid-19 and has continued to hire
the interim report for the third quarter 2020, the high new talent and build its workforce capabilities to meet
activity level has put strain on the organization and the current demand and customer expectations.
supply and distribution chain. The company also noted
that other players in the semiconductor industry were Financial risks
experiencing higher demand than expected, and that Nordic maintains a sharp focus on cost and cash flows
bottlenecks in the supply chain temporarily could limit and navigates from a strong position. Nordic’s strategy
the output capacity. and growth ambitions require an adequate cash
position to fund the R&D activities needed to drive the
The imbalance in the demand/supply situation technology and product roadmaps forward. Nordic in
developed further during the fourth quarter and into Q3 2020 raised approximately USD 125 million in new
2021. Several of the company’s semiconductor peers equity through a private placement to strengthen the
have issued price increases based on higher prices cash position further. Including credit facilities and
and scarcer availability for raw materials, wafers, and borrowing arrangements, total available cash was close
assembly and testing services. to USD 320 million at the end of 2020, which the Board
of Directors considers sufficient to fund the company’s
Nordic has built inventory buffers for certain critical current expansion plans.
components and significantly increased its capacity in
crucial areas such as in-house testing capabilities, and Amidst turbulence in financial and raw materials
the company does not see imminent capacity constraints markets, the value of the Norwegian Krone (NOK) has
in its own backend production. varied considerably against the company’s reporting
currency USD during 2020. Nordic’s sales revenue and
The availability of wafers and other third-party deliveries direct production costs are almost entirely nominated
nevertheless pose a temporary challenge. Based on in USD whereas operating expenses primarily are in
demand forecasts, Nordic placed early orders for wafer NOK and EUR. The company does not use any financial
volumes that would allow for a significant production instruments to hedge the currency risk and is hence
increase in 2021. exposed to the fluctuations in currency exchange rates.
In the Annual Report for 2019 it was estimated that a 1%
However, the company has been informed by its change in USD/NOK – all other things equal – would
main wafer supplier in Taiwan of limitations in wafer translate into a USD 0.6 million change in profit before tax.
allocation for 2021, and current forecasts for wafer
deliveries indicate that Nordic will have room to increase The company has seen no changes in financial risks
production by a minimum of 25% from 2020 to 2021. related to interest rate risk or credit risk that would have
significant impact on the company’s financial position
The company will do its utmost to seek additional wafer during the year.
volumes to meet the high demand. The success of these
efforts will depend both on actual purchases from other
15NORDIC SEMICONDUCTOR | Q4 & PRELIMINARY 2020 (UNAUDITED)
OUTLOOK
Nordic reported 41% revenue growth in 2020, with 43% This has created imbalances in demand/supply that
revenue growth in the Bluetooth technology segment. temporarily limit the availability of sufficient wafers
Growth accelerated through the year, with 53% overall volumes to take full advantage of the current strong
revenue growth in Q4 2020. demand. Current forecasts for wafer deliveries indicate
that Nordic will have room to increase its production by
The high and accelerating demand growth was further a minimum of 25% in 2021.
emphasized by a shift in the order backlog from USD
107 million at the end of 2019 to USD 492 million at the The wafer shortage is expected to have the largest
end of 2020. impact in Q2 2021, with higher volumes expected in the
second half of the year.
This demand shift reflects both accelerated technology
adoption across the company’s end-user markets, a Nordic’s wafer supplier in Taiwan has announced a
widespread technology migration from Bluetooth classic significant increase in capital expenditure in 2021 to
to Bluetooth Low Energy, and a significant growth in increase capacity going forward.
applications that require multiprotocol solutions. Nordic
has also seen a change in its customer mix, with several Nordic’s gross margin improved to 52.8% in 2020
global platform companies and other tier-1 customers from 50.9% in 2019, with the company reporting a
now placing more orders for high-volume products with gross margin of 52.7% for Q4 2020. The high margin
longer product lifecycles. level reflects both a product mix with high volumes of
advanced high-margin products, and continuous cost
The accelerating demand growth is an indicator of improvements on newly launched products.
Nordic’s solid market position, and the company believes
its long-term growth prospects are stronger than ever. For Q1 2021 the company forecasts a gross margin level
of 50%-51%, and reiterates its expectation that a higher
Nordic has placed early orders for wafer volumes that share of sales to tier-1 customers will move gross margins
would allow for a significant increase in production also for the short-range business into the 48%-50% range in
in 2021, and the current backlog and wafer allocation the medium term.
enables Nordic to guide for a revenue level of USD 130-
140 million for Q1 2021. In 2019, Nordic presented a bold aspiration to build a
USD 1 billion company within five years, and the positive
The high demand in the semiconductor market has demand trends and continued strengthening of the
however put further strain on the global supply chain. customer base increase the confidence in this aspiration.
16NORDIC SEMICONDUCTOR | Q4 & PRELIMINARY 2020 (UNAUDITED)
Oslo, February 3, 2021
Jan Frykhammar Birger Steen Anita Huun
Board member Chair Board member
Inger Berg Ørstavik Svenn-Tore Larsen Endre Holen
Board member Chief Executive Officer Board member
Øyvind Birkenes Jon Helge Nistad Annastiina Hintsa
Board member Board member, employee Board member
Joel Stapelton Susheel Raj Nuguru Morten Dammen
Board member, employee Board member, employee Board member, employee
17NORDIC SEMICONDUCTOR | Q4 & PRELIMINARY 2020 (UNAUDITED)
CONDENSED FINANCIAL
INFORMATION
Income statement
Full year Full year
Amount in USD thousand Note Q4 2020 Q4 2019 2020 2019
Total Revenue 127 127 83 133 405 217 288 395
Cost of materials -60 078 -40 232 -190 690 -141 290
Direct project costs -16 - -584 -351
Gross profit 67 033 42 901 213 943 146 753
Payroll expenses -29 649 -21 378 -101 211 -80 281
Other operating expenses -10 519 -9 326 -35 954 -33 665
EBITDA 26 865 12 198 76 778 32 807
Depreciation and amortization 6 -8 240 -6 846 -31 063 -23 535
Operating profit 18 625 5 352 45 714 9 272
Net interest income 246 941 -774 809
Net foreign exchange gains (losses) -2 165 -958 -2 016 -375
Profit before tax 16 706 5 335 42 925 9 706
Income tax expense 2 617 -952 -4 534 -2 379
Net profit after tax 19 323 4 383 38 391 7 327
Earnings per share
Ordinary earnings per share (USD) 0.101 0.025 0.212 0.042
Fully diluted earnings per share (USD) 0.099 0.025 0.197 0.042
Weighted average number of shares
Basic 190 905 175 533 181 021 175 313
Fully Diluted 194 809 177 533 194 704 176 394
Net profit after tax 19 323 4 383 38 391 7 327
Other comprehensive income not to be reclassified to
profit or loss in subsequent periods:
Actuarial gains (losses) on defined benefit plans (befo-
-54 -83 -84 -83
re tax)
Income tax effect 19 18 19 18
Other comprehensive income that may be
reclassified to profit or loss in subsequent periods:
Currency translation differences 1 119 314 688 -117
Total Comprehensive Income 20 407 4 632 39 014 7 145
18NORDIC SEMICONDUCTOR | Q4 & PRELIMINARY 2020 (UNAUDITED)
Consolidated statement of financial position
Amount in USD thousand Note 31.12.20 31.12.19
ASSETS
Non-current assets
Goodwill 11 2 393 -
Capitalized development expenses 5/6 34 563 33 990
Software and other intangible assets 5/6/11 19 905 11 408
Deferred tax assets 3 668 2 813
Fixed assets 6 28 284 26 625
Right-of-use assets 6 25 092 23 394
Total non-current assets 113 906 98 770
Current assets
Inventory 61 955 53 067
Accounts receivable 88 034 64 519
Other current receivables 9 372 11 359
Cash and cash equivalents 242 547 90 645
Total current assets 401 909 219 589
TOTAL ASSETS 515 814 318 359
EQUITY
Share capital 317 303
Treasury shares -2 -5
Share Premium 235 448 113 355
Other equity 166 727 118 552
TOTAL EQUITY 402 492 232 205
LIABILITIES
Non-current liabilities
Pension liability 665 310
Non-current lease liabilities 21 004 19 886
Total non-current liabilities 21 669 20 196
Current liabilities
Accounts payable 22 812 19 738
Income taxes payable 4 976 3 136
Public duties 8 789 3 761
Current lease liabilities 5 520 4 044
Current loan facility 7 - -
Current financial liabilities 302 -
Other current liabilities 49 255 35 279
Total current liabilities 91 654 65 958
Total liabilities 113 323 86 155
TOTAL EQUITY AND LIABILITY 515 814 318 359
19NORDIC SEMICONDUCTOR | Q4 & PRELIMINARY 2020 (UNAUDITED)
Consolidated statement of changes in equity
Other Currency
Share Treasury Share paid translation Retained Total
Amount in USD thousand capital shares premium in capital reserve earnings equity
Equity as of 01.01.20 303 -5 113 355 6 819 -309 112 042 232 205
Net profit 2020 - - - - - 38 391 38 391
Other comprehensive income - - - - 688 -65 623
Share based compensation - - - 3 265 - - 3 265
Sale of treasury shares
- 2 - 5 897 - - 5 899
(option exercise)
Capital increase* 14 - 122 093 - - - 122 108
Equity as of 31.12.20 318 -3 235 448 15 980 379 150 368 402 492
Equity as of 01.01.19 303 -5 113 355 3 307 -190 104 780 221 549
Net profit 2019 - - - - - 7 327 7 327
Other comprehensive income - - - - -119 -65 -184
Share based compensation - - - 1 407 - - 1 407
Sale of treasury shares
0 - 2 105 - - 2 106
(option exercise)
Equity as of 31.12.19 303 -5 113 355 6 819 -309 112 042 232 205
* During Q3 2020 the group increased the share capital with NOK 1 144 million, approximately USD 125 million.
The amount net of transaction cost was USD 123.2 after tax.
20NORDIC SEMICONDUCTOR | Q4 & PRELIMINARY 2020 (UNAUDITED)
Statement of cash flows
Full year Full year
Amount in USD thousand Note Q4 2020 Q4 2019 2020 2019
Cash flows from operating activities
Profit before tax 16 706 5 335 42 925 9 706
Taxes paid for the period 241 -2 101 -2 955 -4 846
Depreciation and amortization 8 240 6 846 31 063 23 535
Change in inventories, trade receivables
13 586 -3 965 -29 561 -13 798
and payables
Share-based compensation 1 043 -36 3 151 1 100
Movement in pensions 109 91 138 31
Other operations related adjustments 11 120 4 192 20 530 3 950
Net cash flows from operating activities 51 046 10 361 65 168 19 678
Cash flows used in investing activities
Capital expenditures (including software) 6 -5 363 -5 338 -16 480 -20 182
Capitalized development expenses 6 -1 682 -3 097 -8 398 -11 271
Business Combination, net of cash acquired 11 -13 158 - -13 158 -
Net cash flows used in investing activities -20 203 -8 434 -38 035 -31 454
Cash flows from financing activities
Changes in treasury shares 877 2 412 10 455 2 412
Cash settlement of options contract -4 557 - -4 557 -
Capital increase - - 121 277 -
Repayment of lease liabilities -601 -829 -3 552 -3 906
Net cash flows from financing activities -4 281 1 583 123 622 -1 494
Effects of exchange rate changes
1 159 410 1 024 37
on cash and cash equivalents
Net change in cash and cash equivalents 27 722 3 920 151 902 -13 232
Cash and cash equivalents
214 826 86 725 90 645 103 876
beginning of period
Cash and cash equivalents at end of period 242 547 90 645 242 547 90 645
21NORDIC SEMICONDUCTOR | Q4 & PRELIMINARY 2020 (UNAUDITED)
NOTES
Note 1: General Note 3: Significant accounting principles
The Board of Directors approved the condensed fourth Significant accounting principles are described in the
quarter interim financial statements for the three Group Financial Statement for 2019. The group accounts
months ended 31 December 2020 for publication on for 2019 were prepared in accordance with International
February 3, 2021. Financial Reporting Standards (IFRS), relevant
interpretations of this, as well as additional Norwegian
Nordic develops and sells integrated circuits and related disclosure requirements described in the Norwegian
solutions for short-range wireless communication. The GAAP and the Norwegian Securities Trading Act.
Group specializes in ultra-low power (ULP) components,
based on its proprietary 2.4GHz RF and Bluetooth New standards, amendments to standards, and
technology. Nordic is also developing its long-range interpretations have been published, but are not effective
low-power cellular chip-set, providing customers with at December 31, 2020 and have not been applied in
a broad portfolio of low-power connectivity solutions preparing these condensed financial statements. The
across the spectrum of distances from near-field to Group intends to adopt these standards, if applicable,
long-range. when they become effective.
Nordic Semiconductor ASA is listed on the Oslo Stock
Exchange under the ticker NOD, and is a public limited Note 4: Segment information
liability company registered in Norway. The parent In accordance with IFRS 8, the Group has only one
company’s head office is located at Otto Nielsens vei 12, business segment, which is the design and sale of
7052 Trondheim. integrated circuits and related solutions.
The Group classifies its revenues into the following
Note 2: Confirmation of the financial framework technologies: Short range wireless components, long
The Group financial statements for Nordic range (cellular IoT), ASIC components and consulting
Semiconductor ASA and its wholly owned subsidiaries, services. Within Wireless components, the Group
together called “The Group” have been prepared in reports its revenues based on the markets to which its
accordance with IAS 34 Interim Financial Statements. components communicate. These include: Consumer
The interim financial statements for Q4 2020 do not Electronics, Wearables, Healthcare, Building and Retail,
include all the information required for the full year and Others.
financial statements and shall be read in conjunction
with the Group Annual Accounts for 2019. The Group also reports its short range Wireless
component revenue by proprietary wireless and
The financial statements are presented in thousand Bluetooth protocols.
USD, unless otherwise stated. As a result of rounding
adjustments, the figures in one or more rows or columns
included in the financial statements may not add up to
the total of that row or column.
In the interim financial statements for 2020, judgments,
estimates and assumptions have been applied that may
affect the use of accounting principles, book values of
assets and liabilities, revenues and expenses. Actual
values may differ from these estimates. The major
assumptions applied in the interim financial statements
for 2020 and the major sources of uncertainty in the
statements are similar to those found in the Financial
Statements for 2019.
22NORDIC SEMICONDUCTOR | Q4 & PRELIMINARY 2020 (UNAUDITED)
Note 5: Intangible assets
The Group recognizes intangible assets in the balance The asset will generate future financial benefits.
sheet if it is likely that the expected future economic
benefits attributable to the asset will accrue to the Group
Sufficient technical, financial and other resources
for project completion are in place.
and the assets acquisition cost can be measured reliably.
Intangible assets with finite lives are amortized over
Costs associated with development are capital- the useful economic life and assessed for impairment
ized if the following criteria are met in full: whenever there is an indication that the intangible
asset may be impaired. The amortization period and
The product or the process is clearly defined
and the cost elements can be identified and
the amortization method for an intangible asset with a
finite useful life are reviewed at least at the end of each
measured reliably; reporting period. Changes in the expected useful life or
The technical feasibility is demonstrated; the expected pattern of consumption of future economic
benefits embodied in the asset are considered to modify
The product or the process will be sold or used in
the business;
the amortization period or method, as appropriate, and
are treated as changes in accounting estimates.
Note 6: Capitalization, depreciation and amortization
Specification of capital expenditures, Full year Full year
balance sheet Q4 2020 Q4 2019 2020 2019
Capitalized development expenses (payroll expenses) 1 273 2 472 5 747 7 776
Capitalized acquired development expenses 409 625 2 651 3 495
Capital expenditures (including software) 5 363 5 338 16 480 20 182
Right-of-use assets (non-cash) 2 293 1 279 6 068 4 200
Acquisition (net) 13 966 - 13 966 -
Currency adjustments 226 124 362 -76
Total 23 530 9 838 45 273 38 200
Depreciation and amortization
Capitalized development expenses 2 105 1 826 7 825 4 967
Software and other intangible assets 1 488 1 446 6 070 5 519
Fixed assets 3 205 2 683 12 188 9 196
Right-of-use assets 1 442 891 4 980 3 853
Total 8 240 6 846 31 063 23 535
23NORDIC SEMICONDUCTOR | Q4 & PRELIMINARY 2020 (UNAUDITED)
Note 7: Net interest-bearing debt Note 9: RSU and performance shares
The Group has long-term revolving credit facilities, With reference to the Annual general meeting held
which enables it to borrow up to USD 40 million and on April 22, 2020, Nordic Semiconductor, on April 29,
USD 25 million at any time with an interest rate equal 2020, granted 754 224 RSUs and performance shares
to LIBOR + margin. Both lines of credit expire end of to employees, including management. The shares vest
November 2022. As of December 31, 2020, the Group over two and three years. The Annual General Meeting
had not drawn on any credit facilities. The security of Nordic Semiconductor ASA approved the issue
for the credit lines are provided by inventory, receivables of up to 1 074 000 Restricted Stock Units (RSUs) and
and operating equipment. Performance Shares, equivalent to approximately 0.6%
of the company’s outstanding share capital.
The following financial covenants are included:
Equity ratio shall not be lower than 40 %. Full year Full year
2020 2019
In addition to the two RCFs, the Group has a MEUR 10
Outstanding RSUs
bank overdraft facility with its main bank. This overdraft 0 0
beginning of period
was not utilized at the end of December 2020. The
overdraft facility expires end of November 2021. Granted 696 017 0
Forfeited 5 400 0
Note 8: Stock options
Exercised - 0
Nordic has a stock option program for employees and
management. Please see the annual report for 2019 for Outstanding end of period 690 617 0
information about the program.
Full year Full year
Full year Full year 2020 2019
2020 2019
Outstanding performance
55 813 0
Outstanding options shares beginning of period
5 470 374 4 194 293
beginning of period Granted 58 207 55 813
Granted - 1 947 010 Forfeited - -
Forfeited 64 144 222 384 Exercised - -
Exercised 2 850 587 448 545 Outstanding end of period 114 020 55 813
Expired - -
Note 10: Financial risk
Outstanding end
2 555 643 5 470 374 Nordic is exposed to several risks, including currency risk,
of period
interest rate risk, liquidity risk and credit risk. For a detailed
Of which exercisable 954 923 2 283 646 description of these risks and how the Group manages
these risks, please see the annual report for 2019.
The exercisable options include options from five
grants. If cap is reached, all exercisable options will be
exercised. See overview below.
31.12.2020 Cap in NOK
2016 grant 264 313 143.2
2018 grant 449 937 141.8
2019 grant 169 126 118.3
2019 management
71 547 135.3
grant
Exercisable options 954 923
24NORDIC SEMICONDUCTOR | Q4 & PRELIMINARY 2020 (UNAUDITED)
Note 11: Business combination Expected economic lifetime of identifiable intangible
On 31 December 2020, the Group completed the asset is 5 years for accounting and tax purposes.
acquisition of Imagination Technologies’ Wi-Fi business Goodwill is deductive for tax purposes, with 20 %
in UK, Taiwan, India and Sweden. The acquisition annual rate.
included the development team, 81 employees,
associated Wi-Fi IP tech assets and 100 % of the shares Cash flows in relation to business combination
in Imagination Technologies AB and Imagination The net cash outflow on the purchase of businesses was
Technologies Hyderabad Pvt Ltd. as follows:
Our provisional allocation of the purchase price to Cash flows from investing activities (amount in
the identifiable assets and liabilities and goodwill is USD thousand)
set out below. Cash consideration 14 245
Provisional fair value of net USD Cash and cash equivalents acquired (1 087)
assets acquired thousand
Net cash consideration within
Software and other intangible assets 11 447 13 158
investment activities
Fixed Assets 125
Other current receivables 397 Note 12: Events after the balance sheet date
Pension liability (217) No events have occurred since December 31, 2020 with
any significant effect that will impact the evaluation of
Accounts payable (87) the submitted accounts.
Income taxes payable 151
Public duties 271
Financial Calendar 2021:
Other current liabilities (1 323)
Net identifiable assets acquired 10 765 April 20, 2021 - 1st Quarter 2021
Goodwill arising on acquisition 2 393 July 13, 2021 - Half-yearly report 2021
Consideration 13 158 October 21, 2021 - 3rd Quarter 2021
February 3, 2022 - 4th Quarter 2021
Satisfied by:
Cash consideration 14 245 For further information, please contact:
Cash acquired (1 087)
Ståle Ytterdal, IR, +47 930 37 430
Total consideration 13 158
Pål Elstad, CFO, +47 991 66 293
Identifiable intangible assets being transferred to the
Group as part of the transaction comprise of Wi-Fi 6,
which is still under development, Wi-Fi 5 and Wi-Fi 4.
The goodwill arising on this business combination can
be attributed to the skills and talent of the in-place work-
force and the synergies expected to be achieved from
integrating the acquired operations into the Group’s
existing business.
The acquisition date was December 31, 2020 meaning
the business acquired did not contribute to any profit
and loss in Q4-2020. During Q4 2020, we incurred
transaction costs of USD 296 254.
25NORDIC SEMICONDUCTOR | Q4 & PRELIMINARY 2020 (UNAUDITED)
ALTERNATIVE
PERFORMANCE MEASURES
The financial information is prepared in accordance with International
Financial Reporting Standards (IFRS) as adopted by EU. Additionally, it is
management’s intent to provide alternative performance measures (APM) that
are regularly reviewed by management to enhance the understanding of the
Group’s performance.
The Group has identified the following APMs used in reporting (amount in USD million):
Gross margin. Gross profit divided by Total revenue. Gross margin is presented as it is the main financial KPI to
measure the Group’s operational performance.
Full year Full year
Q4 2020 Q4 2019 2020 2019
Gross profit 67.0 42.9 213.9 146.8
Total revenue 127.1 83.1 405.2 288.4
Gross margin 52.7% 51.6% 52.8% 50.9%
EBITDA terms are presented as they are commonly used by investors and financial analysts.
EBITDA. Earnings before interest, taxes, depreciation and amortization.
Full year Full year
Q4 2020 Q4 2019 2020 2019
Operating profit 18.6 5.4 45.7 9.3
Depreciation and amortization 8.2 6.8 31.1 23.5
EBITDA 26.9 12.2 76.8 32.8
EBITDA margin. EBITDA divided by Total Revenue.
Full year Full year
Q4 2020 Q4 2019 2020 2019
EBITDA 26.9 12.2 76.8 32.8
Total revenue 127.1 83.1 405.2 288.4
EBITDA margin 21.1% 14.7% 18.9% 11.4%
26You can also read


