SEEK Limited H1 21 Results Presentation - 6 months to 31 December 2020

Page created by Angel Rivera
 
CONTINUE READING
SEEK Limited H1 21 Results Presentation - 6 months to 31 December 2020
SEEK Limited
H1 21 Results
Presentation

6 months to 31 December 2020
SEEK Limited H1 21 Results Presentation - 6 months to 31 December 2020
Key
Announcements
SEEK Limited H1 21 Results Presentation - 6 months to 31 December 2020
Senior leadership change & more focused AP&A and Investments

     Andrew Bassat to transition to new role and be succeeded by Ian Narev
     •   Andrew Bassat will step down as MD & CEO and be succeeded by Ian Narev, effective 1 July 2021
     •   Andrew Bassat will transition to a new full-time role as Executive Chairman and CEO of SEEK Investments
         and remain a Director of SEEK

     More focused AP&A and SEEK Investments
     •   The Board believes SEEK Asia Pacific & Americas (“AP&A”) and SEEK Investments (“Investments”) can
         benefit from a greater degree of independence and focus and is in a unique position to have two
         experienced executives to lead its operating business and its investment arm

     Reviewing options and targeting the following business outcomes
     •   SEEK: To focus on the growth opportunities for the AP&A business and relevant adjacencies whilst
         retaining its economic exposure to Investments and Zhaopin
     •   Investments: To focus on being an investor and business builder that partners with emerging leaders to
         support their aspirations and deliver strong long-term returns. Key to its success will be the ability to
         operate independently and access third party capital

3                                                                                       SEEK Limited H1 21 Results Presentation
SEEK Limited H1 21 Results Presentation - 6 months to 31 December 2020
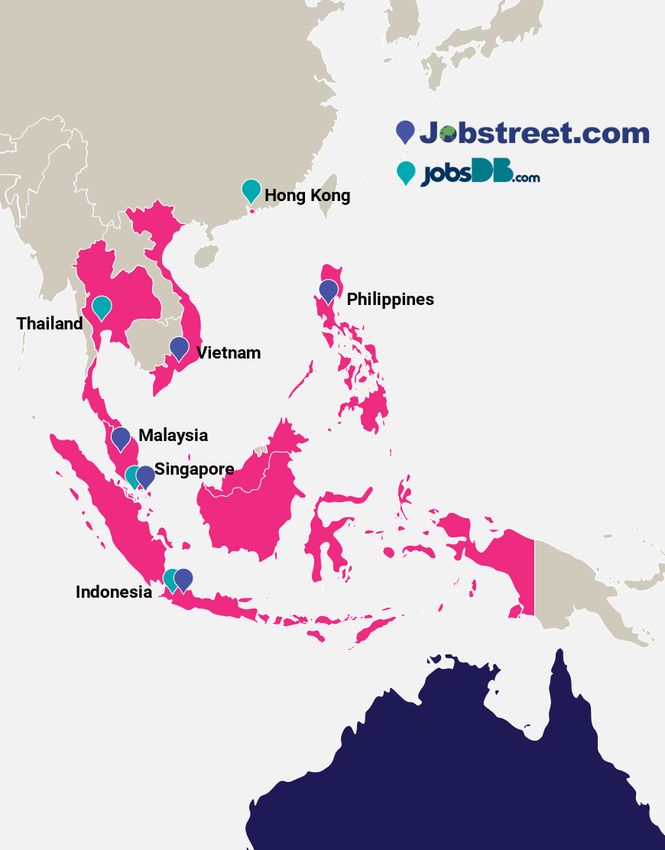
Targeting greater independence and focus for SEEK and Investments

                                                                                        SEEK                       Investments

          Composition                                    • AP&A with ownership interests in          • ESV portfolio and OES
                                                           Zhaopin and SEEK Investments

                                                         • SEEK will focus on capturing the          • Investments will focus on being a
          Strategic Focus                                  significant growth opportunities in its     long-term investor and business
                                                           core online employment businesses           builder partnering with emerging
                                                                                                       leaders

          Key benefits of                               • Greater capacity to re-invest and pay      • Better placed to make aggressive long-
          greater degree of                               dividends1                                   term investment decisions
          independence
                                                        • AP&A’s financial performance will be       • Can access external capital without
                                                          the cornerstone of SEEK’s results            compromising SEEK’s balance sheet

4   1   SEEK will have the pro-rata right but not obligation to invest in Investments                               SEEK Limited H1 21 Results Presentation
SEEK Limited H1 21 Results Presentation - 6 months to 31 December 2020
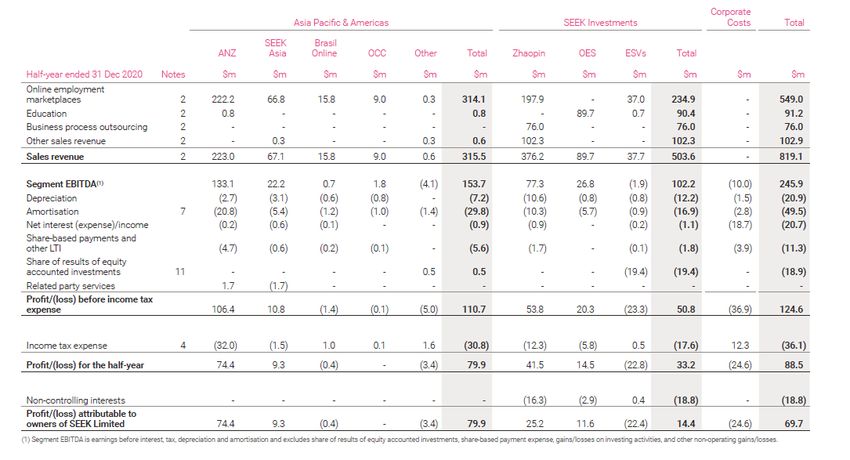
Potential sell-down of SEEK’s ownership interest in Zhaopin

    •   SEEK and other Zhaopin shareholders are in advanced discussions with a consortium looking to
        acquire an ownership interest in Zhaopin
    •   The transaction valuation will be in the order of A$2.2 billion (100% implied Equity Value)
    •   If the proposed transaction is completed, it is expected that SEEK would reduce its stake to c23.5%.
        None of the investors will hold a controlling interest
    •   Potential benefits include
        o   For Zhaopin: new ownership structure to support long-term growth strategy
        o   For SEEK: ability to realise a strong financial return, rebalance SEEK’s portfolio exposure, creates
            capital management flexibility
    •   There is no certainty that these advanced discussions will result in a transaction. SEEK will update
        the market as is appropriate

5                                                                                      SEEK Limited H1 21 Results Presentation
Executive
Summary
SEEK is fulfilling its purpose on a large scale

                                                                                                                                                 Entrepreneurial mindset with a track
        Large addressable markets                                                              Leading market positions
                                                                                                                                                  record of long-term value creation

                                                                                                                                                                         TSR3 of
                     c2.9B                                                           Asia Pacific &
                                                                                    Americas (AP&A)
                                                                                                                                SEEK
                                                                                                                             Investments
                                                                                                                                                              1,741%
                    Population exposure

                                                                                      45M+                                 220M+
                                                                                                                                                                    vs ASX of 237%

                                                                                           Candidates                          Candidates

                                                                                                                                                                SEEK Investments4
                        GDP exposure
                                                                                     230k+                                 c820k                                       IRR

                      c27%                                                                     Hirers                            Hirers2                          c25%
                          of Global GDP

                                                                                      1.3B+                                80M+
                                                                                      Visits per     annum1                Students / Learners

    SEEK’S PURPOSE:
    We help people live more fulfilling and productive working lives and help organisations succeed

      1 AP&A  visits include Jora
      2 Relates to the 12 months ended 30 Jun 2020
7     3 Total shareholder returns includes dividends and share price appreciation from 19 April 2005 to 18 February 2021                            SEEK Limited H1 21 Results Presentation
      4 Based on SEEK Investments Portfolio. Includes capital deployed into ESVs in H1 21
SEEK is recovering well and executing on its key priorities

          H1 21 result broadly in line with pcp despite COVID-19 impact
            • Revenue cA$819m, EBITDA cA$246m, NPAT cA$70m
            • H1 21 results broadly in line with pcp despite no COVID impact in H1 20

          YTD results and improved momentum leading to upgraded FY21 guidance 1
            • As a result, SEEK intends to repay A$9.8m of COVID-19 subsidies (incl. JobKeeper)2

          Key employment businesses have performed better than expected
            • SEEK ANZ: Results were broadly in line with pcp
            • Zhaopin: Revenue -8% and EBITDA +13% vs pcp (local currency)

          OES and ESVs capitalising on growth opportunities
            • OES: COVID-19 beneficiary with revenue growth of +38% vs pcp
            • ESVs: ‘Look-through’ revenue of A$50m, growth of +38% vs pcp3 on strong unit economics

          Strategic and operational priorities continue to progress well
            • Decision to prioritise our people has protected our culture and maintained high productivity
            • All key milestones met, and higher confidence to accelerate some strategic priorities

          Long-term value creation requires ongoing investment
            • AP&A has exceptional growth opportunities, but also intense competition
            • Investment in ESVs will remain high but will create long-term value
     1 Expectations   at the time of setting the AGM Guidance (Nov-20)
     2  Voluntarily repayment of COVID-19 subsidies from the Australian and New Zealand Governments will be made net of tax                                            SEEK Limited H1 21 Results Presentation
8    3 ‘Look-through’ share represents revenue of investments multiplied by SEEK’s ownership interest (based on comparable ownership interest across H1 20 & H1 21).

     In H1 21 look-through revenue was cA$50m on a net revenue basis and cA$125m on a gross revenue basis. Excludes Coursera
Potential changes will impact our A$5bn revenue aspiration but long-
    term growth drivers remain unchanged…

• Intended changes to SEEK Investments & potential reduction in Zhaopin ownership will impact SEEK’s A$5b aspirational revenue opportunity
• Long-term strategic growth drivers and substantial revenue opportunity remains intact
• If executed well, SEEK’s growth drivers and the future changes to SEEK Investments are expected to generate long-term shareholder value

                              Asia Pacific & Americas (AP&A)                                        SEEK Investments

                                                                                                                                           Early Stage
                                                                                                                                            Ventures
                                      ANZ

                                                                                                      Scaling up existing               Online Education
       Key Growth Drivers

                                                                                Online Employment     partners & signing
                            Unify APAC platforms for faster, scalable product
                                                                                                        new partners
                                               roll-out

                                            Align price to value
                                                                                                                                             HR SaaS
                             Deepen engagement through data, analytics &
                                                                                                       Adjacent market
                                         product innovation
                                                                                                          expansion
                                                                                 Adjacent Market
                                                                                                        (short & micro-
                                                                                    Expansion
                                                                                                      courses, unbundled               Contingent Labour
                                                                                                           services)

9                                                                                                                           SEEK Limited H1 21 Results Presentation
…and we made tangible progress against them in H1 21.

                    Asia Pacific & Americas (AP&A)                                                                                                     SEEK Investments

                                                                                                                                                                                                     Early Stage
                                                                                                                                                                                                      Ventures
                        ANZ

     Unify APAC platforms                                                                           Online Employment                             Scaling up existing partners            Investing and building
     • Common discovery experience rolled out across Asia                                           • Migration to online                         • Scaling partnerships (e.g.            emerging leaders
     • Smarter Search now in the majority of Asian markets                                            services                                      QUT, Monash)                          • Deployed A$99m of capital
                                                                                                    • Realising efficiencies                                                                into new and existing
     Align price to value                                                                                                                         Signing new partners                      investments
                                                                                                      alongside investment in
     • New pricing model & contract structure rolled out to                                           mobile, data & AI                           • Construct Education                   • Strong growth in operational
       majority of AU customers1                                                                                                                    acquisition2 extends global             metrics
     • Commenced pricing trials in Asia                                                             Adjacent Mkt Expansion                          footprint
                                                                                                                                                                                          • ‘Look-through’ revenue3
     Deepen engagement                                                                              • Solid growth in Campus                      Adjacent Mkt Expansion                    growth has accelerated
     • Profile Apply released to all devices; Certsy assessment                                       revenue                                     • Delivering learning design              H1 21: 38% v FY20: 35%
       launched (ANZ); optimising the hirer experience in Asia                                                                                      solutions and managed
                                                                                                                                                    services to partners in AU, US,
                                                                                                                                                    NZ, UK and mainland Europe

      1   c90% conversion of AU subscription contracts which have come up for renewal & c85% of total AU ads are now variably priced
      2 OES acquired a controlling interest in Construct Education (Nov-20), a designer and developer of online education with a presence in the US, UK and South Africa
10                                                                                                                                                                         SEEK Limited H1 21 Results Presentation
       Look-through’ share represents revenue of investments multiplied by SEEK’s ownership interest (based on comparable ownership interest across H1 20 & H1 21).
      3‘

      Excludes Coursera
SEEK’s long term approach has created significant shareholder value
                                c7x1 TSR vs ASX 200 since IPO despite the economic cycle and aggressive competition

                                                                                                                                        3
                                                                                                                                                                    1,741.1%
                                                                                                                                  Product & Tech
                                                                                                                                     evolution

                                                                                                         2
                                                                                             M&A led growth
                                                                                            (Int’l & Education)

                                                            1
                                                       ANZ led
                                                       growth

                                                                                                                                                                    236.5%

                                   Apr-2005             Jul-2007             Oct-2009             Jan-2012             May-2014   Aug-2016     Nov-2018     Feb-2021

                                                                                                      SEEK           ASX 200

 • SEEK has continually invested for the long-term and evolved its business (phases 1 to 3 above)
 • Track record of strong returns where SEEK’s TSR is c7x1 vs ASX 200
 • Today’s announcements to support SEEK next leg of long-term growth

     1 Total   shareholder returns includes dividends and share price appreciation from 19 April 2005 to 18 February 2021                                 SEEK Limited H1 21 Results Presentation
11
Group Financial
Performance
SEEK’s H1 21 results are broadly in line with pcp despite COVID-19
     challenges

                                 Group                                                                  Group                                                              Reported
                                Revenue                                                                EBITDA                                                               NPAT

                        A$819.1m                                                             A$245.9m2                                                                    A$69.7m
                                -6% vs pcp                                                            -1% vs pcp                                                           -8% vs pcp

                  Key employment businesses                                        EBITDA benefiting from                                                 Higher D&A, +8% due to product
                  recovering well vs pcp                                           improving revenue                                                      & tech investment
                  • SEEK ANZ -1%; Zhaopin -8%1
                  • SEEK Asia recovering but at a                                  Continuing to make operational                                         Increased NCI, +42% driven by
                    slower rate -23%1                                              improvements while investing                                           higher Zhaopin & OES profits
                                                                                   strategically for long-term growth
                  OES performing well +38% vs                                                                                                             Offset partly by lower net
                  pcp and benefiting from offline                                  EBITDA Margin 30% (H1 20: 28%)                                         interest
                  to online migration

     1 Constant   currency
13   2 In H1 21, SEEK received A$9.8m in COVID-19 subsidies from the Australian and New Zealand Governments. SEEK intends to voluntarily repay these amounts, therefore    SEEK Limited H1 21 Results Presentation
     there is nil benefit to EBITDA in H1 21. Repayments will be made net of tax.
Group Financial Result: Detailed comparison H1 21 vs H1 20
                          H1 21 Financials (A$m)                                       Key Insights: Below the line items
                                                                  Constant
                                                         Growth   Currency
 Revenue                             H1 21     H1 20       %         %
                                                                             Reported NPAT down 8%
      SEEK ANZ                       223.0     224.4      (1%)      (1%)     • Higher D&A: increased product & tech investment
      SEEK Asia                       67.1      91.3     (27%)     (23%)     • Lower net interest: reflecting lower funding rates
      LatAm                           24.8      43.0     (42%)     (24%)
      AP&A Other                      0.6       1.1      (45%)     (45%)     • Higher NCI: reflecting higher Zhaopin and OES profits
   AP&A                              315.5     359.8     (12%)      (9%)
                                                                             • Reported NPAT includes losses in SEEK Investments
      Zhaopin                        376.2     418.4     (10%)      (8%)
      OES                             89.7      65.1      38%       38%        ESVs: A$22.4m (H1 20: A$25.3m)
      ESVs                            37.7      32.2      17%       18%
   SEEK Investments                  503.6     515.7      (2%)      (1%)
 Total Revenue                       819.1     875.5      (6%)      (4%)
                                                                             FX impact
                                                                             • Reported A$ results negatively impacted by A$
 EBITDA
      SEEK ANZ                       133.1     134.2      (1%)      (1%)
                                                                               appreciation against major currencies (mainly Chinese
      SEEK Asia                        22.2      45.6    (51%)     (49%)       Renminbi)
      LatAm                             2.5       7.4    (66%)     (59%)
      AP&A Other                       (4.1)     (9.2)    55%       55%      Reported EPS of 19.7 cents
   AP&A                              153.7     178.0     (14%)     (13%)
      Zhaopin                          77.3      69.9     11%       13%
      OES                              26.8      18.6     44%       44%
      ESVs                             (1.9)     (5.2)    63%       58%
   SEEK Investments                  102.2      83.3      23%       24%
   Corporate Costs                    (10.0)    (13.9)    28%       28%
 Total EBITDA                        245.9     247.4      (1%)       1%
 Depreciation & Amortisation         (70.4)    (65.0)     (8%)
 Net interest                        (20.7)    (28.0)     26%
 Share-based payments                (11.3)    (11.8)      4%
 Share of equity accounted results   (18.9)    (18.2)     (4%)
 Other items                          0.0       (0.5)     n/m
 Tax                                 (36.1)    (35.1)     (3%)
 Non-controlling interests           (18.8)    (13.2)    (42%)
 Reported NPAT                       69.7      75.6       (8%)

14                                                                                                    SEEK Limited H1 21 Results Presentation
SEEK has a track record of generating strong cash flows and deploying
     capital into high growth opportunities
                   Strong cash flows…                                                    ...have been deployed into high                                          ...and high growth M&A.
                                                                                                returning capex…
                                                                                                                                                                Capital deployed into current Online Education,
                      Operating cash flows1 A$m                                                       Product & Tech capex A$m                                   HR SaaS & Contingent Labour portfolio A$m
                                                                     $258m
                                                             $250m                                                                           $56.7m $55.4m
                                                     $242m
                                             $232m                                                                                  $51.4m

                              $203m $198m                                                                                                                                   $334m
                                                                                                                               $42.6m
                      $174m

                                                                                                                                                                ESVs -
            $137m                                                                                                                                                           $210m
                                                                                                                      $27.7m                                    Online
                                                                                                                                                             Education
     $95m                                                                                                    $21.6m                                                                        $148m
                                                                                                    $19.2m                                                                                                $147m
                                                                                              $15.9m

                                                                                      $5.0m                                                                      OES        $124m

     H1 13 H1 14 H1 15 H1 16 H1 17 H1 18 H1 19 H1 20 H1 21                            H1 13 H1 14 H1 15 H1 16 H1 17 H1 18 H1 19 H1 20 H1 21                                 Online         ESVs -         ESVs -
                                                                                                                                                                           Education      HR SaaS       Contingent
                                                                                                                                                                                                          labour

         Operating cash flow1 to EBITDA to                                                 Track record of generating high ROI                                Focus on key themes of Online Education,
               conversion of c105%                                                                                                                                 HR SaaS & Contingent Labour
      • Includes OES cash receipts of                                                  • Continuing to deploy significant                                    • Strong results during COVID-19 period
        cA$33.8m (received Jan 2021)                                                     capital into our capex investment
                                                                                                                                                             • Deployed cA$99m in H1 21 (primarily in
                                                                                         given track record of high returns
      • Excluding OES, conversion was 91%                                                                                                                      HR SaaS)

15    1 Cash   flows from operating activities excluding interest, transaction costs, tax payments                                                                       SEEK Limited H1 21 Results Presentation
In H1 21, we undertook strategic investment and intend to
 recommence paying dividends in FY21

                                                            Net debt                                                                                  Update on Dividends

         Flexibility to invest in H1 21                                                                                               No interim H1 21 dividend
         • Covenant limits have been increased through to Jun-211                                                                     • It is the Board’s intention to recommence payment
         •   Operating cash flows and EBITDA are improving                                                                              of ordinary dividends at full year (FY21) subject to
                                                                                                                                        ongoing improvement in the macroeconomic
         •   In H1 21, we invested for the long-term
                                                                                                                                        conditions across our key markets
                  o     Investment in Product & Tech
                                                                                                                                      •   In lieu of an interim H1 21 dividend, and subject to
                  o     Deployed capital for M&A (HR SaaS focus)                                                                          the signing and completion of a Zhaopin
         •   Group net debt (cA$905m) was broadly in line with Jun-20                                                                     transaction, the Board intends to declare and pay a
                                                                                                                                          dividend prior to the FY21 results (Aug-21)4
         Strong liquidity and flexibility in capital structure
         • Strong liquidity via Cash and undrawn debt facilities in
           Borrower Group2
         •   Proceeds from the A$75m Subordinated Notes “tap”
             received in July-20
         •   Earliest debt maturity is Nov-223 given redemption of
             A$175m Senior Notes (completed July-20)

     1 Refers to a temporary increase in key covenant limits in SEEK’s senior syndicated debt facility (to June 2021)
     2 Borrower  Group includes SEEK Limited and all subsidiaries in which its ownership is at least 90%
16                                                                                                                                                             SEEK Limited H1 21 Results Presentation
     3 Next maturity relates to the A$362.5m Revolving tranche of SEEK’s senior syndicated debt facility, which matures in Nov 2022
     4 Record and Payment dates for this dividend to be determined upon declaration of the dividend
Asia Pacific &
Americas
(AP&A)
AP&A progressed well in H1 21 as it looks to unlock the significant
     APAC opportunity

 H1 21 Summary                                                                                      Significant APAC opportunity
      Market positions remained strong though competition intense
                                                                                                                                                    Asia relative
      Variable recovery across regions; ANZ strongest                                                                                                 to ANZ
                                                                                                                ANZ

      EBITDA benefited from revenue outperformance vs expectation1

                                                                                       Population                                c590m                     c19.5x
                                                                                                          c30m
 Key operational progress
                                                                                                            1                       2

      New contract structure rolled out to majority of AU customers                    GDP
                                                                                                                                cA$5.1t                    c2.1x
                                                                                                         cA$2.4t
      Unification progressing well giving confidence for more ambitious
      approach                                                                                              1                       2

      Deepening engagement with candidates and hirers through the roll-out             Urbanisation                                                        c0.6x
                                                                                                          c86%
      of Smarter Search and several other product initiatives                                                                     c53%

                                                                                                            1                        2
 Strategic focus areas
                                                                                       Ave. GDP
      Focus areas remain unchanged:                                                    per Capita        cA$72k                                            c0.4x
                                                                                                                                 cA$31k
      1. Unify APAC platforms for faster, scalable product roll-out
                                                                                                            1                        2
      2. Align price to value                                                          Revenue
                                                                                                        cA$387m                 cA$163m                    c0.4x
      3. Deepen engagement through data, analytics & product innovation                (FY20)

18    1 Refers   to SEEK’s expectations at the time of setting AGM guidance (Nov-20)                             SEEK Limited H1 21 Results Presentation
ANZ job ad volume ended H1 21 ahead of pcp

                           SEEK ANZ - Volume trends                                                           Detailed Insights

                            Job ad volumes by month (‘000s)                             Industries hardest hit by COVID-19 have recovered well
     250                                                                                • Hospitality & Tourism and Retail & Consumer amongst the
                                                                                          hardest hit in H2 20 but moved ahead of pcp from Nov-20
                                                                                        • Other large industries including Trades & Services, Healthcare &
     200                                                                                  Medical, Manufacturing, Transport & Logistics and Community
                                                                                          Services & Development all moved ahead of pcp during H1 21
                                                                                        • Professional Services continue to be impacted with volumes down
     150                         -c65%                                                    c25% (Dec-20 Qtr vs pcp)
                                 vs pcp

                                                                                        SME led the recovery
     100                                                                                • SME volumes up 15% (H1 21 vs H1 20)
                                                                                        • High concentration of SMEs in fastest recovering industries (e.g.
                                                                                          Hospitality, Trades & Services) and in regional areas
     50                                                                                 • Recruiter activity remains subdued as a result of exposure to
                                                                                          industries which have generally been slower to recover

                                                                                        Varying rates of recovery across Australia
                                          PcP    Actual
                                                                                        • Recovery in NSW, VIC & ACT slower but still improving (higher
           General observations                                                           proportion of Professional Services)
           • Relatively short recovery period (c10 months) vs the GFC (31 months)       • Solid recovery in other states with positive growth on pcp
           • Employment activity strongly impacted by lengthy lockdowns
           • Recovery accelerated in late H1 21 (Dec-20 job ad volumes ahead of pcp),
             potentially linked to pent up demand

19                                                                                                                   SEEK Limited H1 21 Results Presentation
SEEK ANZ benefited from higher SME contribution and depth product
     adoption
                                                   Financials                                                                                                      Depth revenue result

                                                                                                                                                                              A$m
                                                            A$m                                Growth                                                                                                           +12%

                                                       H1 21   H1 20                             %                                                                                                                        68.8
             Revenue                                   223.0    224.4                           (1%)                                                                                                            61.4
             EBITDA                                    133.1    134.2                           (1%)                                                                                                   52.6
              EBITDA (%)                               60%      60%
                                                                                                                                                                                              37.7

         Revenue decline of 1% attributable to:                                                                                                                                     29.3
                                                                                                                                                                            22.2
         •   (16%) volume decline                                                                                                         17.6      17.3             18.0
                                                                                                                                                            15.5
         •   12% yield driven by customer mix1 and lower discounting2, partly
             offset by lower variable ad pricing due to market conditions
         •   3% depth (Premium, Standout, Premium Talent Search etc)
                                                                                                                                         H1 12     H1 13    H1 14   H1 15   H1 16   H1 17   H1 18     H1 19    H1 20      H1 21
         Recovery continues, led by SMEs and strong depth utilisation
         • Ad volumes 3% ahead of pcp (Dec-20)
                                                                                                                                                              Ongoing growth opportunity
         • SMEs strong (now c38% of volume), Corporates also improving
         • Strong depth product usage with revenue up 12% vs pcp
            o Premium Ad revenue up 43% and now c7% of total ads                                                                     •   Significant upside from aligning price to value and deepening
                                                                                                                                         candidate and hirer engagement
         Managed costs while continuing to invest for the long-term                                                                  •   Volumes remain highly leveraged to macro conditions
         • Reduction in discretionary costs balanced with product & tech
           investment                                                                                                                •   Positive yield skew from SMEs unlikely to continue at this level
         • SEEK intends to voluntarily repay A$9.8m in COVID-19 subsidies3
           (incl. JobKeeper) received in H1 21 (nil benefit to EBITDA)

     1 IncreasedSME hirer activity
20
     2 Lower avg. discounts due to: (1) reductions in committed ad spend (macro related); and (2) the transition to standardised discounts for all hirers                       SEEK Limited H1 21 Results Presentation
     3 COVID-19 subsidies received from the Australian and New Zealand Governments in H1 21. Repayments will be made net of tax.
SEEK ANZ is the market leader but competition is intensifying
                                                                                                                                                                                        UNPROMPTED BRAND AWARENESS7

                                                        c16m                                                35m+                                                                                                 78%
                                                                                                                                                                                                                 +2x lead vs nearest competitor
                                                 Candidate             Profiles1                         Monthly               visits3
                                               85%+ of ANZ labour force2                           c70% of traffic via mobile/apps
     DELIVERING VALUE                                                                                 c75% of traffic is direct4                                                               SHARE OF AU PLACEMENTS8
     FOR CANDIDATES
                                                                                                                                                                                                     Last 12 months
                                                                                                                                                                                                                                                  30.9%

                                                      c160k                                              c135k                                                                      6.1%                 4.2%                4.1%
                                                   Active Unique             Hirers5                    Job ads on platform
     DELIVERING VALUE                                 Last 12 months                                    H1 21 monthly average
                                                                                                                                                                               Professional             Online          Aggregators              SEEK
        FOR HIRERS
                                                                                                                                                                                Networks              Classifieds                            (incl. JORA)
                                                                                                                                                                       Note: Offline channels (including word of mouth, internal referrals, notice boards, etc.) account
                                                                                                                                                                       for a combined 26% of placements

                                                                                                                                                                    Placement share fell in an unusual market

                                                         c20%                                                c31%                                                   • COVID-19 had a significant impact on role mix and candidate
                                                                                                                                                                      behaviour
                                                                                                                                                                    • Facebook in particular saw increased placement attribution of
                                                   Uplift in Applications6                              Share of placements                                           lower skilled roles
                                               driven by AI-powered Smarter                             lead of c5x over nearest
     HIGHLY EFFECTIVE                          Search and Recommendations                                 competitor (see RHS)                                      Overall, no change to SEEK’s lead vs. nearest competitor (c5x)
      MARKETPLACE                                                                                                                                                   • Intense competition continues requiring ongoing innovation

     1 Searchable   profiles of c11.4m as at 31 December 2020
     2 Source data: ABS and Stats NZ
     3 Total visits including desktop, mobile & app
     4 Direct visits includes traffic direct to the SEEK website & apps (including traffic from notifications)
     5 Total number of active advertisers (posting any job ads) between 1 Jan 2020 and 31 Dec 2020
     6 Refers to application starts per candidate. Management estimate based on internal analysis.
     7 Source: Independent research conducted on behalf of SEEK. Study is conducted monthly among c800 people and weighted to be representative of the Australian labour force
21   8 Includes SEEK and Jora placements. Source: Independent research conducted on behalf of SEEK (as at January 2021). Study is conducted quarterly among c3k Australian’s that changed / started
                                                                                                                                                                                                         SEEK Limited H1 21 Results Presentation
       jobs in the last 12 months. Data is weighted to be nationally representative of the Australian labour force with quotas set for age, gender, location and employment status.
SEEK Asia volume recovery is variable

                       SEEK Asia - Volume trends                                          Key insights by market
                                                                          Hong Kong
                                                                          • Improving ad volume trends (Q2 FY21 ad volume up 7% vs Q1
                                                                            FY21)
                                                                          • Momentum building in Financial Services, Telecommunication
                                                                            and Construction
                                                                          • Geopolitical issues/social unrest remains

                                                                          Malaysia
                                                                          • Volumes steadily recovering but stalled by lock-downs in early
                                                                            CY21
                                                                          • Improving GDP indicators across Building & Construction,
                                                                            Manufacturing & Services

                                                                          Singapore
                                                                          • Lower levels of COVID-19 restrictions and improving economic
                                                                            conditions have translated into a faster recovery

     General observations                                                 Developing Markets
     • Steady recovery in job volumes but to varying degrees by market    • Philippines: recovery continues to be held back by high rates of
     • Rates of recovery highly correlated to COVID-19 restrictions         COVID-19 infections and restrictions
       o Hong Kong, Singapore, Malaysia and Thailand are showing better   • Thailand: strong recovery amongst SMEs and positive signs
          signs of recovery                                                 from Corporates in Q2 FY21
       o Philippines & Indonesia continue to be impacted by ongoing       • Indonesia: slowing volume declines and improving economic
          lockdowns                                                         indicators
     • SME segment is leading the recovery as observed in SEEK ANZ

22                                                                                                    SEEK Limited H1 21 Results Presentation
SEEK Asia maintained operational progress despite the
     disruption
                                                   Financials                                                                    Operational insights

                                                                                                      Constant   Operational progress from recent investment and
                                                           A$m                        Growth          Currency   unification initiatives
     SEEK Reported                                H1 21            H1 20                 %               %
                                                                                                                 • Brand refresh (Jobstreet & JobsDB)
       Revenue                                    67.1             91.3                (27%)           (23%)
                                                                                                                 • Smarter Search technology rolling out to Asian markets
       EBITDA                                     22.2             45.6                (51%)           (49%)
                                                                                                                 • Improved Mobile App technology
        EBITDA (%)                                33%              50%
                                                                                                                 • Evolving depth product suite with launch of Branded Ads
          Revenue decline (constant currency) of 23% attributable to:                                              which are performing well

          • (29%) volume decline
          • 12% yield driven by price1, country & customer mix
          • (3%) depth2 (Stand Out, Talent Search etc)
                                                                                                                                  Growth opportunity
          • (3%) other (non-core revenue streams)

          COVID-19 continues to impact volumes but signs of recovery                                             Opportunity is large but requires continued investment
          • Hong Kong, Malaysia and Singapore were key contributors to the                                       • Long-term revenue opportunity is larger than ANZ with similar
            revenue decline but are recovering faster than developing markets                                      growth strategy but requires investment
          • Depth increased to 18% of revenue                                                                       o Progress from initial platform and product integration
                                                                                                                    o Considering new pricing models with trials underway
          Increasing investment in capability, product and technology
          • New CEO and refreshed Exec team focused on improving
            capability to drive future growth                                                                    Leveraged to upside when economic conditions improve

      1   Benefit relates to price rises implemented in late H1 20                                                                         SEEK Limited H1 21 Results Presentation
23    2   Defined as non-basic job ad revenue (e.g. Stand Out /Branded ads and Talent Search, etc.)
SEEK Asia has strong marketplace metrics and a large
     geographic footprint

                                                         c29m                                                40m+
                                                    Candidate Profiles1                                Monthly visits3
                                                    c12% of labour force2                        c70% of traffic via mobile/apps
     DELIVERING VALUE                                                                               c70% of traffic is direct4
     FOR CANDIDATES

                                                       c105k                                               c160k
                                                    Active Unique Hirers5                              Job ads on platform
                                                       Last 12 months                                  H1 21 monthly average
     DELIVERING VALUE
        FOR HIRERS

                                                          c20%                                                  c21%
                                                   Uplift in Applications6                           Share of Placements (Avg)7
                                               driven by AI-powered Smarter                            across all SEEK Asia markets
     HIGHLY EFFECTIVE                          Search and Recommendations
      MARKETPLACE

     1 Searchable   profiles of c23.2m as at 31 December 2020
     2 Source data: World Bank
     3 Total visits including desktop, mobile & app
     4 Direct visits includes traffic direct to the JobStreet and JobsDB websites & apps (including traffic from notifications)
     5 Number of active advertisers (posting any job ads)

24   6 Refers to application starts per visit. Management estimate based on internal analysis.                                                          SEEK Limited H1 21 Results Presentation
     7 Placements data based on independent SEEK Asia Placement Study (November 2020) conducted on behalf of SEEK. Sample data weighted by education.
To capitalise on the large APAC opportunity SEEK is focused on
      three key strategic areas

                                                                               Progress in H1 21                                      Roadmap for H2 21

                 1. Unify                              • Commenced candidate experience unification                •   Complete Smarter Search platform roll-out
                platforms                                  • Common discovery experience (search, view job etc)    •   APAC unification to be accelerated
                                                             rolled out across Asia
     Unify APAC platforms for faster,
         scalable product roll-out                         • Smarter Search rolled out to majority of Asian
                                                             markets driving strong engagement uplift

             2. Align price                            • AU: new pricing model rolled out to majority of           •   AU: complete contract and pricing transition to all hirers
                to value                                 customers (c85% of total ads are now variably priced      •   NZ: transition to new pricing model expected to
                                                         and c90% conversion to new SEEK contract1)                    commence from March 2021
      Moving to more value aligned,
     fairer and efficient marketplace                  • Asia: Branded Ad launched and pricing trials commenced    •   Asia: continue value alignment trials
           with greater flexibility

              3. Deepen                                • APAC: Enhancements to Smarter Search algorithms           • APAC: Enhancements to search personalisation
             engagement                                • ANZ: Profile Apply released to all devices, Certsy        • ANZ: Scale Certsy validations & assessments,
                                                         assessment launched (AU), new hirer reporting tools, AI     enhancements to Talent Search
      Deepen engagement through                          recommendations and notification platform upgraded
        data, analytics & product                                                                                  • Asia: Scale unified recommendations platform and
               innovation                              • Asia: Releases focused on optimising hirer experience       release of Role Requirements (Indonesia)

25                                                                                                                                       SEEK Limited H1 21 Results Presentation
       1   c90% conversion refers to the transition of subscription contracts which have come up for renewal
Acceleration of our unification program will help unlock the APAC
     market opportunity earlier

       APAC unification will provide scale efficiencies and increase speed to market
       • Unified technology allows us to better leverage our people and products across a broader footprint
       • Increased speed to market will strengthen SEEK’s competitive position

       Progress made on the Candidate side of the marketplace
       • Brand refresh and alignment for Jobstreet & JobsDB
       • Rolled out ANZ Job Discovery experience into Asia
         o New Home page, Search Results and Job Detail pages rolled out to all Asian markets
         o Smarter Search rolled out to majority of countries, Hong Kong and Thailand to complete in H2 21

       Progress to date gives us confidence to be bolder and bring forward unification on the Hirer side
       • Over the next two years, SEEK will unify both the Candidate and Hirer sides of its marketplace in parallel
       • Scaling up our resources and investment in order to realise the benefits earlier
         o Will require significant capital investment over the coming two financial years

26                                                                                      SEEK Limited H1 21 Results Presentation
LatAm: focused on re-building sustainable businesses

                          Brasil Online                                               Key insights

                                    BRLm        Growth   • COVID-19 impact continues to be severe in Brazil and Mexico
      Pro-Forma                H1 21    H1 20      %
         Revenue               61.7      80.7    (24%)   • Strategy is in place to re-build sustainable businesses
         EBITDA                 2.7       9.4    (71%)     o   Focusing on a range of initiatives including pricing model trials
          EBITDA (%)            4%       12%
                                                           o   Requires time and successful execution
      EBITDA A$m (100%)         0.7       3.4   (79%)      o   Goal of cash neutrality remains, but will be hard to achieve in
                                                               FY21

                              OCC

                                   MXNm         Growth
      Pro-Forma                H1 21   H1 20       %
         Revenue               138.8   182.7     (24%)
         EBITDA                27.2    52.9      (49%)
          EBITDA (%)           20%     29%

      EBITDA A$m (100%)         1.8       4.0   (55%)

27                                                                                           SEEK Limited H1 21 Results Presentation
SEEK
Investments
M&A and entrepreneurial ventures are a key part of creating long-
     term value for SEEK shareholders
          Investing in emerging leaders leveraged to long-term structural trends in the Human Capital Market.
                  We then work with management teams to unlock the full potential of their businesses

                SEEK Investments                     SEEK Investments unique                  Focused on long-term
                   approach                            strategic advantages                         returns
          • Investing in purpose aligned          • Deep expertise from c23 years as      • Focused on investment to
            businesses across the Human             a leading operator and investor in      build market share ahead of
            Capital Market                          Human Capital businesses                short-term profits

          • Active partner offering               • Significant deal flow based on        • Focused on long-term unit
            strategic & operational support         reputation and strategic assets         economics

          • Adopting a patient and long-          • Potential synergies across the        • Target is to generate long-
            term mindset to build large             portfolio leveraging scale of data,     term capital appreciation
            defensible businesses                   relationships and learnings             (e.g. IRRs of 15-20%, 5+ years)

 Intended changes to increase independence are expected to allow SEEK Investments to:
  1. Aggressively invest and build large businesses
  2. Source external long-term capital to meet the needs of high growth ESV portfolio

29                                                                                               SEEK Limited H1 21 Results Presentation
Zhaopin achieved a solid result driven by improving billing
     trends and operational efficiencies
                                                 Financials                                                                                                          Results & Insights

                                                                        RMBm                        Growth
                                                                                                                                  Online and Adjacent revenue showing good momentum
       Pro-Forma                                                   H1 21   H1 20                        %
                                                                                                                                  • Online billings recovering faster than reported revenue
             Online Revenue (100%)                                  969.5  1,091.4                   (11%)
                                                                                                                                    o Billings (lead indicator) up 6% YoY with Q2 FY21 up 12% YoY;
             Adjacent Services Revenue (100%)                       875.1   924.0                     (5%)
                                                                                                                                      H2 21 has started positively
            Revenue (100%)                                         1,844.6 2,015.3                    (8%)
                                                                                                                                  • Adjacent services revenue grew faster than online revenue
            EBITDA (100%)                                           380.8   337.4                     13%
                                                                                                                                    o Adjacent services (excl BPO) grew by 3%
             EBITDA (%)                                             21%     17%
                                                                                                                                    o BPO declined 15% YoY partly due to a change in revenue
       EBITDA A$m (100%)                                             77.3           69.9               11%                            recognition3

                                       Operational Metrics                                                                        EBITDA up YoY due to efficiencies and online adoption
                                                                                                                                  • Realised operating efficiencies across personnel, marketing and
                                                                                                                                    migration to online solutions (e.g. self-service, campus)
     Hirer metrics and usage impacted by COVID-19
                                                                                                                                  • Ongoing investment in mobile, data/AI and product & tech
     • Total active hirers on platform +18% vs pcp (paying & non-paying hirers)
     • Paying hirers1 of 405k, down 34% Q2 FY21 vs pcp
     • Higher ARPU vs pcp due to change in customer mix (less low value /
                                                                                                                                  Well placed to capture long-term market opportunity
       more high value hirers)                                                                                                    • Ongoing innovation and strong execution required given
     • Billings improving, quarterly growth rates are increasing (refer RHS)                                                        intensely competitive market
                                                                                                                                  • Zhaopin well placed to drive market penetration, monetisation &
     Solid candidate metrics                                                                                                        scale adjacent services
     • 229m registered candidates, up 12% YoY2
     • 146m completed resumes, up 12% YoY2
     • 3.6m average daily unique visitors, down -1% YoY1

        1 Metrics relate to Q2 FY21 vs Q2 FY20. Paying / Unique hirers represents customers that have an active contract in Q2 FY21 (includes contracts purchased in prior 12
        months including COVID-19 period)
        2 Metrics as at 31 Dec 2020 vs pcp
        3 As a result of changes in contract terms, in FY21 some of Zhaopin’s BPO Services are transitioning from Gross Revenue to Net Revenue recognition. Zhaopin’s BPO
30                                                                                                                                                                              SEEK Limited H1 21 Results Presentation
           service offerings attract varying GP margins, all of which are low. The accounting change does not impact EBITDA.
OES: COVID-19 increased the demand for online education

                                                    Financials                                                                                                 Growth Strategy & Outlook

                                                                          A$m                          Growth
     Pro-Forma                                                      H1 21    H1 20                       %
       Revenue (100%)                                                89.7     65.1                       38%
       EBITDA (100%)                                                 26.8     18.6                       44%
        EBITDA (%)                                                  30%       29%
                                                                                                                                        1                          2                      3                       4
                                                                                                                                             Post-grad                  Under-grad            Short &                 Unbundled
                                                                                                                                            OPM Services               OPM Services        Micro-courses              Services3

                                            Results & Insights

       Strong revenue growth of 38% (vs pcp)                                                                                          Progress made against key growth drivers
       • Results better than anticipated                                                                                               1     Leveraging expertise to scale new partners (QUT & Monash) and
       • All revenue lines favoured by COVID-19 related demand                                                                               pursuing new opportunities
       • Strong progress in growing new revenue streams
         o New Monash contract (Post-grad) performing well
                                                                                                                                       2     Good growth in student body despite Australian funding caps
         o New contract wins for unbundled services                                                                                    3     Delivering short courses on behalf of Swinburne & QUT
       EBITDA result driven by revenue growth                                                                                          4     Delivering learning design solutions and managed services to
       • Earnings result demonstrates scalability of online model                                                                            partners in AU, US, NZ, UK and mainland Europe

       Delivering world-class student outcomes on an increasing scale                                                                 Investing to build a large and scalable business
       • 14k+ students across 6 uni partners (AU & UK)1
       • Student satisfaction scores of c89%2                                                                                         • Expect an aggressive investment bias to build a global OPM
       • Delivering OPM and online content services to partners in AU, US, NZ,                                                          business
         UK and mainland Europe                                                                                                       • Construct Education4 acquisition to help open up new markets

       1 Totalcurrent students: Swinburne Online, WSU, QUT, Monash & UK partnerships
       2 Metricsrelate to Swinburne Online (UG). Source: QILT Student Experience Survey (SES) data. Student satisfaction scores based on teaching quality & student support
31     3 Unbundled Services relates to customised education solutions, including certain elements of full OPM Services                                                          SEEK Limited H1 21 Results Presentation
       4 OES acquired a controlling interest in Construct Education (Nov-20), a designer and developer of online education with a presence in the US, UK and mainland Europe
Our diverse portfolio of Online Education businesses are disrupting
     traditional modes of education delivery
                                                         Online Program Management &                                                                    Online Education Marketplaces /
                                                           Higher Education Services                                                                              Distribution

                                                                  1
     Investments in
     emerging leaders
                                           Australia, US, NZ, UK         Latin America                     Latin America                       Latin America           UK, Europe & Australia              Global
                                               and Europe

     Serving an                           • Partners with universities to                         • Online university                   • Provides career-             • Enabling partners to reach new
                                            bring content online and expand                         offering high-quality                 relevant IT (incl              students (global and local) and
     important need
                                            student access to high-quality                          education for                         coding) courses                provides learners with access to
                                            online education                                        Spanish speaking                                                     global career-relevant education
                                                                                                    students                                                             (short courses through to degrees)

                                           • c60k students / learners                                                                   • 80m+ students / learners
     Portfolio metrics                     • c60% student growth vs pcp                                                                 • 50%+ student growth vs pcp
                                                                                                                                        • 400+ education partners

                                           • Grow number of courses in current specialisations
     Levers of growth
                                           • Evolve product offerings (e.g. short courses, micro credentials and “stackable” degrees)
     Accessing a Global                    • Expand product offerings (e.g. post-grad, learning design solutions and managed services)
     TAM of A$50b+2                        • Pursue new partnerships & new geographies

                                                                             44% ‘look-through’3 revenue growth (vs pcp)
      1 OES is one of SEEK’s more mature Online Education investments and is reported separately to SEEK’s Online Education ESVs
      2 Online Education TAM = Enterprise Training opportunity of cA$50b + MOOCs/Online Short Courses/Online Program Management of cA$5b+. Source: Internal
32      management analysis supported by external market studies                                                                                                          SEEK Limited H1 21 Results Presentation
      3 Look-through’ share represents revenue of investments multiplied by SEEK’s ownership interest (based on comparable ownership interest across H1 20 & H1 21).

        Excludes OES & Coursera
Our HR SaaS businesses provide tech-enabled solutions to solve
     complex problems

     Investments in
     emerging
     leaders                                      Australia, Asia, UK & US                           Australia, NZ, UK & US                        Australia, NZ, UK & SE Asia                     Israel, UK, & US

                                         • A leading digital learning                       • A talent acquisition suite                      • A HR Information System                  • A HR Information System
     Serving an
                                           platform enabling                                  that simplifies the hiring                        that helps SMEs to easily                  tailored to mid-large sized
     important need
                                           organisations to source,                           process for recruiters and                        manage HR, payroll and                     businesses, with a focus
                                           curate, deliver and track                          corporate talent acquisition                      employee benefits                          on employee experience
                                           employee training                                  teams

     Portfolio metrics                    • >90% recurring revenue
                                          • c8k customers growing at c30%+
                                          • >100% net revenue retention (i.e. value from upselling more than offsets value from churned customers)
                                          • Strong unit economics driven by effective customer acquisition and low churn

     Levers of growth                     • Adding new customers (replacing manual solutions with HR Software, winning share from legacy providers)

     Accessing a Global                   • Growing customer value through innovation (e.g. new modules, upsell, cross-sell)
     TAM of A$55b+1                       • Pursue new partnerships & new geographies

                                                                           45% ‘look-through’2 revenue growth (vs pcp)

     1  HR SaaS TAM includes both Talent Acquisition software (e.g. JobAdder) and Talent Management software (e.g. GO1, Employment Hero, Hibob). Source: Internal
33   management analysis supported by external data                                                                                                                      SEEK Limited H1 21 Results Presentation
     2 ‘Look-through’ share represents revenue of investments multiplied by SEEK’s ownership interest (based on comparable ownership interest across H1 20 & H1 21)
Our contingent labour platforms are leveraged to the growing
     temporary labour force

     Investments in
     emerging
     leaders                                       Europe & Latin America                                 Australia & NZ                                              UK                        Latin America & SE Asia

     Serving an                         • A tech-enabled staffing                           • A tech-enabled marketplace                     • A tech-enabled marketplace      • A tech-enabled marketplace
     important need                       marketplace connecting pre-                         providing pre-qualified shift-                   connecting pre-qualified          connecting businesses with
                                          qualified workers to medium-                        based workers to employers                       Nurses and Care Workers           freelancers that work in IT,
                                          to-long term assignments,                           and reliable work to a large                     with clients in the Social Care   programming, design and
                                          providing reliable work to a                        labour pool                                      industry looking to fill shifts   content writing
                                          large labour pool

     Portfolio metrics                    • Overall strong net revenue growth despite COVID-19 impacts
                                          • Improvements in net revenue margins (take rates) across most of the portfolio

     Levers of growth                     • Pursue new industry verticals & new geographies
                                          • Adding new customers (including through new channels)
     Accessing a TAM of
     A$20b+ across                        • Driving greater usage from existing customers (including new product features)
     AP&A and Europe1

                                                                            28% ‘look-through’2 revenue growth (vs pcp)

     1 Contingent Labour TAM includes net revenue of non-permanent labour across AP&A Geographies and Europe . Source: Internal management analysis supported
34   by external market studies                                                                                                                                            SEEK Limited H1 21 Results Presentation
     2 ‘Look-through’ share represents revenue of investments multiplied by SEEK’s ownership interest (based on comparable ownership interest across H1 20 & H1 21)
Outlook
YTD Performance vs SEEK’s AGM guidance

        Since late Nov-20 SEEK’s results and momentum have been significantly better than our
        AGM expectations1
        • Results for the last 6 weeks of CY20 were significantly better than our AGM expectations 1
              o         Mainly driven by ANZ, with OES and SEEK Asia to a lesser extent
        • Trading momentum has continued into early CY21
        • As a result, our expectations for FY21 have increased

36   1 Expectations   at the time of setting the AGM Guidance (Nov-20)                    SEEK Limited H1 21 Results Presentation
FY21 Guidance Update
                Context
                • Forecasting remains challenging given volatility caused by COVID-19, changes in hiring sentiment and FX
                   o SEEK’s ad volumes have responded quickly to changes in COVID-19 restrictions, both positively and
                      negatively. Yields are also sensitive to the sectors in which activity occurs

                SEEK Group FY21 Guidance (excluding significant items)
                • UPDATE: Revenue to be in the order of A$1,700m
                • UPDATE: EBITDA to be in the order of A$460m
                • AFFIRM: SEEK Investments ESV losses to be in the order of A$55m1 (SEEK share of NPAT losses)
                • UPDATE: Reported NPAT to be in the order of A$100m

                Key assumptions: operating environment
                •   COVID-19: Health environment remains broadly consistent with current conditions (e.g. no pro-longed lockdowns)
                •   Macro: No material changes in macro settings or FX to cause a shift in hiring demand
                •   SMEs: Currently a key driver of revenue recovery (esp. SEEK ANZ) and in H2 21 have assumed more normalised hiring levels

                Other assumptions vs AGM guidance
                •   Revenue: SEEK ANZ significantly outperforms, OES and SEEK Asia slightly outperform
                •   Opex: Increase in re-investment given revenue outperformance
                •   D&A, Net Interest & Capex: All broadly in line with AGM guidance2,3
                •   Assumes consolidation of Zhaopin at 61.1% ownership interest for H2 21
                   o SEEK will update the market as appropriate on the Zhaopin discussions

     1 SEEK   share of NPAT losses in H1 21 was A$22m, H2 21 in the order of cA$33m
37
     2   D&A and Net Interest: Aggregate amounts to be broadly comparable to FY20                                                         SEEK Limited H1 21 Results Presentation
     3   Capex: Product & Tech Capex to be broadly comparable to FY20, and H2 21 to include cA$50m related to new Melbourne Head Office
Well positioned to grow SEEK’s long-term value

        Strong performance during COVID-19 and in initial recovery stage demonstrates SEEK’s
        resilience and strength

        We see significant opportunities to grow SEEK and SEEK Investments
        • Both businesses are executing well against key strategic priorities
        • Competition is intense and further investment is required to grow our advantages

        We expect a seamless leadership transition
        • SEEK has a deep management team and strong track record of developing and attracting
          senior leaders

        The Board is undertaking a review that is targeting the following outcomes:
        1. Greater independence and focus to execute their growth strategies
        2. More efficient capital structure to unlock the full potential of SEEK Investments
        3. Remove SEEK’s requirement to fund SEEK Investments, and as a result create greater
           flexibility for SEEK to re-invest and pay dividends

        Confident the review can deliver the right outcomes which will position SEEK and SEEK
        Investments for their next leg of growth

38                                                                            SEEK Limited H1 21 Results Presentation
Appendices
SEEK Group: H1 21 Segment Results
               H1 21 Segment Results (from Note 1, p18 of SEEK’s Half-year Report 2021)

40                                                                            SEEK Limited H1 21 Results Presentation
SEEK Group: Net Debt Breakdown (31 December 2020)

                                                                                                                                  31 December 2020 (A$m)
                                                                                                                                                 Short                                    Net
                                                                                                       Facility                                            Funds on
                                                                                                                          Borrowings Cash        -term              2                    Cash/
                                                                                                        Limit                                               deposit
                                                                                                                                              Investments                                (Debt)
                              SEEK Ltd - A$ bank debt                                                 A$612.5m                  (487.5)
                              SEEK Ltd - US$ bank debt                                               US$552.5m                  (662.2)
                              SEEK Ltd -A$ Subordinated Floating Rate Notes                           A$225.0m                  (225.0)
                                                                                                                             (1,374.7)                                                  (1,374.7)
                              Cash & short-term investments                                                                             158.5          0.1                                  158.6
                                                        1
                              SEEK Ltd Borrower Group                                                                          (1,374.7)        158.5             0.1               - (1,216.1)

                              Zhaopin                                                               RMB 789.9m                      (81.0)
                              Zhaopin                                                                US$240.0m                     (215.8)
                                            2
                              Zhaopin Total                                                                                       (296.8)       354.0             0.6        250.2           308.0

                              Other                                                                      A$14.2m                      (4.8)         8.3           0.1               -           3.6

                              SEEK Group Total                                                     A$2,037.4m                  (1,676.3) 520.8                    0.8        250.2        (904.5)
                              Less transaction costs capitalised                                                                    10.1
                              Per Consolidated Balance Sheet                                                                   (1,666.2)

                                             Subsequent to 31 December 2020, during January 2021, OES established a new A$15m revolving loan facility maturing in January 2024

     1 ‘Borrower
               Group includes SEEK Limited and all subsidiaries in which its ownership is at least 90%
     2 Fundson deposit relates to A$250.2m held as security by Zhaopin lenders which is recognised in Other receivables’(A$113.4m) and ‘Other financial assets’
41                                                                                                                                                                      SEEK Limited H1 21 Results Presentation
      (A$136.8m) in SEEK’s Half-Year Report 2021
Group Capex of A$67m with majority of investment in Product & Tech

              SEEK Group Capex                                  Key insights

                                      Product & Tech:

                                         AP&A capex of cA$43m mainly relating to:
                                         • ANZ: AI & Search, CRM, Mobile, Hirer analytics & insights
                                         • Asia: Platform unification (incl. Smarter Search, Recommendations,
                                           Notifications) and Mobile

                                         SEEK Investments capex of cA$12m relating to:
                                         • Zhaopin: Mobile App enhancements, Search optimisation, and
                                           initiatives across data, platform & AI
                                         • OES: partner integrations and software to support course delivery

                                                                 P&L impact

                                          Depreciation & amortisation
                                          • Product & tech assets amortised over an average of 3-5 years
                                          • Expect D&A expense to increase over time reflecting higher Capex
                                          PPA Amortisation
                                          • Purchase Price Amortisation (PPA) for existing businesses to
                                            reduce over time
                                          • PPA expense (pre-tax & NCI), expected to be cA$7m in FY21,
                                            cA$2m in FY22 and negligible thereafter

42                                                                      SEEK Limited H1 21 Results Presentation
Continued focus on key ESG areas

                            Data Trust                                                    Cyber Security

      Protecting data privacy                                           Significant investment in cyber controls
      • Data governance reflects importance of customer trust           • Protecting systems, infrastructure & processes
      • Ethical use of data for candidate benefit                       • Tackling current and emerging threats
                                                                        • Simulated hacking and penetration testing
      Data and technology
      • Driving transparency and efficiency in recruitment              Candidate security
      • Artificial intelligence delivering candidate value              • Screening/blocking technologies to prevent online fraud
      • Underpinned by Trusted & Ethical AI Principles                  • Certsy helps candidates protect their personal documents

                         Climate Change                                                   Modern Slavery

      Carbon emissions                                                  Risk assessment & due diligence
      • Online business with low emissions - business travel, offices   • SEEK employment platforms in Asia
        and data centres                                                • Supply chains - low risk
      • Greenhouse Gas disclosures in our Sustainability Report         • SEEK’s office operations - very low risk
                                                                        • No instances of modern slavery detected
      Climate strategy
      • Minimising energy use - ongoing initiatives                     SEEK Group Modern Slavery Statement 2020
      • Planning net zero transition in line with Paris Agreement       • Available on the SEEK corporate website

43                                                                                               SEEK Limited H1 21 Results Presentation
Disclaimer
The material in this presentation has been prepared by SEEK Limited ABN 46 080 075 314 ("SEEK") and is general background
information about SEEK’s activities current as at the date of this presentation. The information is given in summary form and
does not purport to be complete. In particular you are cautioned not to place undue reliance on any forward looking
statements regarding our belief, intent or expectations with respect to SEEK’s businesses, market conditions and/or results of
operations, as although due care has been used in the preparation of such statements, actual results may vary in a material
manner.

Information in this presentation, including forecast financial information, should not be considered as advice or a
recommendation to investors or potential investors in relation to holding, purchasing or selling securities. Before acting on any
information you should consider the appropriateness of the information having regard to these matters, any relevant offer
document and in particular, you should seek independent financial advice.

Non-IFRS Financial Information
SEEK’s results are reported under International Financial Reporting Standards (IFRS). This presentation also includes certain
non-IFRS measures including, “Underlying NPAT”, “EBITDA”. “Significant items” and “pro-forma”. These measures are used
internally by management to assess the performance of our business, our Associates and Joint Ventures, make decisions on
the allocation of our resources and assess operational management. Non-IFRS measures have not been subject to audit or
review.

Refer to SEEK’s Appendix 4D and Half Year Report for the 6 months ended 31 December 2020 for IFRS financial information
that is presented in accordance with all relevant accounting standards.
You can also read