1HFY2019 Results Andrew Harding - MD & CEO Pam Bains - CFO & Group Executive Strategy
←
→
Page content transcription
If your browser does not render page correctly, please read the page content below
1HFY2019 Results
Andrew Harding – MD & CEO
Pam Bains – CFO & Group Executive Strategy

                                             11 February 2019
1HFY2019 RESULTS

Disclaimer

 NO RELIANCE ON THIS DOCUMENT                                                                       NO OFFER OF SECURITIES
 This document was prepared by Aurizon Holdings Limited (ACN 146 335 622) (referred to              Nothing in this presentation should be construed as a recommendation of or an offer to sell or a
 as “Aurizon” which includes its related bodies corporate (including Aurizon Operations             solicitation of or subscription or invitation of an offer to buy or sell securities in Aurizon in any
 Limited). Whilst Aurizon has endeavoured to ensure the accuracy of the information                 jurisdiction (including in the United States), nor shall it or any part of it form the basis of or be
 contained in this document at the date of publication, it may contain information that has not     relied on in connection with any contract or commitment whatsoever. This document is not a
 been independently verified. Aurizon makes no representation or warranty as to the                 prospectus and it has not been reviewed or authorized by any regulatory authority in any
 accuracy, completeness or reliability of any of the information contained in this document.        jurisdiction. This document does not constitute an advertisement, invitation or document which
 Aurizon owes you no duty, whether in contract or tort or under statute or otherwise, with          contains an invitation to the public in any jurisdiction to enter into or offer to enter into an
 respect to or in connection with this document, or any part thereof, including any implied         agreement to acquire, dispose of, subscribe for or underwrite securities in Aurizon.
 representations or otherwise that may arise from this document. Any reliance is entirely at
 your own risk.                                                                                     FORWARD-LOOKING STATEMENTS
                                                                                                    This document may include forward-looking statements which are not historical facts. Forward-
 DOCUMENT IS A SUMMARY ONLY                                                                         looking statements are based on the current beliefs, assumptions, expectations, estimates and
 This document contains information in a summary form only and does not purport to be               projections of Aurizon. These statements are not guarantees or predictions of future performance,
 complete and is qualified in its entirety by, and should be read in conjunction with, all of the   and involve both known and unknown risks, uncertainties and other factors, many of which are
 information which Aurizon files with the Australian Securities Exchange. Any information or        beyond Aurizon’s control. As a result, actual results or developments may differ materially from
 opinions expressed in this document are subject to change without notice. Aurizon is not           those expressed in the forward-looking statements contained in this document. Aurizon is not
 under any obligation to update or keep current the information contained within this               under any obligation to update these forward-looking statements to reflect events or
 document. Information contained in this document may have changed since its date of                circumstances that arise after publication. Past performance is not an indication of future
 publication.                                                                                       performance.

 NO INVESTMENT ADVICE                                                                               NO LIABILITY
 This document is not intended to be, and should not be considered to be, investment advice         To the maximum extent permitted by law in each relevant jurisdiction, Aurizon and its directors,
 by Aurizon nor a recommendation to invest in Aurizon. The information provided in this             officers, employees, agents, contractors, advisers and any other person associated with the
 document has been prepared for general informational purposes only without taking into             preparation of this document, each expressly disclaims any liability, including without limitation
 account the recipient’s investment objectives, financial circumstances, taxation position or       any liability arising from fault or negligence, for any errors or misstatements in, or omissions from,
 particular needs. Each recipient to whom this document is made available must make its             this document or any direct, indirect or consequential loss howsoever arising from the use or
 own independent assessment of Aurizon after making such investigations and taking such             reliance upon the whole or any part of this document or otherwise arising in connection with it.
 advice as it deems necessary. If the recipient is in any doubts about any of the information
 contained in this document, the recipient should obtain independent professional advice.

                                                                                                                                                                                                             2
1HFY2019 RESULTS

         Performance Overview
         Andrew Harding
         Managing Director & CEO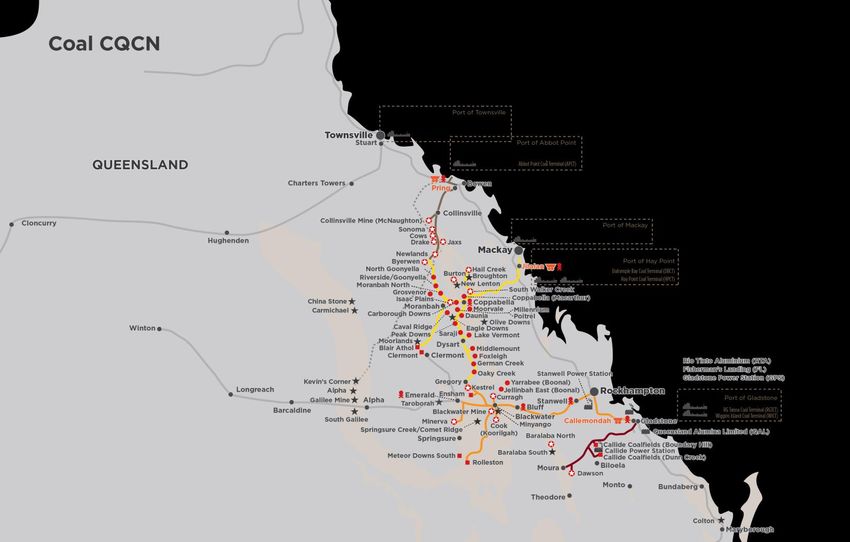
1HFY2019 RESULTS        PERFORMANCE OVERVIEW

Safety performance
Continuous focus on safety priorities had resulted in an encouraging improvement in results
over the last six months

                                                                           TOTAL RECORDABLE INJURY FREQUENCY RATE (TRIFR)1
                            Incidents per million person-hours worked

                                                                                                      10.33             -9%
                                                                                   9.88                          9.75
                                                                                                                              8.92
                                                                         8.43

                                                                                             7.12

                                                                        FY2015   FY2016    FY2017   1HFY2018   2HFY2018   1HFY2019

 1.   TRIFR includes employees and contractors                                                                                       4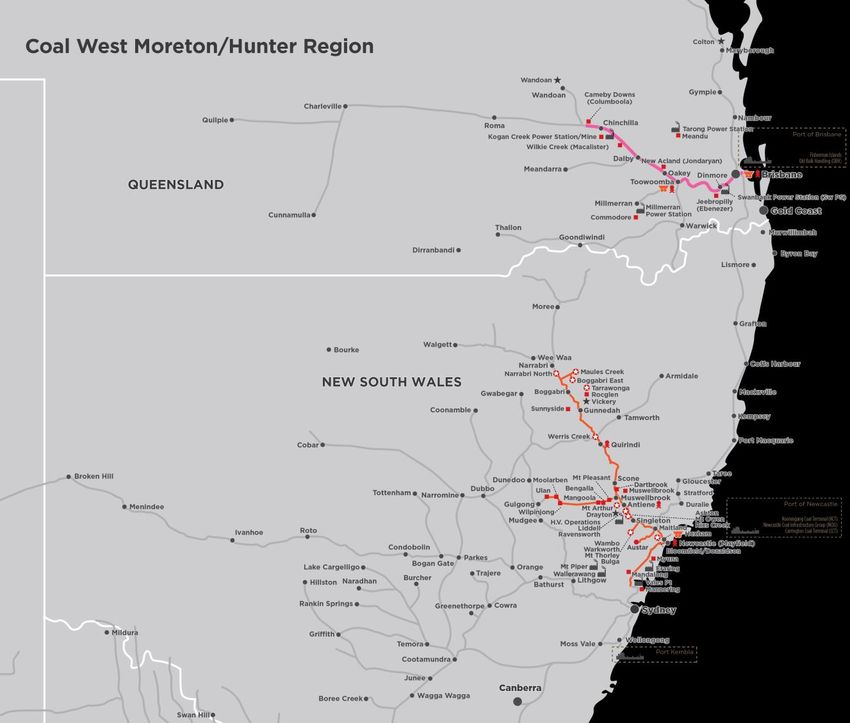
1HFY2019 RESULTS   PERFORMANCE OVERVIEW

Update on key priorities
Progress has been made on key priorities

 PRIORITY

 › UT5
   Final Decision (FD) issued 6 December 2018
   Engagement continues with all stakeholders

 › Operational Efficiency Improvement
   Precision Railroading in execution
   Key technology programs progressing
   Restructure of support areas continuing

 › Enterprise Agreements (EA)
   Two EAs completed and two approved in employee ballots
   Three Queensland EAs continue bargaining

 › Intermodal
   Queensland Intermodal transferred to Linfox
   Acacia Ridge sale subject to Federal Court proceedings

                                                            5
1HFY2019 RESULTS       PERFORMANCE OVERVIEW

FY2019 Half Year highlights1
Non-Network result in line with expectations given loss of Cliffs in Bulk and maintenance
activities in Coal. Network result reflects the UT5FD, including partial true up from FY2018

 FINANCIAL RESULTS                                                     CASHFLOW
 › Underlying EBIT down 16% to $406m                                   › Free cash flow (FCF) $371m up 8%
       › Network EBIT $203m impacted by UT5 true ups
       › Non Network EBIT (ex redundancy2) $217m
 › Total Above Rail volumes down 5%                                    SHAREHOLDER RETURNS
       › Bulk: cessation of Cliffs contract                            › Interim dividend 11.4 cents - 100% payout of underlying
       › Coal: protected industrial action (PIA) and weather impacts     continuing NPAT
 › Network volumes flat
 › Statutory NPAT $227m
 › ROIC 10%
 › Operating Ratio 72.1%

                                                  UNDERLYING EBIT BRIDGE – GROUP ($M)
                485
                                             12
                                                              6

                                                                               46

                                                                                                   15                  406

          1HFY2018                           Coal            Bulk           Network              Other             1HFY2019
 1.   Continuing operations
 2.   Total redundancy costs 1HFY2019 $14m                                                                                         6
1HFY2019 RESULTS   PERFORMANCE OVERVIEW

Coal update
Operating in a positive demand environment, Coal is investing in fleet for capability today and
future volume growth

                                    › Maintenance investment in FY2019 and fleet reliability program delivers performance
                                      improvements and supports expected future volume growth

  INVESTING IN                      › ~$110m capital invested in Hunter Valley since FY2017 for MACH Energy and other growth
     FLEET                            tonnes, in addition to transfer of locomotives from Intermodal Interstate

                                    › Further investment (capex and opex) of ~$60m committed over the next two years to
                                      support volume growth in CQCN

                                    › Positive demand environment with a competitive haulage market

                                    › Recontracting environment evolving:

                                          › Tailoring operating solutions to customer requirements
   CONTRACT
  ENVIRONMENT                             › Opening dialogue with some existing customers in relation to tailored renewal solutions

                                    › Ongoing operational efficiency improvements, including targeted investments in technology,
                                      to preserve margins over the long term

                                                                                                                                      7
1HFY2019 RESULTS   PERFORMANCE OVERVIEW

Bulk update
After positive results, focus remains on the turnaround plan and growth opportunities

                    CUSTOMER UPDATE                                            GROWTH OPPORTUNITIES

  › Linfox                                                                › Three key growth priorities:
    Linehaul (hook and pull) commercial agreement in
    Queensland                                                             1     Growth within existing operations:
    10 year contract (5 + 5 year option) commenced                               - contract yield
    February 2019                                                                - utilisation uplift
                                                                                 - cost base reduction
  › Glencore Freighter
    New service on commercial terms                                        2     Growth through market share:
    Mixed freighter and concentrates contract                                    - leveraging competitive advantage
    3 year contract (1+1+1) commenced October 2018                               - capturing greenfield growth

  › Mount Gibson                                                           3     Growth through supply chain services and
    Haul ceased January 2019 due to end of mine life                             partnerships:
                                                                                 - strategic partnerships
  › Graincorp                                                                    - leveraging key assets and depots
    Queensland contract ceases November 2019

                                          OPERATIONAL EFFICIENCY IMPROVEMENTS

  › Labour productivity initiatives (e.g. Driver only operations in Queensland, rostering consolidation)

  › Outsourcing of non-core activities (e.g. trucking activities in WA)

                                                                                                                            8
1HFY2019 RESULTS         PERFORMANCE OVERVIEW

Network update
Resolution of UT5 remains a work in progress

 › Engagement continues with all stakeholders

 › QCA issued UT5FD1 on 6 December 2018

 › Compared to UT5DD:

      › MAR increased ~$230m to $4.123bn over four years

      › WACC increased from 5.41% to 5.70%

      › All deferred WIRP capital now included in RAB – estimated RAB rollover value $5.7bn2

 › Submission of a conforming undertaking due 18 February 2019

 1.   Further detail in slide 73
 2.   As at 1 July 2018 and includes all deferred capital but excludes $0.4bn of AFDs          9
1HFY2019 RESULTS   FINANCIAL PERFORMANCE

Operational efficiency improvements
Work continues with targeted investments in technology, focussing on precision
operations, reducing footprint and support costs

                                                                    RESTRUCTURE
                              PRECISION
                                                                      SUPPORT
                             RAILROADING
                                                                       AREAS

         › Focus on improving schedules and         › On track to hit $20m in cost reduction
           yard dwell                                 by FY2021
         › Targeted to deliver $50m in
           benefits by FY2021

                                EUROPEAN
                                   TRAIN                               CONDITION
                                 CONTROL                              MONITORING
                                  SYSTEM

           › Trial of technology expected in        › Expansion of Condition Monitoring
             2019                                     into Hunter Valley - installation
                                                      expected in 2019

                                                                                               10
1HFY2019 RESULTS PERFORMANCE OVERVIEW
Enterprise Agreement update
Two EAs completed and two EAs approved in employee ballots - bargaining
continuing on remaining EAs for Queensland employees
WHAT DOES SUCCESS LOOK LIKE
EAs that enable each
Flexible, simple and
business unit to achieve its
responsive EAs
objectives
$ Wage and conditions
better aligned to the
Enhanced ability to match
labour to demand
market
› Objective of bargaining is to secure wages and › Two enterprise agreements have been finalised
conditions aligned to the market and two others approved in employee ballots1
› Aurizon is not seeking fundamental changes to › Three Queensland EAs continue to be bargained
conditions – incremental productivity uplift for – Bulk, Coal and Infrastructure
› Employees receive fair wages outcome › Infrastructure EA ballot February 2019
› Protected industrial action impacts are managed
across the business
1. See slide 30 for additional detail
111HFY2019 RESULTS PERFORMANCE OVERVIEW
Intermodal update
Queensland Intermodal (QIM) transferred to Linfox January 2019, sale of Acacia
Ridge remains subject to court proceedings
INTERMODAL › Intermodal Interstate closed in line with plan in December 2017 removing ~$50m of EBIT losses
INTERSTATE
› Transfer of QIM to Linfox completed 31 January 2019
› Linfox acquired all freight forwarding and pick up & delivery assets and rail wagons
QIM
› Aurizon Bulk and Linfox entered into 10 year (5 + 5) commercial take or pay contract for Linehaul
services and some terminal services
› Federal Court ACCC proceedings adjourned until February 2019
ACACIA RIDGE
› Terminal remains under Aurizon ownership and operation until resolution
TERMINAL
› Profitable operation
121HFY2019 RESULTS
1HFY2019 Financial Performance
Pam Bains
CFO & Group Executive Strategy1HFY2019 RESULTS FINANCIAL PERFORMANCE
Key financial highlights1
EBIT result impacted by UT5FD true up in Network and the Cliffs contract cessation in Bulk
› Revenue reflects Aurizon’s decision to
$m 1HFY2019 1HFY2018 Var
account for the UT5FD, including the
acceleration of the total FY2018 true up,
Revenue 1,455 1,565 (7%) in FY2019. Revenue is also impacted by
lower volumes in Bulk with the Cliffs
Operating Costs (783) (821) 5% cessation
Depreciation & › Operating costs benefited from reduced
(266) (259) (3%)
Amortisation access costs
EBIT – underlying &
statutory
406 485 (16%) › Free cash flow benefited from the
termination payment from Cliffs
Operating Ratio (%) 72.1% 69.0% (3.1ppt)
› Dividend based on 100% payout ratio of
NPAT – underlying & underlying continuing NPAT
227 282 (19%)
statutory
EPS (cps) – underlying &
11.4 13.9 (18%)
statutory
ROIC (%) 10.0% 9.6% 0.4ppt
Interim dividend per share 11.4 14.0 (19%)
Free Cash Flow 371 345 8%
1. Continuing operations 141HFY2019 RESULTS FINANCIAL PERFORMANCE
Coal
Earnings in line with expectations, with increased maintenance and ramp up in growth
activities
$m 1HFY2019 1HFY2018 Variance Revenue
Above rail 617 603 2% › Volumes – down 1%, NSW & SEQ flat with CQCN
down 2%, impacted by PIA and weather events
Track access 271 320 (15%)
› Revenue quality improvement includes CPI
Other - 4 nm escalation and lower contract utilisation
Revenue 888 927 (4%) › Other revenue represents internal services
transferred to Bulk
Access costs (268) (322) 17%
Costs
Operating costs (315) (292) (8%)
› Higher costs impacted by maintenance $13m,
Depreciation (95) (90) (6%) costs supporting growth $5m and depreciation,
EBIT 210 223 (5%) partly offset by lower redundancy and other one
off costs
Tonnes (m) 106.5 107.8 (1%)
NTKs (bn) 25.1 25.8 (3%)
COAL EBIT PERFORMANCE
4
223
14
7 11
5 210
1HFY2018 Volume Revenue Quality1 Other Revenue Operating Costs2 Depreciation 1HFY2019
1. Revenue quality is net of fuel price and access
2. Operating costs are net of Below Rail Costs 151HFY2019 RESULTS FINANCIAL PERFORMANCE
Bulk
EBIT impacted by cessation of Cliffs contract. Mt Gibson haul ceased January 2019 ~$5m
EBIT impact 2H
Net impact Cliffs cessation – reflects the impact of the
$m 1HFY2019 1HFY2018 Variance
cessation of Cliffs in June 2018, larger impact 2H
Revenue 260 308 (16%) Revenue
Access costs (63) (80) 21% › Excluding impact of Cliffs, NTKs higher due to
increased iron ore and new growth volumes partly
Operating costs (165) (190) 13% offset by lower grain volumes
Costs
Impairment costs (9) (5) (80%)
› Operating costs benefited from ongoing operational
Depreciation (9) (13) 31% efficiency and prior period redundancy costs, partly
offset by labour and consumable escalation
EBIT 14 20 (30%)
› Impairments increased due to additional write off of
Tonnes (m) 23.6 28.5 (17%) capital in Bulk East
NTKs (bn) 4.8 7.0 (31%)
20
BULK EBIT PERFORMANCE
1
3 4 14
13
7
1HFY2018 Net impact Volume Revenue Quality 1 Operating Costs Impairments 1HFY2019
Cliffs cessation
1. Revenue quality is net of fuel price and access 161HFY2019 RESULTS FINANCIAL PERFORMANCE
Network
EBIT performance reflects the UT5FD, including $30m impact of true up from FY2018 with a
further $30m to be recognised 2HFY2019. RAB rollover estimated value $5.7bn1
Revenue
$m 1HFY2019 1HFY2018 Variance
› $30m recognised in 1H in relation to FY2018
Track Access 534 577 (7%) UT5FD true up, balance to be recognised in 2H
Services & Other 23 31 (26%) › FY2016 and FY2017 revenue cap adjustment
$33m
Revenue 557 608 (8%)
› Other revenue includes the Caledon bank
Energy & Fuel (52) (76) 32% guarantee from prior year and GAPE revenue
Other Operating Costs (144) (132) (9%) adjustments
Costs
Depreciation (158) (151) (5%)
› Costs unfavourable due to increased
EBIT 203 249 (18%) consumables (including maintenance), labour
costs and depreciation, offset in part by lower
Tonnes (m) 116.5 116.6 -
energy connection costs
NTKs (bn) 28.8 29.0 (1%)
249 NETWORK EBIT PERFORMANCE
30
15
33 3 203
24 7
1HFY2018 FY2018 UT5 UT5FD MAR FY17 & FY16 Other Revenue Operating Costs3 Depreciation 1HFY2019
True Up2 Reduction2 Revenue Cap
1. Based on the UT5FD, including all deferred capital but excluding AFDs of $0.4bn
2. Excludes GAPE 3. Costs are net of EC Revenue 171HFY2019 RESULTS FINANCIAL PERFORMANCE
Intermodal
Following the transfer of Queensland Intermodal, Acacia Ridge terminal is the main asset
that now remains in the discontinued segment
› Improved EBIT position with the closure of
$m 1HFY2019 1HFY2018 Variance
Intermodal Interstate in December 2017 which
generated significant losses
Revenue 88 140 (37%)
› Transfer of Queensland Intermodal completed
31 January 2019
Operating Costs (82) (161) 49%
› $7m consideration
Depreciation - (3) - › ~$30m loss on sale with majority recorded in
1HFY2019
EBIT 6 (24) nm › Acacia Ridge Terminal remains in discontinued
segment
Significant items (10) (77) 87% › EBIT positive in 1HFY2019
› Current book value of $37m – sale would
Income tax benefit 1 30 (97%) result in significant gain on sale
NLAT (3) (71) 96%
Free Cashflow (21) 24 nm
TEUs (‘000s) 79 187 (58%)
181HFY2019 RESULTS FINANCIAL PERFORMANCE
Capital expenditure
FY2019 capital expenditure mix change with Network decrease offset by increase in Coal to
support fleet reliability and growth
CAPITAL EXPENDITURE1 FY2016 – FY2019 ($M)
› Capital expenditure guidance for
FY2019 remains $480m – $520m
703
› Growth capital in 1HFY2019 includes
new rollingstock to support growth
tonnes across the Hunter Valley
532
~257-297 ~480-520 › Purchase of rail grinder and
490
associated assets to support ARTC
contract renewal $21m in 1HFY2019
587 (~$5m 2HFY2019)
› Non growth capital in 2HFY2019
465 forecast to increase as a result of:
443
223
› Rollingstock overhauls due
201
› Facility projects
116 › FY2020 expectation for non growth
67 47 capital ~$500m
22
FY2016 FY2017 FY2018 1HFY2019 2HFY2019(f) FY2019(f)
Non Growth Growth
1. Total Group capital expenditure net of lease incentive payments and externally funded projects and includes capitalised interest 191HFY2019 RESULTS FINANCIAL PERFORMANCE
Cashflow and shareholder returns
FCF benefited from termination payment from Cliffs. Dividends continue to be paid at 100%
of underlying NPAT
FREE CASH FLOW ($M) SHAREHOLDER RETURNS ($M)
+8% 406
387
371 356
345
76
273 279 223
261
280
63 183
-3
1H15 1H16 1H17 1H18 1H19 1H17 2H17 1H18 2H18 1H19
Total Group Continuing operations Buy Back Dividends
› 1HFY2019 FCF benefited from the receipt of the › Interim dividend 11.4cps declared at 100%
termination payment from Cliffs payout of NPAT
› Network cashflow based on Transitional Tariffs – › 100% payout ratio maintained since
FCF will be impacted in FY2020 through true up 2HFY2015
payment to customers
201HFY2019 RESULTS FINANCIAL PERFORMANCE
Funding update
Work is underway to determine the optimal legal and capital structure for the Group
KEY DEBT METRICS 1HFY2019 1HFY2018
LEGAL & CAPITAL STRUCTURE REVIEW
› Current legal structure is a legacy of the IPO and limits Weighted average
4.8 5.1
flexibility maturity1
Group interest cost on
4.5% 4.5%
drawn debt
RATING AGENCY METRICS
Group Gearing2 42.4% 41.2%
› Moody’s FFO/Debt Network threshold lowered to 13% in
August 2018 Network Gearing3 56.4% 56.7%
(incl AFDs4)
› UT5FD supports Moody’s Baa1 and S&P BBB+ credit
Credit Rating (S&P/Moody’s) BBB+/Baa1 BBB+/Baa1
metrics for Network
› Group metrics – limited headroom in FY2019, however MATURITY PROFILE ($M)
significant buffer exists from FY2020 with higher 875
earnings 778
711
425
1HFY2019 FUNDING ACTIVITY 525 490 500
› Aurizon Finance cancelled existing bank debt syndicated 200
facilities and replaced with bilateral facilities totalling
$450m, with maturity extended to November 2023 450
300
› Group debt is ~90% fixed in line with UT5 regulatory
period FY20 FY21 FY22 FY23 FY24 FY25 FY26
Network - Drawn Bank Debt Network - EMTN
1. Calculated on drawn debt, excluding working capital facility
2. Group Gearing – net debt/net debt plus equity
Network - Undrawn Bank Debt Corporate - Drawn Bank Debt
3. Network Gearing - net debt/RAB Network - AMTN Corporate - Undrawn Bank Debt
4. Access Facilitation Deed 211HFY2019 RESULTS
Outlook & Key Takeaways
Andrew Harding
Managing Director & CEO1HFY2019 RESULTS OUTLOOK & KEY TAKEAWAYS
FY2019 outlook
Non-Network EBIT guidance confirmed at $390m - $430m
EBIT $m 1HFY2019 RESULT GUIDANCE
Non-Network 217 390 - 430
Network 203 n/a
Group (ex redundancy) 420 n/a
Redundancy costs (14) n/a
Group 406 n/a
KEY ASSUMPTIONS
› Coal – 2H volumes higher with growth from new contracts, partly offset by increased maintenance and operating costs.
Volume guidance remains 215 – 225mt for FY2019
› Bulk – 2H EBIT impacted by cessation of Mt Gibson from January 2019, incremental impact from Cliffs and current
weather conditions in North Queensland
› Continued delivery of operational efficiency improvements
› No major weather impacts
231HFY2019 RESULTS OUTLOOK & KEY TAKEAWAYS
Key takeaways
Continue to deliver on promises, focus remains on executing against the strategic framework
to position Aurizon for long term earnings growth
Focus on shareholder returns – maintained payout ratio at 100% of underlying NPAT
UT5 – Engagement continues with all stakeholders
Operational efficiency to underpin long term value creation through continuous
improvement in asset and labour efficiencies
Strategy in
Strategy EAs – two completed andAction
two approved in employee ballots, with results in line with
expectation - bargaining continues for remaining Queensland agreements
in Action
Bulk – turnaround progressing well, with growth now the focus. Expect EBIT growth over
the medium term through operational improvements and volume growth
Coal - Result in line with expectations. Investment in fleet for volume growth, securing the
contract book and ongoing operational improvements to grow EBIT from FY2020 onwards
Intermodal – stemmed the losses with the closure of Interstate and sale of Queensland Intermodal
24Contact and Further Information Chris Vagg Kath Clapham Head of Investor Relations & Manager Investor Relations Group Treasurer +61 7 3019 9044 +61 7 3019 9030
1HFY2019 RESULTS

         Additional Information

         Group Information
         Coal
         Bulk
         Network
         Capital Expenditure
1HFY2019 RESULTS ADDITIONAL INFORMATION
Aurizon’s rail haulage operations
KEY OPERATIONAL
STATISTICS
COMMODITIES
Coal, iron ore and bulk freight
ROLLINGSTOCK
500+ active locomotives
OPERATIONAL FOOTPRINT
More than 160 operational sites
PEOPLE
More than 4,500 operational full-time employees
WAGONS
13,000+ active wagons
271HFY2019 RESULTS ADDITIONAL INFORMATION
Aurizon’s vision, purpose and values
Focussed on customers and recognises its important role in both regional Australia and
global supply chains
VISION PURPOSE
Achievement of
vision represents:
The first Growing
choice for regional • #1 in the market
bulk Australia by • Strongest renewals
and new business
commodity delivering bulk growth
transport commodities • Increasing
solutions to the world Australian share of
seaborne coal and
other bulk trade
VALUES
SAFETY PEOPLE INTEGRITY CUSTOMER EXCELLENCE
281HFY2019 RESULTS ADDITIONAL INFORMATION
Strategic levers required to fulfil Aurizon’s vision
Execution against the three strategic levers is aimed at driving differentiation, competitive
advantage and sustainable performance
STRATEGIC
LEVERS
Delivering a cost effective Labour and asset Improving the
and customer aligned model productivity through competitiveness of supply
technology chains we operate
Moving decisions closer to
our operations and Regulatory reform Leveraging expertise to
customers adjacent assets and
Developing a safety and activities
Delivering a portfolio of performance culture that
EXCEL
value adding businesses is agile and innovative Bulk commodity supply
chain manager of choice
Allocating capital rigorously
and efficiently
Achieve regulatory Position Aurizon for
Accelerate cost reform, secure contract
OUTCOME growth, value creation and
competitiveness of Aurizon wins and gain competitive the next phase of
advantage through asset Enterprise evolution
efficiency
291HFY2019 RESULTS ADDITIONAL INFORMATION
Enterprise Agreements
# OF EMPLOYEES
ENTERPRISE AGREEMENT STATUS & DURATION WAGE OUTCOMES
COVERED (approx.)
1.0% pa increasing to
WA Rollingstock Maintenance 100 Complete – 4 year term 1.75% pa over life of
agreement
2.1% pa increasing to
Queensland Staff 900 Complete – 4 year term 2.25% pa over life of
agreement
Approved by employee
2.5% pa over life of
NSW Coal 300 ballot, awaiting FWC1 sign
agreement
off – 3 year term
Approved by employee 1.5% pa increasing to
WA Rail Operations 400 ballot, awaiting FWC sign 2.25% pa over life of
off – 4 year term agreement
Queensland Infrastructure 550 Bargaining ongoing
Targeting wage outcomes
Queensland Coal 1,300 Bargaining ongoing
in line with market
Queensland Bulk 400 Bargaining ongoing
1. FWC – Fair Work Commission 301HFY2019 RESULTS ADDITIONAL INFORMATION
Capital allocation framework
Operating Sustaining Dividends Surplus capital
Cash flow & (payout range returns
70-100%) (e.g. Buy-backs)
& Transformation
Net borrowings Capital
Growth capital
(at ~40% targeted (only where it
gearing) maximises
shareholder value)
311HFY2019 RESULTS
Additional Information
Group1HFY2019 RESULTS ADDITIONAL INFORMATION
Financial highlights1 (underlying)
$m 1HFY2019 1HFY2018 Variance 2HFY2018
Revenue 1,455 1,565 (7%) 1,547
Operating costs (784) (821) 5% (826)
EBITDA 672 744 (10%) 722
EBIT 406 485 (16%) 455
NPAT 227 282 (19%) 261
EPS (cps) 11.4 13.9 (18%) 13.1
Interim dividend (cps) 11.4 14.0 (19%) 13.1
ROIC 10.0% 9.6% 0.4ppt 10.9%
Gearing 42.4% 41.2% (1.2ppt) 42.3%
1. Continuing Operations
331HFY2019 RESULTS ADDITIONAL INFORMATION
EBIT by business unit (underlying)
$m 1HFY2019 1HFY2018 Variance 2HFY2018
Coal 210 223 (5%) 206
Bulk 14 20 (29%) 30
Network 203 249 (18%) 232
Other (21) (6) (269%) (13)
EBIT1 406 485 (16%) 455
1. Continuing Operations
341HFY2019 RESULTS ADDITIONAL INFORMATION Group operating highlights1 $m 1HFY2019 1HFY2018 Variance 2HFY2018 Above Rail2 Revenue / NTK ($/’000 NTK) 38.4 37.6 2% 38.6 Labour Costs3 / Revenue 25.5% 23.8% (1.7ppt) 24.9% NTK / FTE (MNTK) 13.2 13.4 (1%) 12.8 EBITDA Margin – Underlying 46.2% 47.5% (1.3ppt) 46.6% Operating Ratio – Underlying 72.1% 69.0% (3.1ppt) 70.6% NTK (bn) 29.9 32.8 (9%) 31.0 Above Rail Tonnes (m) 130.1 136.3 (5%) 130.8 People (FTE) 4,560 4,897 7% 4,835 1. Continuing operations 2. Above Rail includes Coal & Bulk 3. Excludes redundancy costs 35
1HFY2019 RESULTS   ADDITIONAL INFORMATION

Other profit and loss (underlying)

  $m                                        1HFY2019   1HFY2018   Variance   2HFY2018

 Revenue                                       41         41         -          50

  Operating costs                             (58)       (42)      (37%)       (58)

  EBITDA                                      (17)       (1)        nm         (8)

  Depreciation and amortisation               (4)        (5)       (20%)       (5)

  EBIT                                        (21)       (6)      (250%)       (13)

                                                                                        36
1HFY2019 RESULTS ADDITIONAL INFORMATION
Quarterly above rail tonnes – December quarter 2018
Quarter
Dec-17 Year Financial Variance
Quarter Ending
vs. to date
Dec-18
Dec-17 Mar-18 Jun-18 Sept-18 Dec-18 % Dec-18 Dec-17 %
Coal volumes (mt)
CQCN 38.1 35.8 38.9 38.0 38.4 1% 76.4 77.8 (2%)
NSW & SEQ 14.8 14.1 15.8 14.2 15.9 7% 30.1 30.0 -
Total 52.9 49.9 54.7 52.2 54.3 3% 106.5 107.8 (1%)
Coal NTK (bn)
CQCN 9.7 8.9 9.7 9.7 9.5 (2%) 19.2 19.7 (3%)
NSW & SEQ 3.0 2.9 3.1 2.7 3.2 7% 5.9 6.1 (3%)
Total 12.7 11.8 12.8 12.4 12.7 - 25.1 25.8 (3%)
Bulk volumes (mt) 14.3 12.9 13.3 11.5 12.1 (15%) 23.6 28.5 (17%)
Bulk NTK (bn) 3.5 3.0 3.4 2.3 2.5 (29%) 4.8 7.0 (31%)
Total Above Rail Volumes (mt) 67.2 62.8 68.0 63.7 66.4 (1%) 130.1 136.3 (5%)
Intermodal (TEU '000s) 81.4 38.4 40.3 41.2 37.9 (53%) 79.1 187.3 (58%)
371HFY2019 RESULTS ADDITIONAL INFORMATION
Balance sheet summary
$m 31 December 2018 30 June 2018
Assets classified as held for sale1 60.6 108.0
Other current assets 586.0 698.2
Property, plant & equipment 8,621.2 8,659.9
Other non-current assets 363.0 315.7
Total assets 9,630.8 9,781.8
Liabilities classified as held for sale (4.9) (12.7)
Other current liabilities (639.9) (735.6)
Total borrowings (3,461.9) (3,501.9)
Other non-current liabilities (836.2) (801.5)
Total liabilities (4,942.9) (5,051.7)
Net assets 4,687.9 4,730.1
Gearing - net debt / (net debt + equity) 42.4% 42.3%
1. $59.8m represents the assets related to discontinued operations at 31 December 2018
381HFY2019 RESULTS ADDITIONAL INFORMATION
Reconciliation of borrowings
$m Commentary
Total debt including working capital facility 3,293.8 › Non-current debt on a Cash basis
Reconciliation to Financial Statements
Add/(less):
› Transaction costs directly attributable to borrowings are
Capitalised transaction costs (10.6) capitalised to the balance sheet and amortised to the income
statement in accordance with AASB 9, e.g. refinancing costs
› Discounts on mid-term-notes capitalised to the balance
Discounts on bonds (11.7) sheet and unwound to the income statement in accordance
with AASB 9
› Fair value hedge MTM adjustment on bonds in accordance
MTM adjustment on bonds 190.4
with AASB 9
Total adjustments 168.1
Total borrowings per financial report 3,461.9 › Current and non-current borrowings
391HFY2019 RESULTS ADDITIONAL INFORMATION
Significant items
This table represents items classified as significant and excluded from underlying earnings
$m 1HFY2019 1HFY2018 Variance 2HFY2018
Continuing operations - - - 25
Bulk Contract Exit – termination payment - - - 66
Bulk Contract Exit – costs - - - (32)
Asset Impairment - Bulk - - - (32)
Redundancy - - - 23
Discontinued operations - Intermodal (10) (77) 87% 2
401HFY2019 RESULTS ADDITIONAL INFORMATION
Material items to note
› Table represents items that are included
$m 1HFY2019 1HFY2018 Variance in Underlying EBIT for the continuing
operations
Redundancy expense (14) (15) 1
› This table is designed to assist investors
to ‘normalise’ underlying earnings
Long term and short term
(22) (12) (10)
incentives › The movement in the land rehabilitation
and employee provisions are half year-
end non-cash adjustments and are
Employee Costs (36) (27) (9)
impacted by the movement in discount
rates
Land rehabilitation (1) (1) -
Employee Provisions - - -
Non Cash Provisions (1) (1) -
Bulk Capex write off (9) (5) (4)
Total net impact (46) (33) (13)
411HFY2019 RESULTS ADDITIONAL INFORMATION
Redundancy cost breakdown
Redundancy › Redundancy costs since IPO have been included in
Redundancy costs underlying EBIT as well as classified as a significant
Year costs/(benefits)
included in underlying item
classified as
EBIT ($m)
Significant items ($m)
› Aurizon classifies redundancy costs as significant in
FY2011 2 63 the notes to the financial statements, 4E, 4D and
investor presentations when the amounts are
considered material
FY2012 15 -
› Redundancy costs are presented for total Group
FY2013 - 96 (Continuing and Discontinued operations)
FY2014 - 69
FY2015 36 -
FY2016 24 -
FY2017 5 116
FY2018 17 (10)
1HFY2019 14 (1)
421HFY2019 RESULTS ADDITIONAL INFORMATION
Dividend history
Amount per share
Payment Date Franking Payout Ratio
(cents)
FY2019 Final
FY2019 Interim 25 March 2019 11.4 70% 100%1
FY2019 Total Dividend
FY2018 Final 24 September 2018 13.1 60% 100%1
FY2018 Interim 26 March 2018 14.0 50% 100%1
FY2018 Total Dividend 27.1
FY2017 Final 25 September 2017 8.9 50% 100%
FY2017 Interim 27 March 2017 13.6 70% 100%
FY2017 Total dividend 22.5
FY2016 Final 26 September 2016 13.3 70% 100%
FY2016 Interim 29 March 2016 11.3 70% 100%
FY2016 Total dividend 24.6
FY2015 Final 28 September 2015 13.9 30% 100%
FY2015 Interim 23 March 2015 10.1 0% 70%
FY2015 Total dividend 24.0
FY2014 Final 22 September 2014 8.5 0% 70%
FY2014 Interim 28 March 2014 8.0 80% 65%
FY2014 Total dividend 16.5
The relevant interim dividend dates are:
› Ex-dividend date 25 February 2019
› Record date 26 February 2019
1. Payout ratio on underlying NPAT for continuing operations 431HFY2019 RESULTS
Additional Information
Coal1HFY2019 RESULTS ADDITIONAL INFORMATION
Coal snapshot
As at 31 December 2018
107 329 236km
average haul
million tonnes active locos
length
76 8618 22.6km/hr
average services
active wagons velocity
per day
TONNES HAULAGE BREAKDOWN
Thermal Coal
CQCN
28% Metallurgical Coal
NSW/SEQ
47%
53%
72%
451HFY2019 RESULTS ADDITIONAL INFORMATION
Coal operations - CQCN
461HFY2019 RESULTS ADDITIONAL INFORMATION
Coal operations – NSW & South East Queensland (SEQ)
471HFY2019 RESULTS ADDITIONAL INFORMATION
Coal strategic levers
Priorities are focussed on the Optimise and Excel levers to improve cost competitiveness,
asset utilisation and delivery performance
Asset Precision Customer Existing Supply chain
Portfolio Cost Asset utilisation Adjacencies
Utilisation operations engagement customers management
1 Improve integrated planning 1 Labour productivity through 1 Industry leading operating
and scheduling technology investments discipline
2 Progress fleet reliability 2 Enable further maintenance 2 Target ROIC accretive growth
program improvements through
predictive technology
enhancements
3 Improve asset productivity
and service delivery
3 Uplift leadership capability
481HFY2019 RESULTS ADDITIONAL INFORMATION
Coal profit and loss (underlying)
$m 1HFY2019 1HFY2018 Variance 2HFY2018
Tonnes (m) 106.5 107.8 (1%) 104.6
Above Rail 617 603 2% 604
Track Access 271 320 (15%) 279
Other - 4 nm 3
Total Revenue 888 927 (4%) 886
Operating Costs (583) (614) 5% (588)
EBITDA 305 313 (3%) 298
Depreciation and amortisation (95) (90) (5%) (92)
EBIT 210 223 (5%) 206
491HFY2019 RESULTS ADDITIONAL INFORMATION
Coal financial and operating metrics
1HFY2019 1HFY2018 Variance 2HFY2018
Tonnes (m) 106.5 107.8 (1%) 104.6
NTKs (bn) 25.1 25.8 (3%) 24.6
Operating Ratio 76.3% 76.0% (0.3ppt) 76.7%
Above Rail Revenue /NTK ($/’000 NTK) 24.6 23.4 5% 24.6
Opex (excl access)/NTK ($/’000 NTK) 16.3 14.8 (10%) 16.0
Locomotive Productivity (000’s NTK / Active
420.8 482.9 (13%) 446.5
loco days)
Wagon Productivity (000’s NTK / Active wagon
15.9 16.7 (5%) 16.0
days)
Payload (tonnes) 7,419 7,460 (1%) 7,452
Velocity (km/hr) 22.6 23.3 (3%) 23.2
Fuel Consumption (l/d GTK) 2.93 2.91 (1%) 2.91
Contract Utilisation 89% 95% (6.0 ppt) 91%
501HFY2019 RESULTS ADDITIONAL INFORMATION
Coal haulage tonnes (mt) by system
1HFY2019 1HFY2018 Variance 2HFY2018
CQCN
Newlands 9.9 9.8 1% 10.6
Goonyella 30.4 31.8 (4%) 30.6
Blackwater 29.1 30.4 (4%) 28.1
Moura 7.0 5.8 21% 5.4
Total CQCN 76.4 77.8 (2%) 74.7
NSW & SEQ
West Moreton 3.8 3.9 (3%) 3.7
Hunter Valley 26.3 26.1 1% 26.2
Total NSW & SEQ 30.1 30.0 - 29.9
Total Coal 106.5 107.8 (1%) 104.6
511HFY2019 RESULTS ADDITIONAL INFORMATION
Coal contract portfolio
AURIZON COAL CONTRACT VOLUME EXPIRY BY YEAR (MTPA – AS AT 30 JUNE 2018)
60
45
Million tonnes per annum
30
15
0
FY19 FY20 FY21 FY22 FY23 FY24 FY25 FY26 FY27 FY28 FY29 FY30
Notes:
› This represents the contracted tonnes as at 30 June 2018. Announced contract tonnages may not necessarily align with current contract tonnages.
› Incorporates contract extension options where applicable
› Includes immaterial variations to volume/term not announced to market 521HFY2019 RESULTS ADDITIONAL INFORMATION
Coal contract portfolio
ANNUALISED FORECAST COAL CONTRACTED
COAL CONTRACT PORTFOLIO EXPIRY PROFILE
VOLUMES (MTPA)1
(AS AT 30 JUNE 2018)
252
244
229
0 - 3 years
69 73
18% 63
15% >3 - 7 years
68% 166 175 179
>7 years
FY2018a FY2019f FY2020f
NSW & SEQ CQCN
1. This represents the contracted tonnes as at 31 December 2018 and includes nominations, options and other uncertain events that have the potential to cause variance in AZJ contracted tonnes 531HFY2019 RESULTS ADDITIONAL INFORMATION
Australian export coal demand
The fundamentals of metallurgical and thermal coal remain strong, driven by steel and energy
demand growth in Asia, supporting growth in Australian exports of ~2% pa over the next decade
INDIA: CRUDE STEEL PRODUCTION (MT)1 +41%
Metallurgical Coal
› Steel production drives demand
› India achieved another record result in 2018 with
production of 106 million tonnes and was the largest
150 export market for Australian metallurgical coal in FY20183
106
77 81 81 89 95 101 › India coking coal import reliance was 89% for FY184
63 69 73
› Investment in infrastructure and manufacturing in India will
2009 2010 2011 2012 2013 2014 2015 2016 2017 2018 2023f
continue to drive demand for steel and therefore
metallurgical coal
SOUTHEAST ASIA: ELECTRICITY GENERATION (TWh)2
2,500
2,218
Thermal Coal
2,000 1,906
1,617 › Energy generation drives demand
1,500 1,341
› Over 95% of Australian thermal coal exports are destined
1,000 867 for Asia3. It is this region that continues to add energy
generation capacity.
+192%
500 370
› The International Energy Agency estimates
0 Southeast Asia coal-fired electricity generation to increase
2000 2015 2025 2030 2035 2040 by 192% between 2015 to 2040. 16GW of coal-fired
Nuclear Oil Non-Hydro Renewables Hydro Gas Coal
capacity currently under construction in the region5.
Sources: › It is recognised that renewable energy will increase in the
1. India Crude Steel Production (historical) - World Steel Association, India Crude Steel Production (2023 projection) – Office of the Chief
Economist, Resources & Energy Quarterly (March 2018) energy mix over the long term however, thermal coal is
2. Southeast Asia Electricity Generation - International Energy Agency (World Energy Outlook 2018, New Policies Scenario)
3. Australian Bureau of Statistics expected to grow in absolute terms, in key export nations
4. India Ministry of Coal, Provisional Coal Statistics (2017-18). Note: Financial year is April to March. Only washed coal (not raw) is
included in the import reliance calculation
such as Australia
5. Platts UDI Electric Power Plants Database (September 2018)
541HFY2019 RESULTS ADDITIONAL INFORMATION
Australia FY2018 coal supply summary
Coal Production Domestic Consumption Export All Coal Export (By Destination) All Coal Export (By Port)
118mt 157mt
448mt 66mt 382mt 89mt 120mt
31% 48mt 47mt 48mt 41% 67mt
23% 32mt 31%
State Split State Split State Split 28mt 7mt
13% 12% 13% 17% 5mt
8% 2% 1%
7%
7mt 7mt Japan China India South Taiwan Rest of Newcastle Hay Gladstone Abbot Brisbane Port
Korea World Point Point Kembla
25mt 160mt
194mt
246mt 222mt
33mt Metallurgical Coal Export (By Destination) Thermal Coal Export (By Destination)
44mt 81mt
40mt
37mt
QLD Other QLD Other QLD NSW
30mt
49mt
NSW NSW
25% 18mt 40%
22% 21% 29mt
17% 23mt
Coal Type Coal Type Coal Type 9mt 24% 18mt
10% 14%
5% 11% 4mt 9%
3mt 2%
(5%) India China Japan South Taiwan Rest of Japan China South Taiwan India Rest of
Korea World Korea World
179mt
41% 203mt
(47%)
(53%)
59%
60mt
(95%)
Direct Aust. Electricity Export Revenue QLD Royalties NSW Royalties
Employment Generation Share
Metallurgical Metallurgical Metallurgical
Thermal Thermal Thermal 48k 46% $54b $3.7b $1.7b
Sources/Notes:
Coal Production: Volume (saleable coal), state split and coal type sourced from Office of Chief Economist (OCE) Resources and Energy Quarterly December 2018. 'Other' adjusted (and volume reallocated to QLD) to align with state government
reporting. Domestic Consumption: Volume calculated using production (OCE) less exports (OCE). Export Volume and coal type sourced from OCE. Export state split percentage sourced from port/terminal reporting and applied to OCE volume.
All Coal Export (By Destination): Includes anthracite volume, sourced from Australian Bureau of Statistics (ABS) Customised Report. All Coal Export (By Port): Sourced from respective port/terminal reporting. Metallurgical/Thermal Export
(By Destination): Sourced from ABS, Customised Report. Employment: Includes direct employment (only), sourced from ABS Labour Force (Detailed) November 2018. Australian Electricity Generation Share: Data for FY17 (GWh, black coal only),
sourced from Department of the Environment & Energy, Australian Energy Update 2018. Export Revenue: Sourced from ABS, Customised Report. QLD Royalties: Sourced from QLD Treasury Mid-Year Fiscal & Economic Review 2018-19. NSW
Royalties: Sourced from NSW Department of Planning & Environment.
551HFY2019 RESULTS ADDITIONAL INFORMATION
Coal market | Australia
AUSTRALIA: METALLURGICAL COAL EXPORT AUSTRALIA: THERMAL COAL EXPORT
250 $300 250 $150
Hard Coking Coal Price (USD/t)
Thermal Coal Price (USD/t)
200 200
million tonnes
million tonnes
$200 $100
150 150
100 100
$100 $50
50 50 103 108
91 90
0 $0 0 $0
FY11 FY12 FY13 FY14 FY15 FY16 FY17 FY18 FY19 FY11 FY12 FY13 FY14 FY15 FY16 FY17 FY18 FY19
2H Export Volume [LHS] Hard Coking Coal (Average Spot Price) [RHS] FY H2 Export Volume [LHS] Thermal Coal (Average Spot Price) [RHS]
1H Export Volume [LHS] FY H1 Export Volume [LHS]
AUSTRALIA: METALLURGICAL COAL EXPORT (1H FY2019) AUSTRALIA: THERMAL COAL EXPORT (1H FY2019)
23mt 43mt
21mt
17mt
15mt
23mt
9mt 18mt
5mt 11mt 10mt
3mt
India China Japan South Taiwan Rest of Japan China South Taiwan India Rest of
Korea World Korea World
Sources/Notes: Export Volume (and country split) - Australian Bureau of Statistics, Customised Report. Hard Coking Coal Price – Platts (Peak Downs Region product). Thermal Coal Price - Intercontinental Exchange (Newcastle 6,300
Gross As Received product). 561HFY2019 RESULTS ADDITIONAL INFORMATION
Coal price | Coal capital and exploration expenditure
HARD COKING COAL SPOT PRICE (US$/t FOB) THERMAL COAL SPOT PRICE (US$/t FOB)
$300 $150
$250 $223
$103
$200 $100
$150
$100 $50
$50
$0 $0
Jun- Dec- Jun- Dec- Jun- Dec- Jun- Dec- Jun- Dec- Jun- Dec- Jun- Dec- Jun- Dec-
15 15 16 16 17 17 18 18 15 15 16 16 17 17 18 18
Hard Coking Coal (Average Qtr Spot Price) Thermal Coal (Average Qtr Spot Price)
COAL CAPITAL EXPENDITURE (AUD) COAL EXPLORATION EXPENDITURE (AUD)
+26%
A$1.5b A$75m
+24%
A$1.0b A$50m
A$0.5b A$25m
A$0.0b A$0m
Sep- Mar- Sep- Mar- Sep- Mar- Sep- Sep- Mar- Sep- Mar- Sep- Mar- Sep-
15 16 16 17 17 18 18 15 16 16 17 17 18 18
Sources/Notes: Hard Coking Coal Price – Platts (Peak Downs Region product). Thermal Coal Price - Intercontinental Exchange (Newcastle 6,300 Gross As Received product). Coal Capital & Exploration Expenditure: Australian Bureau of Statistics.
FOB = Free On Board 571HFY2019 RESULTS ADDITIONAL INFORMATION
Coal demand | Metallurgical coal
MAJOR COKING (METALLURGICAL) COAL EXPORT MAJOR COKING (METALLURGICAL) COAL IMPORT
NATIONS: 2017 NATIONS (AND SOURCE): 2017
177mt 79mt
57mt
50mt
7% 13% 7% 36mt
6% 8%
50mt 17%
82% 11%
29mt 26mt 23mt 44% 69% 13mt
53%
26%
43%
Australia United States Canada Mongolia Russia China Japan India South Korea Germany
Rest of World Russia Canada United States Australia
CHINA CRUDE STEEL PRODUCTION INDIA CRUDE STEEL PRODUCTION
+7%
1,000mt 20% 120mt +5% 15%
750mt 10% 100mt 10%
500mt 0% 80mt 5%
250mt -10% 60mt 0%
CY09 CY10 CY11 CY12 CY13 CY14 CY15 CY16 CY17 CY18 CY09 CY10 CY11 CY12 CY13 CY14 CY15 CY16 CY17 CY18
Crude Steel Production [LHS] Change (Pos) RHS Change (Neg) RHS Crude Steel Production [LHS] Change (Pos) RHS
Sources/Notes: Major Coking (Metallurgical) Export/Import Volume (By Nation) - International Energy Agency World Coal Information 2018. Volume includes both seaborne and landborne trade. Top five export nations represents 93% of global
trade. Top five import nations represents 84% of global trade. Steel Production - World Steel Association
581HFY2019 RESULTS ADDITIONAL INFORMATION
Coal demand | Thermal coal
MAJOR STEAM (THERMAL) COAL EXPORT NATIONS: MAJOR STEAM (THERMAL) COAL IMPORT NATIONS
2017 (AND IMPORT SOURCE): 2017
389mt 219mt
161mt 155mt
9%
132mt
202mt 21%
24% 10%
158mt
17% 69mt
58%
83mt 70mt 56% 25%
61% 14%
43%
22% 36%
29%
Indonesia Australia Russia Colombia South Africa China India Japan South Korea Taiwan
Rest of World Russia Australia South Africa Indonesia
AVERAGE AGE OF COAL-FIRED ELECTRICITY CAPACITY ELECTRICITY GENERATION MIX: 2017
Expected Retirement Age
35-45 years 6,594TWh 1,605TWh 1,077TWh 961TWh
100%
31 years
23 years
22 years
14 years
11 years 12 years
67% 74%
33% 37%
China India Japan South Korea Taiwan Australia
China India Japan Southeast Asia
Top Five Global Steam (Thermal) Coal Import Nations (By Volume, In Descending Order)
Other Nuclear Gas Renewables Coal
Sources: Major Steam (Thermal) Export/Import Volume (By Nation) - International Energy Agency World Coal Information 2018. Volume includes both seaborne and landborne trade. Top five export nations represents 84% of global trade. Top five import
nations represents 62% of global trade. Average Age of Coal-Fired Electricity Generation Capacity - Platts UDI Electric Power Plants Database (September 2018). Australia included for comparison purposes. Electricity Generation (Mix) - International
Energy Agency World Energy Outlook 2018. 591HFY2019 RESULTS ADDITIONAL INFORMATION
Australia coal competitiveness
METALLURGICAL COAL CASH COSTS (US$/t, CFR INDIA, 2018) THERMAL COAL CASH COSTS (US$/t, CFR JAPAN, 2018)
$180 $80
$160
$70
$140
$120 $60
US$/t
US$/t
$100 $161 $50 $71
$128 $63 $63 $64
$80 $59
$109
$96 $40
$60 $75
$40 $30
Russia Australia Canada United States Mozambique Colombia Russia Indonesia Australia South Africa
Note: Thermal Cash Costs are energy-adjusted to 6,300kcal/kg (Gross As Received)
METALLURGICAL COAL QUALITY THERMAL COAL QUALITY
100 0% Increasing
Increasing
quality quality Indonesia
Coal Strength (CSR)
Typical Hard Coking
Export 10% Australia Export
80 Volume Ash Content Volume
Australia
Mozambique 20% South Africa
China (Domestic)
60 United States
Canada 30%
40 Russia 40% India (Domestic)
35 30 25 20 15 10 4,000 4,500 5,000 5,500 6,000 6,500
Average Coal Volatile Matter (VM) Energy (kcal/kg, Gross As Received)
Sources/Notes: Cash Costs: Wood Mackenzie Coal Cost Curves (Dec 2018), Wood Mackenzie Global Coal Markets Tool (2018 2H), Sea freight export terminal assumptions: US – East Coast, Canada – West Coast, Australia – Hay Point
(metallurgical) & Newcastle (Thermal), Russia - East. Metallurgical Coal Quality: Wood Mackenzie Global Coal Markets Tool (2018 2H). Thermal Coal Quality: Wood Mackenzie Coal Cost Curves (2018, Dec 2018 data), Wood Mackenzie Coal
Supply Data Tool (Q4 2018), India Ministry of Coal Provisional Coal Statistics 2016-17, IEA Coal Medium-Term Market Report 2016, Indonesia Coal Mining Association, Richards Bay benchmark specifications (Platts)
601HFY2019 RESULTS
Additional Information
Bulk1HFY2019 RESULTS ADDITIONAL INFORMATION
Bulk snapshot
As at 31 December 2018
24 146 61
average services
million tonnes active locos
per day
203km 2498 4.8b
average haul
active wagons NTK1
length
HAULAGE BREAKDOWN
Bauxite/Alumina
28% Iron Ore
45% Other2
27%
1. Net tonnes per kilometre. Payload tonnes x distance payload transported km/1bn
2. Includes limestone, chemicals (caustic and sulphuric acid), fuel and agriculture
621HFY2019 RESULTS ADDITIONAL INFORMATION
Bulk operations – Queensland
631HFY2019 RESULTS ADDITIONAL INFORMATION
Bulk operations – Western Australia
641HFY2019 RESULTS ADDITIONAL INFORMATION
Bulk strategic levers
The plan to optimise the business is in execution. Focus now turns to the Excel and Extend
levers to drive the turnaround plan
Precision Customer Existing Supply chain
Portfolio Cost Service delivery Asset utilisation Adjacencies
operations engagement customers management
1 Cost reduction in delivery 1 Deeper understanding of 1 Identifying strategic
customers and markets partnerships
2 Aligning portfolio as per
Freight Review 2 Driving continuous 2 Preparing for additional
improvement & delivery supply chain services
performance
3 Stabilise service delivery and
increase performance focus 3 Executing prioritised growth
3 Early involvement in supply plans
chain design
651HFY2019 RESULTS ADDITIONAL INFORMATION
Bulk profit and loss (underlying)
$m 1HFY2019 1HFY2018 Variance 2HFY2018
Tonnes (m) 23.6 28.5 (17%) 26.2
Total Revenue 260 308 (16%) 310
Operating costs (237) (275) 14% (268)
EBITDA 23 33 (31%) 42
Depreciation and amortisation (9) (13) 35% (12)
EBIT 14 20 (29%) 30
661HFY2019 RESULTS ADDITIONAL INFORMATION
Bulk financial and operating metrics
$m 1HFY2019 1HFY2018 Variance 2HFY2018
Tonnes (m) 23.6 28.5 (17%) 26.2
NTKs (bn) 4.8 7.0 (31%) 6.4
Operating Ratio 94.5% 93.5% (1.0ppt) 90.3%
Total Revenue / NTK ($000 NTK) 54.1 43.9 23% 48.5
Opex (excl access)/NTK ($/’000 NTK) 38.1 29.6 (29%) 31.1
Fuel Consumption (l/d GTK) 3.25 3.04 (7%) 2.98
Order Fulfilment (%) 98.0% 98.4% (0.4ppt) 97.0%
671HFY2019 RESULTS ADDITIONAL INFORMATION
Australia capital and exploration expenditure
CAPITAL EXPENDITURE: METAL ORE MINING^ EXPLORATION EXPENDITURE: SILVER, LEAD, ZINC
A$4.0b A$40m
+28%
A$30m -6%
A$2.0b A$20m
A$10m
A$0.0b A$0m
Sep- Mar- Sep- Mar- Sep- Mar- Sep- Sep- Mar- Sep- Mar- Sep- Mar- Sep-
15 16 16 17 17 18 18 15 16 16 17 17 18 18
EXPLORATION EXPENDITURE: NICKEL & COBALT EXPLORATION EXPENDITURE: COPPER
A$100m A$100m
+67%
+18%
A$50m A$50m
A$0m A$0m
Sep- Mar- Sep- Mar- Sep- Mar- Sep- Sep- Mar- Sep- Mar- Sep- Mar- Sep-
15 16 16 17 17 18 18 15 16 16 17 17 18 18
Source: Australian Bureau of Statistics , Note: ^Metal Ore Mining includes: Iron ore, Bauxite, Copper, Gold, Mineral Sand, Nickel, Silver, Lead, and Zinc.
681HFY2019 RESULTS
Additional Information
Network1HFY2019 RESULTS ADDITIONAL INFORMATION
Central Queensland Coal Network (CQCN)
CQCN comprises four major coal systems and one connecting system link (GAPE) servicing
Queensland’s Bowen Basin coal region
Townsville LEGEND
PORT OF ABBOT POINT
Abbot Point Coal Terminal (APCT) City/town
Power Station
Bowen
Coal Export Terminal
Rail Systems
Collinsville Goonyella Coal Rail System
Newlands Coal Rail System
Blackwater Coal Rail System
Moura Coal Rail System
Mackay PORT OF HAY POINT
Dalrymple Bay Coal Terminal (DBCT)
Hay Point Coal Terminal (HPCT)
Moranbah Coppabella
Dysart
Blair Athol
Clermont
Stanwell Rockhampton PORT OF GLADSTONE
Emerald Blackwater
Alpha Wiggins Island Coal Export Terminal (WICET)
Bluff R.G. Tanna Coal Terminal
Gladstone
Springsure
Moura
701HFY2019 RESULTS ADDITIONAL INFORMATION
Network snapshot
As at 31 December 2018
117 40+ three
above rail
million tonnes mines serviced
operators
$5.7b five 2670km
Regulated Asset
export terminals railway track
Base1
HAULAGE BREAKDOWN2 1HFY2019
Thermal Coal
32% Metallurgical Coal
68%
1. Estimate at 1 July 2018 - Roll forward value based on UT5FD (excludes $0.4bn in assets operating
under an Access Facilitation Deed (AFD).
2. Estimate – based on AZJ analysis, represents coal hauled on the CQCN by all operators 711HFY2019 RESULTS ADDITIONAL INFORMATION
Network strategic levers
Priorities are focussed on the development of a fit for purpose network that creates value and
facilitates changing the regulatory environment for the benefit of all
Fit for purpose Existing
UT5 solution Capability Customer solutions Regulatory framework Adjacencies New markets
operations customers
1 Supply chain productivity 1 Regulatory reform 1 Opportunistic expansion of
CQCN
2 Network cost efficiencies 2 Tailored asset and capacity
management 2 Supply chain alignment
3 Build system and people 3 Growth outside CQCN
capability
721HFY2019 RESULTS ADDITIONAL INFORMATION
UT5 Final Decision summary
AN1 UT5 AN’S RESPONSE
QCA UT5DD QCA UT5FD
SUBMISSION TO UT5DD
Return on Capital (WACC) 1,592 1,289 1,677 1,381
Depreciation (less inflation) 1,141 899 936 1,034
Maintenance cost 921 817 928 739
Operating cost 855 743 867 795
Tax 328 141 300 170
Total MAR 4,838 3,888 4,708 4,120
Capital Carryover 54 5 49 3
Total adjusted MAR 4,892 3,893 4,757 4,123
WACC (post tax nominal vanilla) 6.78% 5.41% 7.03% 5.70%
Blended Tariff ($/net tonne) 5.36 3.86 4.90 4.23
Note: numbers may not add due to rounding
1. Aurizon Network (AN) 731HFY2019 RESULTS ADDITIONAL INFORMATION
Network profit and loss (underlying)
1HFY2019 1HFY2018 Variance 2HFY2018
$m
Tonnes (m) 116.5 116.6 - 113.0
Access Revenue 534 577 (7%) 590
Services and other 23 31 (24%) 21
Total Revenue 557 608 (8%) 611
Operating costs (196) (208) 5% (222)
EBITDA 361 400 (10%) 389
Depreciation and amortisation (158) (151) (4%) (157)
EBIT 203 249 (18%) 232
741HFY2019 RESULTS ADDITIONAL INFORMATION
Network financial and operating metrics
1HFY2019 1HFY2018 Variance 2HFY2018
Tonnes (m) 116.5 116.6 - 113.0
NTK (bn) 28.8 29.0 (1%) 27.9
Operating Ratio 63.6% 59.1% (4.5ppt) 62.0%
Maintenance/NTK ($/’000 NTK) 2.2 2.0 (10%) 2.4
Opex/NTK ($/’000 NTK) 12.3 12.4 1% 13.6
Cycle Velocity (km/hr) 22.9 23.6 (3%) 23.3
System Availability 81.1% 80.6% 0.5ppt 83.5%
Average Haul Length (km) 248 248 - 247
751HFY2019 RESULTS ADDITIONAL INFORMATION
Network volumes1 (mt)
1HFY2019 1HFY2018 Variance 2HFY2018
Newlands 6.5 6.8 (4%) 6.3
Goonyella 62.6 63.9 (2%) 62.6
Blackwater/WIRP 31.8 32.8 (3%) 29.9
Moura 7.0 5.7 23% 5.4
GAPE 8.6 7.4 16% 8.8
Total 116.5 116.6 - 113.0
Average haul length2 (kms) 247.5 248.3 - 247.0
1. Table represents coal tonnes hauled on the CQCN by all operators
2. Defined as NTK/Net tonnes 761HFY2019 RESULTS FINANCIAL PERFORMANCE
Network EBIT scenarios post UT5 Final Decision
Network EBIT range for FY2019 is $380m – $485m under various revenue recognition
scenarios assuming no volume variance. FY2020 EBIT growth from MAR increase
INDICATIVE NETWORK EBIT RANGE FY2018 – FY2019 ($M)
Scenario Scenario Scenario
One Two Three
45 ~45
~485
481
18 22
~45
~440
~60
~380
FY2018 FY2018 Flood FY17 & FY16 Other FY2019 - UT5FD MAR FY2019 FY2018 FY2019 -
Recovery Rev Cap Transitional Reduction1 - UT5FD True Up1 UT5FD incl full
1. Excludes GAPE
Tariffs FY18 true up 771HFY2019 RESULTS ADDITIONAL INFORMATION
UT5 Final Decision MAR and known adjustments
$m FY2018 FY20193 FY20203 FY20213
UT5 Final Decision MAR (ex GAPE) 874 887 936 908
Estimated MAR (ex GAPE) 9321 887 936 908
Known adjustments:
Revenue Cap / Flood Recovery (3) 45 (1)
UT5 Estimated MAR True Up (FY2018) (61)
Volume variance 7
Adjusted MAR (ex GAPE) 9362 871 935 908
1. Transitional MAR excluding flood and revenue cap
2. Actual AT1-5 revenue billed excluding GAPE
3. FY2019 to FY2021 assumes volumes railed equal volumes detailed in UT5FD. MAR may differ due to actual volumes not aligning to regulatory system forecast volumes.
781HFY2019 RESULTS ADDITIONAL INFORMATION
Network revenue adjustment amounts (revenue cap)
AT2-4 AT5 › Revenue adjustment amounts (RAA) are the
Financial Total
(diesel tariff) (electric tariff) difference by system between Aurizon’s Total
Year $m $m $m
Actual AT2-5 Revenue and Allowable AT2-5
1 Revenue
2018 (5.6)2 4.9 (0.7)2
› RAA also includes adjustments for maintenance
3 and consumer price index (MCI/CPI), rebates,
2017 30.7 14.2 44.9
energy connection costs and other costs
3
(26.7)
2
(23.6)
2 recoverable in accordance with Schedule F of the
2016 3.1
Access Undertaking
› The RAA amounts are collected or repaid through
a tariff adjustment two years later
› All (except FY2018) revenue adjustment
amounts include cost of capital adjustments.
FY2016 and FY2017 amounts will be amended
following approval of the UT5 Undertaking for the
UT5 weighted average cost of capital
Note: AT = Access Tariff Revenue Adjustment Amount
1. Estimated, excludes cost of capital adjustment and only includes AT2-5 adjustments. This has not been submitted to the QCA
2. Excludes the cost of capital adjustment. Amounts have been approved by the QCA
3. FY2016 AT2-4 includes $2.0m return for GAPE, FY2017 AT 2-4 includes $0.5m return for GAPE 79You can also read