Development of an Innovative ICT Infrastructure for an Eco-Cost System with Life Cycle Assessment - MDPI
←
→
Page content transcription
If your browser does not render page correctly, please read the page content below
sustainability

Article
Development of an Innovative ICT Infrastructure for an
Eco-Cost System with Life Cycle Assessment
Wenjie Peng            , Daizhong Su *         and Shuyi Wang

                                          Advanced Design and Manufacturing Engineering Centre (ADMEC), School of Architecture, Design and the Built
                                          Environment, Nottingham Trent University, Nottingham NG1 4FQ, UK; wenjie.peng@ntu.ac.uk (W.P.);
                                          shuyi.wang2015@my.ntu.ac.uk (S.W.)
                                          * Correspondence: daizhong.su@ntu.ac.uk

                                          Abstract: A novel Internet-based information communication technology (ICT) infrastructure for an
                                          eco-accounting system was successfully developed to deliver “EcoCosts”, which are the values of
                                          environmental impact throughout the product life cycle. The ICT infrastructure manages its internal
                                          elements and interacts with operation modules in the supply chain via Web-based service interfaces.
                                          The infrastructure consists of upperware, middleware, and resource layers. The upperware layer
                                          manipulates the middleware elements (cloud-based load balancing, life cycle assessment, Web-
                                          based services, and Radio Frequency Identification (RFID)-enabled mobile access), and manages the
                                          associated resources within the eco-accounting system. As novel features of the ICT infrastructure,
                                          load balancing is used to handle large numbers of data and to allocate the computing load across the
                                          eco-accounting network nodes, and life cycle assessment is conducted to analyse product footprints,
                                          which are the core of “EcoCost”, to facilitate consumers in comparing the environmental impacts

                                          between different products. A case study was conducted by transmitting product EcoCosts from
                                   businesses to consumers through the Internet, successfully verifying the system developed in this
Citation: Peng, W.; Su, D.; Wang, S.      research. Because this research aims to pay more attention to the ICT aspects, the EcoCost is
Development of an Innovative ICT          represented using a single value, hence simplifying the related calculation. This research provides
Infrastructure for an Eco-Cost System     a novel solution for dealing with the large numbers of data and computing loads required to
with Life Cycle Assessment.               manage EcoCost data throughout the product life cycle and to transmit EcoCosts from businesses
Sustainability 2021, 13, 3118.            to consumers.
https://doi.org/10.3390/su13063118

                                          Keywords: product sustainability; EcoCost; life cycle assessment; environmental impact; information
Academic Editor: Tatiana García
                                          communication infrastructure; Web services; RFID
Armingol

Received: 30 January 2021
Accepted: 5 March 2021
                                          1. Introduction
Published: 12 March 2021
                                               An ecological accounting system was developed in this research that measures prod-
Publisher’s Note: MDPI stays neutral
                                          ucts’ ecological cost, referred to as “EcoCost” for short, throughout the product supply
with regard to jurisdictional claims in
                                          chain, as shown in Figure 1.
published maps and institutional affil-        Attempts have previously been made to calculate the EcoCost. For example, in the
iations.                                  myEcoCost project, the EcoCost values were represented by two individual indicators:
                                          carbon footprints and material footprints [1,2]. Because the ecological impact is affected
                                          by multiple factors, more indicators need to be considered. In a recent development,
                                          the EcoCost was represented using a single value—Eco-point, an aggregated value of three
Copyright: © 2021 by the authors.
                                          indicators (human health, ecosystems, and resources) [3]—which is more comprehensive
Licensee MDPI, Basel, Switzerland.
                                          than myEcoCost; however, its implementation for efficient online transmission has not
This article is an open access article
                                          been resolved.
distributed under the terms and                This research aims to apply information and communication technology (ICT) to
conditions of the Creative Commons        measure and assess the ecological impact of products. The research uses a single value,
Attribution (CC BY) license (https://     rather than multiple values, to present the EcoCost of products. The use of a single EcoCost
creativecommons.org/licenses/by/          value facilitates the comparison of ecological impacts among products and lends itself to
4.0/).                                    applications in different fields, such as sustainable consumption and recycling.

Sustainability 2021, 13, 3118. https://doi.org/10.3390/su13063118                                    https://www.mdpi.com/journal/sustainability
Sustainability 2021, 13, 3118 2 of 23
Sustainability 2021, 13, x FOR PEER REVIEW 2 of 25
accounting system
Figure 1. Information flow of an ecological accounting system [4].
[4].
The
ThisEcoCost
researchcan be to
aims calculated using a life and
apply information cyclecommunication
impact assessment (LCIA) method
technology (ICT) to
with
measurerelevant
and LCIA
assesssoftware tools [5].
the ecological Thereofare
impact various The
products. LCIAresearch
methods andatools,
uses singlesuch as
value,
the 15 LCIA methods listed in [4,6] and 10 popular LCIA software/tools
rather than multiple values, to present the EcoCost of products. The use of a single Eco- reviewed in [7].
In general,
Cost these toolsthe
value facilitates arecomparison
installed onofthe user’s personal
ecological impacts computer
among products and then andcomplete
lends it-
the assessment locally. Studies have been conducted focusing
self to applications in different fields, such as sustainable consumption and recycling. on midpoint and endpoint
characterizations
The EcoCostwhen can be choosing
calculated LCIA methods,
using such as
a life cycle [8]. Both
impact midpoint
assessment and endpoint
(LCIA) method
methodologies
with relevant LCIA software tools [5]. There are various LCIA methods and tools,depend
provide useful information for the users, and their applications such as
on the particular situation of individual studies. Midpoint methods may be preferable for
the 15 LCIA methods listed in [4,6] and 10 popular LCIA software/tools reviewed in [7].
specific communication purposes, such as being politically preferable for speaking in terms
In general, these tools are installed on the user’s personal computer and then complete the
of global warming potentials rather than in terms of DALYs [8], while endpoint methods
assessment locally. Studies have been conducted focusing on midpoint and endpoint
may be most valuable in those cases where aggregation and understandable results are
characterizations when choosing LCIA methods, such as [8]. Both midpoint and endpoint
required [8].
methodologies provide useful information for the users, and their applications depend on
With the widespread application of the Internet, online LCIA is in high demand for the
the particular situation of individual studies. Midpoint methods may be preferable for
calculation of EcoCost. Nowadays, more and more designers and manufacturers, who are
specific communication purposes, such as being politically preferable for speaking in
geographically dispersed in different locations, conduct collaborative product development
terms of global warming potentials rather than in terms of DALYs [8], while endpoint
tasks over the Internet. However, only a small number of LCIA software packages can be
methods may be most valuable in those cases where aggregation and understandable re-
used to assess ecological impact online, due to the limited functions and usability of the
sults are required [8].
software [2]. The life cycle assessment (LCA) Calculator [9] was developed to help design-
ers andWith the widespread
engineers application
to understand, analyse, of the
andInternet,
compareonline LCIA is in high
the environmental demand
impacts for
of their
the calculation of EcoCost. Nowadays, more and more designers
products in order to make “greener” design decisions; however, the environmental impact and manufacturers, who
are geographically
was assessed simply dispersed
on the basis in different
of carbon locations,
footprints conduct collaborative
only, which product devel-
is not comprehensive
opment tasks over the Internet. However, only a small
enough, because environmental impact should be assessed on the basis of multiple number of LCIA software packages
indica-
can be
tors. used to the
Although assess LCA ecological
Calculator impact
can beonline, due toand
used online the has
limited functions
no software to and usability
download or
of the software [2]. The life cycle assessment (LCA) Calculator
install, it is only applied for limited data processing and LCIA analysis [10]. Due to the [9] was developed to help
designers
lack and engineers
of sufficient to understand, analyse,
ICT capabilities/functions (suchand compare theservices,
as Web-based environmental impacts
load balancing,
of their products in order to make “greener” design decisions;
and cloud), the LCA Calculator is unable to transmit environmental impact values among however, the environmen-
tal impact
the operation wasmodules
assessedthrough
simply the on the basischain
supply of carbon footprints only,
[10]. COMPASS which is not
is a Web-based com-
stream-
prehensive
lined enough, package;
LCIA software because environmental
however, it doesimpact shouldreal
not provide be online
assessed on the
support basis of
because it
multiple
cannot indicators.
effectively dealAlthough
with thethe LCA Calculator
information can be used
flow generated by aonline and hasof
large number noecological
software
to download
impact values or install,
in the it is only applied
eco-accounting systemfor[11].limited
GaBi is data processingLCIA
a professional and LCIAtool toanalysis
collect,
[10]. Due to the lack of sufficient ICT capabilities/functions
analyse, and monitor the sustainability performance data of the company’s products and (such as Web-based services,
load balancing,
services, but it can andonlycloud), the LCA Calculator
be downloaded is unable[12].
for use (offline) to transmit
SimaProenvironmental
is one of the most im-
pact values
widely used among the operation
LCIA software tools, andmodules through
it provides the supply chain
an Internet-based [10]. COMPASS
programming is a
interface
Web-based
COM [13]. Withstreamlined
the COM LCIA software
interface, userspackage;
need tohowever,
create their it does
own not provide
interfaces to real online
utilise the
support because
computing functionsit cannot effectively
of SimaPro deal with
and build a Web theserver
information
enabling flow generated
SimaPro to beby a large
accessed
number
over the of ecological
Internet. impact
Because values in the
considerable eco-accounting
IT-related expertisesystem [11]. GaBi
is required, is a profes-
it is difficult for
sionalto
users LCIAoperatetool [14].
to collect, analyse,
Moreover, theand monitor the
COM-based sustainability
version of SimaPro performance data of
is very expensive
and is not suitable
the company’s for common
products users.but
and services, Another
it can widely
only be used LCIA software
downloaded is openLCA;
for use (offline) [12].
however,
SimaPro isitone does ofnottheprovide
most widely an online
used function
LCIA software[14,15].tools,
In addition, Sustainable
and it provides Minds
an Internet-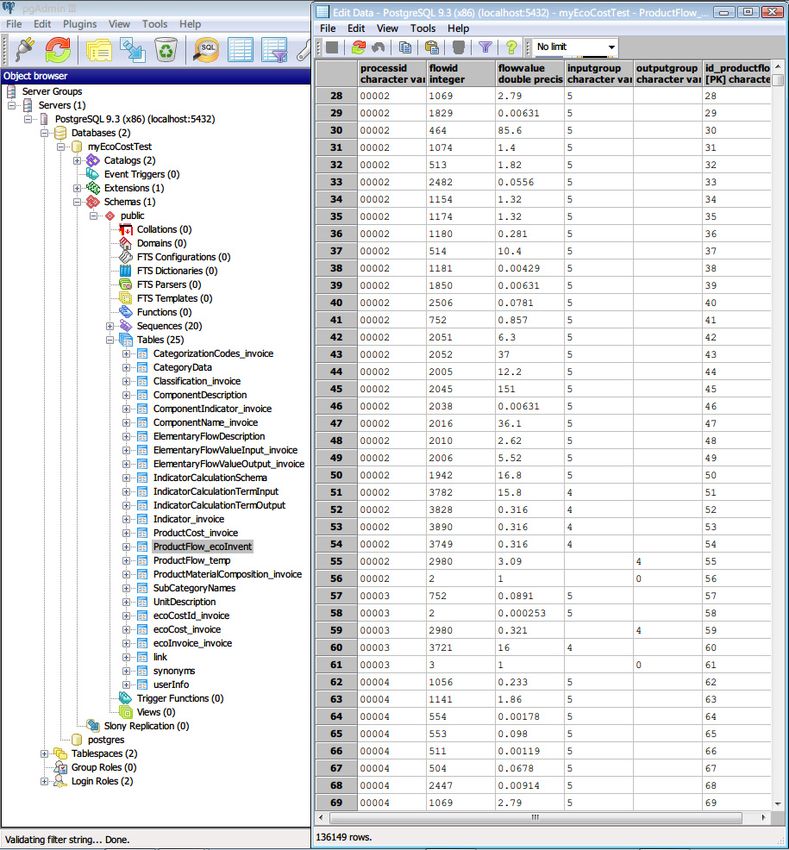
Sustainability 2021, 13, 3118                                                                                           3 of 23

                                has been developed to help designers and researchers to achieve simple LCIA online
                                calculation [16]; however, due to its limited functions (e.g., the database cannot be modified
                                and the results are not detailed enough for further analysis), it cannot be used to complete
                                complex assessment tasks online. Sustainable Minds utilises a single score (called Okala
                                point) to represent the ecological impact of the product, which is designed for the user who
                                is not an LCIA specialist [16].
                                      Due to the lack of sufficient ICT support, the existing LCIA software has the following
                                shortcomings: (1) Currently, there is no LCIA software available that can transmit online
                                the ecological impact values from one operation module to another one over the supply
                                chain, as shown in Figure 1. There are increasing demands for enterprises, especially small
                                and medium-sized enterprises, to participate in the supply chain to upload the EcoCosts of
                                sub-products (processes) and then transmit the EcoCosts of the (final) product to end-users.
                                (2) The existing LCIA software cannot effectively handle the automated information flow
                                within the ecological accounting system, and hence, it is difficult to process a large number
                                of EcoCost values to transfer them to businesses (suppliers) and end-users.
                                      To overcome the above problems, an innovative ICT infrastructure for the eco-accounting
                                system has been developed and is presented in this paper, which utilises Cloud-based
                                load balancing, product life-cycle assessment, Web-based services, and Radio Frequency
                                Identification (RFID) communication techniques. The new ICT infrastructure has the
                                following features: (1) Load balancing is developed to resolve the problems of transmitting
                                a large volume of EcoCost data over the Internet, especially the problem of real-time data
                                exchange between the operation modules (such as businesses). (2) Life cycle assessment
                                has been conducted using a common LCIA tool and a friendly online interactive interface
                                to calculate the EcoCost and provide it to the operation module as the basis of product
                                assessment. (3) RFID, which is embedded in the product (especially electronic products),
                                facilitates the comparison of environmental impacts between different products and helps
                                consumers seek suitable products (not just on financial cost but also EcoCost).
                                      To help end users understand the LCIA results, it would be helpful for the infrastruc-
                                ture to incorporate a certain level of benchmarking to provide a reference to the quality
                                of the lifecycle impact of a given product. This would involve a large amount of LCA
                                calculations in order to measure and benchmark the environmental impact on a category
                                of products. Since this research focuses on the ICT aspect of the eco-accounting system,
                                benchmarking is not included in this paper. However, in the CIRC4Life project supported
                                by the EU H2020 circular economy program [17], the authors researched this matter [18]
                                by conducting an LCIA of a group of domestic lighting products, and based on the LCIA
                                results, all the products shown in the online shop are assigned EcoCost values [19]. With the
                                EcoCost values, the end-users are allowed to assess the environmental quality of products
                                and to make their decision to select more sustainable products. In this research, the ICT-
                                based communication infrastructure is established as an open-source platform to manage
                                the interoperability among the operation modules. There are a considerable number of
                                EcoCost values to be transmitted every day, which is a challenge so far. The commu-
                                nication infrastructure developed by this research is able to be expanded to cope with
                                more complicated and considerable EcoCost values generated from the operation modules.
                                Illustrating it with a case study, the research calculates the EcoCost values through the
                                product’s lifecycle and transmits them from the business to the customer over the Internet,
                                which overcomes the challenge.
                                      In this paper, the overview of the information communication infrastructure is pre-
                                sented, followed by the technologies applied and the case study of implementing the
                                technologies and methods, which have successfully validated the developed system.

                                2. Overview
                                     Figure 2 presents an overview of the information communication infrastructure,
                                which is developed to receive and send the EcoCost values automatically by gathering
                                the product’s EcoCosts from businesses and transmitting the EcoCosts of products sold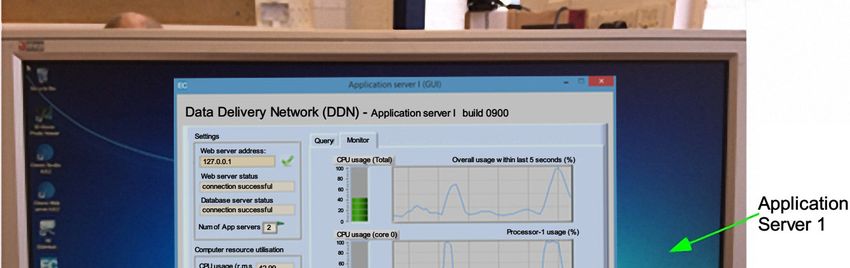
sented, followed by the technologies applied and the case study of implementing the tech-
nologies and methods, which have successfully validated the developed system.
2. Overview
Sustainability 2021, 13, 3118 Figure 2 presents an overview of the information communication infrastructure, 4 of 23
which is developed to receive and send the EcoCost values automatically by gathering the
product’s EcoCosts from businesses and transmitting the EcoCosts of products sold to
consumers.
to consumers. TheThecommunication
communication infrastructure
infrastructurecontrols allallthe
controls themodules
moduleswithin
withinthe
theEco-
Eco-
Cost
Cost accounting system, consisting of upperware, middleware, resource layer and related
accounting system, consisting of upperware, middleware, resource layer and related
interfaces
interfaces for
for the
the interaction
interaction with
with operation
operation modules.
modules. The
The upperware
upperware layerlayer manages
manages the the
middleware (load balancing, life cycle assessment, Web-based services, and
middleware (load balancing, life cycle assessment, Web-based services, and RFID-enabled RFID-enabled
mobile
mobile access),
access), and
andassociated
associatedresources
resources within
within the
theEcoCost
EcoCostaccounting
accountingsystem
systemand
andmean-
mean-
while communicates with the operation modules (business users and
while communicates with the operation modules (business users and end-consumers) end-consumers) that
are running on the supply chain. The infrastructure with the above components
that are running on the supply chain. The infrastructure with the above components and and func-
tions is presented
functions in theinfollowing
is presented subsections.
the following subsections.
Figure 2.
Figure Overview of
2. Overview of the
the Information
Information Communication
Communication Infrastructure.
2.1.
2.1. Upperware
Upperware
The
The upperware
upperware is is developed
developed as as the
the top
top layer
layer of
of the
the information
information communication
communication in- in-
frastructure (see Figure 2), which controls
frastructure (see Figure 2), which controls the middleware formed by four intermediate
modules,
modules, namely
namely load
load balancing,
balancing, lifelife cycle
cycle assessment,
assessment, Web-based
Web-based services,
services, and
and RFID-
RFID-
based
based mobile access network.
network. Through
Throughthe theInternet-based
Internet-basedapplication
applicationprogramming
programming in-
inter-
terfaces,
faces, thethe upperware
upperware controls
controls thethe operation
operation modules,
modules, i.e.,
i.e., business
business users
users andand consum-
consumers.
TheThe
ers. upperware
upperwareprovides the functions
provides the functionsof controlling and and
of controlling coordinating mechanisms
coordinating and
mechanisms
communication
and communicationwith with
the middleware
the middlewareand resource layer, such
and resource as such
layer, database, mobile network,
as database, mobile
and relevant
network, and interfaces.
relevant interfaces.
2.2. Middleware
2.2. Middleware
There are
There are four
fourelements
elements(functional
(functional modules)
modules)in the middleware,
in the middleware,which are integrated
which are inte-
grated with the upperware via internal interfaces. To ensure that those elementseffectively
with the upperware via internal interfaces. To ensure that those elements are are effec-
connected
tively to thetoupperware,
connected the upperware,graphic useruser
graphic interfaces (GUIs)
interfaces were
(GUIs) developed,
were developed, allowing
allow-
for configuring and managing the modules within the middleware
ing for configuring and managing the modules within the middleware in a graphic mode.in a graphic mode.
The GUIs were adapted to the functional modules, allowing for the manager
The GUIs were adapted to the functional modules, allowing for the manager who works who works at
thethe
at infrastructure
infrastructureto to
control and
control track
and thethe
track operation
operationstatus of of
status each module
each module in in
real time.
real time.
The middleware provides the following functions: assessment of environmental im-
pacts throughout product’s life cycle, Web-based services for interacting with operation
modules, managing the workload of handling EcoCost data to different computers, opti-
misation of the flow of EcoCost data within the infrastructure to facilitate efficient data
exchange between functional modules, mobile authentication for consumers to access
EcoCost data, and operation of interfaces and relevant resources.
2.3. Interaction with Operation Modules
Within the operation modules, there are a variety of formats and forms of input
and output data and related functional requirements. Therefore, the specification and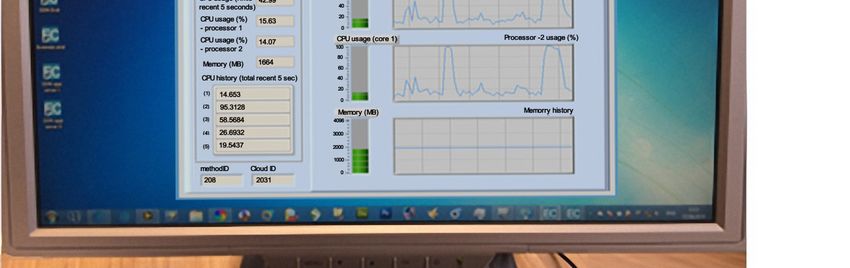
misation of the flow of EcoCost data within the infrastructure to facilitate efficient data
exchange between functional modules, mobile authentication for consumers to access
EcoCost data, and operation of interfaces and relevant resources.
Sustainability 2021, 13, 3118 2.3. Interaction with Operation Modules 5 of 23
Within the operation modules, there are a variety of formats and forms of input and
output data and related functional requirements. Therefore, the specification and require-
ment are created
requirement are for eachfor
created operation module,module,
each operation and the user interfaces
and the are developed
user interfaces accord-
are developed
ing to the specific
according functional
to the specific requirements
functional of the operation
requirements module.module.
of the operation The business user is
The business
to work
user is toonwork
an operation modulemodule
on an operation in the supply chain and
in the supply chainassess the product
and assess life cycle
the product and
life cycle
then
and send
then the
sendgenerated EcoCost
the generated data todata
EcoCost the ICT infrastructure;
to the finally, consumers
ICT infrastructure; are able
finally, consumers
to obtain
are able totheobtain
EcoCost thedata fromdata
EcoCost the infrastructure via the interfaces
from the infrastructure via the developed, as shown
interfaces developed,
in Figure 3.
as shown in Figure 3.
Figure
Figure3.3.Structure
Structureof
ofload
loadbalancing
balancingmodule
moduleformed
formedby
bymultiple
multipleserver
server computers.
computers.
3.3.Development
Developmentof ofthe
theICT
ICTInfrastructure
InfrastructurewithwithProduct’s
Product’s Sustainability
Sustainability Assessment
Assessment
The major
The major technologies
technologies utilised
utilised in
in the
the communication
communication infrastructure
infrastructure contains
contains load
load
balancing for Cloud network, life cycle assessment (LCA) of products, RFID-based
balancing for Cloud network, life cycle assessment (LCA) of products, RFID-based mobile mobile
access,and
access, and Web-based
Web-based services
services for
forcommunicating
communicatingwithwithoperation
operationmodules
modulesover the
over supply
the sup-
chain, which are illustrated in the following sub-sections.
ply chain, which are illustrated in the following sub-sections.
3.1. Load Balancing for Handling Data Flow within the EcoCost Environment
3.1. Load Balancing for Handling Data Flow within the EcoCost Environment
Load balancing is a distributed computing approach that is usually used in cloud
Load balancing
computing. Since theisspectrum
a distributed
of cloudcomputing
computing approach thatbroad,
is much too is usually used
it is vital to in cloud
optimise
computing. Since the spectrum of cloud computing is much too broad,
the dataflow and balance the computer usage of each node in the network to reduce it is vital to opti-
the
mise the dataflow and balance the computer usage of each node in the network
overall load of the network [20]. In this research, there are many EcoCost data of products to reduce
the overall
to be dealt load
with,ofwhich
the network [20]. Inconsiderable
will generate this research, there are many
computing loads. EcoCost
Hence, load databalancing
of prod-
ucts to be dealt with, which will generate considerable computing loads.
is applied to allocate the load to multiple computers located in the network nodes, so as Hence, load bal-
to
ancing is applied to allocate the load to multiple computers located in the
optimise the data flow within the EcoCost environment [2]. In doing so, a load balancing network nodes,
so as to optimise
module the data
is developed flow within
to execute the EcoCost
the automated flowenvironment
of EcoCost data[2]. in
In order
doingtoso, a load
meet the
needs of businesses and consumers for large data processing.
3.1.1. Structure of Load Balancing Module
A typical load balancing module consists of a load balancer computer and several
load workers computers [4]. As the core of the load balancing module, the load balancer is
responsible for managing the load distribution and controlling the load workers. By moni-
toring the computer usage of load workers, the load balancer distributes the load to a load
worker that has low computer usage. The computer usage to be monitored includes the
computer’s utility, such as CPU (central processing unit) and memory, and the amount of
loads being processed [4].
Sustainability 2021, 13, 3118                                                                                             6 of 23

                                      In order to develop the above module, this research creates a network formed by four
                                computers, including a Web server, application servers, and database servers. The Web
                                server acts as a “load balancer” to distribute the load (such as a request/task sent by the
                                operation module in the supply chain) to the application server with the lowest usage;
                                while the application server works as a “load worker” to receive the load and perform the
                                specified task. According to the data distribution mechanism of load balancing, the Web
                                server does not handle a task, but allocates it to the application servers for further pro-
                                cessing. The application server instructs the database server to complete the allocated
                                task, e.g., EcoCost information querying, and then transfer the obtained information to the
                                Web server. Figure 3 presents the structure of the load balancing module implemented by
                                this research.
                                      The load balancing module is constructed based on the following criteria:
                                •     Within this module, each server (i.e., Web server, application servers, and database
                                      servers) occupies a single computer. Therefore, the Web server is deployed on one
                                      computer and interacts with the application servers deployed on other computers,
                                      respectively.
                                •     The Web server acts as a load balancer, which monitors the usage of application servers
                                      in real time and distributes the load to the application server with the lowest usage.
                                      The Web server does not execute specific requests received from operation modules
                                      (such as business or consumer); instead, these requests are passed to the application
                                      servers (load workers) for further processing, as shown in Figure 3.
                                •     The application servers execute the specific tasks via interaction with the database
                                      server and processing the result to the Web server and then send it to the opera-
                                      tion module.
                                •     The application servers are installed with an identical computer operating system and
                                      relevant application software. Therefore, the application servers provide identical
                                      functions and services.
                                •     To ensure data security, the database server is located at the bottom of the ICT
                                      infrastructure, away from the Web server that exposes the interface to the public.
                                      The database server is unable to interact with the Web server bypassing the applica-
                                      tion servers, which greatly reduces the risk of direct data access by external servers
                                      (such as hacker computers) [21].

                                3.1.2. Load Distribution via Computer Usage Monitoring
                                    To distribute the load to the lowest usage application server, the following computer
                                hardware information (i.e., resource usage of each server computer) is monitored:
                                (a)   The usage of CPU and memory of the computer. To obtain accurate measurement
                                      results, the CPU usage is continuously tracked and logged according to the specified
                                      time-length (for instance, one hundred CPU records per second). The root-mean-
                                      square algorithm (RMS) is applied to eliminate the interference generated by the
                                      application software working in the operation system, as shown in Figure 4.
                                (b)   Load progressing, which is related to the user request that the computer is processing
                                      (such as data querying and messaging), with the following parameters:
                                      •    Amount of loads, which determine how many loads are processed on the computer.
                                      •    Type of load, which could be a request to send new EcoCost data or read the
                                           existed data, to evaluate the load strength.
                                     Through measuring the hardware information, the utility of each application server is
                                obtained. When several operation modules upload product ecological data at the same time,
                                they will access the Web server, which will generate massive calculation loads. Therefore,
                                the Web server must have the ability to track each application server and distribute loads
                                in real time to the “optimal” application server (lower utilisation). The implication for the
                                lower utilisation is that the idle rate of the application server is high, and the running tasks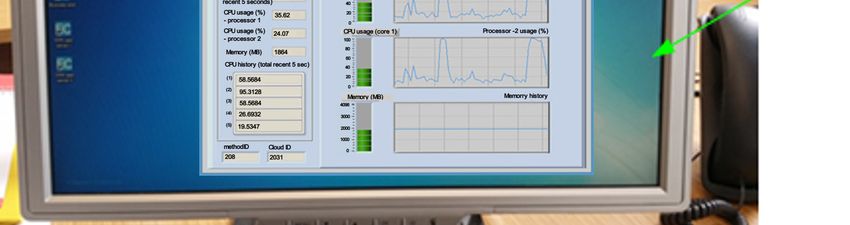
Sustainability 2021, 13, 3118 7 of 23
Sustainability 2021, 13, x FOR PEER are
REVIEW
less than 7 of 25
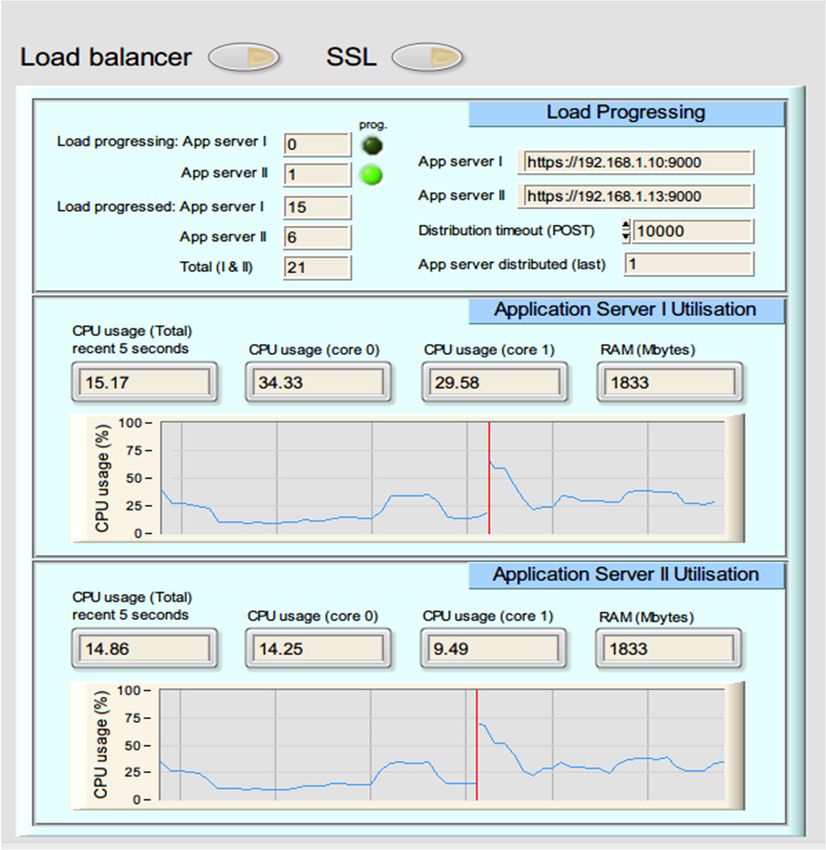
other application servers. Figure 5 presents the usage of an application server,
which is obtained and displayed on the Web server GUI developed.
Sustainability 2021, 13, x FOR PEER REVIEW 8 of 25
Figure
Figure 4. 4.Logging
Loggingthe
theusage
usageofof a CPU
a CPU core.
core.
b) Load progressing, which is related to the user request that the computer is processing
(such as data querying and messaging), with the following parameters:
• Amount of loads, which determine how many loads are processed on the com-
puter.
• Type of load, which could be a request to send new EcoCost data or read the
existed data, to evaluate the load strength.
Through measuring the hardware information, the utility of each application server
is obtained. When several operation modules upload product ecological data at the same
time, they will access the Web server, which will generate massive calculation loads.
Therefore, the Web server must have the ability to track each application server and dis-
tribute loads in real time to the “optimal” application server (lower utilisation). The im-
plication for the lower utilisation is that the idle rate of the application server is high, and
the running tasks are less than other application servers. Figure 5 presents the usage of an
application server, which is obtained and displayed on the Web server GUI developed.
Figure5.5. Measurement
Figure Measurement of
ofhardware
hardwareinformation
informationofofthe application
the server,
application such
server, as CPU
such usage,
as CPU usage,
memory usage and load progressing, using the tool developed.
memory usage and load progressing, using the tool developed.
Thesummary
The summaryofofthe the implementation
implementation of enabling
of enabling loadload distribution
distribution is shown
is shown as fol-
as follows:
lows:
• A business user or a consumer, which is located within an operation module, ini-
• tialises
A business user for
a request or asending/acquiring
consumer, which isEcoCost
locatedthrough
within antheoperation module, initial-
Web server.
• ises a request for sending/acquiring EcoCost through the Web server.
The Web server collects the hardware information from the application servers, util-
• ising
The Web server collects
the controller the hardware
of network information from
nodes implemented by thethe application servers,
network-published uti-
node
lising the
engine controller of network nodes implemented by the network-published node
(NNE).
engine (NNE).
• Based on the hardware information collected, the Web server determines an optimal
application server, which has the lowest utilisation rate.
• The Web server distributes the load (i.e., user request to be executed) to the dedicated
application server. Differently from the traditional round-robin method [5], the load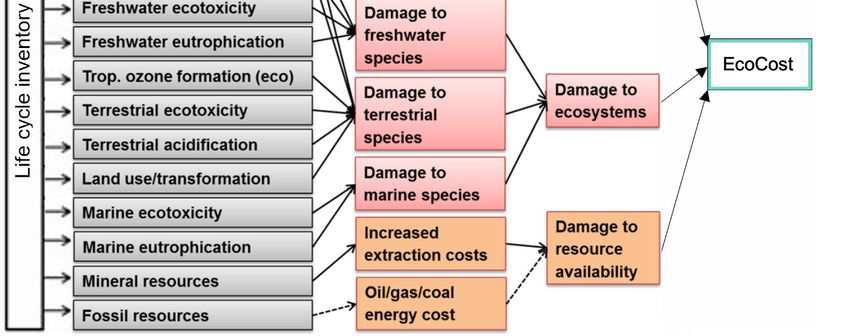
Sustainability 2021, 13, 3118                                                                                                        8 of 23

                                 •            Based on the hardware information collected, the Web server determines an optimal
                                              application server, which has the lowest utilisation rate.
                                         •    The Web server distributes the load (i.e., user request to be executed) to the dedicated
                                              application server. Differently from the traditional round-robin method [5], the load is
                                              distributed to the computer with the lowest utilisation rate rather than the one in a
                                              random or sequential manner, which is a significant application of load distribution.
                                         •    The application server parses the request and then communicates with the database
                                              server to perform the EcoCost data queries.
                                         •    The application server passes the EcoCost data to the Web server.
                                         •    The Web server transmits EcoCost data or completion receipt to the operation mod-
       Sustainability 2021, 13, x FOR PEER REVIEW
                                              ule online.                                                                  9 of 25

                                 3.2. Life Cycle Assessment (LCA) and Data Management
                                     3.2.Life
                                          Lifecycle
                                              Cycle Assessment
                                                    assessment (LCA)  and Data Management
                                                                 is conducted   to perform the assessment of the environmental
                                 impact Life  cycle assessment
                                         of products,   utilisingisthe
                                                                    conducted
                                                                       openLCA, to perform
                                                                                    which isthe    assessment ofLCA
                                                                                                a professional     the environmental
                                                                                                                       software developed
                                 by impact  of products,
                                     GreenDelta           utilising
                                                  [22]. The   inputthe  openLCA,
                                                                     data           whichare
                                                                           for the LCA       is acollected
                                                                                                  professional LCA
                                                                                                            from  thesoftware
                                                                                                                       Ecoinventdevel-
                                                                                                                                   database,
                                    opedisbyused
                                 which        GreenDelta   [22]. The
                                                  as the data         input
                                                                  source  ofdata
                                                                             life for  the inventory
                                                                                   cycle    LCA are collected    from 6).
                                                                                                         (see Figure    the Ecoinvent
                                                                                                                             The Ecoinvent
                                    database,
                                 database     whichthousands
                                            covers   is used as theofdata source of
                                                                      products,     life each
                                                                                   and   cycle inventory   (see Figure
                                                                                                 product consists     of6). The Ecoin-
                                                                                                                         several  processes
                                    vent database covers thousands of products, and each product consists of several pro-
                                 through the product’s life cycle [6,23]. The results of the impact assessment are presented
                                    cesses through the product’s life cycle [6,23]. The results of the impact assessment are pre-
                                 in the following stages: material, manufacturing, and distribution.
                                     sented in the following stages: material, manufacturing, and distribution.

                                           Figure 6. Input data for life cycle assessment (LCA).
                                        Figure 6. Input data for life cycle assessment (LCA).
                                          In order to make it convenient to compare the sustainability amongst different prod-
                                     ucts, in this research, the EcoCost is represented with a single value only. According to
                                     the input data, LCA is implemented to obtain the EcoCost of products, which will be used
                                     as the new data source of life cycle inventory and placed in the database for the EcoCost
                                     environment. The criteria applied in LCA takes the daily consumption of an average Eu-
                                     ropean as a reference.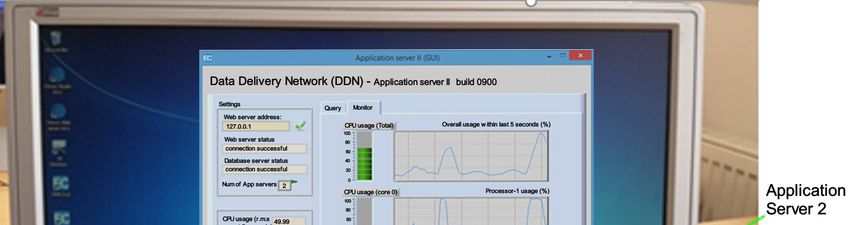
Sustainability 2021, 13, 3118 9 of 23
In order to make it convenient to compare the sustainability amongst different prod-
ucts, in this research, the EcoCost is represented with a single value only. According to the
input data, LCA is implemented to obtain the EcoCost of products, which will be used
as the new data source of life cycle inventory and placed in the database for the EcoCost
environment. The criteria applied in LCA takes the daily consumption of an average
European as a reference.
The ReCiPe Hierarchist [24] method was selected for the LCA because it has the
following major advantages. First, it is one of the most recent and harmonized LCIA
Sustainability 2021, 13, x FOR PEER REVIEW 10 of
approaches available [25]. The method combines LCA results into a single score via
weighting, which allows the user to easily compare the environmental impact of different
products or scenarios. In addition, Hierarchist is referenced in the ISO standards on
weighting, which allows the user to easily compare the environmental impact of differen
LCA to address “consensus model, and often encountered in scientific models”, which is
products or scenarios. In addition, Hierarchist is referenced in the ISO standards on LC
recommended as the default“consensus
to address model by model,
ReCiPeand [25]. Unlike
often other methods
encountered (such
in scientific as Eco-
models”, which is re
Indicator 99, EPS Method,ommended LIME, and
as the Impact
default 2002+),
model ReCiPe[25].
by ReCiPe does not include
Unlike the potential
other methods (such as Eco-Ind
impact from futurecator extractions in the impact
99, EPS Method, LIME,assessment but assumes
and Impact 2002+), ReCiPesuch
doesimpacts have
not include the potenti
been included in the inventory
impact analysis
from future [24]. in the impact assessment but assumes such impacts hav
extractions
EcoCost calculation is conducted
been included based on
in the inventory the ReCiPe
analysis [24]. endpoint impact categories,
which represent three endpointEcoCost calculation is conducted
impact categories, basedecosystems,
namely on the ReCiPe endpointand
resources, impact
hu- categorie
man health. Both midpointwhich represent three endpoint
and endpoint impact categories,
methodologies providenamely ecosystems,
useful resources,
information to and hu
the decision-makerman [8], health.
while Both midpoint
endpoint and endpoint is
characterization methodologies provide
utilised to reflect usefulrele-
“direct information
the decision-maker
vance to society’s understanding of [8],
the while endpoint
final effect” characterization
[8]. By applying is utilised to reflect
normalisation and“direct rel
vance to society’s understanding of the final effect” [8]. By applying normalisation an
weighting methods, i.e., “World ReCiPe H/A (person/year)”, the three endpoint scores
weighting methods, i.e., “World ReCiPe H/A (person/year)”, the three endpoint scores a
are aggregated as the overall environmental impact score of a function unit, and, hence,
aggregated as the overall environmental impact score of a function unit, and, hence,
a single value is obtained, which
single value is the product’s
is obtained, which is EcoCost (seeEcoCost
the product’s Figure 7).
(see Figure 7).
Figure 7. EcoCost calculation Figure
based 7.
onEcoCost
ReCiPe.calculation based on ReCiPe.
To understand theToresults,
understand the results,
it would be idealit would
for thebeplatform
ideal for the platform to incorporate
to incorporate some som
level of benchmarking, providing a reference to the quality of the Life Cycle Impact of
level of benchmarking, providing a reference to the quality of the Life Cycle Impact of
given product. However, such environmental impact benchmarking, especially for a sp
cific category of products, is based on a large number of LCA calculations, where the fun
tional unit and the assessment method applied to the LCA are the same in the produ
assessed. This research focuses on the information communication infrastructure for th
ecological accounting system to deliver the EcoCosts, so the benchmarking issue is n
Sustainability 2021, 13, 3118 10 of 23
a given product. However, such environmental impact benchmarking, especially for a
specific category of products, is based on a large number of LCA calculations, where the
Sustainability 2021, 13, x FOR PEER REVIEW
functional unit and the assessment method applied to the LCA are the same in the product 11 of 25
assessed. This research focuses on the information communication infrastructure for the
ecological accounting system to deliver the EcoCosts, so the benchmarking issue is not
covered
covered in in this
thispaper,
paper,but
butititwill
willbe
beconducted
conductedininthe
thefuture
futurework
workof of
thetheresearch
researchbyby
utilising
utilis-
the approach
ing the approach developed
developedby bythethe
CIRC4Life
CIRC4Lifeproject
project supported
supportedby bythetheEUEUH2020
H2020 circular
circular
economy
economy program
program [17].
[17].
To
To manage those data
manage those data in
in an
an effective
effective way,
way, the
the meta-database
meta-database structure
structure isis established
established
using the PostgreSQL database management system, which is
using the PostgreSQL database management system, which is shown in Figureshown in Figure 8. The8.meta-
The
database model
meta-database contains
model massive
contains datadata
massive search and
search and database
databasemodelling
modellingand andgenerates
generates
descriptive
descriptive meta-data
meta-data enabling
enabling thethe exploration
exploration ofof related
related informative
informative data,
data, with
with major
major
consideration
consideration of of managing
managing digital
digital resources,
resources,legacy
legacydatadataintegration,
integration,and andelectronic
electronicidenti-
iden-
fication [26].
tification [26].
.
Figure 8.
Figure 8. The EcoCost database
database developed
developed for
for LCA.
LCA.
Figure
Figure 88shows
showsthe
theEcoCost
EcoCostdatabase
databasedeveloped
developed bybythisthis
research. TheThe
research. EcoCost database
EcoCost data-
is placed
base on theon
is placed database server (see
the database Figure
server (see 3), which3),acts
Figure as a uniform
which acts as alife cycle inventory
uniform life cycle
for product’s
inventory for data querying
product’s datapurpose.
querying purpose.
3.3. Web-Based Services
3.3. Web-Based Services
The information communication (IC) infrastructure developed by this research pro-
The information communication (IC) infrastructure developed by this research pro-
vides various Web-based services, such as EcoCost service, Life-cycle inventory service,
vides various Web-based services, such as EcoCost service, Life-cycle inventory service,
Registration service for consumer and business, and so on. As a core module of information
Registration service for consumer and business, and so on. As a core module of infor-
mation communication infrastructure, the EcoCost service is created to transmit the Eco-
Costs of products over the Internet from an operation module to another, for example,
from a supplier to a consumer.Sustainability 2021, 13, 3118 11 of 23
Sustainability 2021, 13, x FOR PEER REVIEW 12 of 25
communication infrastructure, the EcoCost service is created to transmit the EcoCosts of
products over the Internet from an operation module to another, for example, from a
supplier to a consumer.
Figure 9 presents the workflow of the EcoCost service, where a business user/actor
Figure 9 presents the workflow of the EcoCost service, where a business user/actor
delivers EcoCost values via the ICT infrastructure. First, a business user creates a connec-
delivers EcoCost values via the ICT infrastructure. First, a business user creates a con-
tion to the Web server by submitting “Send” requests and invoking the application pro-
nection to the Web server by submitting “Send” requests and invoking the application
gramming interfaces (APIs) that are exposed by the Web server. Second, the Web server
programming interfaces (APIs) that are exposed by the Web server. Second, the Web server
transfers
transfers the
the requests
requests toto the
the application
application server.
server. The
The requests
requests are
are to
to be
be completed
completed by by an
an
optimal
optimal application server, including the transmission of EcoCost values to be sentan-
application server, including the transmission of EcoCost values to be sent to to
other
anotherbusiness useruser
business overover
the supply chain,
the supply as well
chain, as as an as
well indicator (a “session”
an indicator ID) by ID)
(a “session” which
by
the business
which user is user
the business able is
to able
continue to interact
to continue with the
to interact withWebtheserver. Then, Then,
Web server. the application
the appli-
server deals with the requests by storing EcoCost values at the proper location
cation server deals with the requests by storing EcoCost values at the proper location in the da-
in
tabase. As soon as the requests are processed, the Web server will send a
the database. As soon as the requests are processed, the Web server will send a “Success”“Success” mes-
sage that that
message confirms that that
confirms the task is completed.
the task is completed.
Figure 9. Web-based service, to transmit EcoCost data to the communication infrastructure.
Figure 9. Web-based service, to transmit EcoCost data to the communication infrastructure.
The communication standard used in the EcoCost service is representational state
transfer
The(REST). On the client
communication side, when
standard used ina business user service
the EcoCost or a consumer triggers a remote
is representational state
method, which is exposed as REST by the Web server, REST messages
transfer (REST). On the client side, when a business user or a consumer triggers are sent toathe Web
remote
server based on Extensible Mark-up Language (XML), to establish the remote
method, which is exposed as REST by the Web server, REST messages are sent to the Web connection
between
server the user
based and the Web
on Extensible serverLanguage
Mark-up [1]. (XML), to establish the remote connection
The server side and client side
between the user and the Web server [1]. (business user) are programmed in different computing
languages and on different computer platforms. Because
The server side and client side (business user) are programmed REST provides a wide range
in different compu- of
interfaces for multi-language interaction, the programs developed in the
ting languages and on different computer platforms. Because REST provides a wide range server side and
client
of side can
interfaces forrun across different
multi-language languagesthe
interaction, and operate at
programs various platforms,
developed such
in the server as
side
Windows and Mac. The major protocol used in REST is the Hypertext Transfer Protocol
and client side can run across different languages and operate at various platforms, such
(HTTP), which enables the execution of service requests and response results through a
as Windows and Mac. The major protocol used in REST is the Hypertext Transfer Protocol
well-known computer protocol. In addition, Secure Socket Layer (SSL) is to be implemented
(HTTP), which enables the execution of service requests and response results through a
in the full functioning platform by creating a secure connection between the server side
well-known computer protocol. In addition, Secure Socket Layer (SSL) is to be imple-
and the client side.
mented in the full functioning platform by creating a secure connection between the server
side and the
3.4. Radio client side.
Frequency Identification (RFID)
RFID is the specific application and development of Automatic Equipment Identifica-
3.4. Radio Frequency Identification (RFID)
tion (AEI) [27]. It uses wireless radio frequency to conduct contactless and bidirectional
RFID is the so
communication specific
that it application
can achieve and development
the goal of Automatic
of identification Equipment
and data Identifi-
exchange and real-
cation (AEI) [27]. It uses wireless radio frequency to conduct contactless and bidirectional
ize the automatic recognition and management for different kinds of products in different
communication so that it can achieve the goal of identification and data exchange andSustainability 2021, 13, x FOR PEER REVIEW 13 of 2
Sustainability 2021, 13, 3118 12 of 23
realize the automatic recognition and management for different kinds of products in dif
ferent situations (moving, static, or harsh environments) [28]. In this research, RFID tech
nology is(moving,
situations utilisedstatic,
to achieve theenvironments)
or harsh following functions:
[28]. In this research, RFID technology is
•
utilised to achieve
The RFID tagtheisfollowing
embeddedfunctions:
in the product, which includes the Serial number (SN) o
• theRFID
The product.
tag isEach serial in
embedded number is associated
the product, with athe
which includes product record in
Serial number theofdatabase
(SN)
the
Byproduct.
searchingEach serial
the number
serial number is associated
from thewith a product
database, therecord in the
product database. can b
information
By searching
obtained andthesent
serial
to number from the database, the product information can be
the consumer.
• obtained and sent to the consumer.
In addition, RFID provides a means to verify the consumer’s identity when they ac
• In addition, RFID provides a means to verify the consumer’s identity when they
cess the eco-accounting system. Unlike the conversational identification method
access the eco-accounting system. Unlike the conversational identification methods
(such
(such asas user
user namenameandand password),
password), RFIDRFID simplifies
simplifies the authentication
the authentication process
process of con- of con
sumers and provides convenience for consumer operations, because
sumers and provides convenience for consumer operations, because the confidential the confidentia
information
information is not
is not required
required to input.
to input.
Figure
Figure 1010 presents
presents thethe mechanism
mechanism of transmission
of data data transmission between
between an RFIDantagRFID tag and a
and an
RFID
RFIDreader.
reader.Within
Withinthisthis
system, the software
system, has been
the software has developed for an RFID
been developed reader
for an RFIDtoreader t
acquire
acquirethe data
the of of
data products
productsor customers.
or customers.
Figure10.
Figure 10.Information
Information flow
flow of Radio
of Radio Frequency
Frequency Identification
Identification (RFID).(RFID).
4. Case Study
4. Case Study
The ICT-based network and communication infrastructure has been successfully
The ICT-based network and communication infrastructure has been successfully de
developed in this research, which calculates and delivers the EcoCosts of products from
a businessin
veloped to this research,
a customer viawhich calculates
the Internet. and
In this delivers
case, the EcoCosts
a computer of products
mouse (Figure 10) is from
abusiness to a customer
new product, via the
which is sold Internet. Inasthis
to consumers case, a computer
a demonstration. mouse
EcoCost (Figure
values 10) is a new
of the
product,mouse
computer whichare is sold to consumers
calculated as a demonstration.
using life cycle assessment (LCA);EcoCost
In doingvalues of the compute
so, the relevant
LCA
mousemethod, i.e., ReCiPe,using
are calculated is utilised for evaluating
life cycle assessmentproduct’s
(LCA);environmental
In doing so,impact and
the relevant LCA
calculating EcoCosts.
method, i.e., ReCiPe, is utilised for evaluating product’s environmental impact and calcu
TheEcoCosts.
lating EcoCosts generated are transmitted online to the load-balancing based network,
which further processes the data to pass the EcoCosts and related information to the
The EcoCosts generated are transmitted online to the load-balancing based network
customer. The advantage of load balancing lies in that multiple computers distributed
which further processes the data to pass the EcoCosts and related information to the cus
on network nodes can process a large number of information data at the same time,
tomer.
which The advantage
efficiently optimisesof theload
data balancing lies inmultiple
flow sent through that multiple computers
businesses and ensuresdistributed
the o
networktonodes
response consumer can requests.
process a large number of information data at the same time, whic
efficiently
Figure 11 shows thethe
optimises data flow
computer sentproduct
mouse through multiple
with businesses
an embedded and ensures
RFID-enabled tag the re
sponse tothe
containing consumer
product’srequests.
serial number. With the support of RFID technology, consumers ac-
quire the EcoCosts
Figure 11 showsvia matching
the computerthe product’s
mouse serial number
product withwith the productRFID-enabled
an embedded datasets ta
from the Web server.
containing the product’s serial number. With the support of RFID technology, consumer
Within this case study, the following three steps were implemented to demonstrate
acquire the EcoCosts via matching the product’s serial number with the product dataset
and validate the delivery of the EcoCost:
from the Web server.
Step 1: EcoCost calculation with life-cycle assessmentSustainability 2021, 13, 3118 13 of 23
The EcoCost represents the aggregation of environmental impacts of every process in
the product’s life cycle. This case dealt with a process of the product selected only, but the
method is equally applicable to every process of the product as well as other products.
x FOR PEER REVIEW Ref. 6681 [29], for example, is one of processes producing the product. Within14 of 25
the Eco-
Invent database [29], one of the world’s leading life-cycle inventory databases, this process
is described as “the consumption of electricity in production”. Table 1 presents the details
of Process 6681 coded in an XML format, which is used as the input data for LCA.
(a) Position of RFID tag in the mouse (b) Computer mouse
Figure 11. Computer mouse with
Figure 11.an embedded
Computer RFID
mouse with tag.
an embedded RFID tag.
Table 1. Input data for a computer mouse product for LCA.
Within this case study, the following three steps were implemented to demonstrate
and validate the delivery of Code
Product the EcoCost: 6681
PSI
Companywith life-cycle assessment
Step 1: EcoCost calculation
Start Year 2005
The EcoCost represents the aggregation of environmental impacts of every process
End Year 2005
in the product’s life cycle. This case dealt with a process of the product selected only, but
Location China (CN)
the method is equally applicable to every process of the product as well as other products.
Address OVGA, 5232 Villages PSI
Ref. 6681 [29], for example, is one of processes producing the product. Within the Eco-
General Comment Supply mix is identical to production mix at medium.
Invent database [29], one of the world’s leading life-cycle inventory databases, this process
Product Name Electricity, medium voltage
is described as “the consumption of electricity in production”. Table 1 presents the details
Category Electricity
of Process 6681 coded in an XML format, which is used as the input data for LCA.
Subcategory Supply mix
Table 1. Input data for aAmount 1
computer mouse product for LCA.
Unit kWh
Product Code 6681
Scheme EcoSpold 01 dataset
Company PSI file
Source 06681.xml
Start Year 2005
End Year 2005
With the software developed by this research, which is shown in Figure 12, the details
Location of the process
China are extracted from the source file of process 6681, including the process name,
(CN)
category, subcategory, manufacturer, date, etc.
Address OVGA, 5232 Villages PSI
General Comment Supply mix is identical to production mix at medium.
Product Name Electricity, medium voltage
Category Electricity
Subcategory Supply mix
Amount 1Sustainability 2021, 13, 3118 14 of 23
Sustainability 2021, 13, x FOR PEER REVIEW 15 of 25
Figure
Figure 12.
12. Details
Details of
of aa product’s
product’s process
process obtained
obtained from EcoSpold dataset
from EcoSpold dataset using
using the
the software
software developed
developed in
in this
this research.
research.
The eco-accounting
eco-accountingmodel modelfor foranalysing
analysingthe
theproduct’s
product’sprocesses
processesis is established
established utilis-
utilising
ing openLCA,
openLCA, whichwhich
is a is a professional
professional LCALCA software
software [15].[15].
TheThe elementary
elementary input
input datadata
usedused
for
the the
for LCA are are
LCA collected
collectedfromfrom
the EcoInvent v3.7v3.7
the EcoInvent [29].[29].
The The
EcoCost assessment
EcoCost method
assessment methodhas
beenbeen
has created to calculate
created the overall
to calculate environmental
the overall performance
environmental of the computer
performance mouse
of the computer
throughthrough
mouse its life cycle
its lifetocycle
obtainto its EcoCost
obtain value, which
its EcoCost value,iswhich
detailed as follows:
is detailed as follows:
•• Functional unit
One unit (item) of the computer mouse (Logitech Cable Mouse M125) is used as an
example to assess the environmental impact of the product. The mouse consists of several
components, such
components, such as
as a microcontroller, sensor, cables, buttons (i.e., left or right button),
page turning device, housing,
page turning device, housing, printed
printed circuit
circuit board,
board, USB
USB plug,
plug, etc.
etc.
•• System boundary
The system boundary covers
covers the product’s life cycle, including
including raw material
material extrac-
extrac-
tion, production
production of basic materials, production
production of the components
components and and end of life (EoL)
treatment (see Figure 13). The use stage is excluded since there is uncertainty
uncertainty regarding
the energy consumption duringduring the use stage. When
When the mouse is connected to
the mouse is connected to the
the com-
com-
puter, the energy comes from the computer, and hence, it is hard to calculatecalculate the power
consumption
consumption of of the
the mouse.
mouse.Transportation
Transportationbetween
betweenthethemanufacturer
manufacturer and
andthe retailer
the is
retailer
is also
also excluded
excluded fromfrom
thethe system
system boundary
boundary since
since the retail
the retail location
location is uncertain.
is uncertain. In theIn the
man-
manufacturing
ufacturing stage,stage, the production
the production and assembly
and assembly of components
of components and sub-systems
and sub-systems are
are con-
considered,
sidered, including
including rawraw material
material acquisition,
acquisition, production
production of basic
of basic materials,
materials, andand manu-
manufac-
facture
ture of components.
of components. TheThe energy
energy consumptionand
consumption andwaste
wastegeneration
generationduring
duringmanufactur-
manufactur-
ing are considered within the material, which is drawn from processes in the the Ecoinvent
Ecoinvent
database [29].
• Inventory data
The background data, such as raw material extraction and production of the basic
materials, were derived from the Ecoinvent database 3.7 [29]. The bill of materials data
is listed in Table 2, where the EoL treatment is considered in compliance with the WEEE
directive [27].
• Life cycle impact assessment
LCA calculation was conducted using ReCiPe, based on the three endpoint impact
categories (ecosystems, resources, and human health). Utilising normalisation and weight-
ing methods, i.e., “World ReCiPe H/A (person/year)”, the three endpoint scores were
aggregated as the overall environmental impact score of a function unit, and hence, a sin-You can also read


