Geographic Information Systems A GIS Primer for Small Florida Cities
←
→
Page content transcription
If your browser does not render page correctly, please read the page content below
Geographic Information Systems

A GIS Primer for Small Florida Cities

                     Prepared by

  The Center for Building Better Communities
   Department of Urban & Regional Planning
             University of Florida

                         For

 The Florida Department of Community Affairs
         DCA Contract # 07 DR-85-13-00-05-010

                   August 31, 2007

                                                1
Table of Contents
What is GIS?........................................................................................................3
How does GIS work?.......................................................................................4
Three Views of a GIS!......................................................................................4
GIS Components .............................................................................................5
Data............................................................................................................................ 5
Hardware .................................................................................................................. 6
Software.................................................................................................................... 6
People ....................................................................................................................... 6
Questions a GIS Can Answer .........................................................................6
Location: What is at a given location?............................................................. 6
Condition: Where does something occur? ..................................................... 6
Trends: What has changed since ...? ............................................................... 7
Patterns: What spatial patterns exist? ............................................................. 7
Modeling: What if ...? ............................................................................................ 7
What Are The Obstacles? ..................................................................................7
Data ..................................................................................................................7
Hardware..........................................................................................................7
Software ...........................................................................................................8
Personnel .........................................................................................................8
Getting GIS for My City.......................................................................................9
Finding Data.....................................................................................................9
Florida Geographic Data Library ....................................................................... 9
Florida Department of Transportation............................................................ 10
Florida Department of Environmental Protection ....................................... 10
Regional Planning Councils.............................................................................. 11
Water Management Districts............................................................................. 13
County Property Appraisers ............................................................................. 13
Local Government / Local Planning Agencies............................................. 14
Best Practices for Small Cities: Accessing GIS .............................................15
Step 1. Learn about GIS and decide if it is right for you. ...........................15
Step 2: Assess your own resources............................................................15
Step 3: Assess your GIS needs....................................................................16
Step 4: Inquire about GIS services and resources within your area. .......16
Step 5: Develop your strategy for acquiring GIS capability. .....................16
Step 6: Setup your GIS system and train your staff...................................17
Glossary.........................................................................................................18
2What is GIS?
GIS is a collection of computer hardware, software, and geographic data for capturing,
managing, analyzing, and displaying all forms of geographically referenced information.
A GIS system is capable of capturing, storing, analyzing, and displaying geographically
referenced information; that is, data identified according to location.
Many computer programs, such as spreadsheets, statistics
packages or drafting packages can handle simple geographic
or spatial data, but this does not necessarily make them a GIS.
A true GIS links spatial data with geographic information about
a particular feature on the map. For example, the centerline
that represents a road on a map doesn't tell you much about
the road except its location. To find out the road's width or
pavement type, you must query the database. Using the information stored in the
database, you could create a display symbolizing the roads according to the type of
information that needs to be shown.
In short, a GIS doesn't hold maps or pictures - it holds a database. The database
concept is central to a GIS and is the main difference between a GIS and drafting or
computer mapping systems, which can only produce a good graphic output. All
contemporary geographic information systems incorporate a database management
system.
A GIS gives you the ability to associate information with a feature on a map and to
create new relationships that can determine the suitability of various sites for
development, evaluate environmental impact, identify the best location for a new facility,
and so on.
GIS is not......
.....simply a computer system for
making maps, although it can create
maps at different scales, in different
projections, and with different colors. A
GIS is an analytical tool. The major
advantage of a GIS is that it allows you
to identify the spatial relationship
between map features. A GIS does not
store a map in any conventional sense;
nor does it store a particular image or
view of a geographic area. Instead, a
GIS stores the data from which you can
draw a desired view to suit a particular
purpose.
3How does GIS work?
The power of a GIS comes from the ability to relate different
information in a spatial context and to reach a conclusion about this
relationship. Most of the information we have about our communities
contains a location reference, placing that
information at some point on the globe. For
example, if a building permit is issued it may be
useful to know where the house may be
located. This can be done by using a location
reference system, such as longitude and latitude, and perhaps
elevation. Comparing the building permit data with other
information, such as the location of roads, may show that certain
roads may expect increased traffic. This fact may indicate that
these roads are likely to be congested, and this inference can help
us make the most appropriate decisions about improvements to the
road system. A GIS, therefore, can reveal important new
information that leads to better decisionmaking.
Many computer databases that can be directly entered into a GIS are being produced by
Federal, State, and local governments, private companies, academia, and nonprofit
organizations. Different kinds of data in map form can be entered into a GIS
A GIS can also convert existing digital information, which may not yet be in map form,
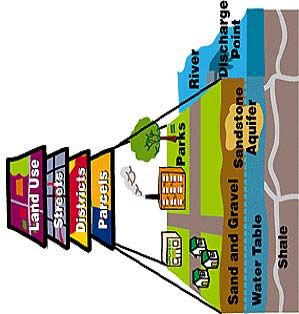
into forms it can recognize and use. For example, digital satellite images can be
analyzed to produce a map of digital information about land use and land cover (figs. 3
and 4). Likewise, census or hydrologic tabular data can be converted to a maplike form
and serve as layers of thematic information in a GIS (figs. 5 and 6).
Three Views of a GIS!
A GIS is most often associated with maps. A map, however, is only one way you can
work with geographic data in a GIS, and only one type of product generated by a GIS.
This is important, because it means that a GIS can provide a great deal more
problem-solving capabilities than using a simple mapping program.
A GIS can be viewed in three ways:
4The Database View: A GIS is a unique
kind of database of the world—a
geographic database (geodatabase). It
is an "Information System for
Geography." Fundamentally, a GIS is
based on a structured database that
describes the world in geographic terms.
The Map View: A GIS is a set of intelligent maps and other views that show features
and feature relationships on the earth's surface. Maps of the underlying geographic
information can be constructed and
used as "windows into the database"
to support queries, analysis, and
editing of the information..
The Model View: A GIS is a set of
information transformation tools that
derive new geographic datasets from
existing datasets. These
geoprocessing functions take
information from existing datasets, apply analytic functions, and write results into new
datasets. In other words, by combining
data and applying some analytic rules,
you can create a model that helps
answer the question you have posed.
GIS Components
A GIS is a very powerful tool that can
be used to capture, store and analyze
geographic data but it is not, by any means, a stand-alone system. You need several
other very important components to make up a GIS:
Data
The heart of any GIS is the database through which questions such as what a feature is,
where it is, and how it relates to other features can be answered. In recent years, the
availability of GIS data has grown exponentially. As a result,
every community in Florida has access to the data necessary
to support a functional GIS system.
The backbone of GIS is good data. Inaccurate data can result
in inaccurate models and maps, skewing the results of your
analysis and ultimately resulting in poor decisions. "Garbage
in, garbage out," as the adage says.
The past 10 years has seen an explosion in the amount of data available, much of it
free, with the advent of the Internet and proliferation of commercial sources of data.
Internet mapping and Web services technology has made it possible for anyone
anywhere to share or access data from around the globe.
5Geographic data comes in three basic forms:
Map data. Map data contains the location and shape of geographic features. Maps
use three basic shapes to present real-world features: points, lines, and areas (called
polygons).
Attribute data. Attribute (tabular) data is the descriptive data that GIS links to map
features. Attribute data is collected and compiled and often comes packaged with map
data. When implementing a GIS, the most common sources of attribute data are your
own organization's databases combined with data sets you buy or acquire from other
sources to fill in gaps.
Image data. Image data ranges from satellite images and aerial photographs to
scanned maps (maps that have been converted from printed to digital format) for specific
areas like states, census tracts, cities, and so on.
Hardware
Complex, multi-user GIS systems understandably require
sophisticated (and expensive) hardware for efficient operation.
Simple systems with only a few users can operate quite well on a
desktop environment using readily available equipment.
Software
To use a GIS in the most efficient manner it is important to run the most up-to-date
version of the software that is available. At this time, ARCGIS 9.2 (ESRI) and its
associated software programs are almost universally used.
People
Without well trained, competent personnel operating and supporting a GIS the system
would not function. Skill in selecting and using tools from the GIS toolbox and an
intimate knowledge of the data being used are essential to your success as GIS user.
Just pressing a button is not enough.
Questions a GIS Can Answer
Perhaps the simplest way to define a GIS is by listing the types of questions it can
answer. For any application there are five generic questions that a sophisticated GIS can
answer.
Location: What is at a given location?
The first of these questions seeks to find out what exists
at a particular location. A location can be described as a
place name, zip code , address, etc.
Condition: Where does something occur?
Using spatial analysis the second question seeks to find
6a location where certain conditions are satisfied (e.g., an unforested section of land at
least 2,000 square meters in size, within 100 meters of a road, and with soils suitable for
supporting buildings).
Trends: What has changed since ...?
The third question might involve a combination of the first two and seeks to find the
differences within an area over time.
Patterns: What spatial patterns exist?
You might ask this question to determine the residential density within walking distance
of your downtown. Just as important, you might want to know how many anomalies there
are that don't fit the pattern and where they are located.
Modeling: What if ...?
"What if ..." questions are posed to determine what happens, for example, if a new road
is added to a network. Answering this type of question requires geographic as well as
other information.
What Are The Obstacles?
If you are convinced that GIS would be a valuable tool for your City, then what are the
obstacles? Essentially the obstacles come down to cost and the availability of trained
people.
Data
Until recent years, the availability of data was a major impediment. The development of
base data required a significant and necessary investment for a functional GIS system.
Today that issue has been largely removed. GIS data is highly standardized and base
data (parcel layers, road networks, environmental mapping) is universally available
through state, regional and local agencies along with the state repository for geo-data
(Florida Geographic Data Library).
With the data issue removed, the impediments to the small city for obtaining a GIS
capacity come down to the cost of hardware and software and to the availability of
trained personnel.
Hardware
Modern desktop computers commonly used by government and business are fully
capable of operating GIS programs and managing GIS databases. Typical specifications
would include 1 GB of RAM and a large amount of disk storage for managing graphics
and datasets. In all probability your community is already using computers with sufficient
speed and memory to handle a GIS application.
7You may want the ability to print large maps necessitating access to a plotter. This
equipment is expensive (several thousand dollars) and the demand for its use may not
justify the high cost. Explore the availability of a plotter through your engineer (if you use
a consultant) or examine the feasibility of joint use by several departments.
Software
ArcGIS Desktop is software that allows you to discover patterns, relationships, and
trends in your data that are not readily apparent in databases, spreadsheets, or
statistical packages.
Seeing your data on a map, rather than a spreadsheet, is a
very powerful tool to enable more informed and faster
decision making.
Beyond showing you your data as points on a map, ArcGIS Desktop gives you the
power to manage and integrate your data, perform advanced analysis, model and
automate operational processes, and display your results on professional-quality maps.
Personnel
Finding the personnel to operate your GIS system is probably the most difficult
impediment for the small city to overcome. Even the use of GIS at a fundamental level
requires an investment of some time and training to master. Frequent use is also helpful
in retaining the skills necessary to be proficient.
Full use of the capabilities of GIS requires trained personnel. While GIS technicians are
being trained at a growing rate, good people in this field are in demand and may place a
substantial strain on the budget of a small municipality. Additionally, the use of GIS may
not justify a full time position.
8Getting GIS for My City
Developing a GIS capability is within the grasp of any local government in Florida – even
the smallest. The remainder of this guide provides information intended to assist public
officials in small cities in obtaining this powerful tool.
Finding Data
Small municipalities need four types of base data for the initial setup. These include:
Census data showing census tracts, traffic analysis zones (TAZs) and census
blocks. This base data is developed for data management and provides a commonly
shared framework for demographic, land use, traffic and an array of other data.
Parcel data is developed by property appraisers throughout Florida under
Department of Revenue guidelines. This data is now available in GIS format in most
Florida Counties.
Transportation systems data provides a “linear” framework for infrastructure.
Data layers providing a variety of information ranging from environmental features,
soils, school zones, land use, historic structures, traffic data, etc.)
The primary sources for this base data include:
The Florida Geographic Data Library
The Florida Department of Transportation
The Florida Department of Environmental Protection
Regional Planning Councils
Water Management Districts
County Property Appraisers
Local Government / Local Planning Agencies
Florida Geographic Data Library
The Florida Geographic Data Library (FGDL) distributes spatial (GIS) data throughout
the state of Florida. The FGDL is warehoused and maintained at the University of
Florida's GeoPlan Center.
There are currently over 350 GIS data layers in the FGDL,
including data on Land Use, Hydrology, Soils, Transportation,
Political Boundaries, Environmental Quality, Conservation,
Census, and more.
9Data is available for download free of charge from the FGDL Metadata Explorer or the
FTP site. New data layers are continuously added to the FGDL Metadata Explorer as
they become available. Data is also available for purchase on CD-ROM and DVD.
FGDL data included on the CDROMs/ DVDs are
released as Versions. Currently, FGDL Annual
versions of FGDL data are released in the
spring of each year.
The Florida Geographic Data Library may be contacted as follows:
http://www.fgdl.org
ftp://ftp1.fgdl.org
Florida Department of Transportation
The FDOT maintains a very large
library of transportation data much of
which is downloadable in a GIS
format. This data may be accessed
as follows:
http://www.dot.state.fl.us/planning/
http://www.dot.state.fl.us/planning/statistics/gis/default.htm
Florida Department of Environmental Protection
The Geographic Information Systems section within
the Bureau of Information Systems provides e-
Government services in the form of downloadable
geospatial data files, related projection information and
an Internet mapping portal. The Internet mapping
portal provides links to mapping applications that
display a wide array of environmental data, base map
data and aerial photography.
The Florida Department of Environmental Protection (FDEP), Division of State Lands,
Bureau of Survey and Mapping sponsors the Land Boundary Information Systems
(LABINS).
LABINS began in 1984 as a means for distributing survey-related data that is maintained
and managed by federal and state agencies to the general surveying community.
LABINS is available over the Internet and has been greatly enhanced by the addition of
digital images of many of the original documents that support the textual data bases.
Putting public data into the hands of the people who can use and benefit from it the most
is the goal of the Bureau of Survey and Mapping and the developers of the software, the
Florida Resources and Environmental Analysis Center (FREAC).
10FDEP data can be accessed as follows:
http://www.dep.state.fl.us/mainpage/programs/gis.htm
http://data.labins.org/2003/General/about.cfm
Regional Planning Councils
All of Florida’s eleven regional planning councils (RPCs) maintain GIS systems and are
a source of GIS data. The RPCs also provide technical assistance to local governments
typically including GIS services
The RPCs that post downloadable GIS data on their websites are discussed below
East Central Florida Regional Planning Council - GIS Clearinghouse. The Regional
Planning Council recently began an effort to increase coordination and integration
among GIS users in 10 counties: Brevard, Flagler, Lake, Marion, Orange, Osceola, Polk,
Seminole, Sumter and Volusia. This effort is called Central Florida GIS (CFGIS).
The two primary components of CFGIS are a regional users group and a data
clearinghouse. CFGIS efforts also include work on developing data guidelines that will
make it easier to share data created by different
organizations. CFGIS focuses on regional
coordination. Local GIS users groups in the 10-
county area provide another valuable resource for
GIS practitioners.
The CFGIS initiative seeks to increase coordination
among users of geographic information systems in
Central Florida. Its two primary components are a
regional users group and a data clearinghouse.
CFGIS efforts also include work on developing data
guidelines that, if widely adopted, will make it easier to share data created by different
organizations.
CFGIS focuses on regional coordination. Local GIS users groups in the 10-county area
provide another valuable resource for GIS practitioners.
The CFGIS initiative has a Steering Committee comprised of dedicated volunteers who
represent a wide range of agencies and the private sector. The initiative is staffed by the
East Central Florida Regional Planning Council.
For more information or to access GIS data, please go to:
http://www.cfgis.org/layout_index.asp
South Florida Regional Planning Council uses a Geographic Information System
(GIS) to produce display maps and assist the planning staff in their analytical work. The
Council offers a variety of Mapping Services including the creation of customized maps.
11Examples of the Council's mapping capabilities are displayed in the South Florida Map
Gallery.
http://www.sfrpc.com/gis.htm
The Southwest Florida Regional Planning Council has maintained a mapping and
graphics department for over 30 years. In that time, the process has progressed from
simple velum maps using hand drafting tools to state of the art GIS software and wide
format plotters. Browse the data for download or visit the ArcIMS site where you can
create your own maps and do simple analysis.
http://www.swfrpc.org/gis.shtml
The Tampa Bay Regional Planning Council has been mapping for various projects
concerning the region since 1988. The region includes the counties of Pasco, Pinellas,
Hillsborough, and Manatee. Digital aerial coverage is available for our whole region
flown 12/01-01/02
GIS in the workplace is becoming more commonplace and data is reaching a point
where it can be found easily. Most of the GIS work we do for the region involves data
produced by other agencies. We create our own data in situations where the project
requires it. One example is the Storm Tide Atlas based on the 1992 SLOSH grid used
for hurricane evacuation planning
http://www.tbrpc.org/gis/default.htm
The Withlacoochee Regional Planning Council uses a GIS to produce various types
of maps under a variety of Federal, State and local government contracts. Land use and
zoning maps for local governments, as well as informational maps representing map
topics such as hurricane surge zones, soils classifications and flood plain areas are
examples of maps produced by the Council using the GIS.
The GIS staff's primary function is to assist the Council's professional planning staff by
preparing display or document maps and to help in the acquisition of various digital data
as needed by staff to complete contractual work projects.
The Council's primary software is the desktop mapping program, MapInfo for Windows
running on a PC. The Council also utilizes the ESRI desktop mapping software, ArcView
for Windows.
http://www.wrpc.cc/gismapping.asp
The Apalachee Florida Regional Planning Council maintains GIS data that can be
downloaded as follows:
http://www.thearpc.com/resources.html#
12Water Management Districts
Water management districts generally maintain extensive GIS system and are especially
good sources of environmental data.
The Northwest Florida Water Management District maintains GIS data that can be
downloaded as follows
http://www.nwfwmd.state.fl.us/pubsdata/GISdata.html
The South Florida Water Management District. Geographic Information Systems
(GIS) provide a visual and spatial perspective of data about water resource systems.
GIS can be interactive, and may include satellite pictures.
http://www.sfwmd.gov/site/index.php?id=1
The Southwest Florida Water Management District. The District's Geographic
Information System (GIS) database was developed to support many of the District's
planning, environmental and regulatory activities. This database includes a considerable
amount of information that is potentially of value to federal, state, regional and local
governmental agencies, as well as to private businesses and citizens. Use of these data
require a general understanding of GIS. The ArcView Shapefiles are distributed in self-
extracting, self-executing (.exe) files for Microsoft Windows. The Digital Orthophotos are
distributed in compressed ZIP (.zip) files.
http://www.swfwmd.state.fl.us/data/gis/
County Property Appraisers
County property appraisers in Florida provide the primary source of parcel data and
most have developed GIS parcel layers. Examples are provided below to illustrate the
type and scope of downloadable GIS data generally available on the internet. The
following links are offered as examples
Pasco County Property Appraiser
http://appraiser.pascogov.com/
Polk County Property Appraiser
ftp://ftp.polkpa.org/
13Local Government / Local Planning Agencies
Larger local governments especially counties and the local planning agencies serving
urban populations not only are excellent sources of GIS data but may also provide GIS
services for smaller local governments within their jurisdiction.
Alachua County. The GIS Division operates in four areas, strongly adhering to the
principles of the GIS Code of Ethics:
Geospatial decision support in various areas of urban and rural planning applications
Asset and record management for land administration systems WebGIS application
development and maintenance for Internet and Intranet. See GIS Portal
Conception, design, and implementation of general E-Services
LEMAC Model. In support of the Objectives of the
Conservation and Open Space Element of the 2001-
2020 Comprehensive Plan for Alachua County, Florida,
a project was conceived, designed and implemented by
the GIS Division at the Growth Management
Department, in partnership with the Information Center
for the Environment (ICE) at the University of California,
Davis.
This project developed a Landscape Evaluation Model
for Alachua County (LEMAC). This model (a rule based
system), provides for a characterization of our
ecological boundaries and strategic ecosystems and
can be run in a participatory collaborative environment. It creates a strategic framework
for natural resource protection in support of decisions on developments of regional
impacts, development applications, special area plans, transfer of development rights,
etc. More than thirty five spatial layers were considered for the current run of LEMAC
with the UMB. UMB is a desktop application that runs on ArcGIS 9.1/Spatial Analyst over
vector and raster datasets. In addition to enhancing the UMB we also developed a web
based light version of LEMAC. The model can be run with your own weighting over the
nine basic layers we offer. At the end of the model's run, users are able to explore their
results using the interactive GIS Mapper.
The LEMAC model is not proprietary and is made available free to all. This web site
offers free access to the model; offers free access to LEMAC's input data/metadata, to a
user guide, to related maps, reports etc. Anyone wanting to use the model with better
data, better methods, etc. is welcomed to download all of the components from the
website.
14Data Warehouse for Smaller Municipalities. Each of the eight smaller municipalities
in Alachua County can search, view, download a geo-library of 40+ datasets. This
service is part of a major project that the County provided to the eight Smaller
Municipalities in 2004, as part of the Countywide Visioning Process.
The following municipalities have a geo-library:
• Alachua
• Archer
• Hawthorne
• High Springs
• La Crosse
• Micanopy
• Newberry
• Waldo
Hillsborough County City-County Planning Commission. The HCCCPC serves as
the local planning agency for Hillsborough County and the three
municipalities of Tampa, Temple Terrace and Plant City. The
Commission offers a wide range of GIS services for the county as a
whole and for each of the local governments..
These services can be accessed as follows:
http://www.theplanningcommission.org/maps
Best Practices for Small Cities: Accessing GIS
Step 1. Learn about GIS and decide if it is right for you.
Do your home work. Learn about GIS and what advantages it may provide for your city.
The ESRI website is a good starting point ( http://esri.com ). The GeoPlan Center at the
University of Florida is another source ( http://www.geoplan.ufl.edu/ ). Inquire of other
local governments about the advantages and costs of developing and using a GIS
system.
Step 2: Assess your own resources.
What resources do you already have that can support a GIS? Do you have modern
computer technology that could operate a GIS system and can these resources be
devoted to the project? While most modern desktop computers have the power and
storage capacity to operate a GIS, a computer that can be dedicated to GIS is
preferable. Even if you eventually rely on another agency to manage your GIS system,
you will want your own GIS ready computer for access to the system.
What about personnel? Do you have staff already
15Step 3: Assess your GIS needs.
How will you use GIS? Talk with your staff about potential uses. Don’t forget to explore
all possible applications including planning, public works (roads, water and sewer
systems, etc.), parks and recreation, housing programs, building permit tracking and
environmental management. You may well discover a broad array of possible GIS
benefits for your community.
Step 4: Inquire about GIS services and resources within your area.
Identify agencies within your area or region that operate GIS systems. Don’t
forget to inquire of neighboring cities. Do these agencies provide GIS services to
cities like yours? If so at what cost? Do these agencies have GIS data that is
available to your city?
Step 5: Develop your strategy for acquiring GIS capability.
Decide how you will bring a GIS to your city. You have several options
Option #1: Setup and operate a standalone system.
Because basic GIS data (see Finding Data, pg 9) is readily available, a stand alone GIS
system for your city should be considered. The cost of hardware and software must be
considered under this option but most importantly you must commit adequate staff
resources to the project.
Hardware has been discussed previously. Most modern computers have the speed and
storage to handle GIS applications. Don’t forget the plotter if you have need for large
maps produced by GIS. If plotter needs are infrequent, you may contract for these
services (ask your engineering consultant) or take the map down to the local copy shop.
The software and license can be obtained at a reasonable cost. Currently the initial cost
is about $1,200 with a few hundred dollars annually for technical support and upgrades
(very important). ESRI distributes its products directly and through distributors 1 . If you
employ a consulting engineer, ask them about the software. They may be an ESRI
distributor.
Also your city may be able to obtain the hardware and GIS software through other
agencies. For example, the Suwannee River Water Management District provides
computers and GIS software to local governments if they agree to collect information
that is beneficial the District’s programs.
Decide on staffing. Do not assume that the operation of a GIS system can be
simply absorbed into the current work load. While the operation of a GIS may not
require a full time commitment in small cities, it should be a major job
responsibility of assigned staff. And don’t forget about training.
1
http://www.esri.com/software/arcgis/about/how-to-buy.html
16Decide where and how you will obtain the base GIS data and how it will be
updated and maintained.
Option# 2: Contract for GIS Services
An easy option is to simply contract for GIS services but it has its drawbacks. First, it
may be costly and, second, a contract service may not be as responsive as your in-
house staff and much of the analytical capacity offered by GIS may not be realized. In
contrast, contract GIS services may offer access to substantially greater GIS skills and
resources than you can provide in-house.
Who can provide contract services? Your consulting engineer or planner is one likely
source. Your regional planning council may also provide such services. In some cases,
county governments may offer services to the municipalities within their jurisdictions.
Don’t forget that no GIS system is better than your ability to access the information. If
contract services are used, pay close attention to how and the frequency with which
information will be conveyed. You may well find that you will need an in-house software
and hardware capability even if the primary GIS work and maintenance is elsewhere.
Ask your contractor if they can provide a terminal at your location under their software
license and some basic training for your staff.
Option #3: Collaborate with your neighbors
Talk with your neighboring communities and county about sharing a GIS system. After
all you have common interests and the sharing of data is good business.
Although the development of a shared system is beyond the scope of this guide, keep in
mind that a variety of sophisticated platforms are available for this purpose.
Step 6: Setup your GIS system and train your staff
Once you have your hardware and software in place, you are ready to import the base
data and customize the system to fit your community.
An early investment in training will save time and produce positive results much more
rapidly. Such training can be obtained online or from a variety of educational
organizations.
Develop a close contact with the agencies that produce your base data notably the
property appraiser and the county GIS administrator. Technical issues and the update of
data will be expedited through this exchange to the betterment of your GIS system.
17Glossary
AAT Arc Attribute Table. A table containing attributes for a line coverage such as streets or
streams.
accuracy, absolute The accuracy of a map in representing the geographic location of an object
relative to its true location on the surface of the Earth. Absolute accuracy is based on geographic
coordinates.
accuracy, relative The accuracy of a map in representing the geographic location of an object
relative to the locations of other objects.
AM/FM Automated Mapping and Facilities Management. The management of mapping and
facilities management using integrated computer software.
AML The ARC Macro Language. A high level language that provides full programming
capabilities and a set of tools for building menus to tailor user interfaces for specific applications.
annotation Descriptive text used to label coverage features.
arc A string of x,y coordinate pairs (vertices) that begin at one location and end at another.
Connecting the arc's vertices creates a line.
attribute A characteristic of a geographic feature described by numbers or letters, typically stored
in tabular format and linked to the feature in a relational database. The attributes of a well
represented by a point might include depth, location, and permit number.
base map A map containing visible surface features and boundaries, essential for locating
additional layers, or types, of georeferenced information.
buffer A zone of a specified distance around coverage features. Both constant and variable width
buffers can be generated for a set of coverage features based on each features attribute values.
CAD Computer Aided Design. An automated system for the design, drafting and display of
graphically oriented information.
cadastre Public record of the extent, value and ownership of land within a district for purposes of
taxation.
Cartesian Coordinate System A two dimensional coordinate system in which x measures
horizontal distance and y measures vertical distance. An x,y coordinate defines every point on the
plane.
clip The spatial extraction of those features from one coverage that reside entirely within the
boundary defined by features in another coverage. Clipping works much like a cookie cutter.
COGO Abbreviation for the term COordinate GeOmetry. Land surveyors use COGO functions to
enter survey data, to calculate precise locations and boundaries, to define curves, and so on.
contour line An imaginary line joining points of equal elevation.
18control points A set of points on the ground whose horizontal and vertical location is known.
Control points are used as the basis for detailed surveys.
coordinate An x,y location in a Cartesian coordinate system or an x,y,z coordinate in a three
dimensional system. Coordinates represent locations on the Earth's surface relative to other
locations.
coverage A digital version of a map forming the basic unit of vector data storage in ARC/INFO. A
coverage stores map features as primary features (such as arcs, nodes, polygons, and label
points) and secondary features (such as tics, map extent, links, and annotation). Associated
feature attribute tables describe and store attributes of the map features. A coverage usually
represents a single theme, or layer, such as soils, roads, or land use.
coverage units The units (e.g., feet, meter, inches) of the coordinate system in which a coverage
is stored.
data conversion The translation of data from one format to another. ARC/INFO supports data
conversion from many different geographic data formats in addition to routines for converting
paper maps. Those data formats include DLG, TIGER, DXF, and DEM.
database A logical collection of interrelated information, managed and stored as a unit. A GIS
database includes data about the spatial location and shape of geographic features recorded as
points, lines, and polygons as well as their attributes.
datum A set of parameters and control points used to accurately define the three dimensional
shape of the Earth. The corresponding datum is the basis for a planar coordinate system. For
example the North American datum, 1927 is the datum for coordinates used in Volusia County's
GIS.
DBMS Data Base Management System. Software that manages, manipulates and retrieves data
in a database.
DGPS Differential Global Positioning System. A positioning procedure that uses two receivers, a
rover at an unknown location and a base station at a known, fixed location. The base station
computes corrections based on the differences between its actual and observed ranges to the
satellites being tracked.
digital map library A series of directories and subdirectories designed to uniformly organize a
collection of spatial data. Map libraries organize geographic data spatially as a set of tiles and
thematically as a set of layers. Volusia County's digital map library is divided into large scale and
small scale subdirectories containing several hundred tiles comprising 90 layers of information.
Digital Elevation Model (DEM) Terrain elevation data organized by quadrangle and provided in
digital form.
Digital Terrain Model (DTM) A three-dimensional model of the Earth's surface, provided in
digital form.
digitize To encode map features as x,y coordinates in digital form. Lines are traced to define their
shapes. This can be accomplished either manually or by use of a scanner.
dissolve The process of removing boundaries between adjacent polygons that have the same
values for a specified attribute.
19DLG Digital Line Graph files from the U.S. Geological Survey.
DXF Data Exchange Format. A format for storing vector data in ASCII or binary files; used by
AutoCad or other CAD software and convertible to ARC/INFO coverages.
edge matching An editing procedure to ensure that all features that cross adjacent map sheets
have the same edge locations.
ethernet A baseband protocol invented by the Xerox Corporation in common use as the local
area network for UNIX operating systems interconnected by TCP/IP. Runs at 16 megabits per
second.
feature attribute table A table used by ARC/INFO to store attribute information for a specific
coverage feature class. Feature attribute tables supported include:
Cover.PAT for polygons or points
Cover.AAT for arcs
Cover.NAT for nodes
Cover.RAT for routes
Cover.SEC for sections
Cover.TAT for annotation(text)
- where "Cover" is the coverage name
feature class The type of feature represented in a coverage. Coverage feature classes include
arcs, nodes, label points, polygons, tics, annotation, links, boundaries, routes, and sections.
geocode The process of identifying a location by one or more x,y coordinates from another
location description such as an address. For example, an address can be matched against
Volusia County's street centerline file to determine an x,y coordinate.
GIS Geographic Information System. An organized collection of computer hardware, software,
geographic data, and personnel designed to efficiently capture, store, update, manipulate,
analyze, and display all forms of geographically referenced information.
Global Positioning System (GPS) A satellite based device that records x,y,z coordinates and
other data. GPS devices can be taken into the field to record data while driving, hiking, or flying.
Ground locations are calculated by signals from satellites orbiting the Earth.
INFO A tabular DBMS used by ARC/INFO to store and manipulate feature attribute and related
tables.
intersect The topological integration of two spatial data sets that preserves features that fall
within the spatial extent common to both input data sets.
item In an attribute table, a field of information commonly displayed as a column. A single
attribute from a record in an INFO data file.
latitude-longitude A spherical reference system used to measure locations on surface. Latitude
measures angles in the north south direction and longitude measures angles in the east west
direction.
20layer A logical set of thematic data described and stored in a map library. Layers organize a map
library by subject matter, e.g., soils, roads, wells, and extend over the entire geographic area
defined by the spatial index of the map library.
line-in-polygon A spatial operation in which arcs in one coverage are overlaid with polygons in
another to determine which arcs, or portions of arcs, are contained within the polygons. Polygon
attributes are associated with corresponding arcs in the resulting line coverage.
logical selection The process of selecting a subset of features from a coverage using logical
selection criteria that operate on the attributes of coverage features (e.g., area greater than
16,000 square feet). Only those features whose attributes meet the selection criteria are selected.
Also known as feature selection by attribute.
many-to-one-relate A relate in which many records in one table are related to a single record in
another table. A goal in relational database design is to use one to many relates to reduce data
storage and redundancy.
map extent The rectangular limits (xmin,ymin,xmax,ymax) of the area of the Earth's surface you
want to display using ARC/INFO. The geographic extent specified by the minimum bounding
rectangle of a study area.
map projection A systematic conversion of locations on the Earth's surface from spherical to
planar coordinates. Several of the more popular projections are: State Plane Coordinates (SPC)
which uses feet for units of measure; Universal Transverse Mercator (UTM) which uses meters
for units of measure; and latitude and longitude which uses degrees, minutes, and seconds of arc
for units of measure.
map scale The extent of reduction needed to display a representation of the Earth's surface on a
map. A statement of a measure on the map and the equivalent measure on the Earth's surface,
often expressed as a representative fraction of distance, such as 1:24,000 (one unit in the map
equals 24,000 units on the ground).
one-to-many-relate A type of relate connecting a unique value in one file to many records (that
have the same value) in another file.
orthophotography The process of aerial photographs that have been rectified to produce an
accurate image of the Earth by removing tilt and relief displacements which occurred when the
photo was taken.
PAT Point Attribute Table. Polygon Attribute Table. A coverage can have either a point attribute
table or a polygon attribute table, but not both.
photogrammetry The science of deducing the physical dimension of objects from measurements
on photographs.
planimetric The horizontal (x,y) locations of non-topographic features, such as rivers, lakes,
buildings, roads, etc.
point-in-polygon A spatial operation in which points from one coverage are overlaid with a
polygonal coverage to determine which points fall within the polygon boundaries. Points assume
the attributes of the polygons within which they fall.
21polygon A multisided figure that represents area on a map. A feature defined by the arcs that
make up its boundary. Every polygon contains one label point within its boundary. Polygons have
attributes that describe the geographic feature they represent.
polygon overlay A process that merges spatially coincident polygons from two coverages, and
their attributes, to create a third coverage, that contains new polygons and describes new
relationships.
quadrangle (quad) Typically refers to a map sheet published by the U.S. Geological Survey, a
7.5 minute quadrangle series or the 15 minute quadrangle series. Also known as a topographic or
topo map.
raster Data displayed as discrete picture elements (pixels).
relate An operation that establishes a temporary connection between corresponding records in
two tables using an item common to both. A relate gives access to additional feature attributes
that are not stored in a single table.
relate key The common set of columns used to relate two attribute tables.
remote sensing Any of the technical disciplines for observing and measuring the Earth from a
distance, including satellite imaging, Global Positioning Systems, RADAR, SONAR, aerial
photography, etc.
resolution Measures the sharpness of an image.
Selective Availability (S/A) A U.S. Department of Defense program to limit the accuracy of
autonomous position fixes computed by civilian receivers. The error in position caused by S/A
can be up to 100 meters.
slope A measure of change in surface value over distance, expressed in degrees or as a
percentage. For example, a rise of 2 meters over distance of 100 meters describes a 2% slope.
spatial analysis The process of modeling, examining, and interpreting model results. Spatial
analysis is the process of extracting or creating new information about a set of geographic
features. Spatial analysis is useful for evaluating suitability and capability, for estimating and
predicting, and for interpreting and understanding. In GIS there are four traditional types of spatial
analysis: spatial overlay and contiguity analysis, surface analysis, linear analysis, and raster
analysis.
spatial modeling Analytical procedures applied with GIS. There are three categories of spatial
modeling functions that can be applied to geographic data within a GIS: geometric models, such
as calculating the distance between features, generating buffers, calculating areas and
perimeters, and so on; coincidence modeling, such as polygon overlay; and adjacency modeling
such as redistricting and allocation.
SQL Structured Query Language. A syntax for defining and manipulating data from a relational
database. Developed by IBM in the 1970s, it has become an industry standard for query
languages in most relational database management systems.
State Plane Coordinates (SPC) A map projection that measures distance in feet. By providing
an SPC easting (x) and northing (y), the state name, and the zone number, any location in the
United States can be identified by a unique coordinate value. SPC Zone boundaries follow state
and county boundaries. Florida, due to its size and shape is divided into three SPC zones, north,
east, and west. Volusia County is entirely within the East Zone. State Plane Coordinates are
22admirably suited to the needs of the local land surveyor and are widely used for public works,
land surveys, and for Geographic Information Systems.
TIN Triangulated Irregular Network. A series of triangles constructed using elevation data points
taken from coverages. These triangles are used for surface representation and display.
topography Shape or configuration of the land surface; represented in map form by contour
lines.
topology The spatial relationships between connecting or adjacent coverage features.
transformation The process that converts coordinates from one coordinate system to another
through translation, rotation, and scaling.
triangulation A method of surveying in the location of an object may be calculated from the
known locations of two other objects. Creating a triangle from the three items, the angles and
sides of the triangle can be measured and the location of the unknown object is calculated
algebraically.
vector A geometric element, stored as a point with x,y coordinates within a computer database.
23You can also read


