Interrogating Genomic-Scale Data to Resolve Recalcitrant Nodes in the Spider Tree of Life
←
→
Page content transcription
If your browser does not render page correctly, please read the page content below
Interrogating Genomic-Scale Data to Resolve Recalcitrant
Nodes in the Spider Tree of Life
Siddharth Kulkarni ,1,2,* Robert J. Kallal,2 Hannah Wood,2 Dimitar Dimitrov ,3 Gonzalo Giribet ,4 and
Gustavo Hormiga 1
1
 Department of Biological Sciences, The George Washington University, Washington, DC
2
 Department of Entomology, National Museum of Natural History, Smithsonian Institution, Washington, DC
3
 Department of Natural History, University Museum of Bergen, University of Bergen, Bergen, Norway
4
 Museum of Comparative Zoology, Department of Organismic and Evolutionary Biology, Harvard University, Cambridge, MA
*Corresponding author: E-mail: sskspider@gwmail.gwu.edu.
Associate editor: Larracuente Amanda

                                                                                                                                                              Downloaded from https://academic.oup.com/mbe/article/38/3/891/5912541 by guest on 28 July 2021
Abstract
Genome-scale data sets are converging on robust, stable phylogenetic hypotheses for many lineages; however, some
nodes have shown disagreement across classes of data. We use spiders (Araneae) as a system to identify the causes of
incongruence in phylogenetic signal between three classes of data: exons (as in phylotranscriptomics), noncoding regions
(included in ultraconserved elements [UCE] analyses), and a combination of both (as in UCE analyses). Gene orthologs,
coded as amino acids and nucleotides (with and without third codon positions), were generated by querying published
transcriptomes for UCEs, recovering 1,931 UCE loci (codingUCEs). We expected that congeners represented in the
codingUCE and UCEs data would form clades in the presence of phylogenetic signal. Noncoding regions derived from
UCE sequences were recovered to test the stability of relationships. Phylogenetic relationships resulting from all analyses
were largely congruent. All nucleotide data sets from transcriptomes, UCEs, or a combination of both recovered similar
topologies in contrast with results from transcriptomes analyzed as amino acids. Most relationships inferred from low-
occupancy data sets, containing several hundreds of loci, were congruent across Araneae, as opposed to high occupancy
data matrices with fewer loci, which showed more variation. Furthermore, we found that low-occupancy data sets
analyzed as nucleotides (as is typical of UCE data sets) can result in more congruent relationships than high occupancy
data sets analyzed as amino acids (as in phylotranscriptomics). Thus, omitting data, through amino acid translation or
via retention of only high occupancy loci, may have a deleterious effect in phylogenetic reconstruction.
Key words: Araneae, noncoding regions, phylogeny, target-capture, transcriptomics.

                                                                                                                                                            Article
Introduction                                                                           numbers of sites indicate conflicting relationships for a given
Massive parallel sequencing and the exponential increase in                            branch (Felsenstein 1985). Such conflicts are common among
the size of data sets have enabled researchers to use a variety                        large-scale data sets and therefore bootstrap values are gen-
of genomic data types (whole genomes, transcribed gene                                 erally high. This conundrum has impacted phylogenetic stud-
regions, introns, fast/slow evolving loci, etc.) to address spe-                       ies of many groups of organisms, including birds (Jarvis et al.
cific evolutionary questions. These data sets have rapidly                             2014; Prum et al. 2015; Walker et al. 2018; Cloutier et al. 2019),
dwarfed Sanger sequencing-based studies in terms of                                    placental mammals (Morgan et al. 2013; Romiguier et al.
amounts of data (Mardis 2011), however, they have proven                               2013), extant angiosperms (Zanis et al. 2002; Wickett et al.
to be challenging to analyze. Once celebrated as the gold                              2014; Xi et al. 2014), and arachnids (e.g., Sharma et al. 2014;
standard for inferring evolutionary histories (Gee 2003;                               Ballesteros and Sharma 2019; Lozano-Fernandez et al. 2019).
Rokas et al. 2003), it is now clear that sheer quantity of                             In the present study, we focus on the nature of the systematic
data will not unequivocally resolve all problematic nodes in                           conflict (with high bootstrap support for alternative hypoth-
a phylogeny. Conflicting but highly supported phylogenetic                             eses) across genomic data sets addressing a yet to be satis-
relationships have emerged in many data sets, even when                                factorily resolved problem in spider phylogenetics.
containing hundreds or thousands of loci.                                                 In recent studies on the spider tree of life, phylogenies
    Furthermore, the objective quantification of branch sup-                           resulting from the analysis of either transcriptomes or ultra-
port is obfuscated by widespread reliance on the bootstrap                             conserved elements (UCEs) have largely converged on similar
support metric (in a maximum likelihood framework), among                              topologies (e.g., Garrison et al. 2016; Fernandez et al. 2018;
a few others like posterior probability in a Bayesian frame-                           Kulkarni et al. 2020; Dimitrov and Hormiga 2021; Kallal et al.
work. Bootstrap values are often inflated when comparable                              forthcoming). However, incongruence persists in some
ß The Author(s) 2020. Published by Oxford University Press on behalf of the Society for Molecular Biology and Evolution.
This is an Open Access article distributed under the terms of the Creative Commons Attribution License (http://creativecommons.org/
licenses/by/4.0/), which permits unrestricted reuse, distribution, and reproduction in any medium, provided the original work is
properly cited.                                                                                                                       Open Access
Mol. Biol. Evol. 38(3):891–903 doi:10.1093/molbev/msaa251 Advance Access publication September 28, 2020                                              891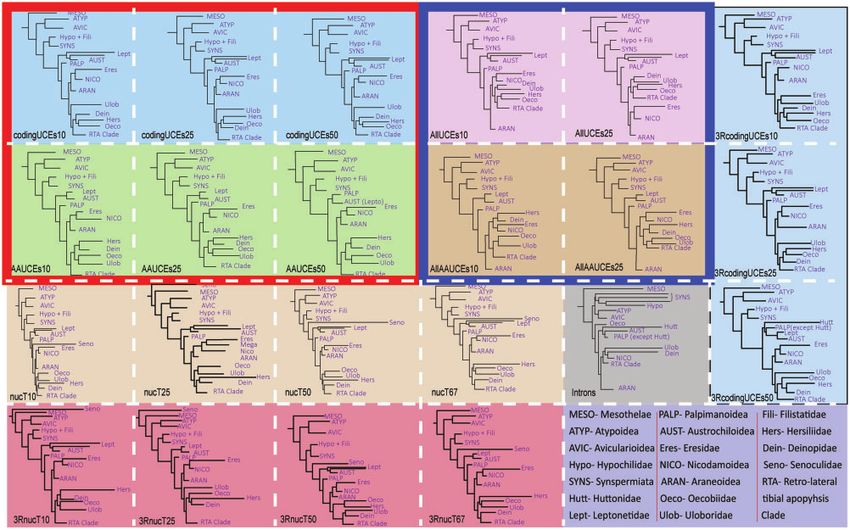
Kulkarni et al. . doi:10.1093/molbev/msaa251                                                                                MBE
recalcitrant nodes, receiving high support for contradicting         Transcriptomes, which are sequenced from mRNA, are often
hypotheses. Some of these incongruences, in the context of           analyzed as amino acids, and include only exonic regions.
spider systematics, include: 1) the placement of the RTA             UCEs on the other hand are sequenced from the genome
Clade (a group of spiders characterized by the presence of a         and are typically analyzed as nucleotides, and include both
retrolateral tibial apophysis in the male palp–the appendage         exons and noncoding regions. The possibility of combining
that male spiders use for copulation) with respect to the            the vast data sets of UCEs and transcriptomes would not only
“UDOH grade” (an assemblage containing the spider families           enable an expanded taxon sampling but also allow reconcil-
Uloboridae, Deinopidae, Oecobiidae, and Hersiliidae); 2) the         iation of the existing UCE and transcriptome data sets
placement of Nicodamoidea with respect to Araneoidea (the            (Bossert et al. 2019). Furthermore, because a recent study
ecribellate orb weavers); and, 3) the interfamilial relationships    has shown that currently sequenced UCEs in Arachnida are
of the miniature orb-weaving families—a group informally             mostly exonic (Hedin et al. 2019) it should be possible to
known as “symphytognathoids.” The “symphytognathoids”                combine UCEs and transcriptomes in a meaningful manner
(Griswold et al. 1998) include the families Anapidae,                (Bossert et al. 2019; Hedin et al. 2019).
Mysmenidae, Theridiosomatidae, and Symphytognathidae                     The present study aims to identify the causes of incongru-

                                                                                                                                           Downloaded from https://academic.oup.com/mbe/article/38/3/891/5912541 by guest on 28 July 2021
(which includes the smallest adult spider in the world, Patu         ence among transcriptome-based and UCE-based sequences
digua; Forster and Platnick 1977). Few studies have found            in phylogenetic analyses of spiders by leveraging data from
support for the monophyly of “symphytognathoids,” and a              recent studies (e.g., Garrison et al. 2016; Fernandez et al. 2018;
particular study suggests that Synaphridae also belongs to this      Kulkarni et al. 2020; Kallal et al. forthcoming). Our approach
group (Lopardo et al. 2011). Here, we focus on the relation-         was to reconstruct phylogenies using sequences from tran-
ships of the “symphytognathoid” families as a major area of          scriptomes, UCEs, and a combination of data sources, at both
conflict in the spider tree of life by comparing a diversity of      the amino acid and nucleotide levels. We then analyzed these
approaches and data classes and their effects on this partic-        data sets using different phylogenetic methods at different
ular topology.                                                       occupancy levels, while also exploring the phylogenetic signal
   The monophyly of “symphytognathoid” families has been             of noncoding regions, something rarely attempted in this
supported, although not formalized as a taxon, by morpho-            kind of phylogenetic analyses.
logical and behavioral characters (Griswold et al. 1998; Schütt         First, we hypothesize that transcriptomes contain ultra-
2003; Lopardo and Hormiga 2008; Lopardo et al. 2011;                 conserved regions. On targeting these coding ultraconserved
Hormiga and Griswold 2014), but these families have                  regions using the Spider2Kv1 probe set (Kulkarni et al. 2020),
appeared as either paraphyletic or polyphyletic in molecular         we reconstruct a phylogeny to resolve a number of selected
phylogenies based on standard Sanger markers (Dimitrov               recalcitrant nodes. The efficacy of the transcriptome-derived
et al. 2017; Wheeler et al. 2017) or transcriptomes                  UCEs for resolving phylogenetic relationships is tested by
(Fernandez et al. 2018; Kallal et al. forthcoming). Lopardo         adding multiple congeneric or confamilial taxa that represent
et al.’s (2011) extensive Sanger-based data set supported            coding UCEs, UCEs from previous studies and UCEs obtained
“symphytognathoid” monophyly only when the nucleotide                from genomes. We hypothesize that analyzing data as amino
data were analyzed in combination with phenotypic data.              acids versus nucleotides can influence the inferred phyloge-
Recently, an analysis using target enrichment methods to             netic relationships. To test this, we reconstruct and compare
capture UCEs provided the first molecular support for the            phylogenies using nucleotide and amino acid data sets from
monophyly of “symphytognathoids” (ultrafast bootstrap                sequences derived from both transcriptomes and ultracon-
>95), although only with the analyzed low-occupancy data             served regions of the genome. We found that nucleotide data
sets (Kulkarni et al. 2020). This result was surprising, given the   sets converge on a similar topology—including the recovery
lack of support for symphytognathoid monophyly in all prior          of the symphytognathoid representatives as a clade—
molecular analyses, including phylogenomic data sets ana-            whereas amino acid data sets did not. This outcome suggests
lyzed as amino acid data in a maximum likelihood framework           that reducing the number of characters included in nucleo-
(Kallal et al. forthcoming). In that study, the parsimony anal-      tide data sets via translation to amino acids is detrimental to
ysis of the amino acid data set recovered Theridiosomatidae          the topological stability of phylogenetic inference.
as the sister group of Araneidae, with the remaining
“symphytognathoids” forming a monophyletic group (Kallal             Results and Discussion
et al. forthcoming).                                                 Statistics for all analyzed data sets are listed in supplementary
   The paradox of highly supported but incongruent relation-         table 1, Supplementary Material online. A few clarifications
ships requires a critical assessment of the nature of the data       are provided here.
being analyzed, in our case, in the context of the high boot-
strap support for both, the monophyly or polyphyly of                CodingUCEs
“symphytognathoids” in different analyses. The phylogenetic          With the current taxon sample, 2,019 loci were obtained
relationships of the miniature orb weavers offer an excellent        (before occupancy filtering), out of which 1,931 UCEs were
system to explore the nature of conflict between these two           recovered from the transcriptomes analyzed in Fernandez
types of genomic data sets. One possible approach, albeit            et al. (2018). This means that the transcriptomic analysis of
unexplored up to this point, is to identify the phylogenetic         Fernandez et al. (2018) contained at least 1,931 coding UCE
signal common to transcriptomic and UCE data sets.                   regions, out of the 2,021 possible UCEs targeted by the spider
892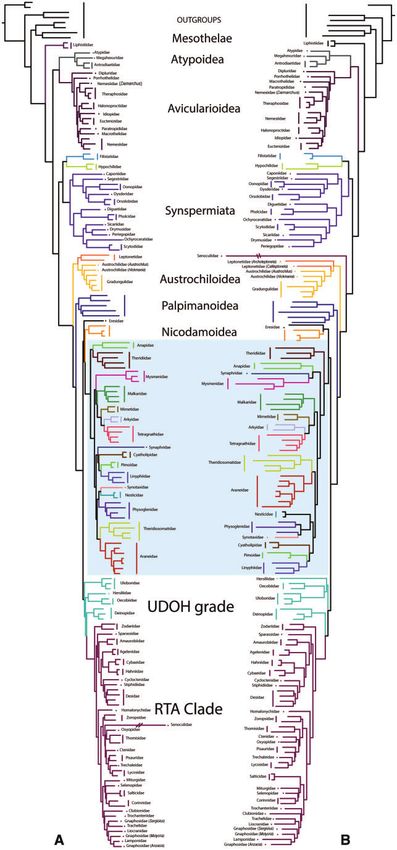
Resolving Recalcitrant Nodes Through Genomic Interrogation . doi:10.1093/molbev/msaa251                                   MBE
probe set of Kulkarni et al. (2020) (95.5%), making both data           All data sets (except noncoding) included a unanimously
sets nearly identical in gene composition, and thus straight-       strong UFBoot support (>95%) for the major Araneae line-
forward to combine. The number of UCEs recovered from               ages such as Mesothelae, Opisthothelae, Mygalomorphae,
individual transcriptomes (i.e., taxon-wise) ranged between         and Araneomorphae (figs. 1 and 2; supplementary table 2,
62 and 897 (m ¼ 436.18) (supplementary table 2,                     Supplementary Material online). Within Araneomorphae,
Supplementary Material online). Two taxa out of a total of          conflicting relationships were recovered within the family
six nonspider outgroup taxa, Phrynus marginemaculatus and           Leptonetidae and the relationships among the UDOH fami-
Limulus polyphemus, yielded too few UCE loci, so they were          lies, and with Araneoidea and the RTA Clade (figs. 1 and 2;
omitted from the final data set.                                    supplementary table 2, Supplementary Material online, see
                                                                    supplementary trees, Supplementary Material online). To
AllUCEs                                                             briefly describe these conflicts, the UDOH families formed a
This data set included a combination of the taxon sample of         clade with AllAAUCEs, but constituted a grade in the analyses
UCEs recovered from the transcriptomes (Fernandez et al.           of all other data sets. Araneoidea was recovered as the sister
2018) and UCEs (Kulkarni et al. 2020). Three ingroup species        group to Nicodamoidea plus Eresidae in the analyses of all the

                                                                                                                                         Downloaded from https://academic.oup.com/mbe/article/38/3/891/5912541 by guest on 28 July 2021
(Amaurobius ferox, Deinopis longipes, and Nesticus cooperi)         data sets except AllUCEs10 and its amino acid data sets (fig. 2).
were removed from the AllUCEs50 data set because they               The placement of the long Senoculidae branch varied across
did not have any locus represented in the final alignment.          analyses from nesting within the RTA Clade to a sister group
This data set (AllUCEs50), with only 21 loci, resulted in a         to the Araneae branch. This recalcitrance may be indicative of
phylogeny in which many families were polyphyletic and              a poor sequence quality.
thus, we have excluded this tree topology (see supplementary
                                                                    Phylogenomic Data as Amino Acids versus
trees, Supplementary Material online) from our further anal-
yses and discussion.
                                                                    Nucleotides
                                                                    Phylogenies resulting from the transcriptome data analyzed
Noncoding                                                           as amino acids (Fernandez et al. 2018; fig. 3A of this study) and
Six terminals (Bothriurus keyserlingi, Centruroides sculpturatus,   as nucleotide sequences (nucT67 data set, fig. 3B) at an oc-
Sofanapis antillanca, Euryopis sp., Nesticus gertschi, and          cupancy of 67% were congruent at many nodes. Notable
Chediminae sp.) were likewise removed from the phyloge-             differences were found among the UDOH families and in
netic analyses because they were represented by very few            the internal arrangement of Araneoidea. Although
                                                                    Deinpoidae was sister group to the RTA Clade in both trees,
(95% UFBoot), codingUCEs
strap (UFBoot) replicates are respectively mentioned in             (>95% UFBoot), and AAUCEs10 (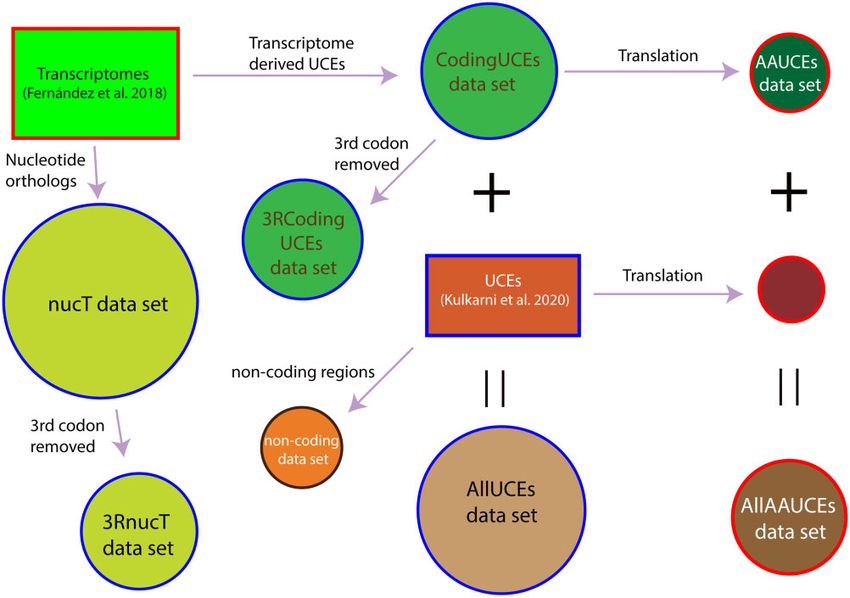
Kulkarni et al. . doi:10.1093/molbev/msaa251 MBE
Downloaded from https://academic.oup.com/mbe/article/38/3/891/5912541 by guest on 28 July 2021
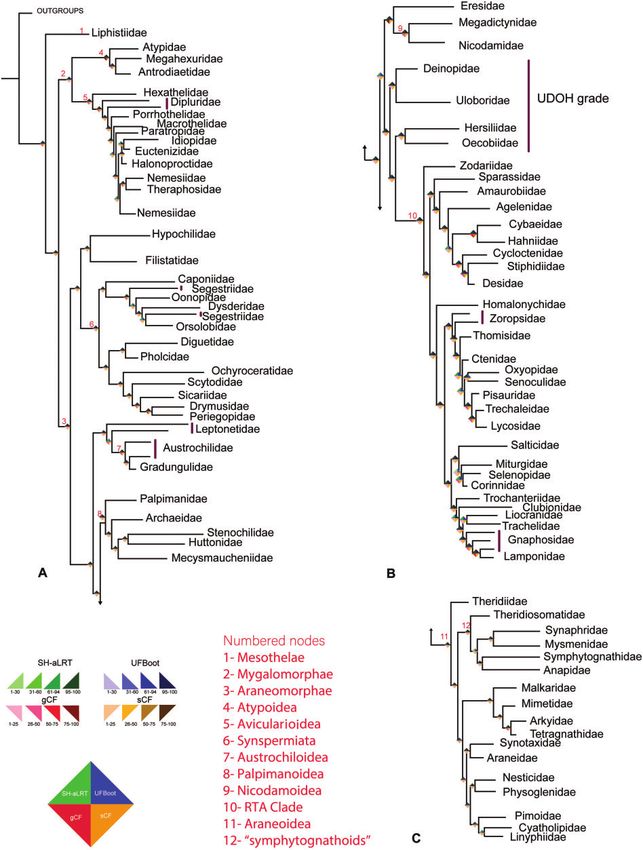
FIG. 1. Maximum likelihood phylogeny of spiders resulting from the AllUCEs10 data set (occupancy 10, 1,060 loci) collapsed to family level.
Paraphyly is indicated by vertical violet bars. (A) All major lineages of spiders at family level except the RTA Clade and Araneoidea; (B) RTA Clade;
(C) All 17 families of superfamily Araneoidea. The rhombi at the nodes indicate four support values: Shimodaira–Hasegawa-like approximate
likelihood ratio test (left top), ultrafast bootstrap (right top), gene concordance factor (gCF) (left bottom), and site concordance factor (sCF) (right
bottom). The numbers at the node indicate clades as described. Branch lengths are not to be scaled. For the original sampled tree, see supple-
mentary figure 2, Supplementary Material online.
894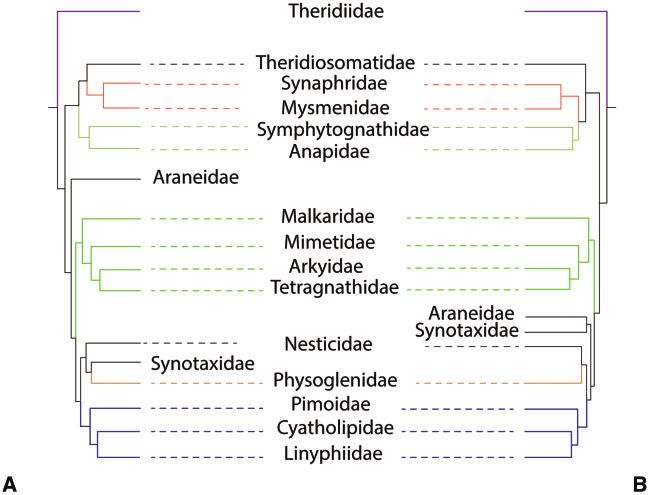
Resolving Recalcitrant Nodes Through Genomic Interrogation . doi:10.1093/molbev/msaa251                                              MBE

                                                                                                                                                     Downloaded from https://academic.oup.com/mbe/article/38/3/891/5912541 by guest on 28 July 2021
FIG. 2. Maximum likelihood phylogenies of spiders resulting from different data sets at various occupancies. Each colored box indicates a data set
corresponding to supplementary table 2, Supplementary Material online. The first and second rows represent phylogenies resulting from data
analyzed as nucleotides and amino acids, respectively, of codingUCEs (outlined red) and AllUCEs (outlined blue).

1994, 2008; Hormiga and Tu 2008), six standard Sanger                       3RcodingUCEs50        data     set    yielded     a    paraphyletic
markers (Arnedo et al. 2009; Dimitrov et al. 2017; Wheeler                  Palpimanoidea.
et al. 2017), and transcriptomes (Fernandez et al. 2018).
   Gnaphosidae was paraphyletic in both Fernandez et al.                   Noncoding Regions
(2018) (supplementary fig. 3A, Supplementary Material on-                   All spider families were monophyletic with good support
line) and the current study (figs. 1 and 3B; supplementary fig.             (>95% UFBoot), however most interfamilial relationships
3B, Supplementary Material online). In the current study,                   and deeper nodes received poor support (see supplementary
Lamponidae nested within Gnaphosidae, whereas, in                           trees, Supplementary Material online). Many groups that
Fernandez et al. (2018), Trachelidae, Liocranidae, and                     were corroborated with all other data sets were recovered
Lamponidae nested within Gnaphosidae. Optimized taxon                       differently when noncoding regions were analyzed alone. For
sampling in this part of the tree would be required to stabilize            example, mygalomorphs were the sister group of a paraphy-
these relationships.                                                        letic Synspermiata that included Hypochilidae, and the aus-
                                                                            trochiloids were nested within Palpimanoidea and
Removal of Third Codon Positions                                            polyphyletic UDOH families (fig. 2). These unusual relation-
Including third codon positions in phylogenetic analyses may                ships could be an artifact due to the overall small amount of
influence inferred relationships due to saturation of synony-               data included in this data set; a similar pattern was also ob-
mous nucleotide substitutions and rate heterogeneity, there-                served when analyzing high occupancy (>70%) coding region
fore explaining differences between analyzing data as amino                 data sets (supplementary file, Supplementary Material on-
acids and nucleotides, and thus, some authors recommend                     line). The high variability in sizes of noncoding regions be-
exclusion of saturated third codon positions (e.g., Breinholt               tween distantly related taxa also requires an evaluation of the
and Kawahara 2013; O’Connor et al. 2014). In our study, the                 potential effect of alignment schemes on resulting relation-
trees resulting from the analyses with (codingUCEs and nucT                 ships. Analyzing them together with exons, as in AllUCEs,
data sets) and without (3RcodingUCEs and 3RnucT data sets)                  could be a useful strategy since the conserved coding regions
third codon positions were congruent at most nodes. The                     may alleviate the effects of alignment procedures. The use of
differences were as follows: the 3RcodingUCEs10 data set                    appended exonic regions to align noncoding regions needs
yielded Eresidae as the sister group of Uloboridae whereas                  further exploration. HybPiper recovers nonexonic regions
in all the other data sets with the third codon positions re-               which may also include intergenic regions in addition to non-
moved, Eresidae was sister group to Nicodamoidea and the                    coding regions, which are difficult to parse.
                                                                                                                                              895
Kulkarni et al. . doi:10.1093/molbev/msaa251 MBE
Downloaded from https://academic.oup.com/mbe/article/38/3/891/5912541 by guest on 28 July 2021
FIG. 3. Comparison of phylogenetic relationships between (A) transcriptomic phylogeny as published by Fernandez et al. (2018) using amino acids, and (B)
nucT (Fernandez et al. 2018, transcriptome data set analyzed as nucleotides). Both phylogenies were constructed using occupancy of 67%. The highlighted blue
box indicates Araneoidea families.
896Resolving Recalcitrant Nodes Through Genomic Interrogation . doi:10.1093/molbev/msaa251 MBE
Downloaded from https://academic.oup.com/mbe/article/38/3/891/5912541 by guest on 28 July 2021
FIG. 4. Comparison of interfamilial relationships of Araneoidea. (A) AllAAUCEs tree, (B) AllUCEs tree. Occupancy of both phylogenies was 10%.
Colored branches indicate family relationships that are congruent in both trees.
Monophyly of the Miniature Orb Weavers rendered the “symphytognathoid” families polyphyletic (table
The “symphytognathoids” were monophyletic in the trees 2 and supplementary trees, Supplementary Material online).
resulting from the analyses of the codingUCEs, AAUCEs, The inclusion of Synaphridae within “symphytognathoids”
AllUCEs, AllAAUCEs, and nucT, except AAUCEs50 and had been suggested before (Lopardo and Hormiga 2008;
nucT67 which recovered Theridiosomatidae as sister group Lopardo et al. 2011), although these studies were cautious
to Araneidae whereas the remaining “symphytognathoids” about such placement due to the absence of Cyatholipidae
formed a clade. In the AllUCEs tree (fig. 4), this clade included representatives in their analyses. Fernandez et al. (2018) found
the families Anapidae, Mysmenidae, Symphytognathidae, Synaphridae to be the sister group of the linyphioid clade.
Synaphridae, and Theridiosomatidae (100/100 UFBoot/SH- Because Kulkarni et al. (2020) did not include any synaphrid,
aLRT for the whole clade), whereas the codingUCEs included its position using strictly UCE data could not be tested. We
all these families except Symphytognathidae (not sampled). included a synaphrid exemplar, Cepheia longiseta (from
The family Synaphridae was sister group to Mysmenidae in Fernandez et al. 2018), and our results corroborate the place-
AllUCEs (100/100%), whereas it was sister group to Anapidae ment of Synaphridae within the “symphytognathoid” clade.
in codingUCEs phylogenies. Only 2.29% of loci (24 loci) and The monophyly of “symphytognathoids” is supported by
29.5% of sites (68,655 sites) support the monophyly of several morphological synapomorphies (Lopardo et al. 2011).
“symphytognathoids” in the AllUCEs10 data set (fig. 1), mean- Although morphology and UCEs support the monophyly of
ing that the remaining sites and loci support alternative rela- “symphytognathoids,” six-gene Sanger-based data and
tionships in lower fractions. In the trees resulting from the sequences from transcriptomes analyzed as amino acids do
analyses of the other data sets, AllUCEs, AllAAUCEs, not support “symphytognathoid” monophyly (Lopardo et al.
codingUCEs, and nucT, Theridiosomatidae was the sister 2011; . Dimitrov et al. 2012, 2017; Wheeler et al. 2017;
group of the remaining “symphytognathoids” with two Fernandez et al. 2018; Kallal et al. forthcoming). Unstable
exceptions of high occupancies, as mentioned above and conflicting “symphytognathoid” familial relationships
(AAUCEs50 and nucT67). The AllAAUCEs recovered hinder addressing questions about the evolution of their
Theridiosomatidae as sister group to Synaphridae plus unique diversity of web architectures, transformations in fe-
Mysmenidae and this clade was sister group to male pedipalps (reduction and loss), and transformations of
Symphytognathidae plus Anapidae (fig. 4, see supplementary their respiratory systems. For example, although referred to as
files, Supplementary Material online). The removal of third miniature “orb weavers,” anapid web architecture is quite
codon positions from the transcriptomes analyzed as nucleo- variable as they are known to build typical orb webs and their
tides (3RnucT data sets) supported “symphytognathoid” modifications, sheet webs or, theridiid-like cobwebs. Most
monophyly at occupancies of 10%, 25%, and 50%, whereas mysmenids build spherical or planar orbs, symphytognathids
at 67% occupancy, Theridiosomatidae was the sister group of build a 2D horizontal orb web, at least some synaphrids build
Araneidae and the other “symphytognathoid” families sheet or irregular webs, and theridiosomatids build orb webs,
formed a clade. The removal of third codon positions from some of them highly modified (e.g., sticky lines connected to
UCEs derived from transcriptomes (3RcodingUCEs data sets) water surface) (Coddington and Valerio 1980; Eberhard 1987;
897Kulkarni et al. . doi:10.1093/molbev/msaa251 MBE
Rix and Harvey 2010; Lopardo et al. 2011). In each of these and deeper nodes (fig. 1). Several alternative placements, in-
“symphytognathoid” families (except Synaphridae), there is at cluding that of leptonetids, nicodamoids with respect to
least one genus with a kleptoparasitic lifestyle accompanied Araneoidea and the UDOH families, had high UFBoot within
by loss of the foraging web in all its constituent species. Adult our trees (see supplementary files, Supplementary Material
anapid females have either reduced segments in the pedipalp, online) and also compared with the trees of Fernandez et al.
a knob-like protuberance, or have lost the palp entirely, like (2018).
their putative sister family Symphytognathidae. Female ped-
ipalps in the remaining “symphytognathoid” families bear all Occupancy and Missing Data
the segments, like all other spiders. Our results show that high occupancy data sets may yield
Our results and those from Kulkarni et al. (2020) indicate unstable relationships due to the small number of genes often
that “symphytognathoids” are monophyletic when analyzed represented in such data sets (fig. 2 and supplementary table
as nucleotide data and when about a hundred or more loci 2 and supplementary trees, Supplementary Material online).
are available. There is also a clear tradeoff between occupancy A similar phenomenon of unusual relationships at high oc-
and phylogenetic signal. Low-occupancy data matrices con- cupancies was observed in phylogenetic analyses of spider
Downloaded from https://academic.oup.com/mbe/article/38/3/891/5912541 by guest on 28 July 2021
tain more missing data than high occupancy data sets, and transcriptomes (Kallal et al. forthcoming). Low-occupancy
missing data can influence the outcome of phylogenetic anal- data sets contain larger amounts of data but also contain
yses, both topologically and in branch lengths (Lemmon et al. larger amounts of missing data. An increase in the proportion
2009). In the case of “symphytognathoids,” a high occupancy of missing data is known to increase the risk of systematic
data set of 70% with 433 loci (“500Spid_70” data set of error (Roure et al. 2013). However, recent empirical studies
Kulkarni et al. [2020]) also supported “symphytognathoid” with genome-scale data have shown that excluding genes
monophyly, suggesting that miniature orb-weaving spiders with high amounts of missing data may weaken the resolu-
are indeed a lineage. tion and consistency of the resulting tree (Prasanna et al.
2020). Chan et al. (2020) found that different data classes
Unstable Nodes in the Spider Tree of Life such as UCEs, exons, and introns contain different phyloge-
The phylogenetic relationships of the UDOH group of families netic signal; however, an unfiltered combination (low occu-
relative to the RTA Clade and the interfamilial relationships of pancy) of such data converged on a similar topology. One
Araneoidea vary across analytical conditions, depending on study suggests that if by allowing more missing data, taxon,
the type (coding or coding plus noncoding) and amounts of and gene sampling can be improved, the lower occupancy
data. For example, in the case of Araneoidea, coding data matrices should be preferred (Streicher et al. 2016). In addi-
(codingUCE, AAUCE, nucT) exclusively recover this clade as tion, allowing missing data may allow to detect gene gains/
sister group to Nicodamoidea plus Eresidae. However, when losses specific to certain lineages. Such information may be
combined with nonexonic data, Araneoidea is sister group to lost in high occupancy data sets due to the exclusion of genes
a clade consisting of Nicodamoidea plus Eresidae, the RTA present in some clade versus sequencing failures. CAT þ C
Clade, and the UDOH families–with the exception of the models may alleviate systematic error (Roure et al. 2013) but
AllUCEs25 data set. The UDOH grade consists of this was not tested in the present study. Evaluation of model
Uloboridae, Deinopidae, Oecobiidae, and Hersiliidae, of which adequacy (Ripplinger and Sullivan 2010; Duch^ene et al. 2018)
the first two families are the only cribellate orb-weaving may be a potential next step to further improve the phylo-
groups, whereas all remaining orb-weaving spider families genetic inference of the evolutionary history of spiders, but
are ecribellate and placed within Araneoidea. On the other our goal here was to evaluate for the first time the use of
hand, exploration of molecular data across a variety of ana- amino acids versus DNA.
lytical treatments has shown that many nodes in the spider
tree of life are stable across different occupancies. For exam- Conclusions
ple, the sister group relationship of Nicodamoidea and We have used spiders (Araneae) as a study system to address
Eresidae, the Hypochilidae plus Filistatidae clade, the mono- incongruence among different classes of genomic data in
phyly of Synspermiata, and the “symphytognathoid” clade are phylogenetic analyses. We scrutinized sequence data from
all robust hypotheses. different sources (i.e., mRNA and DNA) and analyzed the
protein-coding regions either as amino acids or as nucleoti-
Nodal Support Values des, with and without third codon positions; we also analyzed
Overall, we found that the gene concordance and site con- noncoding regions. All data sets, except the noncoding data,
cordance factor values were correlated (supplementary fig. 1a converged upon a similar pattern of phylogenetic relation-
and c, Supplementary Material online). The UFBoot was 100% ships, which was also similar to the trees derived from low-
for most nodes and the SH-aLRT was mostly >85% (fig. 1 and occupancy matrices resulting from the analysis of UCEs from
supplementary fig. 2, Supplementary Material online). Both genomic data (Kulkarni et al. 2020). It is clear that lower
concordance factors were >50% for congeneric taxa (fig. 1), amounts of data either due to amino acid translation, increas-
meaning that >50% of the sites and loci support the mono- ing matrix occupancy, or both, can cause topological conflicts
phyly of those genera. Gene and site concordance values at some nodes in the spider tree of life and with the sequenc-
ranged between 1% and 95%. These values were generally ing strategies employed here. Although a threshold cannot be
>50% for congeneric taxa and were lower between families established as to how much data are optimal to resolve such
898Resolving Recalcitrant Nodes Through Genomic Interrogation . doi:10.1093/molbev/msaa251 MBE
topological conflicts, at least 500 loci seem necessary, based adapters were trimmed with Trim Galore! 0.2.6 (http://
on our results. Our results suggest that using nucleotide data www.bioinformatics.babraham.ac.uk/projects/trim_galore,
and/or low occupancies to analyze thousands of loci may last accessed January 10, 2020) by setting the quality param-
prove to be a better strategy for studying higher level phylo- eter to 30 and a phred cut-off to 33; reads shorter than 25 bp
genetic relationships than using amino acids and high occu- were discarded. Ribosomal RNA was filtered using the default
pancies which would yield a much smaller data set. settings in Bowtie 2.9.9 (Langmead and Salzberg 2012). De
Conflicting results are more difficult to interpret when novo strand-specific assemblies were generated using Trinity
mutually exclusive alternative relationships are highly sup- 2.0.6 (Grabherr et al. 2011; Haas et al. 2013) with a path re-
ported, particularly when using bootstrapping as a measure inforcement set to 75. Redundancy reduction was done using
of support on large data sets. Hence, alternative branch sup- CD-HIT-EST (Fu et al. 2012) with 95% global similarity.
port measures that are computationally tractable for Assemblies were completed using the Colonial One High
genome-scale data sets, like concordance factors, need to Performance Computing Cluster at The George
be further explored. Washington University and the Smithsonian Institution
In the interest of spider systematics, we demonstrate that
Downloaded from https://academic.oup.com/mbe/article/38/3/891/5912541 by guest on 28 July 2021
High Performance Cluster at the Smithsonian Institution.
phylogenetic incongruences can be reduced by analyzing Unlike in previous phylotranscriptomic analyses of spiders
genome-scale nucleotide data sets, especially at low occupan- (Bond et al. 2014; Fernandez et al. 2014, 2018; Sharma et al.
cies. Some of the contentious hypotheses, such as the phy- 2014; Zhao et al. 2014; Garrison et al. 2016), the final DNA
logeny of “symphytognathoids,” were impacted by the data
sequences were not translated to amino acids.
class, composition, and taxon sampling used. We recovered a
congruent support for their monophyly across a range of low-
occupancy data sets. This robustly supported hypothesis on Recovering UCEs from Transcriptomes
the phylogenetic relationships of the miniature orb-weaving The FASTA files of transcriptomes resulting from CD-HIT-EST
families will provide an opportunity to unravel the evolution- were converted to 2-bit format using faToTwoBit, (Kent
ary history of foraging webs. 2002). Then, in the PHYLUCE environment (publicly available
at https://phyluce.readthedocs.io/en/latest/tutorial-three.
Materials and Methods html), we created a temporary relational database to sum-
Taxon Sampling marize probe to assembly match using: phyluce_probe_run_-
The ultraconserved sequences (UCEs) for this study were multiple_lastzs_sqlite function on the 2-bit files.The
obtained from a series of studies focusing on arachnids, in- ultraconserved loci were recovered by the phyluce_probe_sli-
cluding Starrett et al. (2017), Wood et al. (2018), and Kulkarni ce_sequence_from_genomes command. The resulting FASTA
et al. (2020). Transcriptomes were obtained from Bond et al. files were treated as contigs and used to match the reads to
(2014), Fernandez et al. (2014, 2018), Garrison et al. (2016), the Spider2Kv1 probes.
Sharma et al. (2014), and Zhao et al. (2014). Ultraconserved
loci were also retrieved from publicly available spider Analyzing UCEs as Amino Acids
genomes of Latrodectus hesperus (Theridiidae; i5K The nucleotide reads from UCE and transcriptome contigs
Consortium 2013), Loxosceles reclusa (Sicariidae; i5K were assembled, aligned, trimmed, and processed to obtain
Consortium 2013), Trichonephila clavipes (Araneidae; Babb selected loci with taxon occupancies of 10%, 25%, and 50%
et al. 2017), Parasteatoda tepidariorum (Theridiidae; using PHYLUCE. All locus files in nexus format were con-
Schwager et al. 2017), and Stegodyphus mimosarum verted to fasta form and translated to amino acids using
(Eresidae; Sanggaard et al. 2014). Outgroups include the seqmagick (https://seqmagick.readthedocs.io/en/latest/).
horseshoe crab L. polyphemus and Tachypleus tridentatus These translated UCE loci were concatenated using
(Xiphosura); the scorpions B. keyserlingi, C. sculpturatus, HybPiper (Johnson et al. 2016).
Chaerilus celebensis, and Pandinus imperator (Scorpiones);
the whip-spiders Damon variegatus, Damon sp., and
P. marginemaculatus (Amblypygi); the vinegaroon Analyzing Transcriptomes as Nucleotides
Mastigoproctus giganteus (Uropygi) and the short-tailed The FASTA files of transcriptomes resulting from CD-HIT-EST
whip-scorpion Stenochrus portoricensis (Schizomida). The were translated to amino acids using Transdecoder (Haas
analysis was rooted using Xiphosura since it is the only mem- et al. 2013). Orthologs were recovered from the peptide reads
ber outside Arachnopulmonata, irrespective of whether we using BUSCO (Sim~ao et al. 2015). Nucleotide data with ortho-
follow the traditional hypothesis of Xiphosura being an out- log indices and gene files were obtained using NOrthGen
group to Arachnida (e.g., Lozano-Fernandez et al. 2019), or (https://github.com/sskspider/NOrthGen; supplementary fig.
the alternative hypothesis placing them within Arachnida 4, Supplementary Material online). Gene files were aligned
(see Ballesteros and Sharma 2019). using MAFFT v7 (Katoh and Standley 2013) and trimmed
using trimAl v1.2 (Capella-Gutierrez et al. 2009). All orthologs
Transcriptome Assembly were concatenated using the HybPiper (Johnson et al. 2016).
Raw sequences were corrected for read errors using Third codon positions were removed using rmThirdCodon
Rcorrector (Song and Florea 2015). Low-quality reads and (https://github.com/iamciera/rmThirdCodon).
899Kulkarni et al. . doi:10.1093/molbev/msaa251 MBE
Downloaded from https://academic.oup.com/mbe/article/38/3/891/5912541 by guest on 28 July 2021
FIG. 5. Schematic representation of data classes analyzed in this study in a maximum likelihood framework. Squares indicate original data sets from
Fernandez et al. (2018) and Kulkarni et al. (2020), and circles indicate matrices analyzed in our study. Circles with red outline indicate amino acid
data set, black outline indicates noncoding region data set, and the circles with outline indicate nucleotide data sets. UCE, ultraconserved
elements.
Obtaining Noncoding Regions eight data sets (supplementary table 2, Supplementary
Noncoding regions were extracted from the raw UCE se- Material online), as follows. All data sets (fig. 5) were analyzed
quence files obtained from Starrett et al. (2017), Wood at different occupancies, for a total of 15 different analyses
et al. (2018), and Kulkarni et al. (2020). A target file database (supplementary table 2, Supplementary Material online):
of exons was compiled using UCEs extracted from the tran-
scriptomes of D. variegatus, Lo. deserta, Nicodamidae sp., (1) codingUCEs data set: The UCEs recovered from transcrip-
T. clavipes, Hebestatis theveneti, Palpimanus gibbulus, tomes and analyzed as nucleotide sequences with all co-
Kukulcania hibernalis, S. mimosarum, Liphistius malayanus, don positions at occupancies of 10%, 25%, and 50%. This
Anahita punctulata, and Megahexura fulva from Fernandez data set contains only exons that are ultraconserved.
et al. (2018) and the genome of Par. tepidariorum (Schwager (2) AAUCEs data set: Sequences from codingUCEs, above,
et al. 2017). These taxa were chosen to represent Araneae- were translated to amino acids and analyzed at occupan-
wide samples and their closest relatives used as outgroups. cies of 10%, 25%, and 50%.
HybPiper (Johnson et al. 2016) was run on the raw UCE se- (3) AllUCEs data set: The codingUCEs data set was combined
quence files and matched against the target file. After exon with the UCEs from taxa included in Kulkarni et al. (2020)
matching was completed, we used the retriever pipeline to analyzed at occupancies of 10%, 25%, and 50%. This data set
extract the noncoding sequences from the raw UCE sequen- of UCEs contains both exons as well as noncoding regions.
ces. Small sequencesResolving Recalcitrant Nodes Through Genomic Interrogation . doi:10.1093/molbev/msaa251 MBE
(6) noncoding regions data set: Noncoding regions obtained Environmental Biology 1754262 to G.H., G.G., and Sarah
from the UCE data set of Kulkarni et al. (2020). Boyer). The authors are grateful to Silas Bossert, Amey
(7) 3RcodingUCEs data set: Third codon removed from the Uchgaonkar, Nicolas Hazzi, Ligia Benavides, and Rosa
codingUCEs data set. Fernandez for discussions. The authors would like to thank
(8) 3RnucT data set: Third codon removed from the nucT Martın J. Ramırez and two anonymous reviewers as well as
data set. the Editors for their time and effort reviewing this article.
Contigs from all DNA sequences were matched to the Author Contributions
Spider2Kv1 probe set (Kulkarni et al. 2020) at minimum cov-
erage and minimum identity of 65 each. Phylogenetic analyses All authors contributed to designing the study and writing
were performed on the unpartitioned, concatenation of loci the article. S.K. and R.J.K. conducted the analyses.
using IQ-TREE v.1.6.9 (Nguyen et al. 2015). Model selection
Data Availability
was allowed for each data set using the TEST function of
ModelFinder in IQ-TREE (Kalyaanamoorthy et al. 2017; Sequences from the data sets of Fernandez et al. (2018) and
Kulkarni et al. (2020) were analyzed in this study. No new data
Downloaded from https://academic.oup.com/mbe/article/38/3/891/5912541 by guest on 28 July 2021
Hoang et al. 2018).
Nodal support was estimated via 1,000 UFBoot replicates were generated in support of this research. The scripts for
(Hoang et al. 2018) and Shimodaira–Hasegawa-like approxi- NOrthGen are available at https://github.com/sskspider/
mate likelihood ratio test (SH-aLRT) (Guindon et al. 2010). To NOrthGen.
reduce the risk of overestimating branch support with
UFBoot due to model violations, we appended the command References
-bnni. With this command, the UFBoot optimizes each boot- Arnedo MA, Hormiga G, Scharff N. 2009. Higher-level phylogenetics of
strap tree using a hill-climbing nearest-neighbor interchange linyphiid spiders (Araneae, Linyphiidae) based on morphological and
search based on the corresponding bootstrap alignment molecular evidence. Cladistics 25(3):231–262.
(Hoang et al. 2018). We used concordance factors, a metric Babb PL, Lahens NF, Correa-Garhwal SM, Nicholson DN, Kim EJ,
focusing on whether the best tree represents the signal well, Hogenesch JB, Kuntner M, Higgins L, Hayashi CY, Agnarsson I, et
as implemented in IQ-TREE v1.7-betaX (Minh et al. 2020). al. 2017. The Nephila clavipes genome highlights the diversity of
spider silk genes and their complex expression. Nat Genet.
Gene concordance factor (gCF) indicates the percentage of 49(6):895–903.
gene trees containing a given branch in the maximum likeli- Ballesteros JA, Sharma P.2019. A critical appraisal of the placement of
hood tree and site concordance factor (sCF) indicates the Xiphosura (Chelicerata) with account of known sources of phyloge-
percentage of decisive alignment sites supporting a branch netic error. Syst Biol. 68(6):896–917.
(Minh et al. 2020) and it provides insights into incomplete Bond JE, Garrison NL, Hamilton CA, Godwin RL, Hedin M, Agnarsson I.
lineage sorting which may be a cause for discordance between 2014. Phylogenomics resolves a spider backbone phylogeny and
rejects a prevailing paradigm for orb web evolution. Curr Biol.
the sites and the resulting trees (Zhang et al. 2019). We 24(15):1765–1771.
mapped the gCF against sCF with respect to UFBoot and Bossert S, Murray EA, Almeida EAB, Brady SG, Blaimer BB, Danforth BN.
the SH-aLRT using R version 3.6.0 (R Core Team 2019). 2019. Combining transcriptomes and ultraconserved elements to
We chose our preferred tree to guide the discussion of the illuminate the phylogeny of Apidae. Mol Phylogenet Evol.
results by conducting topology tests, namely, approximately 130:121–131.
Breinholt JW, Kawahara AY. 2013. Phylotranscriptomics: saturated third
unbiased (AU), bootstrap proportion, SH-aLRT, Kishino–
codon positions radically influence the estimation of trees based on
Hasegawa, and expected likelihood weight using 10,000 next-gen data. Genome Biol Evol. 5(11):2082–2092.
resampling-estimated log-likelihoods in IQ-TREE among the Capella-Gutierrez S, Silla-Martınez JM, Gabaldon T. 2009. trimAl: a tool
AllUCEs data set. for automated alignment trimming in large-scale phylogenetic anal-
yses. Bioinformatics 25(15):1972–1973.
Supplementary Material Chan KO, Hutter CR, Wood PL, Jr, Grismer LL, Brown RM. 2020. Larger,
unfiltered datasets are more effective at resolving phylogenetic con-
Supplementary data are available at Molecular Biology and flict: introns, exons, and UCEs resolve ambiguities in Golden-backed
Evolution online. frogs (Anura: Ranidae; genus Hylarana). Mol Phylogenet Evol.
151:106899.
Acknowledgments Cloutier A, Sackton TB, Grayson P, Clamp M, Baker AJ, Edwards SV. 2019.
All analyses were conducted on the Colonial One High Whole-genome analyses resolve the phylogeny of flightless birds
(Palaeognathae) in the presence of an empirical anomaly zone.
Performance Computing Facility at The George
Syst Biol. 68(6):937–955.
Washington University. S.K. was supported by a Weintraub Coddington J, Valerio C. 1980. Observations on the web and behavior of
Fellowship and by the Harlan Research Fund. This study was Wendilgarda spiders (Araneae: Theridiosomatidae). Psyche 87(1–
supported by the US National Science Foundation (Grant 2):93–105.
Nos Division of Environmental Biology 1457300 and Dimitrov D, Lopardo L, Giribet G, Arnedo MA, A lvarez-Padilla F,
1457539 to G.H. and G.G.) and through multiple Putnam Hormiga G. 2012. Tangled in a sparse spider web: single origin of
orb weavers and their spinning work unravelled by denser taxo-
Expedition Grants from the Museum of Comparative
nomic sampling. Proc R Soc B. 279(1732):1341–1350.
Zoology to G.G. Additional support was provided by US Dimitrov D, Benavides LR, Arnedo MA, Giribet G, Griswold CE, Scharff N,
National Science Foundation (Grant Nos. Division of Hormiga G. 2017. Rounding up the usual suspects: a standard target-
Environmental Biology 1754289, 1754278, and Division of gene approach for resolving the interfamilial phylogenetic
901Kulkarni et al. . doi:10.1093/molbev/msaa251 MBE
relationships of ecribellate orb-weaving spiders with a new family- Johnson MG, Gardner EM, Liu Y, Medina R, Goffinet B, Shaw AJ, Zerega
rank classification (Araneae, Araneoidea). Cladistics 33(3):221–250. NJC, Wickett NJ. 2016. HybPiper: extracting coding sequence and
Dimitrov D, Hormiga G. 2021. Spider diversification through space and introns for phylogenetics from high-throughput sequencing reads
time. Annu Rev Entomol. 66:11.1–11.17. using target enrichment. Appl Plant Sci. 4(7):1600016.
Duch^ene DA, Sebastian D, Ho SYW. 2018. Differences in performance Kallal R, Kulkarni S, Dimitrov D, Benavides LR, Arnedo M, Giribet G,
among test statistics for assessing phylogenomic model adequacy. Hormiga G. Forthcoming. Converging on the orb: denser taxon
Genome Biol Evol. 10:375–1388. sampling elucidates spider phylogeny and new analytical methods
Eberhard WG. 1987. Web-building behavior of anapid, symphytogna- support repeated evolution of the orb web. Cladistics. doi: 10.1111/
thid, and mysmenid spiders. J Arachnol. 14:339–358. CLA.12439.
Felsenstein J. 1985. Confidence limits on phylogenies: an approach using Kalyaanamoorthy S, Minh BQ, Wong TKF, von Haeseler A, Jermiin LS.
the bootstrap. Evolution 39(4):783–791. 2017. ModelFinder: fast model selection for accurate phylogenetic
Fernandez R, Hormiga G, Giribet G. 2014. Phylogenomic analysis of estimates. Nat Methods. 14(6):587–589.
spiders reveals nonmonophyly of orb weavers. Curr Biol. Katoh K, Standley DM. 2013. MAFFT multiple sequence alignment soft-
24(15):1772–1777. ware version 7: improvements in performance and usability. Mol Biol
Fernandez R, Kallal RJ, Dimitrov D, Ballesteros JA, Arnedo M, Giribet G, Evol. 30(4):772–780.
Hormiga G. 2018. Phylogenomics, diversification dynamics, and Kent WJ. 2002. BLAT—the BLAST-like alignment tool. Genome Res.
comparative transcriptomics across the spider tree of life. Curr
Downloaded from https://academic.oup.com/mbe/article/38/3/891/5912541 by guest on 28 July 2021
12(4):656–664.
Biol. 28(9):1489–1497.e5. Kulkarni S, Wood H, Lloyd M, Hormiga G. 2020. Spider-specific probe set
Forster RR, Platnick NI. 1977. A review of the spider family for ultraconserved elements offers new perspectives on the evolu-
Symphytognathidae (Arachnida, Araneae). Am Mus Novit. tionary history of spiders (Arachnida, Araneae). Mol Ecol Resour.
2619:1–29. 20(1):185–203.
Fu L, Niu B, Zhu Z, Wu S, Li W. 2012. CD-HIT: accelerated for clustering Langmead B, Salzberg S. 2012. Fast gapped-read alignment with Bowtie 2.
the next-generation sequencing data. Bioinformatics Nat Methods. 9(4):357–359.
28(23):3150–3152. Ledford JM, Griswold CE. 2010. A study of the subfamily
Garrison NL, Rodriguez J, Agnarsson I, Coddington JA, Griswold CE, Archoleptonetinae (Araneae, Leptonetidae) with a review of the
Hamilton CA, Hedin M, Kocot KM, Ledford JM, Bond JE. 2016. morphology and relationships for the Leptonetidae. Zootaxa
Spider phylogenomics: untangling the Spider Tree of Life. PeerJ 2391(1):1–32.
4:e1719. Lemmon AR, Brown JB, Stanger-Hall K, Lemmon EM. 2009. The effect of
Gee H. 2003. Ending incongruence. Nature 425(6960):782–782. ambiguous data on phylogenetic estimates obtained by maximum
Grabherr MG, Haas BJ, Yassour M, Levin JZ, Thompson D, Amit I,
likelihood and Bayesian inference. Syst Biol. 58(1):130–145.
Adiconis X, Fan L, Raychowdhury R, Zeng Q, et al. 2011. Full-length
Lopardo L, Giribet G, Hormiga G. 2011. Morphology to the rescue: mo-
transcriptome assembly from RNA-Seq data without a reference
lecular data and the signal of morphological characters in combined
genome. Nat Biotechnol. 29(7):644–652.
phylogenetic analyses—a case study from mysmenid spiders
Griswold CE, Coddington JA, Hormiga G, Scharff N. 1998. Phylogeny of
(Araneae, Mysmenidae), with comments on the evolution of web
the orb-web building spiders (Araneae, Orbiculariae: Deinopoidea,
architecture. Cladistics 27(3):278–330.
Araneoidea). Zool J Linn Soc. 123(1):1–99.
Lopardo L, Hormiga G. 2008. Phylogenetic placement of the Tasmanian
Guindon S, Dufayard J, Lefort V, Anisimova M, Hordijk W, Gascuel O.
2010. New algorithms and methods to estimate maximum- spider Acrobleps hygrophilus (Araneae, Anapidae) with comments
likelihood phylogenies: assessing the performance of PhyML 3.0. on the evolution of the capture web in Araneoidea. Cladistics
Syst Biol. 59(3):307–321. 24(1):1–33.
Haas BJ, Papanicolaou A, Yassour M, Grabherr M, Blood PD, Bowden J, Lozano-Fernandez J, Tanner AR, Giacomelli M, Carton R, Vinther J,
Couger MB, Eccles D, Li B, Lieber M, et al. 2013. De novo transcript Edgecombe GD, Pisani D. 2019. Increasing species sampling in cheli-
sequence reconstruction from RNA-seq using the Trinity platform cerate genomic-scale data sets provides support for monophyly of
for reference generation and analysis. Nat Protoc. 8(8):1494–1512. Acari and Arachnida. Nat Commun. 10(1):2295.
Hedin M, Derkarabetian S, Alfaro A, Ramırez MJ, Bond JE. 2019. Mardis ER. 2011. A decade’s perspective on DNA sequencing technology.
Phylogenomic analysis and revised classification of atypoid mygalo- Nature 470(7333):198–203.
morph spiders (Araneae, Mygalomorphae), with notes on arachnid Michalik P, Kallal R, Dederichs TM, Labarque FM, Hormiga G, Giribet G,
ultraconserved element loci. PeerJ 7:e6864. Ramırez MJ. 2019. Phylogenomics and genital morphology of cave
Hoang DT, Chernomor O, von Haeseler A, Minh BQ, Vinh LS. 2018. raptor spiders (Araneae, Trogloraptoridae) reveal an independent
UFBoot2: improving the ultrafast bootstrap approximation. Mol Biol origin of a flow-through female genital system. J Zool Syst Evol Res.
Evol. 35(2):518–522. 57(4):737–747.
Hormiga G. 1994. Cladistics and the comparative morphology of liny- Minh BQ, Hahn M, Lanfear R. 2020. New methods to calculate concor-
phiid spiders and their relatives (Araneae, Araneoidea, Linyphiidae). dance factors for phylogenomic datasets. Mol Biol Evol.
Zool J Linn Soc. 111(1):1–71. 37(9):2727–2733.
Hormiga G. 2008. On the spider genus Weintrauboa (Araneae, Morgan CC, Foster PG, Webb AE, Pisani D, McInerney JO, O’Connell MJ.
Pimoidae), with a description of a new species from China and 2013. Heterogeneous models place the root of the placental mam-
comments on its phylogenetic relationships. Zootaxa 1814(1):1–20. mal phylogeny. Mol Biol Evol. 30(9):2145–2156.
Hormiga G, Griswold CE. 2014. Systematics, phylogeny and evolution of Nguyen L-T, Schmidt HA, von Haeseler A, Minh BQ. 2015. IQ-TREE: A
orb-weaving spiders. Annu Rev Entomol. 59(1):487–512. Fast and Effective Stochastic Algorithm for Estimating Maximum-
Hormiga G, Tu L. 2008. On Putaoa, a new genus of the spider family Likelihood Phylogenies. Mol Biol Evol. 32(1):268–274.
Pimoidae (Araneae) from southern China, with a cladistic test of its O’Connor DL, Runions A, Sluis A, Bragg J, Vogel JP, Prusinkiewicz P, Hake
monophyly and phylogenetic placement. Zootaxa 1792(1):1–21. S. 2014. A division in PIN-mediated auxin patterning during organ
i5K Consortium. 2013. The i5K Initiative: advancing arthropod genomics initiation in grasses. PLoS Comput Biol. 10(1):e1003447.
for knowledge, human health, agriculture, and the environment. J Prasanna A, Gerber D, Kijpornyongpan T, Catherine Aime M, Doyle V,
Hered. 104:595–600. Nagy LG. 2020. Model choice, missing data, and taxon sampling
Jarvis ED, Mirarab S, Aberer AJ, Li B, Houde P, Li C, Ho SYW, Faircloth BC, impact phylogenomic inference of deep Basidiomycota relation-
Nabholz B, Howard JT, et al. 2014. Whole-genome analyses resolve ships. Syst Biol. 69(1):17–37.
early branches in the tree of life of modern birds. Science Prum RO, Berv JS, Dornburg A, Field DJ, Townsend JP, Lemmon EM,
346(6215):1320–1331. Lemmon AR. 2015. A comprehensive phylogeny of birds (Aves)
902Resolving Recalcitrant Nodes Through Genomic Interrogation . doi:10.1093/molbev/msaa251 MBE
using targeted next-generation DNA sequencing. Nature completeness with single-copy orthologs. Bioinformatics
526(7574):569–573. 31(19):3210–3212.
R Core Team. 2019. R: a language and environment for statistical com- Song L, Florea L. 2015. Rcorrector: efficient and accurate error correction
puting. Vienna (Austria): R Foundation for Statistical Computing. for Illumina RNA-seq reads. GigaScience 4(1):s13742–015–0089–y.
Ramırez MJ, Magalhaes ILF, Derkarabetian S, Ledford J, Griswold CE, Starrett J, Derkarabetian S, Hedin M, Bryson RW, McCormack JE,
Wood HW, Hedin M. 2020. Sequence-capture phylogenomics of Faircloth BC. 2017. High phylogenetic utility of an ultraconserved
true spiders reveals convergent evolution of respiratory systems. element probe set designed for Arachnida. Mol Ecol Resour.
Syst Biol. doi: 10.1093/sysbio/syaa043. 17(4):812–823.
Ripplinger J, Sullivan J. 2010. Assessment of substitution model adequacy Streicher JW, Schulte JA, Wiens JJ. 2016. How should genes and taxa be
using frequentist and Bayesian methods. Mol Biol Evol. sampled for phylogenomic analyses with missing data? An empirical
27(12):2790–2803. study in Iguanian lizards. Syst Biol. 65(1):128–145.
Rix M, Harvey M. 2010. The spider family Micropholcommatidae Walker JF, Brown JW, Smith SA. 2018. Analyzing contentious relation-
(Arachnida, Araneae, Araneoidea): a relimitation and revision at ships and outlier genes in phylogenomics. Syst Biol. 67(5):916–924.
the generic level. ZooKeys 36:1–321. Wheeler WC, Coddington JA, Crowley LM, Dimitrov D, Goloboff PA,
Rokas A, Williams B, King N, Carroll SB. 2003. Genome-scale approaches Griswold CE, Hormiga G, Prendini L, Ramırez MJ, Sierwald P, et al.
to resolving incongruence in molecular phylogenies. Nature 2017. The spider tree of life: phylogeny of Araneae based on target-
gene analyses from an extensive taxon sampling. Cladistics
Downloaded from https://academic.oup.com/mbe/article/38/3/891/5912541 by guest on 28 July 2021
425(6960):798–804.
Romiguier J, Ranwez V, Delsuc F, Galtier N, Douzery EJP. 2013. Less is 33(6):574–616.
more in mammalian phylogenomics: AT-rich genes minimize tree Wickett NJ, Mirarab S, Nguyen N, Warnow T, Carpenter E, Matasci N,
Ayyampalayam S, Barker MS, Burleigh JG, Gitzendanner MA, et al.
conflicts and unravel the root of placental mammals. Mol Biol Evol.
2014. Phylotranscriptomic analysis of the origin and early diversifi-
30(9):2134–2144.
cation of land plants. Proc Natl Acad Sci U S A. 111(45):E4859–E4868.
Roure B, Baurain D, Philippe H. 2013. Impact of missing data on phy-
Wood HM, Gonzalez V, Lloyd M, Coddington J, Scharff N. 2018. Next-
logenies inferred from empirical phylogenomic data sets. Mol Biol generation museum genomics: phylogenetic relationships among
Evol. 30(1):197–214. palpimanoid spiders using sequence capture techniques (Araneae:
Sanggaard KW, Bechsgaard JS, Fang X, Duan J, Dyrlund TF, Gupta V, Jiang Palpimanoidea). Mol Phylogenet Evol. 127:907–918.
X, Cheng L, Fan D, Feng Y. 2014. Spider genomes provide insight into World Spider Catalog. 2020. World spider catalog. Version 20.5. Bern
composition and evolution of venom and silk. Nat Commun. (Switzerland): Natural History Museum. Available from: http://wsc.
5(3765):1–11. nmbe.ch, accessed on 16 January, 2020.
Schütt K. 2003. Phylogeny of Symphytognathidae s.l. (Araneae, Xi Z, Liu L, Rest JS, Davis CC. 2014. Coalescent versus concatenation
Araneoidea). Zool Scr. 32:129–151. methods and the placement of Amborella as sister to water lilies.
Schwager EE, Sharma PP, Clarke T, Leite DJ, Wierschin T, Pechmann M, Syst Biol. 63(6):919–932.
Akiyama-Oda Y, Esposito L, Bechsgaard J, Bilde T, et al. 2017. The Zanis MJ, Soltis DE, Soltis PS, Mathews S, Donoghue MJ. 2002. The root of
house spider genome reveals an ancient whole-genome duplication the angiosperms revisited. Proc Natl Acad Sci U S A.
during arachnid evolution. BMC Biol. 15(1):62. 99(10):6848–6853.
Sharma PP, Kaluziak S, Perez-Porro AR, Gonzalez VL, Hormiga G, Zhang MY, Williams JL, Lucky A. 2019. Understanding UCEs: a compre-
Wheeler WC, Giribet G. 2014. Phylogenomic interrogation of hensive primer on using ultraconserved elements for arthropod
Arachnida reveals systemic conflicts in phylogenetic signal. Mol phylogenomics. Insect Syst Div. 3:1–12.
Biol Evol. 31(11):2963–2984. Zhao YJ, Zeng Y, Chen L, Dong Y, Wang W. 2014. Analysis of tran-
Sim~ao FA, Waterhouse RM, Ioannidis P, Kriventseva EV, Zdobnov EM. scriptomes of three orb-web spider species reveals gene profiles in-
2015. BUSCO: assessing genome assembly and annotation volved in silk and toxin. Insect Sci. 21(6):687–698.
903You can also read