Investor Presentation - Consent Solicitation and Subsequent Notes Issue May 2019 - Nissens
←
→
Page content transcription
If your browser does not render page correctly, please read the page content below

Investor Presentation
Consent Solicitation and Subsequent Notes Issue
May 2019
Disclaimer

This Presentation (the “Presentation") has been produced by AX V Nissens ApS (the “Issuer”, or the “Group” which shall also include any subsidiaries of the Issuer, K. Nissen International A/S (the "Target") and any
subsidiaries of the Target, unless otherwise indicated by the context) solely for use in connection with the offering of bonds by the Issuer expected to be initiated in May 2019 (the “Bonds”) (the “Transaction”) and may not be
reproduced or redistributed in whole or in part to any other person. Nordea Bank AB (publ) and Nykredit Bank A/S acts as joint bookrunners (the “Joint Bookrunners”). Nordea Bank AB (publ) acts as issuing agent for the
Transaction (the “Issuing Agent”). This Presentation is for information purposes only and does not in itself constitute an offer to sell or a solicitation of an offer to buy any of the Bonds. By attending a meeting where this
Presentation is presented, or by reading the Presentation slides, you agree to be bound by the following terms, conditions and limitations.

All information provided in this Presentation has been obtained from the Group or publicly available material. Although, the Joint Bookrunners has endeavoured to contribute towards giving a correct and complete picture of the
Issuer, neither the Joint Bookrunners or the Issuing Agent, or any of their affiliates, directors, officers, employees, advisors or representatives (collectively the “Representatives”) shall have any liability whatsoever arising directly
or indirectly from the use of this Presentation. Moreover, the information contained in this Presentation has not been independently verified and the Joint Bookrunners and the Issuing Agent assume no responsibility for, and no
warranty (expressly or implied) or representation is made as to, the accuracy, completeness or verification of the information contained in this Presentation, and it should not be relied upon as such. The Group does not intend
to, and does not assume any obligation to, update the Presentation. An investment in the Bonds involves a high level of risk and several factors could cause the actual results or performance of the Group to be different from
what may be expressed or implied by statements contained in this Presentation. By attending a meeting where this Presentation is presented, or by reading the Presentation slides, you acknowledge that you will be solely
responsible for your own assessment of the market and the market position of the Group and that you will conduct your own analysis and be solely responsible for forming your own view of the potential future performance of
the Group, its business and its Bonds and other securities. The content of this Presentation is not to be construed as legal, credit, business, investment or tax advice. Each recipient and any potential investor must rely on its
own assessment of the Group and the Bonds and should consult with its own legal, credit, business, investment and tax advisers to receive legal, credit, business, investment and tax advice.

Neither this Presentation nor any copy of it nor the information contained herein is being issued, and nor may this Presentation nor any copy of it nor the information contained herein be distributed directly or indirectly, to or into
Canada, Australia, Hong Kong, Italy, New Zeeland, the Republic of South Africa, Japan, the Grand Duchy of Luxembourg, the Republic of Cyprus, the United Kingdom or the United States (or to any U.S. person (as defined in
Rule 902 of Regulation S under the Securities Act)), or to any other jurisdiction in which such distribution would be unlawful, except as set forth herein and pursuant to appropriate exemptions under the laws of any such
jurisdiction. Neither the Group nor the Joint Bookrunners or Issuing Agent, nor any of its Representatives, have taken any actions to allow the distribution of this Presentation in any jurisdiction where action would be required for
such purposes. The distribution of this Presentation and any purchase of or application/subscription for Bonds or other securities of the Group may be restricted by law in certain jurisdictions, and persons into whose possession
this Presentation comes should inform themselves about, and observe, any such restriction. Any failure to comply with such restrictions may constitute a violation of the applicable securities laws of any such jurisdiction. None of
the Group or the Joint Bookrunners or Issuing Agent, or any of its Representatives shall have any liability (in negligence or otherwise) for any loss howsoever arising from any use of this Presentation or its contents or otherwise
arising in connection with the Presentation. Neither the Group nor the Joint Bookrunners or the Issuing Agent have authorised any offer to the public of securities, or has undertaken or plans to undertake any action to make an
offer of securities to the public requiring the publication of an offering prospectus, in any member state of the European Economic Area which has implemented the EU Prospectus Directive 2003/71/EC, as amended (the
“Prospectus Directive”) and this Presentation is not a prospectus for purposes of the Prospectus Directive.

In the event that this Presentation is distributed in the United Kingdom, it shall be directed only at persons who are either (a) "investment professionals" for the purposes of Article 19(5) of the UK Financial Services and Markets
Act 2000 (Financial Promotion) Order 2005, as amended (the “Order”), (b) high net worth companies, unincorporated associations and other persons to whom it may lawfully be communicated in accordance with Article 49(2)(a)
to (d) of the Order, or (c) persons to whom an invitation or inducement to engage in investment activity (within the meaning of Section 21 of the Financial Services and Markets Act 2000) in connection with the issue or sale of
any Bonds may otherwise lawfully be communicated or caused to be communicated (all such persons together being referred to as “Relevant Persons”). Any person who is not a Relevant Person must not act or rely on this
Presentation or any of its contents. Any investment or investment activity to which this Presentation relates will be available only to Relevant Persons and will be engaged in only with Relevant Persons. This Presentation is not
a prospectus for the purposes of Section 85(1) of the UK Financial Services and Markets Act 2000, as amended (“FSMA”). Accordingly, this Presentation has not been approved as a prospectus by the UK Financial Services
Authority (“FSA”) under Section 87A of FSMA and has not been filed with the FSA pursuant to the UK Prospectus Rules nor has it been approved by a person authorised under FSMA.

                                                                                                                    2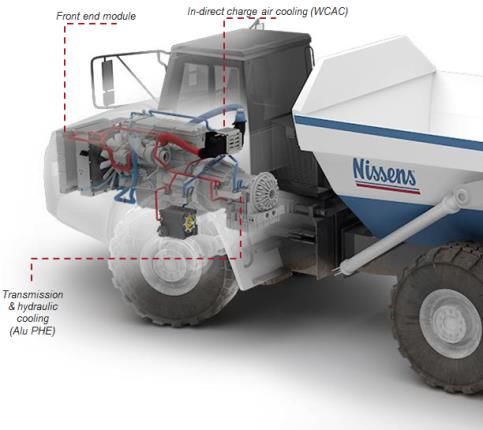
Disclaimer

This Presentation does not constitute or form part of an offer or solicitation to purchase or subscribe for securities in the United States. The Bonds have not been and will not be registered under the U.S. Securities Act of 1933,
as amended (the “Securities Act”), or with any securities regulatory authority of any state or other jurisdiction in the United States. Accordingly, the Bonds may not be offered, sold (directly or indirectly), delivered or otherwise
transferred within or into the United States or to, or for the account or benefit of, U.S. Persons, absent registration or under an exemption from, or in a transaction not subject to, the registration requirements of the Securities
Act. The Bonds are being offered and sold only outside the United States to persons other than U.S. persons in reliance upon Regulation S under the Securities Act (“Regulation S”). As used herein, the terms “United States”
and “U.S. person” have the meanings as given to them in Rule 902 of Regulation S under the Securities Act.

MIFID II TARGET MARKET ELIGIBLE COUNTERPARTIES AND PROFESSIONAL CLIENTS ONLY – due to product governance requirements contained within EU Directive 2014/65/EU on markets in financial instruments as
amended (“MIFID II”) the Securities are compatible with an end target market of investors who meet the criteria of professional clients and eligible counterparties, each as defined in MIDFID II, only and eligible for distribution
through all distribution channels to professional clients and eligible counterparties as permitted by MIFID II (The Target Market Assessment”). For the avoidance of doubt, the Target Market Assessment does not constitute: (a)
an assessment of suitability of appropriateness for the purposes of MIFID II; or (b) a recommendation to any investor or group of investors to invest in, or purchase, or take any other action whatsoever with respect to the
Securities.

This Presentation has been prepared exclusively for the benefit and internal use of the recipient and no part of this Presentation or the information it contains may be disclosed, reproduced or redistributed to any other party
without the prior written consent of the Joint Bookrunners. This Presentation is dated May 2019. Neither the delivery of this Presentation nor any further discussions of the Group or the Joint Bookrunners or Issuing Agent with
any of the recipients shall, under any circumstances, create any implication that there has been no change in the affairs of the Group since such date. The Group does not undertake any obligation to review or confirm, or to
release publicly or otherwise to investors or any other person, any revisions to the information contained in this Presentation to reflect events that occur or circumstances that arise after the date of this Presentation.

The Joint Bookrunners, Issuing Agent and/or its Representatives may hold shares, options or other securities of the Group and may, as principal or agent, buy or sell such securities. The Joint Bookrunners and Issuing Agent
may have other financial interests in transactions involving these securities or the Group.

This Presentation is subject to Danish law, and any dispute arising in respect of this Presentation is subject to the exclusive jurisdiction of Danish courts.

Forward Looking Statements
Certain information contained in this presentation, including any information on the Group’s plans or future financial or operating performance and other statements that express the Group’s management’s expectations or
estimates of future performance, constitute forward-looking statements (when used in this document, the words “anticipate”, “believe”, “estimate” and “expect” and similar expressions, as they relate to the Group or its
management, are intended to identify forward-looking statements). Such statements are based on a number of estimates and assumptions that, while considered reasonable by management at the time, are subject to
significant business, economic and competitive uncertainties. The Group cautions that such statements involve known and unknown risks, uncertainties and other factors that may cause the actual financial results, performance
or achievements of the Group to be materially different from the Group’s estimated future results, performance or achievements expressed or implied by those forward-looking statements.

Audit Review of Financial Information
Certain financial information contained in this Presentation has not been reviewed by the Group’s auditor or any other auditor or financial expert. Hence, such financial information might not have been produced in accordance
with applicable or recommended accounting principles and may furthermore contain errors and/or miscalculations. The Group is the source of the financial information, and none of the Group or the Joint Bookrunners or Issuing
Agent, or any of its Representatives shall have any liability (in negligence or otherwise) for any inaccuracy of the financial information set forth in this Presentation.

ANY POTENTIAL INVESTOR INVESTING IN THE BONDS IS BOUND BY THE FINAL TERMS AND CONDITIONS OF THE BONDS WHICH THE INVESTOR ACKNOWLEDGES HAVING ACCEPTED BY SUBSCRIBING FOR
SUCH BONDS

                                                                                                                    3
Table of contents

1.        Introduction to transaction       5
2.        Business update                   11
3.        Financials                        22
4.        Credit summary                    26
5.        Appendix                          28

                                        4
Transaction overview
Transaction summary Pro forma capital structure
Following the strong performance in Nissens (the “Group or the Issuer”), which has resulted Current financing structure1 Post repayment of PIK notes
in a de-leveraging to 3.6x based on the FY18/19F Adj. EBITDA of DKK 250m…
Facilities DKKm xEBITDA2 Facilities DKKm xEBITDA2
… The Group has decided to pursue a recapitalisation to repay its outstanding PIK loan and Cash (as of Jan-19) -247.2 -1.0x Cash4 -138.6 -0.6x
a consent solicitation to allow such repayment Mortgage 165.0 0.7x Mortgage 165.0 0.7x
Bond 970.63 3.9x Bond 970.63 3.9x
The recapitalisation will be backed by three sources of funding: Subsequent Notes 186.63 0.7x
o Equity contribution of DKK 150m from the Nissen family in the form of preference shares Net sr. debt 888.4 3.6x Net sr. debt 1,183.6 4.7x
in AX V Nissens II ApS PIK Loan5 420.0 1.7x PIK Loan 0.0 0.0x
Net total debt 1,308.4 5.2x Net total debt 1,183.6 4.7x
o A Subsequent Senior Secured Notes (the “Notes”) issue in an amount of EUR 25m (the SSRCF 125.0 0.5x SSRCF 125.0 0.5x
“Tap Issue”) – subject to bondholders’ acceptance of the consent solicitation
Sources & Uses
o Existing cash on balance due to period of strong financial performance
Sources1 DKKm Uses DKKm
Existing cash and proceeds from the Tap Issue will be used to: Use of existing cash on balance 247.2 Excess cash 138.6
o Fund an upstream payment of up to DKK 300m which combined with the equity Subsequent Notes Issue 186.6 PIK repayment 420.0
contribution will be used to repay the PIK loan in full New equity 150.0 Call premium 25.2
Total Sources 583.8 Total Uses 583.8
The Tap Issue will be fungible and issued under the amended terms and conditions for the
Issuer’s existing notes and listed on Nasdaq Copenhagen (ISIN: DK0030400890) Simplified group structure
No dividend will be paid out to AX V Nissens III in connection with the transaction Nissen family has a 25%
ownership ~5%
Post repayment of PIK notes the Net Leverage of the Group is expected to be 4.7x based on Management
AX V Nissens III ApS
the cash position as of January 2019. Due to the NWC build-up as a result of the high-season New Equity
in Automotive, the Net Leverage of the Group is expected to increase to approx. 5.0x based DKK 150m PIK loan repayment
AX V Nissens II ApS
on the cash position as of financial year-end (April 2019) PIK loan
DKK 420m
DKK 420m Upstream payment
Axcel Fund V (“Axcel”) has been the main owner of Nissens since 2017, and the Group AX V Nissens I ApS up to DKK 300m
represents Axcel’s first investment from Fund V
Subsequent Notes AX V Nissens ApS
EUR 25m
Sr. Sec. Notes K. Nissen International A/S SSRCF
EUR 130m DKK 125m
100% 100%
Cooling Systems Automotive
Mortgage debt Nissens Cooling Solutions A/S Nissens Auto Holding Mortgage debt
DKK 82m + foreign subsidiaries + foreign subsidiaries DKK 83m
Notes: (1) Capital structure refers to AX V Nissens III ApS (2) Based on FY 18/19F Adj. EBITDA of DKK 250.0m (3) Based on EUR/DKK exchange rate of 7.4658 (4) Pro forma structure does not account for transaction
costs or changes to the cash position since January 2019 (5) Nominal amount as of Jun-19
5Consent solicitation process and details
Strong financial performance enables potential repayment of PIK loan The Consent Solicitation Process
Together with the release of the Q3 18/19 financial report, the company updated its outlook The suggested amendments to the terms and conditions governing the Senior Secured
for the full year results from a revenue above DKK 1,800m and an EBITDA above DKK 220m Notes are as follows:
to a revenue above DKK 1,900m and an EBITDA above DKK 230m o One-time waiver of Restricted Payments allowing for the distribution, post upstream
payment Incurrence Test must be met
In connection with the contemplated transaction, the company has provided further update
on the FY 18/19 outlook with revenue now expected to amount to DKK 1,975m and EBITDA o Exception to Restricted Payment to repay New Equity provided that pro-forma Net
Leverage is at or below 3.5x
DKK 235m due to strong performance in both divisions
Adjusting for one-offs and non-recurring items, adjusted EBITDA is expected to reach DKK o Postpone step-down on the leverage covenant (Incurrence Test) by one year from 29
June 2019 to 29 June 2020
250m
Accordingly, the following transactions to repay the company’s outstanding PIK loan The consent fee will be split into an Early Bird Fee of 225bps for all yes voters and a Base
combined with a subsequent notes issue is being contemplated Fee for all voters of 25bps
Consenting investors may be prioritized in allocation of the Tap Issue
Nordea and Nykredit have provided all necessary waivers on the SSRCF to allow for the
contemplated transaction
Proposed amendments to the 2017-notes’ terms and conditions in consent solicitation
Waive the restrictions on Restricted Payments set out in Clause 14.21 in the Terms and Conditions to the extent necessary to permit the
One-time waiver of Restricted
Issuer to make a Restricted Payment to Holdco2, the amount received by Holdco as a result of such Restricted Payment to be applied by Holdco
Payments
to the partial prepayment of the amount outstanding under the PIK Notes Facility Agreement
Exception to Restricted Amendment to Clause 14.21 in the Terms and Conditions in order to allow Restricted Payments, if at the time of payment, the Leverage
Payments if pro-forma Net Ratio in respect of any Reference Period is equal to or less than 3.5x, the amount received by Holdco as a result of such Restricted Payment to
Leverage at or below 3.5x be applied by Holdco to the partial or full repayment of the New Equity3; and
Postpone step-down on Amendment to Clause 13.14 (a)(i) in the Terms and Conditions in order to extend the date at which the Leverage Ratio component of the
leverage covenant by one year Incurrence Test is reduced to 4.5x from 29 June 2019 to 29 June 2020
Notes: (1) Clause 14.2 in Terms and Conditions dated 28 June 2017 or Clause 13.2 in Prospectus dated 22 March 2018 (2) AX V Nissens II ApS (3) New Equity refers to preference shares worth DKK 150m
and preferred return. Total payment in respect of New Equity is capped at DKK 180m (4) Clause 13.1 in Terms and Conditions dated 28 June 2017 or Clause 12.1 in Prospectus dated 22 March 2018
6Amended Key Terms & Conditions
Issuer AX V Nissens ApS (the “Issuer”, “Nissens” or “Group”)
Instrument Senior Secured Notes
Security and First priority security over, inter alia, shares in certain subsidiaries and certain material and long-term intra-group loans, if any
Guarantees Same security and guarantees as SSRCF. In an enforcement or insolvency scenario, the SSRCF and any hedges will receive proceeds before the Senior Secured Notes
Subsequent issue
EUR 25,000,000
amount
Interest rate 3m Euribor +500 bps p.a., quarterly interest payments, 0.0% floor
Maturity 29 June 2022
Call structure From and including June 29 2019 @ 102.50%, June 29 2020 @ 101.25%, June 29 2021 @ 100.00%
Change of control At 50% CoC – investor put @ 101% (30% threshold after equity listing)
Incurrence test (for issuing additional notes and financial indebtedness and payment of dividends following an Equity Listing):
Financial
o Net Debt / EBITDA: ≤5.0x with step down to 4.50x on June 29 2020
undertakings
o Interest Coverage Ratio: >2.5x with step up to 3.0x on June 29 2019
Inter alia restrictions on distributions, mergers, demergers, disposals, financials indebtedness, negative pledge, financial support
General
Dividends with the purpose of repaying the New Equity and preferred return capped at DKK 180m to be allowed subject to compliance with Incurrence Test of 3.5x
undertakings and Net Leverage
key terms
Ability to pay dividends following an Equity Listing (50% of net income of previous year) subject to Incurrence Test
Bookrunners Nordea & Nykredit
Security and Notes Agent: Nordic Trustee
Agents
Paying Agent: Nordea
Listing Nasdaq Copenhagen as per existing notes
Governing law Danish law
7Today’s presenters
Mikkel K. Andersen Jakob Backs Lars Cordt Christian Curtz Henriksen
Chief Executive Officer SVP / Chief Financial Officer Partner Associate Director
Joined Nissens in 2010 Joined Nissens in 2016 Joined Axcel in 2006 Joined Axcel in 2015
Previous experience Previous experience Previous experience Previous experience
o Nissens : CFO, Head of o Terma Aero., VP Finance o Pandora and PwC o Deloitte and Pandora
Automotive, COO & Vice- o Tvilum, VP Business Dev. & Current board positions Current board observer
CEO Support o Nissens, Mountain Top and o Nissens, Frontmatec and
o Implement Consulting Group, MSc. Business Economics, MBA Gubi European Sperm Bank
Partner
MSc. Finance & Accounting MSc. Finance
MSc. E-business, BSc.
Economics
8Experienced Board of Directors in place
Niels Jacobsen Alan Nissen Lars Cordt Søren Klarskov Vilby Christian Frigast Marc de Jong Manfred Wolf
Joined Nissens’ BoD in Deputy chairman in Joined Nissens’ BoD in Joined Nissens’ BoD in Joined Nissens’ BoD in Joined Nissens’ BoD in Joined Nissens’ BoD in
2017 as Chairman Nissens’ BoD 2017 as Deputy 2017 2017 2017 2017
Chairman
CV CV CV CV CV CV CV
Former CEO of Over 30 years Partner - Axcel CEO - Micro Matic A/S Partner and Executive Former CEO - LM Former executive
William Demant ownership of Nissens Management A/S Former member of the Chairman - Axcel Wind Power positions –
Former Deputy CEO and member of Member of the board board – Borg Management A/S Former executive MANN+HUMMEL
chairman in Maersk the board - Advanced – Mountain Top Automotive Deputy Chairman - positions – Royal and Bosch (both in
Cooling A/S PANDORA A/S Phillips Electronics Automotive divisions)
Deputy chairman in Member of the board Former member of the
Demant A/S CEO and member of – Gubi board – KK Group Deputy Chairman - (Automotive Lighting) Long time member
the board - Advanced Danmarks Skibskredit and NXP and deputy chairman
Deputy Chairman - Former Board Advisor
Cooling Investment Holding A/S Semiconductors of the VDA
Kirkby A/S – PANDORA A/S
A/S (Automotive division) Aftermarket
Vice Chairman - Former Senior Committee
Maersk LNG A/S Consultant - PwC
9Table of contents
1. Introduction to transaction 5
2. Business update 11
3. Financials 22
4. Credit summary 26
5. Appendix 28
10Nissens at a glance
Market leader in thermal solutions for the independent Automotive aftermarket and Wind / Industrial OEMs (Cooling Solutions)
Economic development Global footprint
Net revenue (DKKm) EBITDA (DKKm) Nissens’ markets
Production facilities
Adj. EBITDA (DKKm) Adj. EBITDA-% Central warehouse
Logistic hub
Lund Tianjin
1,975 Horsens
CAGR 15.9% Poznan Shanghai
1,676
1,604
Cachtice
1,380 Svit
12.2% 12.7% 12.7%
11.6%
14.0%
1,094
224 207 212 197 250 235
133 125 159 153
Direct presence with local
14/15A 15/16A 16/17A 17/18A 18/19F distribution centres throughout
Europe and United States
Key figures (18/19F) and developments since bond issue (16/17A to 18/19F) Sales breakdown 18/19F
By segment By geography
DKK 1,975m net sales +11.0% CAGR in net sales
China ROW
North America
Russia
DKK 250m Adj. EBITDA +11.7% increase in EBITDA
Cooling 51% Auto-
49% motive
Solutions
Avg. cash conversion of
DKK 183m cash generated
98%
Europe
Note: Financials from 14/15A to 17/18A are based on K. Nissen International A/S (100% owned by AX V Nissens ApS) to show comparable figures (financial year-end is 30 April)
18/19F is based on AX V Nissens ApS and reported under IFRS
Source: Company
11Key customer value proposition
Nissens’ brand is built on delivering the difference through customer centricity and a heritage of thermal knowhow
Automotive Cooling Solutions
Pure aftermarket focus Flexible solutions
Wide and deep assortment First time right engineering
Competitive prices Fast to market
Unparalleled availability Product innovation
Source: Company
12Automotive
Automotive segment showing strong financial performance
Comments Economic development
Nissens is the leading pure-play provider of cooling products in the European independent Net Sales (DKKm)
automotive aftermarket (IAA). A position that has been further solidified since the issuance of
the notes in June 2017 CAGR 12.4%
1,000 960
Automotive sales growth of 12.4% CAGR is driven by increase in all product groups (EC, AC 821 861
and efficiency) - a warm European summer contributed to a higher than expected sales 800 714
volume in AC parts such as condensers in 18/19F, as well as launch of new Turbo 601
component in September 2018 600
The division benefits from a high general diversification of revenue across product offerings, 400
customers and geography
200
In addition to a stable volume growth, profitability has been increasing due to:
o Positive development in product- and market mix 0
14/15A 15/16A 16/17A 17/18A 18/19F
o Focus on lowering production costs and focus on improvements in sourcing
Engine Cooling
Radiators
Fans
Key Customers Clutches
Wholesalers and distributors Buying Groups Air Conditioning
Condensers
Compressors
Blowers
Evaporators
Efficiency
Intercoolers
Turbo
Source: Company
13Automotive – Market update
… Supporting strong underlying growth in … Superior service model has made Nissens
Aftermarket trends remain unchanged… IAA that is gaining share on OEMs... the leading pure-play IAA provider in Europe
Aftermarket breakdown ‘15/16, EURbn Leading across both hard and soft service factors
Demand shift from OEM to IAA
Consumers grow more price Illustrative service model matrix
conscious over time and opt for
OEM Competitors
non-OEM spare parts 44%
Category mgmt., training, support
IAA
56%
1.6
Soft service factors
Vehicle parc growing and aging 3.8% 0.1
Parc 1-2 years older over past 1.3
decade translating into higher
replacement rates 3.9% 0.1
1.1
0.7
0.1
Increasing content per vehicle
0.5
AC becoming more common,
engine downsizing and emissions 0.4
regulation
Hard service factors
Product range and availability
Vehicle parc diversifying Nissens is the leading pure-play IAA in Europe
0.8
Higher variance of vehicle models 0.7
0.6 Estimated market shares (´15/16)
leading to higher variance of parts
~15%
Wholesaler consolidation
Cost inflation equalled out from '10/11A '15/16A '20/21E ~11%
wholesaler professionalization/
consolidation, private labels and Engine cooling (EC) Air conditioning (AC)
substitution to cheaper Asian products Efficiency % CAGR ~6%
Other
Source: Company
14Demand shift from
Drivers shifting the demand from OEM to IAA OEM to IAA
Changing insurance policies in EU increases demand for IAA Alternative vehicle ownership favouring large IAA
Market split in the aftermarket for crash repairs (Germany) European vehicle ownership
40%
60%
82%
+50% 92%
60%
40% +125%
18%
8%
2015 2025-2030 2018 2025F
Authorised aftermarket IAA Privately owned Business ownership
The split between OEMs and IAA for aftermarket crash repairs is changing in EU due to Increasing amount of professionally owned car fleets on the European market reduce the
increasing insurance orientation towards IAA share of privately owned vehicles – share of business ownership is expected to rise by 125%
from 2018 to 2025
In 2025-2030 the share of IAA will rise above the authorised market share for aftermarket
crash repairs and take up 60% of the total market Trend towards alternative vehicle ownership increases the B2B dimension in the automotive
aftermarket
The insurance companies have a substantial influence on the automotive aftermarket
through crash repairs – shifting policies are allowing for cheaper spare part replacement Independent professionally managed car fleets’ increasing focus on costs supports a shift
favouring IAA from OEM to IAA
~ 10% of car insurance policies in Germany are based on more IAA-friendly terms Fleet ownerships favour large independent aftermarket services
~ 30% of new car insurance policies in Germany are based on more IAA-friendly terms
Nissens is well positioned towards European trends shifting the demand from OEM to IAA
Source: Company and A.T. Kearney
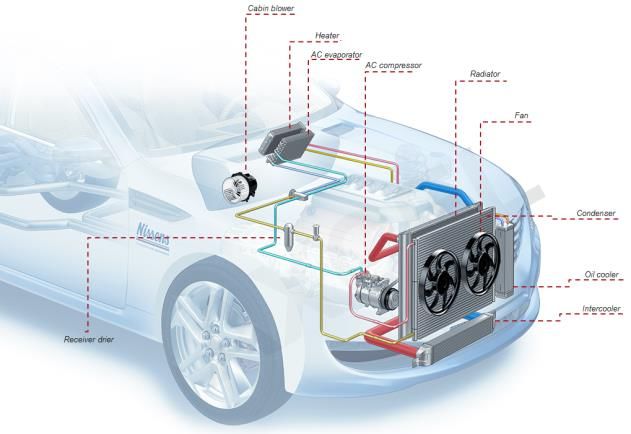
15Cooling Solutions
Strong financial performance in Cooling Solutions in 18/19
Comments Topline development in Cooling Solutions
Overall Cooling Solutions has shown stable growth and been profitable in the entire period Net Sales
Wind
After a slowdown in 17/18A due to adverse market developments in the Wind segment as well 1,200
as an organizational ramp-up to support the strategy, full year 18/19 guidance shows strong CAGR 20.1% 1,015
financial performance 1,000
782 815
Increase in 18/19F revenue primarily driven by growth in Wind segment, helped by increased 800
market activity and higher demand for cooling systems 666
Industry focus on lower LCOE caused intense price pressure in 17/18A affecting profitability. 600 488
This price pressure has continued in 18/19, however Nissens keeps focusing on: 400
o Production – strong focus on quality and execution of production has increased
production efficiency 200
o Engineering – in close cooperation with OEMs with high focus on trimming costs 0
o Procurement – increase competition among suppliers and help them optimize own 14/15A 15/16A 16/17A 17/18A 18/19F
setups
Industry Wind OEM Industry OEM
Industry segment has shown stable financial performance
Development within this segment is helped by an underlying strong market, and Nissens’
position with industry winners
Key Customers
Wind Industry
Source: Company
16Cooling Solutions – Market update
Wind segment Industry segment
Global market shares for wind OEMs Positioning of selected players in the Industry cooling market
High quality, low volume players High quality, high volume players
High
High
Offer a high degree of quality and engineering Compete with Nissens in high
2018 2025E capabilities on low to medium batch volumes margin segments
Quality and technical complexity
2 1
Low quality, low volume players
Compete with Nissens in price
4
sensitive markets
3 Low quality, high
volume players
Deliver high batch
volumes with limited
Low
Vestas / MHI Vestas SGRE GE Goldwin Other
flexibility and quality
Low Medium Production volume High Very High
The four largest OEMs are expected to increase their share of the total market
Nissens offer a high degree of quality and engineering capabilities on low to
Nissens has a pipeline within three of the four largest OEMs and is targeting medium batch volumes
new products within all four players
Nissens’ Cooling Solutions is well positioned
Source: Company and Wood Mackenzie
17Wind segment – Market update
Wind industry trends Impressive market forecasts for offshore wind despite OEM price pressure
Key trends shaping the wind industry
Continued price pressure
Increased competitiveness CAGR 14% from wind OEMs
Increased political support and
decreasing LCOE increasing wind as +7 GW Continued volatility in the
a competitive energy source wind industry
However, strong growth
Larger WTGs in European offshore
Shift in installed WTG mix wind
towards larger onshore and offshore
WTGs with increased cooling
requirements per MW
Offshore
Substantially increasing demand for
and size of offshore WTGs in China 3.2 GW
and Europe
Industrialisation
LCOE reductions forcing OEMs to re-
think supply chain and increasingly
partner up with key sub-suppliers
From components to systems
OEMs increasingly look for systems
2019 2025
suppliers to reduce supply chain
complexity and leverage European offshore market forecast (Annual installed GW)
competencies with sub-suppliers
Source: Company and Wood Mackenzie
18Strong downside resilience
Nissens operates a well diversified business protected by different underlying market dynamics
Auto Wind Industry
Market Independent Aftermarket (IAA) OEM OEM
More volatile and to some extend
Underlying dynamics Very stable and predictable business Follows market cycles
politically driven
Cyclical exposure Low to none Independent cyclicality Highly correlated with economic activity
Follows installation of new WTGs (political
Accelerated growth in car fleet age during Big machinery and heavy industry usually
Main driver subsidies tend to be increased during
downturn suffers during economic downturns
recessions)
The majority of the spare parts are critical Historically driven by political agenda to
Investment in big machinery can be
components to avoid e.g. engine support green energy
Products postponed during economic downturn (but
overheating hence investment cannot be The Wind industry has matured and has
usually results in high demand post crisis)
postponed become less dependent on subsidies
Sales type Quick delivery (built up of inventory) Order driven Order driven
Customer concentration Consolidating Focused around main Global OEMs Diverse
Mainly Europe, but increasing sales in Global – follows the OEMs that are spread Mainly Europe
Geographical spread
other markets around the world
A well diversified business ensures Nissens downside protection
Source: Company
19Nissens’ strategic vision
The leading automotive aftermarket brand and renewable cooling specialist
20/21 strategy Vision (20/21 and beyond)
The leading aftermarket spare part brand
Auto
within key product categories
Leading aftermarket supplier in EC & AC in EU & Russia
Well positioned in fast growing efficiency category
Thermal Efficiency Engine management
Global leader in cooling solutions to
Wind
wind energy
Global leader in cooling solutions to the wind industry
Increased scope
of supply
Wind
A leading cooling solutions supplier to
Industry A leading supplier for cooling solutions to mission selected niches
critical heavy industry machines
Strong positions in segments such as train and mining
Mission critical heavy
Train Mining Electrification
industry machines
Source: Company
20Table of contents
1. Introduction to transaction 5
2. Business update 11
3. Financials 22
4. Credit summary 26
5. Appendix 28
21Consolidated profit and loss
Net sales continue to grow above market and EBITDA has regained momentum since 17/18A
Consolidated profit and loss 16/17A – 18/19F
Net sales Adj. EBITDA Reported EBITDA Adj. EBITDA-%
1,900 1,975
1,604 1,676
14.0% 12.2%
12.7% 12.7%
224 207 212 197 231 221 250 235
16/17A (Audited) 17/18A (Audited) 18/19A LTM1 (Unaudited) 18/19F
K. Nissen International A/S AX V Nissens ApS
Comments
Since Axcel’s takeover, the company has shown sustainable growth in net sales with 11.0% CAGR
After a year-on-year decline in reported EBITDA in 17/18A due to strategic changes in the wind industry, performance has regained momentum within Wind
Adj. EBITDA has grown by 5.7% CAGR in the period 16/17A to 18/19F driven by:
o Continued strong momentum in Automotive sales
o Increased scale on fixed cost base despite significant strategic investments in additional sales, product management and engineering resources
All three business segments have remained profitable since the issue of the Notes – conform with peers
Note: (1) LTM (last 12 months) is per January 2019
Source: Annual and quarterly reports, Company
22Cash flow and monthly NWC developments
Nissens has maintained a high cash conversion rate Consistently improving level of NWC
Free cash flow development Monthly working capital and NWC as a % of net sales (2017-Apr to 2019-Jan)1
300 224 250 1,000 30%
212
200 94% 800 24.8%
24.0% 25%
73%
100 64%
600 20.0%
0 32 20%
-46 -40 -67
-36 400
-100
16/17A 17/18A 18/19F 15%
200
Adj. EBITDA CAPEX Cash conversion (FCF bf tax & fin.)
10%
Δ NWC Δ NWC + CAPEX 18/19F 0
-200 5%
High and stable cash flows
Strong underlying EBITDA growth with 5.7% CAGR from 16/17A to 18/19F
-400 0%
Apr 17
May 17
Jun 17
Jul 17
Aug 17
Sep 17
Oct 17
Nov 17
Dec 17
Jan 18
Feb 18
Mar 18
Apr 18
May 18
Jun 18
Jul 18
Aug 18
Sep 18
Oct 18
Nov 18
Dec 18
Jan 19
The company has had an average cash conversion (FCF bf tax and financing) of 77.1%
during the last 3 years including 18/19F
Downturn resilience
Positive working capital profile with strong and liquid inventory base within Automotive caters Inventories Trade payables NWC-% of LTM revenue
for resilience to downturn
Trade receivables Other NWC items
DKKm 16/17A 17/18A 18/19F Net working capital (as % of net sales) decreased from 24.8% in end 16/17A to 24.0% in
end 17/18A to 20.0% in January 18/19A. The decrease has primarily been driven by
Adj. EBITDA 224.0 212.0 250.0
growth in revenue
Δ NWC 32.4 (40.1) n.a.
Inventories in 18/19A have averaged DKK 411m and represent the largest proportion of
Cash flow from operations 256.4 171.9 n.a. working capital
CAPEX (46.4) (35.7) n.a. For Automotive net working capital tends to peak June - August while low season occurs
Free cash flow bf tax and financing 210.0 136.2 183.0 in December - February
Cash conversion (operations) 114.5% 81.1% n.a. Cooling Solutions has generally lower seasonality swings
Cash conversion (FCF bf tax and financing) 93.8% 64.2% 73.2%
Note: (1) Dec 18 and Jan 19 NWC is positively affected by DKK 45m prepayments from large customer
Source: Company and management reports
23Forecasted EBITDA 2018/2019
EBITDA normalisations
(4) (5)
DKKm 18/19F
4
250
Reported EBITDA 235.0 8
(1) Legal dispute 1.4 (3)
(2) Legal costs in relation to the restructuring of the company 2.3
(3) Extraordinary remuneration and warrants 7.3 7
(4) Wind customer debtor and value chain provision 8.0 (2)
4.1%
(5) Release wind customer stock provision -4.0 (1) 2
235 1
Total adjustments 15.0
Share of reported EBITDA 4.1%
Adjusted EBITDA 250.0
Reported EBITDA Adjusted EBITDA
Adjustments Adjustments share of reported EBITDA
Source: Company
24Table of contents
1. Introduction to transaction 5
2. Business update 11
3. Financials 22
4. Credit summary 26
5. Appendix 28
25Credit summary – Unchanged credit story supported by:
1 2 High entry barriers and 3 4 Resilient aftermarket 5 6
Leading positions in Scalable and cost- Strong financial track Strong management
leading value proposition services in Automotive
markets with high growth efficient global record with high growth team with solid track
resulting in long client and diversified group
potential production setup and margins record
relationships business model
Automotive IAA market High entry barriers with e.g. 2/3 of production Aftermarket focus in +16% sales CAGR over the Nissens has delivered on
supported by e.g. growing quality, reliability and outsourced to selected Automotive provides last five years its strategic objectives
and aging car park, growing logistics requirements partner factories primarily in stability in a hypothetical Sustainable EBITDA- during the past two strategy
IAA share, growing share of Value proposition designed China within Automotive pan-European economic margin above 12% despite periods
AC products to alleviate customers’ pain and 80% of production downturn adverse market Strong management team
Wind supported by e.g. points while providing cost FTEs in low cost countries Group business model is developments with complementary
growing installations, savings and reducing within Wind/Industry well diversified across business and technical
growing cooling spend per capital tie Major part of the cost base industries, markets, skills
MW, as well as Nissens is flexible customers and products
customers gaining market
shares
Nissens is the market
leading supplier of cooling
solutions to the European
IAA, Wind OEM market and
selected industry verticals
European IAA market growth Selected customer benefits Group cost split Diversified business model 1) Net sales and Adj. EBITDA-% Management team
+4.8% Automotive
95% Coverage & Short delivery
Availability SG&A
+16%
15/16 20/21F Easy Reduced
installation NWC 12.7% 12.7%
Offshore Wind market forecast 14.0%
COGS + other 12.2% 11.5%
Wind/Industry 73% production costs
Cost Increased
+7 GW
efficient cooling
3.2 GW performance
Tailored Best in class Group cost
2019 2025 14/15A 15/16A 16/17A 17/18A 18/19F
solutions innovation split 18/19F
Notes: (1) Pie charts present 2018/2019F data: Revenue split in Automotive and Cooling Solutions and geographical revenue split
Source: Company
26Table of contents
1. Introduction to transaction 5
2. Business update 11
3. Financials 22
4. Credit summary 26
5. Appendix 28
27Cost-efficient operational setup due to large share of
production moved to low cost countries
Global sourcing, manufacturing and distribution setup in both Automotive and Cooling Solutions
Automotive footprint Cooling Solutions footprint
Distribution centres Production overview
Operated by Nissens Production facility
3PL Engineering and support
Consigment
Other Central Logistics Mooresville
Warehouse Tianjin
hub & local
Partner distribution
factories
Central centre Horsens
Warehouse
Svit
Cachtice
Automotive back-end Cooling Solutions back-end
Lund Poznan Shanghai hub Cachtice Lokesalle Lund Cachtice Svit Tianjin
+20
Logistics Radiator Partner factories Core Prototypes, Core Finished goods assembly Core
Central Central
hub manufacturing manufacturing systems & manufacturing, manufacturing,
warehouse warehouse
modules finished goods assembly finished goods and
systems & modules
assembly
Note: Cachtice & Lund facilities m2 are shared facilities and include both Auto and Cooling Solutions
Source: Company
28Experienced team in place to continue growth
Description Nissens is headed by an experienced management team with successful track-records
The management team headed by Mikkel CEO SVP SVP SVP/COO SVP/CFO VP
Krogslund Andersen has developed and Group Head of Cooling Head of Operations Group Head of HR &
Solutions Automotive Group Services
successfully executed two strategy waves
prior to the current strategy plan to 20/21
The management team consists of six key
employees of which three have +5 years of
seniority with Nissens
New hires during 2016-2018 include (i) Knud
Krægpøth, a senior operations specialists Mikkel Hans Erik Klavs Knud Jakob Rikke
from Grundfos, the Danish market leader in Krogslund Obling Thulstrup Krægpøth Backs Kroer
pumps, (ii) Jakob Backs from Terma Andersen Pedersen Høberg
Aerostructures, a supplier of commercial and
military aircrafts, and (iii) Hans Erik Obling, Two prior strategy waves have been successfully executed by the current management team
who brings +20y experience from Nissens
1st strategy wave: 2nd strategy wave:
(1990-2012) following senior positions at 2011– 2014 2014 – 2017
Vestas and Johnson Controls in recent years
During the former two strategy waves, 24%
5% 4% 19%
Nissens has been transformed into an
international group with global cost
competitiveness and market leading
positions in all its business segments Revenue EBITDA Revenue EBITDA
CAGR CAGR CAGR CAGR
Target top 3 auto. wholesalers Extend auto. platform
Become wind systems supplier Secure global wind leadership
Develop global production setup Ensure cost competitiveness
Seniority with Nissens XXXX
Note: Financials are from K. Nissen International A/S (100% owned by AX V Nissens ApS)
Source: Company
29Nissens Group
As of 1 May 2019
AX V Nissens ApS
K. Nissen International A/S
NA International A/S NCS International A/S Nissens (Shanghai)
Nissens Slovakia S.R.O. Autoparts Trading Co.
Ltd.
Nissens Automotive A/S Nissens UK
Nissens Cooling Nissens Slovakia Nissens Cooling System
Nissens Cooling
Solutions Inc. North S.R.O. (Tianjin) Co. Ltd. (China)
Solutions A/S
*) Nissens Italia S.r.l Nissens Belgium S.A. (US)
*) Nissens Hungária *) Nissens North
Jármütö Kft America Inc.
Nissens France EURL Nissens Schweiz AG
Radiadores Nissens S.A. Nissens Ukraine Ltd.
Nissens Sverige AB *)Nissens Portugal LDA
*) As of April 30 2019 Nissens Hungária Jármütö Kft, Nissens North America
Inc., Nissens Portugal LDA and Nissens Italia S.r.l are via a transaction of
Nissens Deutschland GmbH Nissens Finland Oy
contribution in-kind, contributed by K. Nissen International A/S to NA
International A/S against a capital increase, pending registration in
Chlodnice Nissens
Polska Sp. Zo.o.
Erhvervsstyrelsen expected during May 2019
Source: Company
30Reported income statement
DKKm 16/17A (Audited) 17/18A (Audited) YTD Q3 18/19
Revenue 1,603.6 1,675.7 1,472.4
Cost of raw materials and consumables -796.1 -859.4 -751.3
Other operating income 9.2 9.4 6.2
Other external costs -264.8 -253.2 -242.3
Gross profit/loss 551.9 572.5 485.0
Staff costs -345.4 -375.3 -296.3
Depreciation of property, plant and equipment -24.9 -28.1 -80.3
Operating profit/loss before special items 181.6 169.1 108.4
Special items - - -3.2
Operating profit/loss after special items 181.6 169.0 105.2
Financial income 0.1 - 0.2
Financial costs -5.1 -47.8 -52.7
Net financials -5.0 -47.8 -52.5
Profit before tax 176.6 121.4 52.7
Tax for the year -40.4 -28.6 -22.9
Profit/loss for the year 136.2 92.7 29.8
Source: K. Nissen International A/S and AX V Nissens ApS Audited following Danish accounting principles Audited following Danish accounting principles Unaudited but follows IFRS
Note: The financial statements of K. Nissen International A/S (16/17A and 17/18A) are prepared in accordance with the Danish Financial Statements Act
Note: The financial statements of AX V Nissens ApS (YTD Q3 18/19) are prepared in accordance with IFRS
Source: Annual & quarterly reports
31Reported balance sheet – Total assets
DKKm 16/17A (Audited) 17/18A (Audited) 31 January 2019 (Q3)
Assets
Fixed assets
Development projects - 1.1
Acquired intangible assets 4.2 3.7
Development projects in progress 0.3 0.1
Intangible assets 4.5 4.9 1,617.7
Land and buildings 150.6 154.6
Plant and machinery 62.8 65.4
Other fixtures and fittings, tools and equipment 4.8 5.3
Property, plant and equipment in progress 2.9 2.9
Property, plant and equipment 221.1 228.2 351.4
Investment in associates, net asset value 0.1 0.0 0.1
Deferred tax assets - - 4.7
Deposits 1.7 1.5 1.5
Investments 1.8 1.5 6.3
Total fixed assets 227.4 234.6 1,975.4
Raw materials and consumables 75.9 88.9
Work in progress 82.5 105.3
Finished goods and goods for resale 210.5 247.4
Prepayments for goods 8.6 13.6
Inventories 377.5 455.2 449.6
Trade receivables 320.7 306.0
Receivables from group entities - 32.5
Deferred tax assets 4.2 5.4
Other receivables 26.7 28.0
Prepayments 7.6 5.0
Receivables 359.2 376.9 377.7
Other securities and investments 0.0 0.0 -
Cash 108.9 60.8 247.2
Total current assets 845.6 892.9 1,074.5
Total assets 1,073.0 1,127.5 3,049.9
Source: K. Nissen International A/S and AX V Nissens ApS
Note: The financial statements of K. Nissen International A/S (16/17A and 17/18A) are prepared in accordance with the Danish Financial Statements Act
Note: The financial statements of AX V Nissens ApS (YTD Q3 18/19) are prepared in accordance with IFRS
Source: Annual & quarterly reports
32Reported balance sheet – Total equity and liabilities DKKm 16/17A (Audited) 17/18A (Audited) 31 January 2019 (Q3) Equity and liabilities Share capital 0.7 0.7 12.4 Retained earnings 459.4 534.6 1,197.3 Foreign currency translation reserve - - 1.1 Dividend proposed for the year 50.0 50.0 - Total equity 510.1 585.3 1,210.8 Provisions Provisions for deferred tax 1.0 5.5 - Other provisions 13.1 10.2 - Total provisions 14.1 15.7 - Liabilities Mortgage debt 148.9 162.7 - Borrowings - - 1,110.91) Deferred tax liabilities - - 178.9 Provisions - - 7.0 Long-term liabilities 148.9 162.7 1,296.8 Current portion of long-term liabilities 10.7 - - Prepayment from customers - - 45.1 Trade payables 204.9 210.5 404.3 Payables to group entities - - 58.0 Income taxes payable 29.5 25.9 31.2 Deferred income 4.8 6.2 - Provisions - - 3.7 Other payables 150.0 121.2 - Short-term liabilities 399.9 363.8 542.3 Total liabilities 548.8 542.2 1,839.1 Total equity and liabilities 1,073.0 1,127.5 3,049.9 Source: K. Nissen International A/S and AX V Nissens ApS Note: (1) Unchanged mortgage of DKK 162.7m in 31 January 2019 (Q3) balance is included in Borrowings according to classification under IFRS Note: The financial statements of K. Nissen International A/S (16/17A and 17/18A) are prepared in accordance with the Danish Financial Statements Act Note: The financial statements of AX V Nissens ApS (YTD Q3 18/19) are prepared in accordance with IFRS Source: Annual & quarterly reports 33
Reported cash flow

DKKm                                                                                                      16/17A (Audited)                        17/18A (Audited)   YTD Q3 18/19

Profit/loss for the year                                                                                               136.2                                  92.7           52.7
Adjustments1)                                                                                                           75.7                                 103.9          128,5
Change in working capital                                                                                               32.4                                 -40.1           19.6
Cash flows from operating activities before net financials                                                             244.3                                 156.5          200.8
Finance income etc.                                                                                                      0.0                                   0.0           -0.2
Finance expenses, etc.                                                                                                  -5.1                                  -5.2           52.7
Income taxes paid                                                                                                      -33.5                                 -41.7          -32.4
Share-based payment expense                                                                                                -                                     -            2.8
Cash flows from operating activities                                                                                   205.7                                 109.6          223.7
Purchase of intangible assets                                                                                           -3.1                                  -3.1            0.0
Purchase of property, plant and equipment                                                                              -46.1                                 -32.7          -20.4
Proceeds from sale of property, plant and equipment                                                                      2.8                                   0.1            0.0
Change in deposits                                                                                                      -0.7                                   0.2           -0.1
Investments in subsidiaries                                                                                                -                                     -           -1.3
Development expenditure capitalized                                                                                        -                                     -           -0.4
Cash flows from investing activities                                                                                   -47.1                                 -35.5          -22.2
Dividend distributed                                                                                                   -25.0                                 -50.0              -
Proceeds from borrowings                                                                                                   -                                   8.2              -
Repayments of borrowings                                                                                               -13.3                                  -5.3              -
Proceeds from related parties                                                                                              -                                 -32.5              -
Proceeds from loan with Group companies                                                                                    -                                     -           13.1
Interest paid                                                                                                              -                                     -          -43.7
Other cash flows from financing activities                                                                                 -                                 -42.6              -
Cash flows from financing activities                                                                                   -38.3                                -122.2          -30.6
Net cash flow                                                                                                          120.3                                 -48.1          170.9
Cash and cash equivalents
Cash and cash equivalents at 1/5                                                                                       -11.3                                108.9            76.3
Net cash flow                                                                                                          120.2                                -48.1           170.9
Cash and cash equivalents at 30/4                                                                                      108.9                                 60.8           247.2
Source: K. Nissen International A/S and AX V Nissens ApS

 Note: (1) Adjustments consist of depreciation/amortisation, net interest, income taxes paid, net foreign exchange differences and provision
 Note: The financial statements of K. Nissen International A/S (16/17A and 17/18A) are prepared in accordance with the Danish Financial Statements Act
 Note: The financial statements of AX V Nissens ApS (YTD Q3 18/19) are prepared in accordance with IFRS
 Source: Annual & quarterly reports                                                                                34
You can also read