GROWTH HELD BACK BY BREXIT
←
→
Page content transcription
If your browser does not render page correctly, please read the page content below

Q4 2019 Interim and Full-year Report

GROWTH HELD BACK
BY BREXIT
• Win23 strategy initiatives set to increase EBITDA in 2020
• Brexit uncertainty lowered volumes in Q4 2019
  and also expected to impact 2020
• Net impact expected to be positive — 2020 EBITDA outlook
  of DKK 3.5-3.9bn (2019: DKK 3.6bn)

          2019
2019               Management review                  Ferry                Logistics           Reports       Financials     Appendix        Contact     Q4 2019 Interim and Full-year Report / p 2

Highlights Q4 and 2020 outlook
Q4 2019                                                                          “We see continued headwind in 2020.                                   Revenue increased 1% to DKK 4.0bn in Q4 and increased
• Revenue up 1% to DKK 4.0bn                                                                                                                           6% to DKK 16.6bn for the full-year 2019. EBITDA before
                                                                                 Most importantly, we have to be
                                                                                                                                                       special items decreased 9% in Q4 to DKK 771m and in-
• Lower UK ferry volumes reduced                                                 cautious on the UK market outlook due                                 creased 1% to DKK 3,633m for the full-year 2019.
  North Sea and Channel results                                                  to uncertainty about the Brexit outcome.
• Mediterranean’s result decreased by                                            On the positive side, our strategic                                   The UK market for freight and passengers slowed further
                                                                                                                                                       in Q4 due to Brexit uncertainty. This lowered earnings for
  non-comparable cost items                                                      initiatives are moving forward as                                     several business units, particularly Channel and North Sea.
                                                                                 planned and therefore I still expect
Outlook 2020                                                                     earnings to grow in 2020”                                             Mediterranean’s revenue development was ahead of ex-
                                                                                                                                                       pectations in Q4 but a change in the accounting for ferry
• Around 4% revenue growth                                                       Torben Carlsen, CEO
                                                                                                                                                       maintenance and spare part costs added operating costs
• EBITDA-range DKK 3.5-3.9bn                                                                                                                           of DKK 48m. Moreover, port congestion in Trieste lowered
  (2019: DKK 3.6bn)                                                                                                                                    the efficiency of train services. More details on page 8. Op-
                                                                                                                                                       erational improvements in the route network are on track.
• Investments of around DKK 2.3bn
  (2019: DKK 2.7bn)                                                                                                                                    Logistics Division increased EBITDA 17% in Q4 as contract
                                                                                                                                                       logistics in UK & Ireland and other activities across the di-
                                                                                                                                                       vision continued to perform well despite the UK slow-
 KEY FIGURES                                                                                                                                           down.
 DKK m                                                                 2019             2018*                       2019       2018*
 Before special items                                                    Q4               Q4    Change, %        Full year   Full year      ∆%
                                                                                                                                                       Outlook 2020
 Revenue                                                              4,008             3,955           1.3%       16,592      15,717      5.6%
                                                                                                                                                       The key earnings driver of the 2020 outlook is a positive
 EBITDA                                                                 771               847          -8.9%        3,633       3,589      1.2%
 EBIT                                                                   257              427       -39.8%           1,751       1,965     -10.9%       impact from the Win23 strategy initiatives while contin-
 Profit before tax                                                      181              422       -57.1%           1,472       1,743     -15.6%       ued uncertainty about Brexit is expected to have a nega-
 * Comparative 2018 numbers are restated to IFRS 16 on a proforma and unaudited basis                                                                  tive impact. Revenue is expected to grow around 4% and
                                                                                                                                                       EBITDA before special items is expected to be within a
6 February 2020. Conference call today at 10.00am CET
                                                                                                                                                       range of DKK 3.5-3.9bn (2019: DKK 3.6bn).
Access code: 66655871# Phone numbers to the call: DK +45 35445577, US +1 631 913 1422, UK +44 333 300 0804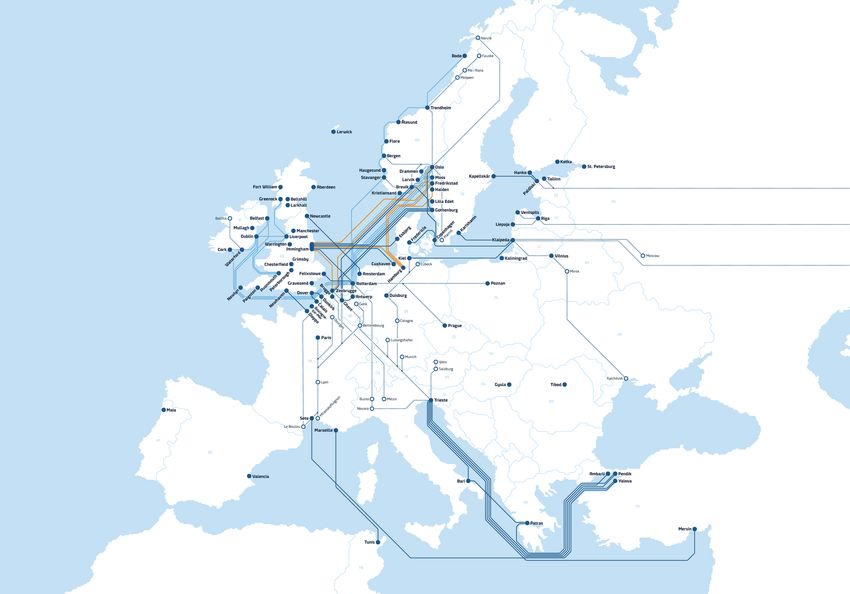
2019              Management review                 Ferry                    Logistics        Reports       Financials    Appendix       Contact    Q4 2019 Interim and Full-year Report / p 3

Key figures
2018 restated

                                                                          2019         2018*       2019    2018*
                                                                                                                          Comparison between 2019 and 2018 following implementation of IFRS 16
DKK m                                                                       Q4           Q4 Full year Full year

Income statement
Operating profit before depreciation (EBITDA) and special items            771          847       3,633     3,589
                                                                                                                          The new IFRS 16 rules on leasing were implemented from 1 January 2019.
• Ferry Division                                                           665          751       3,205     3,179
• Logistics Division                                                       125          107         470      431          Comparison figures for 2018 were restated according to IFRS 16 on a pro forma
• Non-allocated items                                                      -19          -11         -42      -21
                                                                                                                          and unaudited basis in three main sections:
Operating profit (EBIT) before
special items                                                              257          427       1,751     1,965
Financial items, net                                                       -76           -4        -278      -222         • In the text and table on page 2
Profit before tax                                                          126          459       1,371     1,694         • In the key figures table on this page
Profit for the period                                                      128          471       1,313     1,638
                                                                                                                          • In the Management review, page 5-18, including text and tables.
Capital
Total assets                                                                  -            -     26,863    24,713         In accordance with the IFRS 16 implementation method applied by DFDS, the
Equity                                                                        -            -     10,356     9,099
                                                                                                                          key figures for 2018 in the table on page 4 and the 2018 figures in the Finan-
Net interest-bearing debt                                                     -            -     11,954    11,251
Invested capital, end of period                                               -            -     22,476    20,460
                                                                                                                          cials section starting on page 20 are not restated.
Invested capital, average                                               22,101     19,629        21,438    16,210

Key operating and return ratios                                                                                           The implementation of IFRS 16 is detailed in Note 5, page 28.
EBITDA-margin, %                                                           19.2         21.4        21.9     22.8
ROIC before special items, %                                                  -            -         8.0     11.8

Key capital and per share ratios
Equity ratio, %                                                               -            -        38.6     36.8
Net interest bearing debt/EBITDA, (times)                                     -            -         3.3      3.1
* Comparative 2018 numbers are restated to IFRS 16 on a proforma and unaudited basis
2019 Management review Ferry Logistics Reports Financials Appendix Contact Q4 2019 Interim and Full-year Report / p 4
Key figures
2018 not restated
2019 2018* 2019 2018* 2019 2018* 2019 2018*
DKK m Q4 Q4 Full year Full year DKK m Q4 Q4 Full year Full year
Income statement Cash flows
Revenue 4,008 3,955 16,592 15,717 Cash flows from operating activities, before financial items and after tax 808 358 3,258 2,516
• Ferry Division 2,840 2,807 12,006 11,117 Cash flows from investing activities -777 -455 -2,651 -4,802
• Logistics Division 1,357 1,325 5,319 5,324 • Acquisition of enterprises and activities -127 0 -131 -3,635
• Non-allocated items 134 110 540 472 • Other investments, net -649 -455 -2,519 -1,167
• Eliminations -322 -287 -1,274 -1,196 Free cash flow 31 -97 607 -2,286
Operating profit before depreciation (EBITDA) and special items 771 688 3,633 2,988 Repayment of lease liabilities and interest (IFRS 16 impact reversed) -209 - -758 -
• Ferry Division 665 627 3,205 2,713 Adjusted free cash flow -177 -97 -151 -2,286
• Logistics Division 125 81 470 330
Key operating and return ratios
• Non-allocated items -19 -20 -42 -55
Average number of employees - - 8,367 7,791
Profit/loss on disposal of non-current
assets, net 2 0 6 7 Number of ships - - 70 70
Operating profit (EBIT) before Fuel consumption per nautical mile (g/GT/Nm) 4.75 4.99 4.76 4.96
special items 257 412 1,751 1,909 Revenue growth (reported), % 1.3 13.1 5.6 9.7
Special items, net -55 37 -101 -49 EBITDA-margin, % 19.2 17.4 21.9 19.0
Operating profit (EBIT) 203 449 1,650 1,859 Operating margin, % 6.4 10.4 10.6 12.1
Financial items, net -76 11 -278 -165 Revenue, invested capital average, (times) - - 0.8 1.1
Profit before tax 126 460 1,371 1,694 Return on invested capital (ROIC), % - - 7.6 13.1
Profit for the period 128 471 1,313 1,637 ROIC before special items, % - - 8.1 13.5
Profit for the period excluding Return on equity, % - - 13.5 20.7
non-controlling interest 127 465 1,309 1,630
Key capital and per share ratios
Capital Equity ratio, % - - 38.6 41.8
Total assets - - 26,863 22,132 Net interest bearing debt/EBITDA, (times) - - 3.3 2.8
DFDS A/S' share of equity - - 10,276 9,175 Earnings per share (EPS), DKK 2.21 8.13 22.88 28.99
Equity - - 10,356 9,255 Dividend paid per share, DKK 0.00 0.00 4.00 4.00
Net interest-bearing debt - - 11,954 8,513 Number of shares, end of period, '000 - - 58,632 58,632
Invested capital, end of period - - 22,476 17,908 Weighted average number of circulating shares, '000 - - 57,196 56,204
Invested capital, average 22,101 17,148 20,927 13,778 Share price, DKK - - 325.0 262.2
Market value - - 18,593 14,990
* Comparative 2018 numbers are not restated to IFRS 16
Definitions on page 35.2019 Management review Ferry Logistics Reports Financials Appendix Contact Q4 2019 Interim and Full-year Report / p 5
Management review
Market overview The largest changes in average exchange rates in Q4 2019 for deployment on the Amsterdam-Newcastle route. Moby
vs Q4 2018 was an appreciation of GBP/DKK by 3.3% would in turn acquire the two passenger ferries currently
European growth weakened further in Q4 2019 as did while NOK/DKK, SEK/DKK and TRY/DKK depreciated 4.5%, operating on Amsterdam-Newcastle, King Seaways and
trade between UK and the rest of Europe. Turkey’s econ- 3.0% and 2.1%, respectively. Princess Seaways. Moby was unfortunately not able to
omy continued to stabilise in the quarter. meet the delivery terms of the agreement and the agree-
ment was therefore cancelled by DFDS on 29 October
UK left the EU on 31 January 2020 and a transition period Major events in Q4 2019.
in which a trade agreement is to be negotiated has now
commenced. UK has initially decided to restrict the trade Restructuring of Mediterranean route network Solutions for a renewal of the ferries on the Amsterdam-
negotiation period with the EU till the end of 2020. This On 1 October 2019, the two freight ferry routes between Newcastle route continue to be explored in line with the
has renewed uncertainty about the final outcome of Brexit Istanbul and southern France, calling Toulon and Sète re- fourth pillar of the Win23 strategy: Creating more value
should a trade agreement not be finalised in 2020. UK spectively, were merged into one route, Istanbul (Yalova)- for passengers.
manufacturing and trade flows could therefore remain Sète. The termination of sailings to Toulon entailed a one-
subdued or decrease further in 2020 as industrials and off cost of DKK 35m reported under Special items in this Gothenburg-Zeebrugge space charter agreements
consumers maintain a wait-and-see response until visibil- quarter. To optimise capacity utilisation and reduce the environ-
ity improves. mental impact on the Gothenburg-Zeebrugge route, DFDS
In Istanbul, the route structure was simplified to reduce has entered into two mutual space charter agreements
After some uplift in the total trade volume of goods be- operational complexity. All sailings to France from Istan- with CLdN that also operates a freight ferry route between
tween UK and the rest of Europe in September and Octo- bul, that previously departed from two ports, now depart Gothenburg and Zeebrugge.
ber, volumes fell back sharply in the rest of Q4 2019. Oc- only from the Yalova port terminal. In addition, two
tober volumes increased 5% but decreased 6% in Novem- weekly sailings to Trieste depart from Yalova. All other The space charter agreements entail that capacity is
ber and December volumes (to be published) are likewise sailings between Istanbul and Trieste depart from the shared between route operators while all commercial ac-
expected to be below 2018. Pendik port terminal. tivities remain entirely under the control of each operator.
The flexibility of the agreements entails that the environ-
Turkey’s real GDP continued to stabilise in Q4 as did infla- Agreement on new ferries to Amsterdam-Newcastle mental footprint is reduced while offering a total of ten
tion and interest rates. The import of goods firmed up fur- cancelled weekly departures in each direction on two routes be-
ther in line with an upward trend in purchasing indexes. On 6 September 2019, DFDS entered into an agreement tween Sweden and Belgium.
with the Italian ferry company Moby to acquire two ferries2019 Management review Ferry Logistics Reports Financials Appendix Contact Q4 2019 Interim and Full-year Report / p 6
The space charter agreements started on 21 January Both transactions were completed in December 2019 and Review of 5 key DFDS performance
2020. DFDS expects in Q2 2020 to replace the three consolidated in the DFDS Group from 31 December 2019. drivers in 2019
freight ferries currently deployed on Gothenburg-Zee-
brugge with one mega freight ferry newbuilding that can Growth from Mediterranean expansion
carry 6,700 lane metres of freight per departure. The fer- Major events after Q4 More than DKK 1bn of revenue has been added in 2019
ries that are replaced are expected to be deployed else- from the full-year impact of the expansion of the ferry
where in DFDS’ European route network. New limits on sulphur emissions route network in the Mediterranean comprising the acqui-
On 1 January 2020, IMO (International Maritime Organisa- sition of U. N. Ro-Ro on 7 June 2018 and a new, major cus-
Logistics network expanded with two acquisitions tion) introduced a global limit of 0.5% on the content of tomer agreement with Ekol Logistics effective from year-
To further expand and develop DFDS’ European logistics sulphur in fuel oil down from previously 3.5%. In 2015, a end 2018.
services, DFDS acquired 100% of the share capital of the limit of 0.1% was introduced in northern Europe.
Dutch logistics company Huisman Group BV and 100% of The route network was from year-end 2018 expanded to
the share capital of the Finnish logistics company Freeco DFDS has in northern Europe complied with the limit set in accommodate a volume increase of around 30% between
Logistics. 2015 by a mix of scrubber installations and consumption Istanbul and Trieste from the new customer agreement.
of low sulphur fuel oil (Marine Gas Oil). In DFDS’ Mediterra- Additional freight ferries were deployed and two extra
Huisman Group is a provider of part-load solutions be- nean route network all deployed freight ferries are ex- ports were added to the network: Yalova, located in the
tween the Netherlands and the UK that complements pected to be equipped with scrubbers by latest August southern part of Istanbul, and a second port in Trieste. In
DFDS’ existing full-load business in these markets. Opera- 2020. July, an additional route to France was added.
tions include warehouses and cross-docking facilities in
Wijchen, the Netherlands, and Corby, England, as well as a The transition to the new rules in Mediterranean has been In 2020, the route network capacity is expected to be fur-
fleet of around 55 trailers and 50 trucks. The company planned in cooperation with customers and suppliers and ther optimised. Five scrubber installations were in opera-
has 104 employees and annual revenues of EUR 23m. the initial implementation has developed as planned. tion on 1 January 2020 and the remaining nine scrubbers
are expected to be installed by no later than August 2020.
Freeco Logistics is a Finnish provider of transport services
that brings critical mass to DFDS’ operation in Finland. Dividend Well prepared for Brexit
Freeco Logistics provides international transport services DFDS is well prepared for Brexit with regard to staff, sys-
between mainly Finland and Scandinavia, Baltics and con- The Board of Directors proposes to the 2020 annual gen- tems and processes as well as preparations in port termi-
tinental Europe. Domestic transport services are offered eral meeting (AGM) a dividend of DKK 4.00 per share. nal that will help to achieve a smooth transition in case a
as well, partly to optimise the international operation. trade deal is not in place at the end of 2020.
Operations include a fleet of around 150 trailers and 8
trucks. The company has 31 employees and annual reve- Many customers are, however, still not sufficiently pre-
nues of EUR 20m. pared for handling the transition due to insufficient aware-
ness of required customs documents and systems and this2019 Management review Ferry Logistics Reports Financials Appendix Contact Q4 2019 Interim and Full-year Report / p 7
poses risk for the transition. DFDS continues to create Revenue
awareness among customers of requirements in coopera- DKK m Q4 2019 Q4 2018 Change, % Change
tion with authorities in UK and EU. Ferry Division 2,840 2,807 1.2 33
Logistics Division 1,357 1,325 2.4 32
Non-allocated items 134 110 22.2 24
Routes strengthened by new freight ferries Eliminations -322 -287 -12.4 -36
The first two new freight ferries were deployed between DFDS Group 4,008 3,955 1.3 53
Istanbul and Trieste on 12 March and 9 June 2019, respec-
tively. The ferries are performing as expected.
in June 2019. The projects are thus continuing as part of among other things, reduced by a slowdown in trade be-
A third newbuilding was delivered in November 2019 and the strategy. tween UK and the rest of Europe as these units, among
is currently deployed between Gothenburg and Ghent. In other activities, provide solutions for goods moving be-
addition, three freight ferries are scheduled for delivery in tween UK and the Nordic and Continent regions, respec-
2020, of which one was delivered in January, and two Financial performance tively.
combined freight and passenger ferries are scheduled for
delivery in 2021. Revenue For the full-year, the Group’s revenue increased by 5.6%
The Group’s Q4 revenue was DKK 4,008m, an increase of to DKK 16,592m in 2019. Ferry Division’s full-year reve-
Digital business projects to go live 1.3% compared to 2018. nue increased 8.0% to DKK 12,006m and Logistics Divi-
The merger of Logistics Division’s online services contin- sion’s full-year revenue of DKK 5,319m was on level with
ued in Q4 by integrating quoting, booking and tracking ca- Ferry Division’s Q4 revenue increased 1.2% to 2018.
pabilities onto DFDS Direct, which will be piloted during DKK 2,840m as continued growth in the Mediterranean
Q1 2020. In Q4, the integration of the entire passenger business unit and the opening of a new route between Operating profit before depreciation (EBITDA) and
web presence on the new CEM (Customer Experience Man- Gothenburg and Zeebrugge in June 2019 offset an overall special items
agement) platform was completed. Online spot tickets for decrease in revenue from activities linked to the UK. The The Group’s Q4 EBITDA decreased 9% to DKK 771m from
freight customers grew steadily in popularity, and it is ex- decrease in revenue for UK-linked activities was due to DKK 847m in 2018.
pected to extend this service beyond the Channel during the slowdown in trade between UK and the rest of Europe
2020. Traffic to the Freight & Logistics sections of caused by Brexit uncertainty. Ferry Division’s Q4 EBITDA decreased 11% to DKK 665m.
dfds.com grew significantly during the year driven from The Q4 result reflects a negative impact from the slow-
search engines and social media, with mobile overtaking Logistics Division’s Q4 revenue increased 2.4% to down in trade between UK and the rest of Europe that es-
desktop as the preferred device. DKK 1,357m. Revenue increased 18.0% in UK & Ireland as pecially impacted the Channel and North Sea business
most activities increased and a large new cold chain logis- units. The result of the Passenger business was lowered
Improvement and efficiency projects merged with Win23 tics contract was added since the beginning of 2019. Rev- by higher costs, including timing differences.
The continuous improvement and efficiency projects have enue for the Nordic and Continent business units was,
been merged with the Win23 strategy that was launched2019 Management review Ferry Logistics Reports Financials Appendix Contact Q4 2019 Interim and Full-year Report / p 8
The result of the Mediterranean business unit was consid-
erably lower than in Q4 2018 as volumes and revenue DFDS Group - EBITDA BEFORE SPECIAL ITEMS
DKK m
grew as expected but was offset by mainly two items:
1.300
1.200
• A non-comparable cost of DKK 48m related to a change 1.100
1.000
in the accounting for ferry maintenance and spare part 900
800
costs. The accounting of such items was aligned with 700
the Group’s accounting from 1 January 2019. Such cost 600
500
items were previously capitalised and depreciated. The 400
300
full-year non-comparable cost for ferry maintenance 200
and spare parts was DKK 98m in 2019 100
0
• Lower capacity utilisation of trains operated to Euro- Q1 Q2 Q3 Q4
pean destinations due to port congestion in Trieste.
2018* 2019
Operating profit before depreciation (EBITDA) & special items
In addition, Mediterranean’s EBITDA was through the year
DKK m Q4 2019 Q4 2018 Change, % Change
reduced by a seafreight rebate linked to a new invoicing
Ferry Division 665 751 -11.4 -86
model introduced at the beginning of 2019 that incentiv- Logistics Division 125 107 17.4 19
ised payment in euro or cash, rather than Turkish lira. The Non-allocated items -19 -11 76.1 -8
purpose of the new model was to reduce currency risk DFDS Group 771 847 -8.9 -75
EBITDA-margin, % 19.2 21.4 -10.1 -2.2
that previously impacted finance items. More than 90% of
customers have adopted the new invoicing model.
Associates and joint ventures, profits on disposals and depreciation
Logistics Division’s Q4 EBITDA increased 17% to DKK m Q4 2019 Q4 2018 Change, % Change
EBITDA before special items 771 847 -8.9 -75
DKK 125m as higher earnings in UK & Ireland offset lower
Associates and joint ventures -1 -3 n.a. 2
earnings in the Nordic and Continent business units. Profit on disposals 2 0 n.a. 2
Depreciation and impairment -515 -417 -23.6 -99
EBIT before special items 257 427 -39.8 -170
For the full-year, the Group’s EBITDA increased 1% to
DKK 3,633m following an increase in Ferry Division's
Financial items
EBITDA of 1% to DKK 3,205m and an increase in Logistics
Division's EBITDA of 9% to DKK 470m. Non-allocated cor- DKK m Q4 2019 Q4 2018 Change, % Change
Interests, net -59 -48 -25.1 -12
porate costs increased to DKK -42m mainly due to devel-
Foreign exchange gains/losses, net -13 50 n.a. -63
opment projects. Other items, net -3 -6 n.a. 3
Total finance, net -76 -4 n.a. -72
* Comparative 2018 numbers are restated to IFRS 16 on a proforma and unaudited basis2019 Management review Ferry Logistics Reports Financials Appendix Contact Q4 2019 Interim and Full-year Report / p 9
Depreciation and operating profit (EBIT) before negative variance of DKK 13m on loan costs due to a tim- Cash flow and investments
special items ing difference compared to 2018. The Q4 cash flow from operating activities was
Depreciation in Q4 of DKK 515m increased 24% compared DKK 816m, including a positive cash flow from a decrease
to 2018 due to an increase in dockings and timing differ- For the full-year, the total net financing cost increased in working capital of DKK 79m.
ences vs 2018, including depreciation of logistics equip- DKK 57m or 26% to DKK 278m from DKK 222m in 2018.
ment. Moreover, depreciation increased from the ramp-up This increase was mainly due to the full-year impact of The Q4 free cash flow (FCFF) was DKK 31m and
of capacity in Mediterranean, including deployment of two loan and interest costs for the acquisition financing of DKK -177m adjusted for payment of lease liabilities
freight ferry newbuildings, a chartered freight ferry and a U. N. Ro-Ro. There was a positive variance of DKK 8m on including interest. Net investments amounted to
new port terminal agreement. Depreciation also increased net currency adjustments for the year. DKK 777m that included DKK 513m of ship investments
from the charter of two vessels to carry mainly paper vol- of which DKK 313m was ferry newbuildings and
umes from Norway. Profit before and after tax DKK 109m was for scrubbers. The net investments also
The Q4 profit before special items and tax decreased 57% included DKK 127m for acquisitions.
The Group’s Q4 EBIT before special items decreased 40% to DKK 181m. The profit after special items and tax de-
to DKK 257m. For the full-year, the Group’s EBIT before creased 73% to DKK 128m. The Q4 cash flow from financing activities was positive by
special items decreased 11% to DKK 1,751m. DKK 433m as net loan proceeds amounted to
For the full-year, the profit before special items and tax DKK 632m and payment of lease liabilities was
Special items and operating profit (EBIT) after special decreased 16% to DKK 1,472m. The profit after special DKK 198m. The Q4 net cash flow was positive by
items items and tax decreased 20% to DKK 1,313m. DKK 373m and cash amounted to DKK 840m at the end of
In Q4 2019, special items were a net cost of DKK 55m the quarter.
which included costs related to cancellation of port termi- Earnings per share
nal and agency contracts in Toulon. Q4 earnings per share (EPS) decreased 73% to DKK 2.21 Invested capital and ROIC
compared to DKK 8.13 in Q4 2018. Invested capital was DKK 22.5bn at the end of Q4 2019.
The Group’s Q4 EBIT after special items decreased 56% to Compared to year-end 2018, the invested capital in-
DKK 203m and for the full-year, the Group’s EBIT after For the full-year, earnings per share (EPS) decreased 21% creased 10% mainly due to investments of DKK 2.7bn, in-
special items decreased 14% to DKK 1,650m. to DKK 22.88 compared to DKK 28.99 in 2018. cluding the delivery of three freight ferries, and invested
capital related to a new customer agreement in Turkey.
Financial items The average invested capital in 2019 increased 32% to
Total finance, net in Q4 was a cost of DKK 76m which was DKK 21.4bn primarily due to the acquisition of U. N. Ro-Ro
DKK 72m higher compared to 2018 following a negative and related events.
variance on net currency adjustments of DKK 63m mainly
related to a gain on the depreciation of TRY in 2018. This In 2019, the return on invested capital, ROIC, was 8.0% be-
currency risk has been reduced significantly in 2019 fore special items compared to 11.8% in 2018. The de-
through a changed pricing model. Moreover, there was a2019 Management review Ferry Logistics Reports Financials Appendix Contact Q4 2019 Interim and Full-year Report / p 10
crease in ROIC was due to the full-year impact of the ac- Outlook 2020 The outbreak of the Coronavirus in China and subsequent
quisition of U. N. Ro-Ro and lower returns in most business travel restrictions could have an impact in 2020 on the
units following the general European slowdown. The outlook for 2020 builds on market growth prospects demand for European passenger ferry services.
as well as the Win23 strategy initiatives and expectations
Capital structure of a continued negative impact from Brexit uncertainty on Positive impact from Win23 strategy initiatives
At the end of Q4 2019 net-interest-bearing debt (NIBD) the UK market. expected
was DKK 12.0bn, an increase of 6% compared to year-end The overall financial ambition of Win23 is to achieve an
2018 following the increase in the invested capital. Market growth prospects EBITDA of around DKK 5.5bn in 2023 driven by three key
The global backdrop is expected to improve in 2020 as drivers:
Financial leverage, as measured by the ratio of NIBD to monetary and fiscal policies are set to remain supportive,
EBITDA before special items, was a ratio of 3.3 which com- less uncertainty is expected from USA-China trade negoti- • Organic actions
pared to 3.1 at year-end 2018. The equity ratio was 39% ations and a generally more positive outlook trend for • Mediterranean business plan fulfillment
at the end of Q4 2019 compared to 37% at year-end manufacturing is emerging in purchasing indexes. • Acquisitions and business expansion.
2018.
Turkish economic fundamentals such as inflation, interest All three are expected to contribute positively to EBITDA
Equity rates and debt levels have improved through 2019. The in 2020. The largest contribution is expected to come from
Equity amounted to DKK 10,356m at the end of Q4 2019, Turkish manufacturing outlook is also trending upwards. Mediterranean as the improved outlook for Turkey is set
including minority interests of DKK 80m. This was an in- Turkey is thus expected to emerge from recession and re- to support growth. In addition, operational efficiency and
crease of 12% or DKK 1.1bn compared to equity at year- sume growth in 2020. customer satisfaction is forecast to increase as the capac-
end 2018 driven mainly by total comprehensive income ity expansion of the route network started at the begin-
for 2019 of DKK 1,535m while transactions with owners UK manufacturing and trade flows weakened, on the other ning of 2019 is completed during Q2 2020.
decreased equity by DKK 201m, including distribution of hand, further in Q4 2019 and UK’s decision to restrict the
DKK 229m as dividend. Change in accounting policies (im- trade negotiation period with EU till end 2020 has re- The largest contribution from Organic Actions is expected
plementation of IFRS 16) reduced equity with DKK 232m. newed uncertainty about the outcome of Brexit. Therefore, to come from the deployment of two freight ferry new-
UK manufacturing and trade flows could continue to de- buildings on Vlaardingen-Immingham. The focus on grow-
crease in 2020 as industrials and consumers maintain a ing sales of solutions to the automotive, forest/metal and
Management shareholdings wait-and-see response until visibility improves. cold chain sectors is also expected to begin to contribute
in 2020. In addition, contributions are expected from digit-
Current holdings of DFDS shares for Torben Carlsen, CEO, The current consensus estimate for European real GDP isation, continuous improvement and passenger projects.
and Karina Deacon, CFO, are available at growth in 2020 is around 1.0%, including 1.1% for UK. Tur-
https://www.dfds.com/group/about/management. key’s real GDP is expected to be around 2.8% in 2020. A new freight ferry route between Gothenburg and Zee-
(Source: Thomson Reuters). brugge and space charter agreements were started in June2019 Management review Ferry Logistics Reports Financials Appendix Contact Q4 2019 Interim and Full-year Report / p 11
2019 and two logistics acquisitions were completed in De- OUTLOOK 2020
cember 2019. These new activities are also expected to DKK m Outlook 2020 2019
Revenue growth 4% 16,592
contribute positively in 2020.
EBITDA before special items 3,500-3,900 3,633
Per division:
Negative Brexit impact expected Ferry Division 3,075-3,425 3,205
Logistics Division 475-525 470
The uncertainty caused by the Brexit process had a con-
Non-allocated items -50 -42
siderable negative impact in 2019 on UK freight and pas- Depreciation change -2% -1,894
senger volumes. In light of the continued uncertainty Special items 100 -101
Investments -2,300 -2,651
about the Brexit process and outcome, a negative earnings
impact is therefore included in the outlook as the trading
environment could remain subdued or weaken further
through 2020. Special items • Port terminals and other equipment: DKK 300m
Special items is expected to be an income of around • Cargo carrying equipment and warehouses, mainly re-
Revenue outlook DKK 100m from an accounting profit on a sale of a lated to Logistics Division: DKK 200m
The Group’s revenue is expected to increase by around combined freight and passenger ferry (ro-pax) agreed in • Other investments, including IT and digital: DKK 100m.
4% compared to 2019. 2019. Delivery of the ferry is planned for April 2020.
In addition to the above, the investment outlook includes
The main growth drivers are continued growth in the Medi- Investments proceeds from sale of assets, including the agreed sale of
terranean business unit, a full-year impact from acquisi- Investments of around DKK 2.3bn are expected in 2020. In one combined passenger and freight ferry (ro-pax).
tions and business expansion as well as a positive impact 2020, one new freight ferry (ro-ro) was delivered in Janu-
from organic actions, including increased sales to custom- ary and two newbuildings are scheduled for delivery in
ers in select industries — automotive, forest/metal and March and October, respectively. Two combined freight
cold chain. and passenger ferries (ro-pax) are on order for delivery to-
wards the end of 2021 and interim payments for these
The revenue of activities linked to the UK market is in to- ferries are included in the investments below.
tal expected to be around level with 2019 due to expecta-
tions of a continued weak development in freight and pas- Investments expected in 2020 comprise:
senger volumes.
• Freight ferry (ro-ro) newbuildings: DKK 1,000m
EBITDA outlook • Combined freight and passenger ferry (ro-pax) newbuild-
The Group’s EBITDA before special items is expected to be ings: DKK 350m
within a range of DKK 3.5-3.9bn (2019: DKK 3.6bn). See • Scrubbers: DKK 175m
outlook table above for divisional split. • Dockings and ferry upgrades: DKK 350m2019 Management review Ferry Logistics Reports Financials Appendix Contact Q4 2019 Interim and Full-year Report / p 12 A number of risks and uncertainties The outlook can moreover be impacted pertain to the outlook. The most by political changes, first and foremost important among these are possible within EU and Turkey. In that regard, major changes in the demand for ferry Brexit constitutes an important risk. and logistics services. For DFDS, such Changes in economic variables, demand is to a large extent linked to the especially the oil price and exchange level of economic activity in primarily rates, can furthermore impact earnings. Europe, especially northern Europe and in particular UK, as well as adjacent Future financial results may therefore regions, including Turkey. Demand can differ significantly from expectations. also be impacted by competitor actions.
2019
DFDS’ route map and                 Management review
                    logistics locations                               Ferry   Logistics   Reports   Financials   Appendix   Contact   Q4 2019 Interim and Full-year Report / p 13
At the end of 2019, DFDS operated 23 ferry routes of which 9 routes carried
passengers. 8 port terminals are operated as part of the route network.

The logistics activities provide solutions from 35 locations.
2019 Management review Ferry Logistics Reports Financials Appendix Contact Q4 2019 Interim and Full-year Report / p 14
Ferry Division Ferry Division
DKK m Q1
2019
Q2 Q3 Q4
2019
Full year Q1
2018*
Q2 Q3
2018*
Q4 Full year
Revenue 2,714 3,101 3,352 2,840 12,006 2,301 2,729 3,280 2,807 11,117
EBITDA before special items 584 877 1,079 665 3,205 500 829 1,099 751 3,179
The division is organised in five Share of profit/loss of associates and
joint ventures 2 6 -1 -1 6 3 1 -1 -1 2
business units: Profit/loss on disposal of non-current assets, net 1 0 1 0 2 1 0 0 0 1
Depreciation and impairment -363 -365 -382 -402 -1,512 -298 -330 -357 -338 -1,323
• North Sea EBIT before special items
EBIT margin before special items, %
223
8.2
518
16.7
696
20.8
263
9.3
1,701
14.2
206
9.0
500
18.3
742
22.6
411
14.6
1,859
16.7
• Baltic Sea Special items, net 0 -6 4 -51 -53 -1 -45 23 40 17
EBIT 223 512 701 212 1,648 205 456 764 451 1,876
• Channel Invested capital, average 18,841 19,193 19,460 19,768 19,318 10,203 13,858 17,422 18,031 14,783
ROIC before special items, % - - - - 8.7 - - - - 12.4
• Mediterranean Lane metres, '000 10,593 9,715 10,530 10,442 41,280 9,536 10,046 10,211 10,283 40,077
• Passenger Passengers, '000 732 1,390 2,004 991 5,116 862 1,409 2,163 1,003 5,439
* Comparative 2018 numbers are restated to IFRS 16 on a proforma and unaudited basis
Q4 market, activity and result trends
Baltic Sea some market share was regained following a loss of share
North Sea
Q4 freight volumes were 0.9% below 2018 adjusted for earlier in the year.
Q4 freight volumes were 0.7% above 2018 and down
the closure of a space charter agreement between St. Pe-
6.5% adjusted for the new route between Gothenburg and
tersburg and Kiel. Volumes were in general lowered by Passenger volumes were down 2.7% as the travel market
Zeebrugge. Full-year volumes were down 5.5%, likewise
some slowdown in two key markets: Germany and Swe- is negatively impacted by uncertainty related to the Brexit
adjusted. Volumes on all routes linked to UK were reduced
den, and additional competition. Passenger volumes were process. The number of UK and eastern European passen-
by the slowdown in trade between UK and the rest of Eu-
up 1.0% driven by higher volumes between Sweden and gers decreased while tourist flows from other European
rope that set in after the initial Brexit date, 29 March
Estonia. countries were more stable. Revenue per pax was above
2019. Volumes on the new route between Sweden and
2018.
Belgium that started in June 2019 were below expecta-
EBIT in Q4 increased 7% to DKK 83m following lower op-
tions in Q4.
erating costs and a higher passenger result. Q4 EBIT was halved to DKK 35m mainly driven by higher
operating costs and lower freight earnings.
EBIT in Q4 decreased 23% to DKK 142m mainly due to the
Channel
lower volumes and a negative impact from the new route.
Q4 freight volumes were 0.6% below 2018. Total market Mediterranean
volumes decreased more in Q4 as a result of the slow- Q4 freight volumes increased 24.1% driven by the new
down in trade between UK and the rest of Europe but customer agreement that came into effect from year-end2019 Management review Ferry Logistics Reports Financials Appendix Contact Q4 2019 Interim and Full-year Report / p 15
2018. In addition, a new route between Istanbul and Sète Passenger
was opened on 5 July 2019. The number of passengers in Q4 increased 1.3% as both
routes carried more passengers than in 2018. Tourism vol-
Trading between Turkey and Europe improved in Q4 as umes between UK and continental Europe were robust in
Turkish import volumes continued to recover to levels the quarter.
above 2018. There is, however, still a high level of empty
units being transported. Some market share has been lost Q4 EBIT decreased DKK 32m to DKK -57m. The route con-
to overland solutions as customer service levels have not tribution was above 2018 but higher ferry operating costs
been satisfactory due to operational challenges. and depreciation reduced the result partly due to class
dockings and timing differences.
The simplified route and port terminal structure intro-
duced at the start of Q4 is improving operational effi- Non-allocated items
ciency and customer satisfaction. The last major restruc- These items primarily include external charter activities.
turing to be completed is to improve the operational effi- Q4 EBIT increased 60% to DKK 31m.
ciency of the two ports currently operated in Trieste. This
is expected to be achieved during Q2 2020.
EBIT in Q4 decreased DKK 54m to DKK 29m. The route
contribution, driven by volumes and pricing, was above
2018 and in line with expectations but was offset by
mainly the two items detailed on page 8.2019 Management review Ferry Logistics Reports Financials Appendix Contact Q4 2019 Interim and Full-year Report / p 16
Ferry Division
2019 2019 2018* 2018*
DKK m Q1 Q2 Q3 Q4 Full year Q1 Q2 Q3 Q4 Full year
North Sea
Revenue 963 963 925 925 3,777 967 964 897 907 3,734
EBIT before special items 190 199 144 142 675 161 198 151 186 696
Invested capital 5,596 5,617 5,455 5,816 5,520 5,861 5,623 5,514 5,116 5,592
ROIC before special items, % - - - - 12.1 - - - - 12.2
Lane metres freight, '000 3,327 3,039 3,214 3,234 12,815 3,347 3,367 3,148 3,215 13,077
Baltic Sea
Revenue 350 389 398 335 1,472 343 392 410 364 1,509
EBIT before special items 40 97 125 83 345 70 104 111 77 363
Invested capital 1,322 1,272 1,322 1,283 1,384 1,358 1,359 1,211 1,722 1,393
ROIC before special items, % - - - - 24.7 - - - - 26.0
Lane metres freight, '000 1,187 1,171 1,137 1,118 4,613 1,102 1,182 1,148 1,143 4,575
Passengers, '000 43 68 88 47 245 36 58 83 47 224
Channel
Revenue 571 638 846 622 2,678 573 687 895 647 2,803
EBIT before special items 34 31 168 35 268 25 80 222 71 397
Invested capital 1,979 1,854 1,845 1,727 1,830 2,039 1,884 1,786 1,744 1,866
ROIC before special items, % - - - - 14.6 - - - - 21.2
Lane metres freight, '000 4,902 4,311 4,945 4,837 18,995 4,896 4,995 4,906 4,866 19,663
Passengers, '000 468 936 1,490 627 3,520 556 992 1,659 644 3,850
Mediterranean**
Revenue 515 567 555 542 2,179 31 170 443 481 1,124
EBIT before special items 46 80 76 29 231 3 29 67 83 182
Invested capital 9,047 9,529 9,594 9,833 9,304 123 7,436 7,468 8,517 4,732
ROIC before special items, % - - - - 2.4 - - - - 3.8
Lane metres freight, '000 1,071 1,060 1,110 1,124 4,365 61 351 875 919 2,206
Passenger
Revenue 251 497 601 360 1,709 298 466 604 360 1,728
EBIT before special items -110 76 149 -57 59 -80 57 164 -25 116
Invested capital 704 716 891 860 790 585 501 671 780 654
ROIC before special items, % - - - - 7.1 - - - - 17.4
Lane metres freight, '000 106 133 124 129 491 130 151 134 140 556
Passengers, '000 222 386 426 317 1,351 270 361 421 312 1,365
Non-allocated items
Revenue 107 105 96 153 461 119 110 99 154 481
EBIT before special items 23 34 34 31 123 27 33 26 19 105
* Comparative 2018 numbers are restated to IFRS 16 on a proforma and unaudited basis
** U.N. Ro-Ro was acquired 7 June 2018.
The invested capital in the quarter is shown as per the end of the period. For the full year, the invested capital is shown as an average.2019 Management review Ferry Logistics Reports Financials Appendix Contact Q4 2019 Interim and Full-year Report / p 17
Logistics Division
Logistics Division DKK m
Revenue
Q1
1,348
2019
Q2
1,318
Q3
1,296
Q4
1,357
2019
Full year
5,319
Q1
1,385
2018*
Q2
1,341
Q3
1,272
2018*
Q4 Full year
1,325 5,324
EBITDA before special items 109 116 120 125 470 105 116 103 107 431
Profit/loss on disposal of non-current assets, net 1 0 1 2 4 1 2 1 0 5
The division is organised in three Depreciation and impairment -65 -70 -74 -92 -301 -56 -56 -58 -58 -229
business units: EBIT before special items 45 47 47 35 173 49 61 48 49 207
EBIT margin before special items, % 3.3 3.5 3.6 2.6 3.3 3.5 4.6 3.7 3.7 3.9
Special items, net 0 -6 0 0 -7 -17 0 0 5 -11
• Nordic EBIT 45 41 47 35 167 32 61 48 54 196
Invested capital, average 1,527 1,591 1,580 1,695 1,606 1,412 1,445 1,405 1,432 1,418
• Continent ROIC before special items, % - - - - 8.8 - - - - 12.3
• UK & Ireland Tons, '000
Units, '000
174.3
135.1
185.3
134.8
201.3
137.3
204.8
141.1
765.7
548.3
97.7
145.5
102.8
146.7
103.5
133.1
113.2
141.7
417.3
567.0
* Comparative 2018 numbers are restated to IFRS 16 on a proforma and unaudited basis
Q4 market, activity and result trends
Continent dition of a new large cold chain logistics contract. Aqua-
Nordic The number of transported units in Q4 decreased 8.8% as culture volumes in Scotland were slightly down due to ad-
The number of transported units in Q4 decreased 9.7% as the UK slowdown in trade reduced volumes between UK verse weather conditions. There was a reduction of vol-
volumes decreased in all corridors to UK due to the gen- and continental Europe mainly impacting the Dutch and umes in the distribution and warehousing activities in Eng-
eral slowdown in UK trade. In addition, volumes were German corridors. Container volumes between Ireland and land as contracts were reduced in scope but this was more
lower for specialised services and project volumes to the continental Europe were on level with 2018. Volumes in than offset by growth in other parts of the network. Vol-
Swedish construction industry from the Baltic region. This the Continent-Sweden corridor and some contract logistics umes in the Belfast corridors continued to grow.
was offset by an increase in automotive, special cargo and activities in Belgium continued to be above 2018.
Swedish domestic volumes. The number of tonnes carried Q4 EBIT increased 22% to DKK 24m as most activities im-
by the Norwegian sideport shipping activity rose 81% fol- Q4 EBIT decreased 58% to DKK 3m due to a negative im- proved performance except for a decrease in the scope of
lowing a new paper industry contract. pact from the UK slowdown, extra workshop costs in Bel- a contract in the distribution and warehousing activities in
gium and some one-off income in 2018. England.
Q4 EBIT decreased 62% to DKK 8m due to the lower level
of volumes, particularly specialised services. Moreover, UK & Ireland
higher operating costs in a Swedish warehousing operation The number of transported units in Q4 increased 10.3%
and in the Norwegian sideport shipping activity reduced adjusted for changes in the reporting of volumes. Most ar-
earnings. eas contributed to the volume increase, including the ad-2019 Management review Ferry Logistics Reports Financials Appendix Contact Q4 2019 Interim and Full-year Report / p 18
Logistics Division
2019 2019 2018* 2018*
DKK m Q1 Q2 Q3 Q4 Full year Q1 Q2 Q3 Q4 Full year
Nordic
Revenue 448 450 408 442 1,748 517 485 413 451 1,866
EBIT before special items 16 15 13 8 52 26 27 15 22 90
Invested capital 454 477 412 502 462 486 421 402 465 456
ROIC before special items, % - - - - 9.6 - - - - 17.8
Units, '000 ** 30.3 29.1 27.9 29.6 116.9 37.6 34.7 29.6 32.7 134.6
Tons, '000 174.3 185.3 201.3 204.8 765.7 97.7 102.8 103.5 113.2 417.3
Continent
Revenue 618 586 588 598 2,390 626 622 598 612 2,458
EBIT before special items 14 17 16 3 50 18 22 19 8 67
Invested capital 655 679 694 833 691 567 572 574 596 545
ROIC before special items, % - - - - 5.7 - - - - 10.0
Units, '000 62.4 60.3 59.4 58.7 240.9 66.8 68.1 62.6 64.4 261.8
UK & Ireland
Revenue 328 325 339 358 1,350 274 284 292 304 1,154
EBIT before special items 15 15 18 24 72 4 13 14 19 50
Invested capital 487 432 467 483 453 431 413 429 397 416
ROIC before special items, % - - - - 12.8 - - - - 9.2
Units, '000 42.3 45.3 50.0 52.8 190.5 41.2 43.9 41.0 44.5 170.5
Non-allocated items
Revenue 62 61 59 54 235 74 57 58 54 244
EBIT before special items 0 0 0 -1 0 0 0 0 0 0
* Comparative 2018 numbers are restated to IFRS 16 on a proforma and unaudited basis
** Excluding volumes related to automotive Logistics contract.
The invested capital in the quarter is shown as per the end of the period. For the full year, the invested capital is shown as an average.2019 Management review Ferry Logistics Reports Financials Appendix Contact Q4 2019 Interim and Full-year Report / p 19
Management statement
The Board of Directors and the Executive Board have
reviewed and approved the interim report of DFDS A/S for
the period 1 January – 31 December 2019.
The interim report, which has not been audited or re-
viewed by the Company’s auditor, has been prepared in
accordance with IAS 34, “Interim Financial Reporting”, as
adopted by the EU, and additional Danish interim report-
ing requirements for listed companies.
In our opinion, the interim report gives a true and fair
view of the DFDS Group’s assets, liabilities and financial
position at 31 December 2019 and of the results of the
DFDS Group’s operations and cash flow for the period 1
January – 31 December 2019.
Further, in our opinion, the Management review p. 1-18
gives a true and fair review of the development in the
Group’s operations and financial matters, the result of the
DFDS Group’s operations for the period and the financial
position as a whole.
Executive Board Torben Carlsen, CEO. Karina Deacon, CFO
Copenhagen, 6 February 2020
Board of directors Claus Hemmingsen, Chair. Klaus Nyborg, Deputy Chair
Anders Götzsche, Jens Otto Knudsen, Jill Lauritzen Melby,
Jesper Hartvig Nielsen, Lars Skjold-Hansen, Dirk Reich, Marianne Dahl Steensen2019 Management review Ferry Logistics Reports Financials Appendix Contact Q4 2019 Interim and Full-year Report / p 20
DFDS Group Income statement
2019 2018* 2019 2018*
DKK m Note Q4 Q4 Full year Full year
Revenue 3 4,008 3,955 16,592 15,717
Costs
Ferry and other ship operation and maintenance -900 -997 -3,667 -3,583
Freight handling -612 -583 -2,521 -2,447
Transport solutions -766 -809 -2,994 -3,191
Employee costs -788 -719 -3,077 -2,796
Costs of sales and administration -171 -159 -699 -712
Operating profit before depreciation (EBITDA) and special items 771 688 3,633 2,988
Share of profit/loss of associates and joint ventures -1 -3 6 1
Profit/loss on disposal of non-current assets, net 2 0 6 7
Depreciation, ships 5 -320 -195 -1,225 -790
Depreciation, other non-current assets 5 -190 -77 -662 -296
Impairment losses, other non-current assets -6 0 -7 -1
Operating profit (EBIT) before special items 257 412 1,751 1,909
Special items, net 4 -55 37 -101 -49
Operating profit (EBIT) 203 449 1,650 1,859
Financial income 2 50 6 6
Financial costs -78 -39 -284 -171
Profit before tax 126 460 1,371 1,694
Tax on profit 1 11 -59 -57
Profit for the period 128 471 1,313 1,637
Attributable to:
Equity holders of DFDS A/S 127 465 1,309 1,630
Non-controlling interests 1 6 4 8
Profit for the period 128 471 1,313 1,637
Earnings per share
Basic earnings per share (EPS) of DKK 20, DKK 2.21 8.13 22.88 28.99
Diluted earnings per share (EPS-D) of DKK 20, DKK 2.21 8.11 22.80 28.87
* Comparative 2018 numbers are not restated to IFRS 162019 Management review Ferry Logistics Reports Financials Appendix Contact Q4 2019 Interim and Full-year Report / p 21
DFDS Group – statement of Comprehensive income
2019 2018* 2019 2018*
DKK m Q4 Q4 Full year Full year
Profit for the period 128 471 1,313 1,637
Other comprehensive income
Items that will not be reclassified subsequently to the Income statement:
Remeasurement of defined benefit pension obligations 106 122 106 122
Items that will not be reclassified subsequently to the Income statement 106 122 106 122
Items that are or may be reclassified subsequently to the Income statement:
Value adjustment of hedging instruments:
Value adjustment for the period -38 30 169 321
Value adjustment transferred to operating costs 8 -2 12 -7
Value adjustment transferred to financial costs 4 29 20 -48
Value adjustment transferred to non-current tangible assets -39 -19 -113 -21
Tax on items that may be reclassified to the Income statement -19 45 -15 -1
Foreign exchange adjustments, subsidiaries 59 -18 42 -59
Items that are or may be reclassified subsequently to the Income statement -24 66 116 186
Total other comprehensive income after tax 81 187 222 308
Total comprehensive income 209 659 1,535 1,945
Attributable to:
Equity holders of DFDS A/S 208 652 1,530 1,937
Non-controlling interests 1 7 5 8
Total comprehensive income 209 659 1,535 1,945
* Comparative 2018 numbers are not restated to IFRS 162019 Management review Ferry Logistics Reports Financials Appendix Contact Q4 2019 Interim and Full-year Report / p 22
DFDS Group - Balance sheet
Assets Equity and liabilities
2019 2018* 2019 2018*
DKK m Note Full year Full year DKK m Note Full year Full year
Goodwill 3,440 3,337 Share capital 1,173 1,173
Other non-current intangible assets 1,227 1,205 Reserves -120 -251
Software 241 245 Retained earnings 9,223 8,019
Development projects in progress 25 2 Proposed dividends 0 235
Non-current intangible assets 4,934 4,788 Equity attributable to equity holders of DFDS A/S 10,276 9,175
Non-controlling interests 80 80
Land and buildings 201 163
Equity 10,356 9,255
Terminals 5 741 1,434
Ships 10,950 9,731
Interest-bearing liabilities 9,186 8,132
Equipment, etc. 5 742 740
Lease liabilities 5 2,556 257
Assets under construction and prepayments 1,034 1,021
Deferred tax 213 211
Right-of-use assets 5 3,337 -
Pension and jubilee liabilities 160 263
Non-current tangible assets 17,006 13,089
Other provisions 47 17
Investments in associates, joint ventures and securities 53 43 Derivative financial instruments 69 74
Receivables 29 138 Non-current liabilities 12,231 8,954
Prepaid costs 129 91
Interest-bearing liabilities 480 833
Deferred tax 47 70
Lease liabilities 5 552 35
Derivative financial instruments 242 175
Trade payables 2,292 2,296
Other non-current assets 500 517
Payables to associates and joint ventures 109 24
Non-current assets 22,440 18,395
Other provisions 38 50
Inventories 219 201 Corporation tax 30 23
Trade receivables 2,409 2,077 Other payables 581 470
Receivables from associates and joint ventures 46 86 Derivative financial instruments 19 20
Other receivables 422 296 Prepayments from customers 172 171
Prepaid costs 336 259 Current liabilities 4,275 3,923
Derivative financial instruments 75 57
Liabilities 16,506 12,877
Cash 840 761
Current assets 4,347 3,736 Equity and liabilities 26,863 22,132
Assets classified as held for sale 76 - * Comparative 2018 numbers are not restated to IFRS 16
Total current assets 4,423 3,736
Assets 26,863 22,1322019 Management review Ferry Logistics Reports Financials Appendix Contact Q4 2019 Interim and Full-year Report / p 23
DFDS Group - Statement of changes in equity 1 January - 31 December 2019
Reserves
Equity
attributable
to equity Non-
Share Translation Hedging Treasury Retained Proposed holders controlling
DKK m capital reserve Reserve shares earnings dividends of DFDS A/S interests Total
Equity at 1 January 2019 1,173 -398 177 -29 8,019 235 9,175 80 9,255
Change in accounting policies* -231 -231 -1 -232
Restated equity at 1 January 2019 1,173 -398 177 -29 7,788 235 8,944 79 9,022
Comprehensive income for the period
Profit for the period 1,309 1,309 4 1,313
Other comprehensive income
Items that will not be reclassified subsequently to the Income statement:
Remeasurement of defined benefit pension obligations 106 106 106
Items that will not subsequently be reclassified to the Income statement 0 0 0 0 106 0 106 0 106
Items that are or may be reclassified subsequently to the Income statement:
Value adjustment of hedging instruments for the period 169 169 169
Value adjustment transferred to operating costs 12 12 12
Value adjustment transferred to financial costs 20 20 20
Value adjustment transferred to non-current tangible assets -113 -113 -113
Tax on items that will be reclassified to the Income statement -15 -15 -15
Foreign exchange adjustments, subsidiaries 42 42 1 42
Items that are or may subsequently be reclassified to the Income statement 0 42 89 0 -15 0 115 1 116
Total other comprehensive income after tax 0 42 89 0 91 0 221 1 222
Total comprehensive income 0 42 89 0 1,399 0 1,530 5 1,535
Transactions with owners
Dividend paid -229 -229 -3 -232
Dividend on treasury shares 6 -6 0 0
Proposed dividend at year-end -235 235 0 0
Vested share-based payments 25 25 25
Cash from sale of treasury shares related to exercise of share options 1 6 7 7
Other adjustments -1 -1 -1
Transactions with owners 0 0 0 1 -198 0 -197 -3 -201
Equity at 31 December 2019 1,173 -357 266 -28 8,988 235 10,276 80 10,356
*Impact from implementation of IFRS 16, reference is made to note 52019 Management review Ferry Logistics Reports Financials Appendix Contact Q4 2019 Interim and Full-year Report / p 24
DFDS Group - Statement of changes in equity 1 January - 31 December 2018**
Reserves
Equity
attributable
Revaluation to equity Non-
Share Translation Hedging of Treasury Retained Proposed holders controlling
DKK m capital reserve Reserve securities shares earnings dividends of DFDS A/S interests Total
Equity at 1 January 2018 1,140 -340 -68 0 -47 5,652 228 6,565 49 6,614
Change in accounting policies* -0 0 0 0
Restated equity at 1 January 2018 1,140 -340 -68 0 -47 5,652 228 6,565 49 6,614
Comprehensive income for the period
Profit for the period 1,630 1,630 8 1,637
Other comprehensive income
Items that will not subsequently be reclassified to the income statement:
Remeasurement of defined benefit pension obligations 122 122 122
Items that will not subsequently be reclassified to the Income statement 0 0 0 0 0 122 0 122 0 122
Items that are or may be reclassified subsequently to the Income statement:
Value adjustment of hedging instruments for the period 321 321 321
Value adjustment transferred to operating costs -7 -7 -7
Value adjustment transferred to financial costs -48 -48 -48
Value adjustment transferred to non-current tangible assets -21 -21 -21
Tax on items that will be reclassified to the Income statement -1 -1 -1
Foreign exchange adjustments, subsidiaries -59 -59 0 -59
Items that are or may subsequently be reclassified to the Income statement 0 -59 245 0 0 -1 0 186 0 186
Total other comprehensive income after tax 0 -59 245 0 0 121 0 307 0 308
Total comprehensive income 0 -59 245 0 0 1,751 0 1,937 8 1,945
Transactions with owners
Acquisition, non-controlling interests 1 1 6 7
Addition related to acquisition 0 17 17
Dividend paid -219 -219 -219
Dividend on treasury shares 9 -9 0 0
Proposed dividend at year-end -235 235 0 0
Vested share-based payments 25 25 25
Purchase of treasury shares -11 -179 -190 -190
Cash from sale of treasury shares related to exercise of share options 9 50 59 59
Reduction of share capital by cancellation of treasury shares -20 20 0 0
Increase of capital 53 947 1,000 1,000
Other adjustments -3 -3 -3
Transactions with owners 33 0 0 0 18 616 7 673 23 696
Equity at 31 December 2018 1,173 -398 177 0 -29 8,019 235 9,175 80 9,255
* According to the new IFRS 9 changes in Fair value of securities are recognised via the Income Statement.
Due to immaterial effects from implementing IFRS 9 and IFRS 15, the 1 January 2018 Equity has not been restated except for DKK 0.1m which has been reclassified within the Equity.
** Comparative 2018 numbers are not restated to IFRS 162019 Management review Ferry Logistics Reports Financials Appendix Contact Q4 2019 Interim and Full-year Report / p 25
DFDS Group – Statement of cash flows
2019 2018* 2019 2018*
DKK m Q4 Q4 Full year Full year
Operating profit before depreciation (EBITDA) and special items 771 688 3,633 2,988
Cash flow effect from special items related to operating activities -32 -29 -78 -99
Adjustments for non-cash operating items, etc. 7 20 26 20
Change in working capital 79 -292 -224 -283
Payment of pension liabilities and other provisions -9 -12 -52 -41
Cash flow from operating activities, gross 816 375 3,304 2,585
Interest received, etc. 2 44 6 5
Interest paid, etc. -92 -85 -266 -233
Taxes paid -8 -18 -46 -69
Cash flow from operating activities, net 718 317 2,997 2,289
Investments in ships including dockings, rebuildings and ships under construction (incl. settlement of forward exchange contracts) related thereto -531 -251 -2,120 -934
Sale of ships including prepayment received on ship held for sale 23 4 117 84
Investments in other non-current tangible assets -121 -203 -467 -306
Sale of other non-current tangible assets 4 3 13 16
Investments in non-current intangible assets -22 -9 -66 -30
Acquisition of enterprises, associates, joint ventures and activities -127 0 -131 -3,635
Sale of activities etc. 0 0 0 2
Other investing cash flows -2 1 4 1
Cash flow to/from investing activities, net -777 -455 -2,651 -4,802
Cash flow before financing activities, net -59 -138 346 -2,513
Proceed from bank loans and loans secured by mortgage in ships 880 671 1,658 6,279
Repayment and instalments of bank loans and loans secured by mortgage in ships -248 -916 -799 -1,290
Proceed from issuance of corporate bonds 0 0 304 0
Repayment of corporate bonds incl. settlement of cross currency swap 0 0 -500 -203
Payment of loan in acquired entity 0 0 0 -2,756
Payment of lease liabilities -198 -449 -706 -453
Acquisition of treasury shares 0 0 0 -190
Cash received from exercise of share options 1 0 7 59
Other financing cash flows -3 9 -3 15
Proceed from increase of share capital 0 0 0 1,000
Dividends paid to equity holders of DFDS A/S 0 0 -229 -219
Cash flow to/from financing activities, net 433 -686 -268 2,242
Net increase (decrease) in cash and cash equivalents 373 -824 79 -272
Cash and cash equivalents at beginning of period 466 1,585 761 1,033
Foreign exchange and value adjustments of cash and cash equivalents 0 -1 0 -1
Cash and cash equivalents at end of period ** 840 761 840 761
* Comparative 2018 numbers are not restated to IFRS 16
** At 31 December 2019 DKK 108m (31 December 2018: DKK 43m) of the cash was deposited on restricted bank accounts.
The statement of cash flows cannot directly be derived from the Income Statement and the Balance Sheet.You can also read


