Risk-exposure assessment of Department of Conservation (DOC) coastal locations to flooding from the sea
←
→
Page content transcription
If your browser does not render page correctly, please read the page content below
SCIENCE FOR CONSERVATION 332

Risk-exposure assessment of
Department of Conservation (DOC)
coastal locations to flooding from the sea
A national risk assessment of DOC assets, archaeological sites,
recreation functional locations, destinations and ecosystem and
species management units vulnerable to coastal inundation and
sea-level rise

Andrew Tait
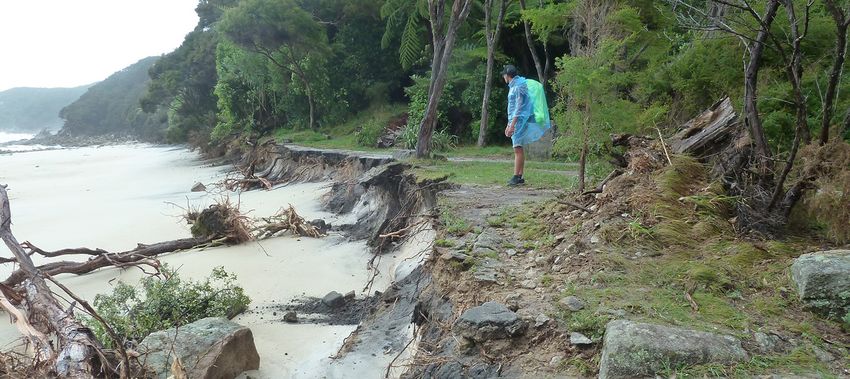
Cover: Tonga Quarry Picnic Area and (former) Campground, Abel Tasman Coastal Track, 1 February 2018, after ex-tropical cyclone Fehi.
Photo: Margaret Hall.

Science for Conservation is a scientific monograph series presenting research funded by New Zealand Department of Conservation (DOC).
Manuscripts are internally and externally peer-reviewed; resulting publications are considered part of the formal international scientific
literature.

This report is available from the departmental website in pdf form. Titles are listed in our catalogue on the website, refer
www.doc.govt.nz under Publications.

© Copyright February 2019, New Zealand Department of Conservation

ISSN       1177–9241 (web PDF)
ISBN       978–1–98–851487–1 (web PDF)

This report was prepared for publication by the Publishing Team; editing and layout by Lynette Clelland. Publication was approved by the
Director, Planning and Support, Department of Conservation, Wellington, New Zealand.

Published by Publishing Team, Department of Conservation, PO Box 10420, The Terrace, Wellington 6143, New Zealand.

In the interest of forest conservation, we support paperless electronic publishing.
CONTENTS

Abstract		                                                                                                    1

1.   Introduction                                                                                             2

     1.1     Purpose of this report                                                                           2
     1.2     Context		                                                                                        2
     1.3     Background on sea-level rise                                                                     4
2.   Data used for this study                                                                                6

     2.1     National potential coastal inundation risk zone                                                 6
     2.2     DOC assets, archaeological sites, recreation functional locations, destinations and EMUs/SMUs    7
3.   Methodology                                                                                              8

4.   Results                                                                                                 10

     4.1     Assessment of DOC assets                                                                        10
             4.1.1  Amenity areas                                                                            10
             4.1.2  Buildings                                                                                12
             4.1.3  Fleet/vehicles                                                                           14
             4.1.4  Infrastructure                                                                           14
             4.1.5  Machinery                                                                                16
             4.1.6  Structures                                                                               18
     4.2     Assessment of archaeological sites                                                              21
     4.3     Assessment of DOC recreation functional locations                                               23
     4.4     Assessment of DOC destinations                                                                  25
     4.5     Assessment of DOC natural heritage management units                                             27
             4.5.1  Ecosystem Management Units (EMUs)                                                        28
             4.5.2  Species Management Units (SMUs)                                                          29
5.   Conclusions                                                                                             30

     5.1     Assets		                                                                                        30
     5.2     Archaeological sites                                                                            30
     5.3     Recreation functional locations                                                                 30
     5.4     Destinations                                                                                    31
     5.5     Ecosystem Management Units (EMUs)                                                               31
     5.6     Species Management Units (SMUs)                                                                 31
6.   Recommendations                                                                                         32

7.   Acknowledgement                                                                                         33

8.   References                                                                                              33

Appendix 1

     DOC recreation functional locations (119) containing one or more assets located in the potential
     coastal inundation zone (discounting archaeological sites, machinery, and sheds)                        34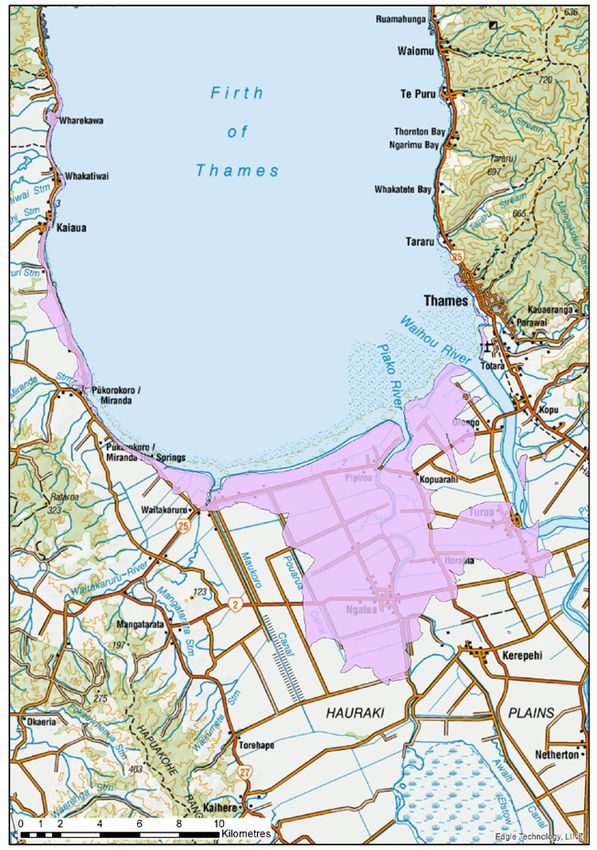
Risk-exposure assessment of Department of
		 Conservation (DOC) coastal locations to
		 flooding from the sea

		    A national assessment of DOC assets, archaeological
		    sites, recreation functional locations, destinations and
		    ecosystem and species management units vulnerable
		    to coastal inundation and sea-level rise

		Andrew Tait
      Department of Conservation, PO Box 10420, Wellington 6143, Wellington, New Zealand
      email: atait@doc.govt.nz

		Abstract
      This report describes a national-level risk-exposure screening assessment that identifies
      Department of Conservation (DOC) assets, archaeological sites, recreation functional locations,
      destinations and ecosystem and species management units located in a potential coastal
      inundation (flooding caused by high seas) risk zone. This zone represents low-lying coastal land
      that is potentially vulnerable to inundation from the sea, now and in the future. As the sea level
      rises over the course of this century and beyond in response to climate change, the inundation
      risk at these locations will be exacerbated (i.e. occur more frequently and with deeper flooding)
      and extend increasingly further inland. Currently intersecting with this potential inundation zone
      are 331 DOC assets and 420 archaeological sites on Public Conservation Land. Furthermore, 119
      recreation functional locations and 62 destinations contain at least one potentially vulnerable
      asset, and 260 Ecosystem Management Units and 99 Species Management Units have some part
      of their delineated polygon located in the potential coastal inundation zone. Identification of these
      potentially at-risk sites is of importance to several units within DOC and will be used to inform
      DOC policy, prioritisation processes and operational management activities.
      Keywords: Coastal inundation risk, hazard screening, Department of Conservation assets,
      archaeological sites, recreation functional locations, destinations, ecosystem and species
      management units

      © Copyright February 2019, Department of Conservation. This paper may be cited as:
      Tait, A. 2019: Risk-exposure assessment of Department of Conservation (DOC) coastal locations to flooding from the
             sea: a national assessment of DOC assets, archaeological sites, recreation functional locations, destinations and
             ecosystem and species management units vulnerable to coastal inundation and sea-level rise.
             Science for Conservation 332 Department of Conservation, Wellington. 36 p.

      Science for Conservation 332                                                                                               1
1. Introduction
    1.1   Purpose of this report
          This report (and the associated GIS datasets) identifies DOC assets, archaeological sites,
          recreation functional locations, destinations and ecosystem and species management units
          located in a potential coastal inundation (flooding caused by high seas) risk zone, based on a
          national enhanced Digital Elevation Model (DEM). This zone presents low-lying coastal land1
          that is potentially vulnerable to present and future (within this century) inundation from the sea
          during high tides and storm events. As the sea rises over the course of this century and beyond2,
          the inundation risk at these locations will be exacerbated as coastal floods become more frequent,
          deeper and extend increasingly further inland.
          The information in this report should be used as a national-scale coastal inundation risk
          screening assessment to guide DOC priorities – noting that land elevation above Mean High
          Water Spring (MHWS) is used as a proxy for the coastal-flooding hazard in this application. More
          detailed risk assessments of specific locations using LiDAR-derived DEM data and appropriate
          flood hazard scenarios should follow this national-level study – particularly areas or assets with
          more imminent flooding risk identified from the risk-screening process. Coastal erosion (present
          or future) may also be an accompanying risk factor for some of the DOC assets (e.g. tracks).

    1.2   Context
          The identification of potential hazards is of vital importance to DOC. The Department’s
          Statement of Intent 2016–20203 says that:
              We (DOC) manage natural and historical resources for their intrinsic values, for the services
              that ecosystems provide us with today, to safeguard options for future generations and for
              recreational use and enjoyment by the public.
          Such management, implemented across all DOC functions, necessarily involves hazard
          identification and the mitigation of risks arising from natural hazards. Safeguarding options for
          future generations also means identifying potential future hazards and/or the exacerbation of
          present-day hazards such as those resulting from climate change and sea-level rise (in addition to
          other social, economic and physical drivers).
          Many assets, archaeological sites and ecosystem or species management units located at the
          coast on Public Conservation Land (PCL) and/or managed by DOC are potentially at risk from
          inundation (or flooding) from the sea during extreme high tides and storm events. Flooding can
          result from semi-permanent inundation at high tide as the upper tidal zone extends inland as
          the sea level rises, and/or coastal flooding beyond the inter-tidal zone from elevated storm-tides
          and wave processes during adverse weather events. This inundation risk will only increase over
          the coming decades due to sea-level rise. The New Zealand Coastal Policy Statement (NZCPS)
          20104 says that the coastal environment is subject to a continuing decline in species, habitats
          and ecosystems and faces continuing coastal erosion and other natural hazards that will be
          exacerbated by climate change.

          1   Coastal land is based on the delineation of the New Zealand coastline, including offshore islands, derived from Topo50 products
              and represented in the GIS shape file: NATIS2.NATISADM.TOPOGRAPHIC_TOPO50_CoastlinePolyNational.
          2   See the Background on Sea-level Rise section below for more information on sea-level rise projections for the globe and around
              New Zealand.
          3   See http://www.doc.govt.nz/Documents/about-doc/annual-report-2016/annual-report-2016.pdf
          4   See http://www.doc.govt.nz/about-us/science-publications/conservation-publications/marine-and-coastal/new-zealand-coastal-
              policy-statement/new-zealand-coastal-policy-statement-2010/

2         Tait – Risk-exposure assessment of DOC coastal locations to flooding from the sea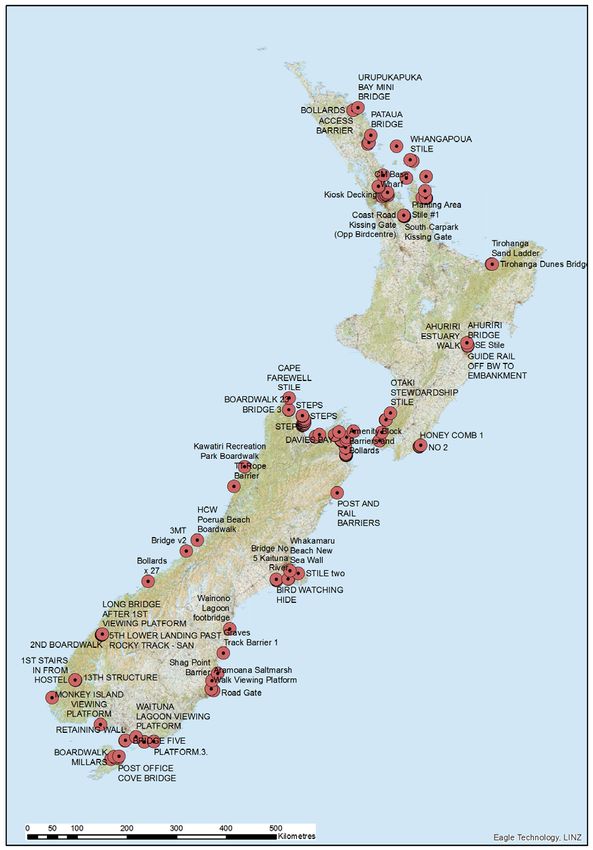
As an example, coastal flooding caused by the passage of a deep low-pressure system combined
with the highest king (perigean-spring) tide for 2018 was experienced in many parts of New Zealand
on 4–5 January 2018. Small communities on the western coast of the Firth of Thames (Fig. 1) were
among the hardest hit. A similar situation occurred on 1 February 2018 in Tasman/Nelson and the
West Coast during ex-tropical cyclone Fehi.
Flooding of this nature can significantly impact buildings, walking tracks, infrastructure, historic
sites, farmland, and natural ecosystems due to the high energy of waves eroding and overtopping
coastal sand dunes and other defences in addition to the impact of land and waterways being
inundated for extended periods with saline water and the deposition of silt.
DOC’s work in this area is guided by Government guidance on coastal hazard management,
in particular the ‘Coastal hazards and climate change guidance’5 issued by the Ministry for
Environment and the NZCPS 2010 guidance note: coastal hazards6 from DOC. Both documents
have ‘managed retreat’ as one of the core principles as opposed to simply reinstating or
implementing hard-protection measures for eroded or inundated assets within hazard-prone
areas. The NZCPS is implemented through the Resource Management Act 1991 (RMA). It
directs councils to proactively identify coastal hazard risk and to adopt long-term risk reduction
approaches. Available risk-reduction measures include, but are not limited to, managed retreat.
Other options include redesign of existing developments (e.g. designing for relocatability),
changes in land use and, in limited circumstances, hard or soft engineered protection.
RMA consents/permits may be required for some hazard management responses by DOC.
Other statutory considerations include the relevant PCL legislation, conservation management
strategy, and management plans7.

Figure 1. Coastal flooding in Kaiaua, Firth of Thames, Friday 5 January 2018. Photo: TVNZ One News.

5   http://www.mfe.govt.nz/publications/climate-change/coastal-hazards-and-climate-change-guidance-local-government
6   http://www.doc.govt.nz/about-us/science-publications/conservation-publications/marine-and-coastal/new-zealand-coastal-
    policy-statement/policy-statement-and-guidance/
7   http://www.doc.govt.nz/about-us/our-policies-and-plans/

Science for Conservation 332                                                                                                 3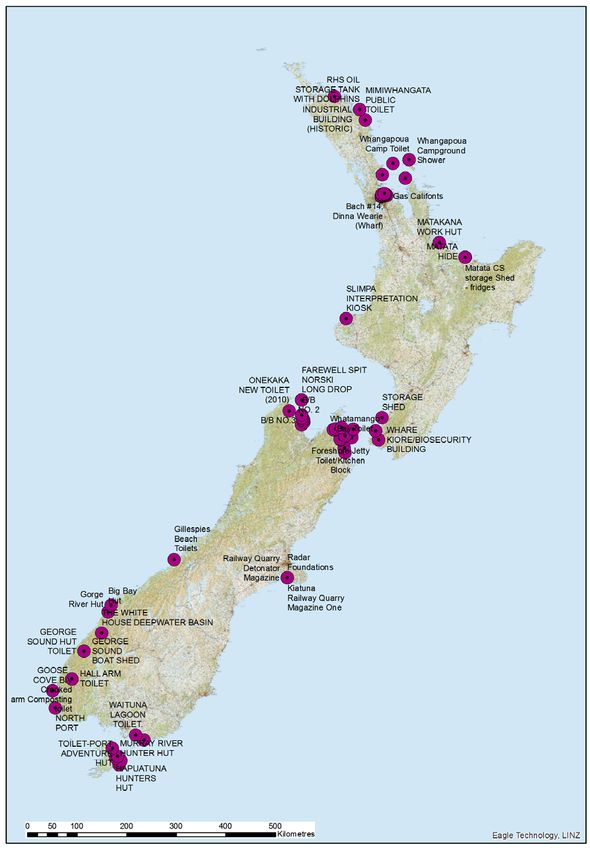
Relevant NZCPS content includes Objectives 1, 2 and 5 and the coastal hazard policies 24–27.
          Objectives 1 and 2 direct decision makers to protect, maintain and, potentially, enhance the
          natural environment of coastal areas.
          Objective 1: To safeguard the integrity, form, functioning and resilience of the coastal environment
          and sustain its ecosystems, including marine and intertidal areas, estuaries, dunes and land, by:
                •• maintaining or enhancing natural biological and physical processes in the coastal
                   environment and recognising their dynamic, complex and interdependent nature;
                •• protecting representative or significant natural ecosystems and sites of biological
                   importance and maintaining the diversity of New Zealand’s indigenous coastal flora and
                   fauna; and
                •• maintaining coastal water quality and enhancing it where it has deteriorated from what
                   would otherwise be its natural condition, with significant adverse effects on ecology and
                   habitat, because of discharges associated with human activity.
          Objective 2: To preserve the natural character of the coastal environment and protect natural
          features and landscape values through:
                •• recognising the characteristics and qualities that contribute to natural character, natural
                   features and landscape values and their location and distribution;
                •• identifying those areas where various forms of subdivision, use, and development would be
                   inappropriate and protecting them from such activities; and
                •• encouraging restoration of the coastal environment.
          Objective 5 directs the management of coastal hazard risks through appropriate measures:
          Objective 5: To ensure that coastal hazard risks taking account of climate change, are managed by:
                •• locating new development away from areas prone to such risks;
                •• considering responses, including managed retreat, for existing development in this situation;
                   and
                •• protecting or restoring natural defences to coastal hazards.
          For DOC, such management is taken to include coastal hazard risk identification (NZCPS Policy 24)
          and careful evaluation of risk management options (Policies 25–27) for PCL assets and sites at risk
          from present-day and future coastal hazards.

    1.3   Background on sea-level rise
          The Intergovernmental Panel on Climate Change Fifth Assessment Report Working Group 1
          Summary for Policymakers (IPCC 2013) includes the following headline statements on sea-level
          rise (bold text has been added by the author of this report):
                •• Warming of the climate system is unequivocal, and since the 1950s, many of the observed
                   changes are unprecedented over decades to millennia. The atmosphere and ocean have
                   warmed, the amounts of snow and ice have diminished, sea level has risen, and the
                   concentrations of greenhouse gases have increased.
                •• The rate of sea-level rise since the mid-19th century has been larger than the mean rate
                   during the previous two millennia (high confidence8). Over the period 1901 to 2010, global
                   mean sea level rose by 0.19 [0.17 to 0.21] m.

          8   IPCC statements with a confidence rating are based on the author teams’ judgments about the validity of findings as
              determined through evaluation of evidence and agreement. Confidence ranges from ‘very low’ (depicting low agreement and
              limited evidence) to ‘very high’ (depicting high agreement and robust evidence).

4         Tait – Risk-exposure assessment of DOC coastal locations to flooding from the sea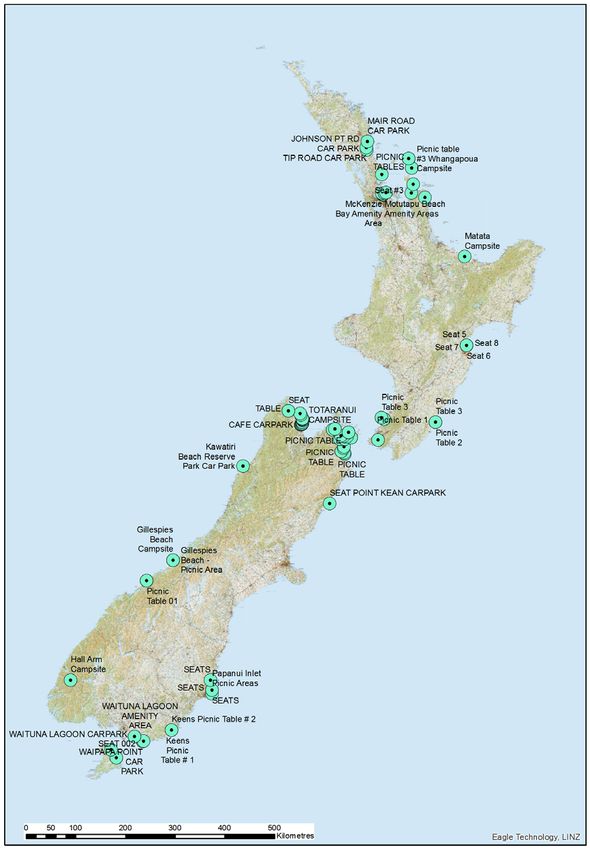
•• Global mean sea level will continue to rise during the 21st century. Under all RCP9
          scenarios, the rate of sea-level rise will very likely exceed that observed during 1971 to 2010
          due to increased ocean warming and increased loss of mass from glaciers and ice sheets.
Furthermore, Bell et al. (2015), in a report to the New Zealand Parliamentary Commissioner for
the Environment titled ‘National and regional risk exposure in low-lying coastal areas’ concluded
that:
       •• Over the past century up to present, New Zealand’s average rise in mean sea level has been
          similar to the global-average rate – therefore future projections of global-average sea-level
          rise are generally applicable to Aotearoa–New Zealand (Fig. 2).
       •• In tandem with this rise in sea level, the frequency of coastal storm inundation has
          increased (Stephens 2015), as evident in Auckland such as Tamaki Drive, with the occurrence
          of these events set to escalate as sea-level rise accelerates.
       •• Credible projections of sea-level rise by 2100 range from 0.5 to 1 m (Church et al. 2013).
          However, rises above 1 m by 2100 are still possible.
       •• Next century and beyond, sea level will continue rising, possibly for several centuries or
          more, with the rate of increase and the ultimate SLR determined by the time-trajectory of
          mitigation of greenhouse gas emissions (Church et al. 2013).

Figure 2. Projections of global mean sea-level rise from 2006 to 2100,
relative to the 1986–2005 global mean sea level, for a low and high
Representative Concentration Pathway (RCP). IPCC 2013.

The recently-published Coastal Hazards and Climate Change: Guidance for Local Government
(MfE 2017)10 recommends the use of four New Zealand-specific sea-level rise scenarios out to
2120 (for planning timeframes of at least 100 years as required by the NZCPS) and extended out
to 2150. For example, by 2120, the four scenarios cover a sea-level rise between 0.55 m (RCP2.6)
and 1.36 m (RCP8.5 H+), with local vertical land movement to be included where it is significant.
The scenarios are intended for use with an adaptive pathways planning approach, building in
adaptation thresholds and triggers when a switch to an alternative pathway or response option is
required before the risk becomes intolerable (e.g. NZCPS Policy 27).

9    RCPs are Representative (atmospheric greenhouse gas) Concentration Pathways to the end of the century and beyond. The
     four RCPs range from RCP2.6 (a strong greenhouse gas emissions mitigation pathway) to RCP8.5 (growth in emissions and
     rapid rise in concentrations).
10   See http://www.mfe.govt.nz/publications/climate-change/coastal-hazards-and-climate-change-guidance-local-government

Science for Conservation 332                                                                                                 5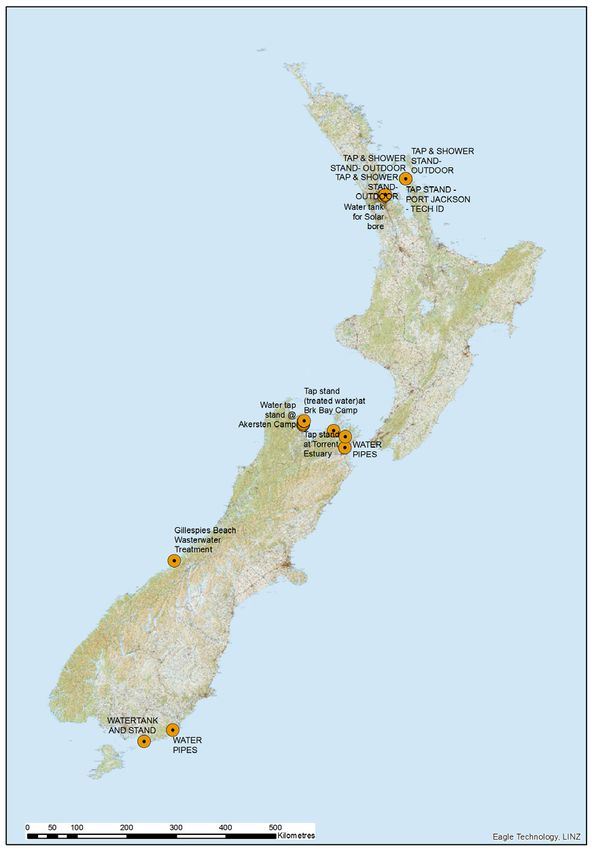
It is therefore prudent and timely to investigate the potential risk of current and future coastal
          inundation on DOC assets, archaeological sites and Ecosystem and Species Management
          Units. The MfE coastal Guidance specifies this type of assessment as a hazard or risk screening
          (see Section 6.5.3 and 8.2.1 of the MfE Guidance) – in this case it can be described as a risk-
          exposure screening, as assets and natural habitats are enumerated (i.e. potentially exposed),
          but no detailed direct and indirect impacts are assessed. Detailed hazard, vulnerability and risk
          assessment should be undertaken as a next step for locations of historical, ecological and/or
          economic importance (Section 8 of the MfE Guidance).

    2. Data used for this study
    2.1   National potential coastal inundation risk zone
          A national enhanced DEM has been derived from the Landcare Research enhanced DEM
          generated from the LINZ topographic contour data and blended with a NASA Shuttle Radar
          Topography Mission (SRTM) DEM. Under LINZ licensing arrangements, the DEM data were
          available for use by DOC as a government department and as a partner in the KiwImage
          Quickbird imagery project, for which the national DEM was modified (SKM 2008). The
          geographic projection of the DEM data is NZGD2000 New Zealand Transverse Mercator
          (NZTM).
          NIWA produced an elevation contour GIS shapefile derived from the national enhanced DEM
          with three elevation bands: 0–3 m, 3–5 m, and 5–10 m, as part of the Bell et al. (2015) assessment
          for the Parliamentary Commissioner for the Environment (PCE). The 0–3 m elevation contours
          were compared with the same contours derived from more accurate11 LiDAR DEM data, where
          these data are available. The authors concluded:
                 •• While there is not full LiDAR coverage available for Aotearoa–New Zealand coastal areas,
                    (where there is coverage) the total land-cover area and population within the cumulative
                    0–3 m coastal zone derived from LiDAR DEMs is nearly double those enumerated from the
                    national modified DEM for the same elevation range.
          Because of this sizeable underestimation of low-lying coastal land area, the PCE report authors
          have suggested that the 0–3 m elevation contours derived from the national enhanced DEM
          are more likely to better represent 0–1.5 m, but because of the poor accuracy the data should be
          used with caution (Rob Bell, NIWA, pers. comm., October 2017). Note: elevation inaccuracy of
          the enhanced DEM is likely to be higher in coastal areas where the adjacent land elevation rises
          quickly from the water’s edge and higher again for cliffs or bluffs.
          Taking on this advice, the national elevation contour data have been used in this study to
          identify coastal locations that are potentially vulnerable to inundation from the sea, now and in
          the future within this century. More detailed risk assessment of specific at-risk locations using
          a two-stage approach involving analysis of historical records, local knowledge and site visits
          followed by detailed mapping using LiDAR-derived DEM data should follow this national-level
          risk-exposure screening study.

          11   LiDAR-derived elevation data accuracy is typically around 0.15 m.

6         Tait – Risk-exposure assessment of DOC coastal locations to flooding from the sea
2.2 DOC assets, archaeological sites, recreation functional
locations, destinations and EMUs/SMUs
The following DOC GIS datasets were utilised in this study:
•• NATIS1.NATISADM.INFRASTRUCTURE_AMIS_Equipment
This is a spatial representation of DOC-managed equipment represented as points and includes
a range of assets (e.g. huts, campsites and boardwalks). Each asset in the dataset, if appropriate, is
also linked to a recreation functional location.
•• NATIS1.NATISADM.INFRASTRUCTURE_AMIS_Tracks
This is a spatial representation of DOC-managed track centrelines categorised into nine different
types reflecting a range of experiences (i.e. short walks, tramping tracks or mountain biking
trails).
•• NATIS1.NATISADM.INFRASTRUCTURE_DOC_DestinationPly
This is a polygon feature class representing Icon and Gateway Destinations generated from
NATIS AMIS feature classes (Tracks, Roads and Equipment). DOC is using the term ‘destination’
to mean a geographic area that is the focus of a single trip by a visitor.
•• NATIS1.NATISADM.OPERATIONAL_DOC_PrescriptionManagementUnits
This dataset comprises Management Units that fall under the Natural Heritage Intermediate
Outcome Objectives (IOO) framework. This data is used within DOC for systematic conservation
prioritisation to support the cost-effective management of a full range of New Zealand’s
ecosystems and species.
The analysis carried out for this report used the subset of this dataset which comprised:
•• Ecosystem management units (EMUs) created to support IOO 1.1: A full range of
New Zealand’s ecosystems is conserved to a healthy functioning state; and
•• Species management units (SMUs) created to support IOO 1.2: Nationally threatened
species are conserved to ensure persistence.
EMUs are based around sites identified for DOC by panels of experts as being best examples of
each ecosystem type. They were designed to be large enough to provide a functioning example
of one or more ecosystems and of an appropriate size for management. Many EMUs also support
potentially viable populations of threatened species.
SMUs are sites identified for DOC by panels of experts as being critical for the long-term security
of each species. They were designed to be large enough to provide for a viable population of one
or more species.
•• NATIS2.NATISADM.ADMINISTRATIVE_NZAA_ArchSiteSites
This dataset is part of a set of information that comprises Site, Accuracy and Area information
for over 60,000 Archaeological Sites in New Zealand. This data is sourced from the New Zealand
Archaeological Association’s ArchSite database.
Science for Conservation 332 73. Methodology
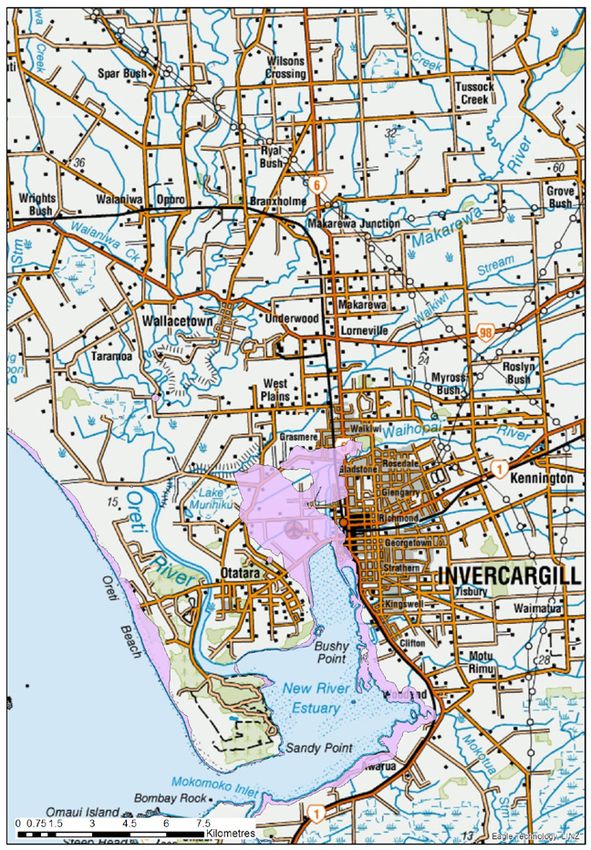
The national elevation contour shapefile was made available by NIWA to DOC for use in this
study12. This layer was clipped to the coastline13 and overlaid on LINZ Topo50 map GeoTIFF14
data, using the GIS package ArcMap 10.3.1, and the lowest-elevation band was filled with a solid
colour (see Figs 3 and 4 for example maps). It should be noted that the limited accuracy of both
the national enhanced DEM and the Topo50 coastline shape file limit the extent to which this
information can be utilised to examine the inundation risk of specific localities in detail, such as
the intertidal zone around the New River Estuary shown in Fig. 3. For such site-specific studies,
high-resolution LiDAR data and detailed site and hazard assessments are required.
Figure 3. Example map of the extent of the potential coastal inundation risk zone
encompassing the environs of the New River Estuary (including Invercargill airport).
12 A data use agreement associated with this shapefile was signed by both NIWA and DOC (see: https://doccm.doc.govt.nz/wcc/
faces/wccdoc?dID=4352533&dDocName=DOC-3224301)
13 The delineation of the New Zealand coastline is derived from Topo50 products and represented in the GIS shape file: NATIS2.
NATISADM.TOPOGRAPHIC_TOPO50_CoastlinePolyNational.
14 GeoTIFF is a public domain metadata standard which allows geo-referencing information to be embedded within an image file.
8 Tait – Risk-exposure assessment of DOC coastal locations to flooding from the seaFigure 4. Example map of the extent of the potential coastal inundation risk zone which extends 10 km inland on the Hauraki Plains. Note: The plains are currently protected by a stopbank along the southern shoreline of the Firth of Thames – but there remains a residual risk of flooding including increased impacts from elevated groundwater levels. The low-lying elevation band (nominally 0–3 m above mean sea level, but likely to be closer to 0–1.5 m) has been termed the ‘potential coastal inundation risk zone’ and represents low-lying coastal land that is ‘potentially vulnerable’ to inundation from the sea during high tides and storm events, now and in the future within this century. This zone, plus more landward areas, will be steadily more exposed to inundation over the course of the century and beyond, as the sea level rises. GIS layers of DOC assets, archaeological sites, EMUs and SMUs were added to the GIS assessment, and the ArcGIS ‘intersect’ tool was used to identify the DOC features located within the potential coastal inundation risk zone. These features were identified as ‘potentially vulnerable’ to sea water flooding now. The same features are also ‘potentially highly vulnerable’ in the future, as the sea level rises. The DOC features were also qualitatively ranked to identify priority features which are highlighted for more detailed analysis and risk assessment. Science for Conservation 332 9
4. Results
4.1 Assessment of DOC assets
The GIS layer ‘NATIS1.NATISADM.INFRASTRUCTURE_AMIS_Equipment’ includes the
location and attribute information of DOC assets, including the following categories:
•• Amenity areas
•• Archaeological/artefact
•• Boats and vessels
•• Buildings
•• Counters
•• Earthworks
•• Fleet/vehicles
•• Infrastructure
•• Machinery
•• Signs
•• Structures
For the purposes of identifying ‘priority’ assets that are potentially vulnerable to coastal
inundation and sea-level rise, only the ‘amenity areas’, ‘buildings’, ‘fleet/vehicles’, ‘infrastructure’,
‘machinery’ and ‘structures’ categories were analysed. All other assets can either be easily moved
or are relatively low value. Note that the ‘archaeological/artefact’ category was not analysed in
this section.
4.1.1 Amenity areas
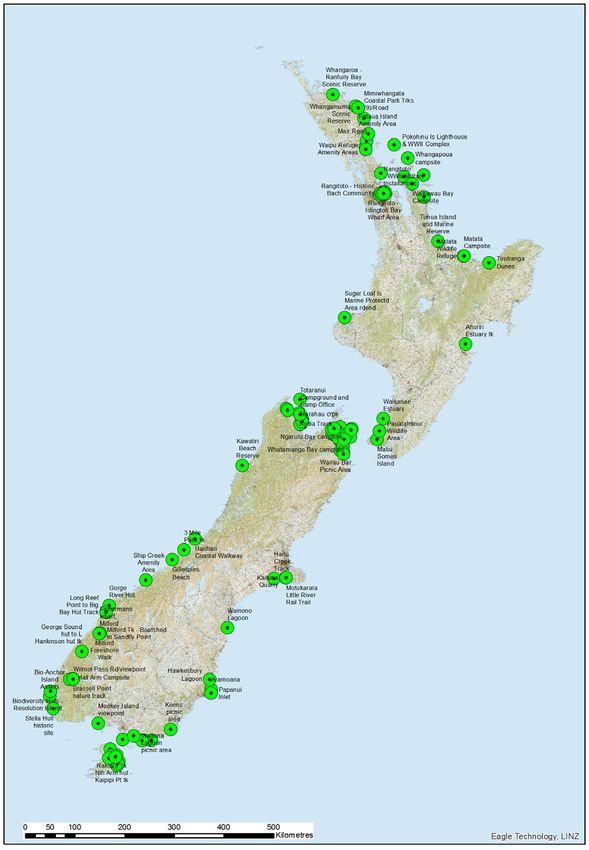
A total of 50 amenity areas are located in the potential coastal inundation risk zone, representing
3% of all DOC amenity areas in the country (see Table 1 and Fig. 5).
Ta b l e 1 . S u m m a r y o f t h e 5 0 D e p a r t m e n t o f C o n s e r v a t i o n ( D O C ) a m e n i t y a re a s l o c a t e d i n t h e
p o t e n t i a l c o a s t a l i n u n d a t i o n z o n e . T h e p e rc e n t a g e i s ro u n d e d t o t h e n e a re s t w h o l e n u m b e r. T h e
n u m b e r s i n b r a c k e t s a re t h e t o t a l n u m b e r o f a m e n i t y a re a s .
AMENITY AREA CLASS NUMBER OF AMENITY AREAS IN PROPORTION OF TOTAL
COASTAL RISK ZONE NUMBER OF DOC AMENITY
(TOTAL NUMBER MANAGED BY DOC) AREAS (%)
Campgrounds 20 (329) 6
Maintained area 29 (1213) 2
Playground 1 (47) 2
TOTAL 50 (1589) 3
10 Tait – Risk-exposure assessment of DOC coastal locations to flooding from the seaFigure 5. Locations of the 50 Department of Conservation (DOC) amenity areas in the potential coastal inundation zone. Science for Conservation 332 11
4.1.2   Buildings
             A total of 127 buildings are located in the potential coastal inundation risk zone, representing
             2% of all DOC buildings in the country (see Table 2 and Fig. 6).

             Ta b l e 2 . S u m m a r y o f t h e 1 2 7 D e p a r t m e n t o f C o n s e r v a t i o n ( D O C ) b u i l d i n g s l o c a t e d i n t h e
             p o t e n t i a l c o a s t a l i n u n d a t i o n z o n e . T h e p e rc e n t a g e i s ro u n d e d t o t h e n e a re s t w h o l e n u m b e r. T h e
             n u m b e r s i n b r a c k e t s a re t h e t o t a l n u m b e r o f b u i l d i n g s .

              BUILDING CLASS                                     NUMBER OF DOC BUILDINGS IN                                  PROPORTION OF TOTAL
                                                                      COASTAL RISK ZONE                                    NUMBER OF DOC BUILDINGS
                                                               (TOTAL NUMBER OF DOC BUILDINGS)                                       (%)
              Accommodation staff                                                      7 (418)                                                   2
              Accommodation visitor                                                    1 (78)                                                    1
              Amenity unit/block                                                       4 (105)                                                   4
              Building government                                                      2 (81)                                                    3
              Building industrial                                                      3 (69)
              Building military                                                      10 (256)                                                    4
              Building residential                                                   33 (137)                                                  24
              Building visitor centre                                                  1 (13)                                                    8
              Hut                                                                      5 (989)                                                   1
              Shed                                                                   16 (727)                                                    2
              Shelter                                                                11 (573)                                                    2
              Toilet                                                                 34 (1998)                                                   2
              TOTAL                                                                 127 (5444)                                                   2

12           Tait – Risk-exposure assessment of DOC coastal locations to flooding from the sea
Figure 6. Locations of the 127 Department of Conservation (DOC) buildings in the potential coastal inundation zone. Science for Conservation 332 13
4.1.3   Fleet/vehicles
             No DOC fleet/vehicle assets are located in the potential coastal inundation risk zone.

     4.1.4   Infrastructure
             A total of 26 DOC infrastructure assets are located in the potential coastal inundation risk zone,
             representing 4% of all DOC infrastructure assets in the country (see Table 3 and Fig. 7).

             Ta b l e 3 . S u m m a r y o f t h e 2 6 D e p a r t m e n t o f C o n s e r v a t i o n ( D O C ) i n f r a s t r u c t u re a s s e t s l o c a t e d i n
             t h e p o t e n t i a l c o a s t a l i n u n d a t i o n z o n e . T h e p e rc e n t a g e i s ro u n d e d t o t h e n e a re s t w h o l e n u m b e r.
             T h e n u m b e r s i n b r a c k e t s a re t h e t o t a l n u m b e r o f i n f r a s t r u c t u re a s s e t s .

              INFRASTRUCTURE CLASS                             NUMBER OF DOC INFRASTRUCTURE                                PROPORTION OF TOTAL
                                                                ASSETS IN COASTAL RISK ZONE                                     NUMBER OF
                                                                   (TOTAL NUMBER OF DOC)                                DOC INFRASTRUCTURE ASSETS
                                                                  INFRASTRUCTURE ASSETS)                                           (%)
              Sewerage                                                                2 (186)                                                  1
              Water catchment                                                         1 (33)                                                   3
              Water systems                                                          23 (431)                                                  5
              TOTAL                                                                  26 (650)                                                  4

14           Tait – Risk-exposure assessment of DOC coastal locations to flooding from the sea
Figure 7. Locations of the 26 Department of Conservation (DOC) infrastructure assets in the potential coastal inundation zone. Science for Conservation 332 15
4.1.5   Machinery
             A total of two machinery assets are in the potential coastal inundation risk zone, representing 1%
             of all DOC machinery assets in the country (see Table 4 and Fig. 8).

             Ta b l e 4 . S u m m a r y o f t h e t w o D e p a r t m e n t o f C o n s e r v a t i o n ( D O C ) m a c h i n e r y a s s e t s l o c a t e d i n
             t h e p o t e n t i a l c o a s t a l i n u n d a t i o n z o n e . T h e p e rc e n t a g e i s ro u n d e d t o t h e n e a re s t w h o l e n u m b e r.
             T h e n u m b e r s i n b r a c k e t s a re t h e t o t a l n u m b e r o f m a c h i n e r y a s s e t s .

              MACHINERY CLASS                                       NUMBER OF DOC MACHINERY                                  PROPORTION OF TOTAL
                                                                   ASSETS IN COASTAL RISK ZONE                             NUMBER OF DOC MACHINERY
                                                                      (TOTAL NUMBER OF DOC                                         ASSETS
                                                                        MACHINERY ASSETS)                                            (%)
              Machinery                                                               2 (169)                                                    1
              TOTAL                                                                   2 (169)                                                    1

16           Tait – Risk-exposure assessment of DOC coastal locations to flooding from the sea
Figure 8. Location of the two Department of Conservation (DOC) machinery assets located in the potential coastal inundation zone. Science for Conservation 332 17
4.1.6   Structures
             A total of 126 structures assets (excluding ‘barrier’, ‘ladder/stair/stile’ and ‘retaining wall’) are
             in the potential coastal inundation risk zone, representing 1% of all DOC structure assets in the
             country (see Table 5 and Fig. 9).

             Ta b l e 5 . S u m m a r y o f t h e 1 2 6 D e p a r t m e n t o f C o n s e r v a t i o n ( D O C ) s t r u c t u re s a s s e t s l o c a t e d i n
             t h e p o t e n t i a l c o a s t a l i n u n d a t i o n z o n e . T h e p e rc e n t a g e i s ro u n d e d t o t h e n e a re s t w h o l e n u m b e r.
             T h e n u m b e r s i n b r a c k e t s a re t h e t o t a l n u m b e r o f s t r u c t u re s .

              STRUCTURES CLASS                                  NUMBER OF DOC STRUCTURES IN                                  PROPORTION OF TOTAL
                                                                      COASTAL RISK ZONE                                   NUMBER OF DOC STRUCTURES
                                                              (TOTAL NUMBER OF DOC STRUCTURES)                                       (%)
              Boardwalk                                                               41 (4474)                                                  1
              Pedestrian bridge – cabled                                               1 (523)
Figure 9. Location of the 126 Department of Conservation (DOC) structures located in the potential coastal inundation zone. Science for Conservation 332 19
The grand total of amenity areas, buildings, fleet/vehicles, infrastructure assets, machinery
     assets, and structures located in the potential coastal inundation risk zone is 331 (see Fig. 10),
     representing 2% of the national DOC asset inventory.

     Figure 10. Location of the 331 Department of Conservation (DOC) assets (as identified above) located in the potential
     coastal inundation zone.

20   Tait – Risk-exposure assessment of DOC coastal locations to flooding from the sea
4.2 Assessment of archaeological sites
As described in the previous section, ‘archaeological/artefact’ is a category in the GIS layer
‘NATIS1.NATISADM.INFRASTRUCTURE_AMIS_Equipment’. There are only two classes for
this category:
•• Archaeological (e.g. pa sites, cemeteries, ruins, historic sites)
•• Artefact (e.g. rock drawings, memorials, historic artefacts)
A total of 30 archaeological sites and no artefact sites are located in the potential coastal
inundation risk zone, representing 5% of all the sites in the country (see Table 6).
Ta b l e 6 . S u m m a r y o f t h e 3 0 D e p a r t m e n t o f C o n s e r v a t i o n ( D O C ) a rc h a e o l o g i c a l / a r t e f a c t s i t e s
l o c a t e d i n t h e p o t e n t i a l c o a s t a l i n u n d a t i o n z o n e . T h e p e rc e n t a g e i s ro u n d e d t o t h e n e a re s t w h o l e
n u m b e r. T h e n u m b e r s i n b r a c k e t s a re t h e t o t a l n u m b e r o f s t r u c t u re s .
SITE CLASS NUMBER OF DOC ARCHAEOLOGICAL/ARTEFACT SITES PROPORTION OF TOTAL
IN COASTAL RISK ZONE NUMBER OF SITES
(TOTAL NUMBER OF DOC ARCHAEOLOGICAL/ (%)
ARTEFACT SITES)
Archaeological 30 (542) 6
Artefacts 0 (39) 0
TOTAL 30 (581) 5
The GIS layer ‘NATIS2.NATISADM.ADMINISTRATIVE_NZAA_ArchSiteSites’ also has
archaeological site data.
This is a much broader dataset with around 69,000 records (c. 13 000 recorded sites on PCL),
and is an external dataset owned by the New Zealand Archaeological Association. DOC protects
these sites from avoidable harm. The majority will also be legally protected under the Heritage
New Zealand Pouhere Taonga Act 2014.
A total of 4149 archaeological sites from this database are located in the potential coastal inundation
risk zone, representing 6% of all the sites in the country (see Table 7 and Fig. 11). Of these, 420 sites
(5%) are located on Public Conservation Land (PCL) (out of a total of 8026 PCL sites).
Ta b l e 7 . S u m m a r y o f t h e 4 1 4 9 N e w Z e a l a n d A rc h a e o l o g i c a l A s s o c i a t i o n ( N Z A A ) a rc h a e o l o g i c a l
s i t e s l o c a t e d i n t h e p o t e n t i a l c o a s t a l i n u n d a t i o n z o n e . T h e p e rc e n t a g e i s ro u n d e d t o t h e n e a re s t
w h o l e n u m b e r. T h e n u m b e r s i n b r a c k e t s a re t h e t o t a l n u m b e r o f s t r u c t u re s .
ARCHAEOLOGICAL SITE NUMBER OF NZAA ARCHAEOLOGICAL SITES IN PROPORTION OF TOTAL
CLASS COASTAL RISK ZONE NUMBER OF SITES
(TOTAL NUMBER OF NZAA ARCHAEOLOGICAL (%)
SITES)
Artefact find 134 (1720) 8
Burial/cemetery 84 (1024) 8
Historic – domestic 142 (3197) 4
Maori horticulture 66 (1758) 4
Midden/oven 2764 (19460) 14
Pa 192 (7342) 3
Pit/terrace 260 (19077) 1
Transport/communication 106 (1459) 7
Other 401 (14011) 3
TOTAL 4149 (69,048) 6
Science for Conservation 332 21Figure 11. Location of 4129 New Zealand Archaeological Association (NZAA) archaeological sites located in the potential
coastal inundation zone.
22 Tait – Risk-exposure assessment of DOC coastal locations to flooding from the sea4.3 Assessment of DOC recreation functional locations
A recreation functional location (or ‘visitor site’, as it used to be known) is currently defined
around existing facilities and services owned or managed by DOC. A recreation functional
location is not generally created where there are no facilities or services. A recreation functional
location has, within its boundaries, the same number of visitors and same main visitor group
across all its length or area. It has one predominant visitor group (although it may have several
other visitor groups using it). That visitor group is the predominant group across the whole
length or area of the site. A recreation functional location can consist of more than one major site
type (e.g. a track, plus a road, plus a car park).
Each asset in the ‘NATIS1.NATISADM.INFRASTRUCTURE_AMIS_Equipment’ dataset is
linked to a recreation functional location. A total of 361 assets are located in potential coastal
inundation zone, and these are linked to 145 unique recreation functional locations. This number
is reduced to 119 recreation functional locations if ‘archaeological sites’, ‘machinery’ and ‘sheds’
are not considered (see Fig. 12 and Table A1 in Appendix 1).
The number of potentially vulnerable assets corresponding to each recreation functional location
is included in Table A1. These numbers can be used to rank the recreation functional locations
in terms of their potential vulnerability to coastal inundation (though total asset value and/or
maintenance cost would likely be a better metric to use, if the data were available for all assets).
The following 18 recreation functional locations have five or more potentially vulnerable assets,
ranked from greatest to fewest assets (number of assets shown in brackets), and hence may be
considered to have moderate to high potential vulnerability to coastal inundation16:
1st: Rangitoto – Historic Bach Community (36)
2nd equal: Fishermans wharf, Milford (17) and Wairau Lagoons Walkway (17)
4th: Rangitoto – Wharf Area (16)
5th: ATC Tk – Bark Bay Hut and campsite (14)
6th: ATC Tk – Marahau to Onetahuti (11)
7th: Port Jackson Campsite / Muriwai Walk (9)
8th equal: Rangitoto – WWII Military Installations (8) and Milford Foreshore Walk (8)
10th: Farewell Spit houses (6)
11th equal: Gillespies Beach (5), Kaituna Quarry (5), Marahau crpk (5), Motutapu – Island Roads
(5), Queen Charlotte Tk – Anakiwa to Te Mahia (5), Waipapa Point picnic area (5),
Wairau Bar picnic area (5) and Waituna Lagoon picnic area (5)
16 The five or more assets threshold is an arbitrary level for determining ‘moderate to high’ potential vulnerability and can easily
be altered or removed all together (i.e. all recreation function locations with any land in the potential coastal inundation zone
could be considered potentially vulnerable).
Science for Conservation 332 23Figure 12. Location of 119 Department of Conservation (DOC) recreation functional locations containing one or more assets
located in the potential coastal inundation zone (discounting archaeological sites, machinery, and sheds).
24 Tait – Risk-exposure assessment of DOC coastal locations to flooding from the sea4.4 Assessment of DOC destinations
All visitor sites are categorised into one of four destination categories17. Each category was
developed to meet the needs of a different user group. No category is more or less important than
another. They help DOC to manage a destination to meet the primary user needs and determine
where to focus to gain the best return for our efforts. The destination categories are:
•• Icon sites are the places that support the growth of domestic and international tourism.
•• Gateway destinations introduce new participants to outdoor recreation and are the best
places to grow recreation in the outdoors
•• Local treasure destinations are managed to grow community connection with, and use of,
their locally important places.
•• The backcountry network attracts a wide range of visitors to the more remote parts of the
country.
The GIS layer ‘NATIS1.NATISADM.INFRASTRUCTURE_DOC_DestinationPly’ includes
the location and attribute information of 169 DOC Icon and Gateway destinations18. Of these
destinations 62 (37%) have some portion located in the potential coastal inundation zone (Table 8).
Ta b l e 8 . S u m m a r y o f t h e 6 2 D e p a r t m e n t o f C o n s e r v a t i o n ( D O C ) I c o n a n d G a t e w a y d e s t i n a t i o n s
(as at 2012) with some part located in the potential coastal inundation zone. The number of
p o t e n t i a l l y v u l n e r a b l e a s s e t s 19 i s b a s e d o n t h e i n t e r s e c t o f ‘ d e s t i n a t i o n ’ , ‘ a s s e t s ’ a n d ‘ c o a s t a l
i n u n d a t i o n r i s k z o n e ’ . T h e l e n g t h o f p o t e n t i a l l y v u l n e r a b l e t r a c k ( i n m e t re s ) i s b a s e d o n t h e
intersect of ‘destination’, ‘tracks’ and ‘coastal inundation risk zone’. The numbers in brackets
a re t h e p e rc e n t a g e o f t h e ‘ d e s t i n a t i o n ’ t o t a l t r a c k l e n g t h t h a t i s l o c a t e d i n t h e c o a s t a l i n u n d a t i o n
z o n e . D e s t i n a t i o n s w i t h 1 0 o r m o re p o t e n t i a l l y v u l n e r a b l e a s s e t s a n d / o r m o re t h a n 5 % o f
p o t e n t i a l l y v u l n e r a b l e t r a c k a re h i g h l i g h t e d .
DESTINATION DESTINATION NUMBER OF METRES OF POTENTIALLY
TYPE POTENTIALLY VULNERABLE TRACK
VULNERABLE (PERCENTAGE OF OVERALL
ASSETS TRACK LENGTH)
Abel Tasman Coast Track Icon 62 4286 (5.9)
Cape Brett lighthouse/hut Icon 0 0 (0)
Cape Foulwind Icon 0 0 (0)
Cape Kidnappers Gannet Reserve Icon 0 66 (2.8)
Cape Reinga (Te Rerenga Wairua) Icon 0 0 (0)
Cape Reinga Coastal Track Icon 0 2932 (6.4)
Cathedral Cove Icon 1 51 (1.3)
Dolomite Point Icon 0 0 (0)
Godley Head Icon 0 0 (0)
Government Buildings Icon 0 0 (0)
Kaikoura Peninsula Walkway Icon 1 16 (0.3)
Kāpiti Island Nature Reserve Icon 3 1872 (14.6)
Kerikeri Basin Icon 0 62 (1.8)
Leigh Marine Reserve Icon 0 333 (30.5)
Milford Sound/Piopiotahi Icon 8 599 (53.7)
Milford Track Icon 3 0 (0)
Moeraki Boulders Icon 0 30 (7.8)
North Head Icon 2 174 (6.6)
Continued on next page
17 Destinations are defined here: http://intranet/recreation/managing-destinations/The-4-destination-categories/
18 This GIS data layer was created in 2012 and is being updated. Currently, the layer does not include local treasure or backcountry
destinations.
19 Assets include: amenity areas, buildings, fleet/vehicles, infrastructure, machinery and structures.
Science for Conservation 332 25Table 8 continued
DESTINATION DESTINATION NUMBER OF METRES OF POTENTIALLY
TYPE POTENTIALLY VULNERABLE TRACK
VULNERABLE (PERCENTAGE OF OVERALL
ASSETS TRACK LENGTH)
Nugget Point Icon 0 0 (0)
Poor Knights Marine Reserve Icon 0 0 (0)
Rangitoto Summit and short walks Icon 57 3099 (29.6)
Ship Cove Icon 2 252 (18.4)
Ship Creek Icon 4 0 (0)
Taiaroa Head Icon 0 0 (0)
Tiritiri Matangi Island Icon 0 53 (0.5)
Ulva Island Icon 5 3 (0.1)
Ahuriri Estuary Gateway 9 2431 (80.2)
Aotea Track Gateway 0 70 (0.1)
Bluff Hill/Motupohue Gateway 1 22 (0.4)
Bream Head tracks Gateway 0 0 (0)
Castlepoint Scenic Reserve Gateway 3 31 (1.3)
Fletcher Bay Campsite Gateway 0 0 (0)
Heaphy Track Gateway 0 194 (0.3)
Hollyford Track Gateway 0 0 (0)
Home Bay/Motutapu Gateway 12 575 (2.4)
Kawau Island Historic Reserve Gateway 3 9 (0.2)
Kohaihai Campsite Gateway 0 0 (0)
Little River Rail Trail Gateway 2 2933 (12.9)
Maitai Bay Gateway 0 307 (30.0)
Matata Gateway 3 1075 (100)
Matiu (Somes) Island Gateway 4 161 (5.1)
Mimiwhangata Gateway 1 533 (3.3)
Momorangi Bay Gateway 1 0 (0)
Okarito walks Gateway 1 55 (1.0)
Oparara Basin Gateway 0 0 (0)
Otamure Gateway 0 5 (0.3)
Papatowai Gateway 0 20 (0.3)
Puponga Farm Park Gateway 6 8293 (38.5)
Putangirua Pinnacles Gateway 0 0 (0)
Quail Island Gateway 0 179 (3.1)
Queen Charlotte Track Gateway 12 855 (1.2)
Rakiura Track Gateway 1 798 (2.6)
Rangitoto tracks Gateway 50 4964 (34.1)
Sandymount tracks Gateway 0 6 (0.1)
Stony Bay Campsite Gateway 0 0 (0)
Tapuae Marine Reserve and SLIMPA Gateway 1 0 (0)
Te Tapuwae o Rongokako Marine Reserve Gateway 0 0 (0)
Totaranui Campground Gateway 2 102 (2.0)
Urupukapuka Island Gateway 1 342 (3.1)
Waikawau Bay Gateway 1 189 (18.2)
Whangaruru Gateway 0 3 (0.1)
Whites Bay Gateway 3 69 (0.9)
26 Tait – Risk-exposure assessment of DOC coastal locations to flooding from the seaSeven Icon Destinations are highlighted in Table 8 as having 10 or more vulnerable assets and/or
more than 5% of vulnerable track. Subjectively ranked from greatest to least vulnerable, these are:
•• Abel Tasman Coast Track
•• Rangitoto Summit and Short Walks
•• Milford Sound/Piopiotahi
•• Kāpiti Island Nature Reserve
•• Cape Reinga Coastal Track
•• Ship Cove
•• North Head
Ten Gateway Destinations are also highlighted in Table 8. Subjectively ranked from greatest to
least vulnerable, these are:
•• Rangitoto tracks
•• Puponga Farm Park
•• Ahuriri Estuary
•• Queen Charlotte Track
•• Home Bay/Motutapu
•• Little River Rail Trail
•• Matata
•• Matiu (Somes) Island
•• Waikawau Bay
•• Maitai Bay
All these 17 Destinations may be identified as having moderate to high potential vulnerability
to coastal inundation20, with the Abel Tasman Coast Track (Icon), Rangitoto Summit and
Short Walks (Icon), and Rangitoto tracks (Gateway) requiring urgent detailed inundation risk
evaluations.
4.5 Assessment of DOC natural heritage management units
Ecosystem management in DOC is prioritised using a candidate set of around 1000 ecosystem
management units (EMUs) that range in size from less than 1 ha to over 50,000 ha, with an
average size of just over 3400 ha21. Wherever possible, EMUs contain sequences of related
ecosystems, often with catchment-defined boundaries.
EMUs were identified using information from a range of sources, including expert identification of
high-quality examples of particular ecosystems, previously identified sites of high ecological value
(e.g. ecological areas), and sites that are currently receiving intensive management, including
mainland islands. Together, the current set of EMUs contain a full range of New Zealand’s
terrestrial and freshwater ecosystems, including offshore islands, coastal turfs, lowland to montane
forests, tussock grasslands, wetlands, lakes and rivers.
For management purposes, EMUs have been ranked using spatial prioritisation software
(Zonation). Information about the distributions of threatened species is included with a
low weight to favour the selection of sites where threatened species will also benefit from
20 The 10 or more assets and/or more than 5% of track threshold is an arbitrary level for determining ‘moderate to high’ potential
vulnerability and can easily be altered or removed all together (i.e. all destinations with any land in the potential coastal
inundation zone could be considered potentially vulnerable).
21 See http://intranet/natural-heritage/managing-natural-heritage/natural-heritage-management-system/prioritisation/
ecosystems-prescriptions/
Science for Conservation 332 27management. The ranking process also takes account of existing gains from management,
recognising that maintaining sites that are already in good condition is generally more cost
effective than initiating work at new sites.
A smaller number of species management units (SMUs) have also been identified, containing
sites that support significant populations of threatened species, but that were not considered to
have significant ecosystem values.
The GIS layer ‘NATIS1.NATISADM.OPERATIONAL_DOC_PrescriptionManagementUnits’
includes the location and attribute information of DOC Prescription Management Units,
including ‘Ecosystem Management Units’ (EMUs) and ‘Species Management Units’ (SMUs).
4.5.1 Ecosystem Management Units (EMUs)
In total, 260 EMUs have some fraction of land in the potential coastal inundation risk zone (out
of a total of 98022 EMUs (26.5%) currently identified and mapped in New Zealand). Table 9 breaks
down these 260 EMUs based on the proportion of potentially vulnerable land and EMU rank.
Ta b l e 9 . N u m b e r o f D e p a r t m e n t o f C o n s e r v a t i o n ( D O C ) E c o s y s t e m M a n a g e m e n t U n i t s ( E M U s )
l o c a t e d i n t h e p o t e n t i a l c o a s t a l i n u n d a t i o n z o n e , l i s t e d b y d e c i l e b a n d s ( re p re s e n t i n g t h e
p ro p o r t i o n o f v u l n e r a b l e l a n d ) . A l s o s h o w n a re t h e n u m b e r o f E M U s r a n k e d i n t h e t o p 1 0 0 a n d
t o p 5 0 0 2 3 i n e a c h d e c i l e b a n d . S u p e r s c r i p t e d n u m b e r s a re t h e a b s o l u t e r a n k o f E M U s i f r a n k e d
in the top 20.
PROPORTION OF EMU NUMBER OF EMUs IN NUMBER OF EMUs NUMBER OF EMUs
LAND LOCATED IN THIS BAND RANKED IN TOP 100 IN RANKED IN TOP 500 IN
POTENTIAL COASTAL THIS BAND THIS BAND
INUNDATION ZONE (%)
90.0–100.0 11 0 7
80.0–89.9 1 0 0
70.0–79.9 4 1 2
60.0–69.9 3 1 2
50.0–59.9 3 11 2
40.0–49.9 4 1 3
30.0–39.9 10 1 5
20.0–29.9 17 82,7 14
10.0–19.9 25 53,16 14
0.0–9.9 182 264,5,9,10,11,13,14,18,19,20 96
TOTAL (10.0–100.0) 78 18 49
TOTAL (0.0–100.0) 260 44 145
The following summary points can be made from the numbers in Table 9:
•• 182 of the 260 potentially vulnerable EMUs (70%) have less than 10% of their total land area
in the potential coastal inundation zone24 – these 182 EMUs may be identified as having
low potential vulnerability;
•• The remaining 78 EMUs have 10% or more of their total land area in the potential coastal
inundation zone – these 78 EMUs may be identified as having moderate to high potential
vulnerability;
22 This total includes 35 Marine Reserves.
23 Current operational targets are to prioritise work in the top 500 EMUs, hence this figure has been used here.
24 The 10% or more threshold is an arbitrary level for determining ‘moderate to high’ potential vulnerability and can easily be
altered or removed all together (i.e. all management units with any land in the potential coastal inundation zone could be
considered potentially vulnerable).
28 Tait – Risk-exposure assessment of DOC coastal locations to flooding from the sea•• Of these 78 EMUs, 49 are ranked in the top 500 and 18 are ranked in the top 100 (including
the top three ranked EMUs [1. Sentinel Rock, Marlborough Sounds; 2. The Noises Islands,
Hauraki Gulf; and 3. Motunau Island, Bay of Plenty]) – these 49 EMUs may be identified as
requiring detailed inundation risk evaluation;
•• Seven EMUs ranked in the top 500 have between 80 and 100% of their land area located in
the potential coastal inundation zone [Brooklands, Waimakariri River Mouth, Canterbury;
Opunake, Taranaki; Horseshoe Lagoon, near Opihi River Mouth, Canterbury; Opihi
Rivermouth, Canterbury; Te Waihora/Lake Ellesmere, Canterbury; Wainono Lagoon,
Canterbury; and Tuiraho (Stent Road), north of Cape Egmont, Taranaki] – these seven
EMUs may be identified as requiring urgent detailed inundation risk evaluation.
4.5.2 Species Management Units (SMUs)
In total, 99 SMUs have some fraction of land in the potential coastal inundation risk zone (out
of a total of 479 SMUs (20.7%) currently identified and mapped in New Zealand). Table 10 breaks
down these 99 SMUs based on the proportion of potentially vulnerable land.
Ta b l e 1 0 . N u m b e r o f S p e c i e s M a n a g e m e n t U n i t s
(SMUs) located in the potential coastal inundation
z o n e , l i s t e d b y d e c i l e b a n d s ( re p re s e n t i n g t h e
p ro p o r t i o n o f v u l n e r a b l e S M U l a n d ) . N o t e , S M U s a re
c u r re n t l y u n r a n k e d .
PROPORTION OF SMU LAND
NUMBER OF SMUs IN
LOCATED IN POTENTIAL
THIS BAND
COASTAL INUNDATION ZONE (%)
90.0–100.0 3
80.0–89.9 3
70.0–79.9 1
60.0–69.9 1
50.0–59.9 3
40.0–49.9 7
30.0–39.9 4
20.0–29.9 3
10.0–19.9 11
0.0–9.9 63
TOTAL (10.0–100.0) 36
TOTAL (0.0–100.0) 99
The following summary points can be made from the numbers in Table 10:
•• 63 of the 99 potentially vulnerable SMUs (64%) have less than 10% of their total land area
in the potential coastal inundation zone – these 63 SMUs may be identified as having low
potential vulnerability;
•• The remaining 36 SMUs have 10% or more of their total land area in the potential coastal
inundation zone – these 36 SMUs may be identified as having moderate to high potential
vulnerability;
•• Six SMUs have between 80 and 100% of their land area located in the potential coastal
inundation zone [Waioioi Reef, Albatross Point, Waikato; Bird Island, off the Otago
Peninsula; Chesterfield, West Coast; Bridge Point, near Orore Point, South Canterbury;
Waikoura Point Coast, Matakana Island, Tauranga Harbour, Bay of Plenty; and Maketu
Spit, Maketu, Bay of Plenty] – these six SMUs may be identified as requiring urgent detailed
inundation risk evaluation.
Science for Conservation 332 295. Conclusions
This report (and the associated GIS datasets) identifies DOC assets, archaeological sites,
recreation functional locations, destinations and ecosystem and species management units
located in a potential coastal inundation (flooding caused by high seas) risk zone, based on a
national enhanced Digital Elevation Model (DEM). This zone presents low-lying coastal land that
is ‘potentially vulnerable’ to inundation from the sea, now and in the future within this century. As
the sea rises over the course of this century and beyond, the inundation risk at these locations will
be exacerbated (i.e. occur more frequently and deeper flooding) and increasingly extend inland.
The identification of these potentially at-risk sites will inform DOC policy, prioritisation processes
and operational management activities as part of DOC’s overall responsibilities for these areas.
Due to accuracy limitations of the national DEM, the elevation contour data have been used to
identify coastal locations that are ‘potentially vulnerable’ to inundation from the sea, now and
in the future. Thus, the information in this report should be used as a national-scale coastal
risk-exposure screening assessment to guide DOC priorities. More detailed risk assessment
of specific locations using a two-stage approach involving analysis of historical records, local
knowledge and site visits followed by detailed mapping using LiDAR-derived DEM data should
follow this national-level study and where appropriate. These assessments could also include the
potential for coastal erosion and elevated groundwater impacts.
5.1 Assets
While by far the majority (approx. 97%) of DOC assets are not located in the potential
coastal inundation zone, a total of 331 assets are potentially at risk. In summary, there are 20
campgrounds, 29 maintained areas, 1 playground, 127 buildings (ranging from 34 toilets to
1 visitor centre), 26 infrastructure assets, 2 items of machinery and 126 structures (ranging from
41 boardwalks to 4 steel pedestrian bridges).
5.2 Archaeological sites
Based on the dataset owned by the New Zealand Archaeological Association, a total of 4149
archaeological sites are located in the potential coastal inundation risk zone, representing 6% of
all the sites in the country. Of these, 420 sites (5%) are located on PCL (out of a total of 8026 PCL
sites). DOC has a responsibility to protect these sites from avoidable harm.
5.3 Recreation functional locations
Each DOC asset is linked to a recreation functional location. If ‘archaeological sites’,
‘machinery’ and ‘sheds’ are not considered, then a total of 119 recreation functional locations
containing at least one potentially vulnerable asset are potentially at risk. The following 18
recreation functional locations have five or more potentially vulnerable assets (the number of
assets shown in brackets), and hence have moderate to high potential vulnerability to coastal
inundation: Rangitoto – Historic Bach Community (36); Fishermans wharf, Milford (17); Wairau
Lagoons Walkway (17); Rangitoto – Wharf Area (16); Abel Tasman Coast Track – Bark Bay
Hut and campsite (14); Abel Tasman Coast Track – Marahau to Onetahuti (11); Port Jackson
Campsite / Muriwai Walk (9); Rangitoto – WWII Military Installations (8); Milford Foreshore
Walk (8); Farewell Spit houses (6); Gillespies Beach (5); Kaituna Quarry (5); Marahau carpark (5);
Motutapu – Island Roads (5); Queen Charlotte Track – Anakiwa to Te Mahia (5); Waipapa Point
picnic area (5); Wairau Bar picnic area (5); and Waituna Lagoon picnic area (5).
30 Tait – Risk-exposure assessment of DOC coastal locations to flooding from the sea5.4 Destinations
The ‘destination’ GIS layer includes the location and attribute information of 169 DOC Icon and
Gateway destinations. 62 of these destinations (37%) have some part of their delineated polygon
located in the potential coastal inundation zone. Seven Icon Destinations have 10 or more
vulnerable assets and/or more than 5% of vulnerable track. These are: Abel Tasman Coast Track;
Rangitoto Summit and Short Walks; Milford Sound/Piopiotahi; Kapiti Island Nature Reserve; Cape
Reinga Coastal Track; Ship Cove and North Head. A further 10 Gateway Destinations also meet
this criterion. These are: Rangitoto tracks; Puponga Farm Park; Ahuriri Estuary; Queen Charlotte
Track; Home Bay / Motutapu; Little River Rail Trail; Matata; Matiu (Somes) Island; Waikawau Bay
and Maitai Bay. All these 17 Destinations therefore have moderate to high potential vulnerability to
coastal inundation, with the Abel Tasman Coast Track (Icon), Rangitoto Summit and Short Walks
(Icon), and Rangitoto tracks (Gateway) requiring urgent detailed inundation risk evaluation.
5.5 Ecosystem Management Units (EMUs)
260 Ecosystem Management Units (EMUs) have some portion of land in the potential coastal
inundation risk zone (out of a total of 980 EMUs (26.5%) currently identified and mapped in
New Zealand). 78 of these 260 EMUs have 10% or more of their total land area in the potential
coastal inundation zone – these 78 EMUs therefore have moderate to high potential vulnerability.
Of these 78 EMUs, 49 are ranked in the top 500 and 18 are ranked in the top 100 (including
the top three ranked EMUs [1. Sentinel Rock, Marlborough Sounds; 2. The Noises Islands,
Hauraki Gulf; and 3. Motunau Island, Bay of Plenty]) – these 49 EMUs therefore require detailed
inundation risk evaluation. Seven EMUs ranked in the top 500 have between 80 and 100% of
their land area located in the potential coastal inundation zone [Brooklands, Waimakariri River
Mouth, Canterbury; Opunake, Taranaki; Horseshoe Lagoon, near Opihi River Mouth, Canterbury;
Opihi Rivermouth, Canterbury; Te Waihora / Lake Ellesmere, Canterbury; Wainono Lagoon,
Canterbury; and Tuiraho (Stent Road), north of Cape Egmont, Taranaki] – these seven EMUs
therefore require urgent detailed inundation risk evaluation.
5.6 Species Management Units (SMUs)
99 Species Management Units (SMUs) have some portion of land in the potential coastal
inundation risk zone (out of a total of 479 SMUs (20.7%) currently identified and mapped
in New Zealand). 36 SMUs have 10% or more of their total land area in the potential coastal
inundation zone – these 36 SMUs therefore have moderate to high potential vulnerability. Six
of these SMUs have between 80 and 100% of their land area located in the potential coastal
inundation zone [Waioioi Reef, Albatross Point, Waikato; Bird Island Otago, off the Otago
Peninsula; Chesterfield, West Coast; Bridge Point, near Orore Point, South Canterbury;
Waikoura Point Coast, Matakana Island, Tauranga Harbour, Bay of Plenty; and Maketu Spit,
Maketu, Bay of Plenty] – these six SMUs therefore require urgent detailed inundation risk
evaluation.
Science for Conservation 332 31You can also read