WORKING GROUP ON THE BIOLOGY AND LIFE - HISTORY OF CRABS (WGCRAB; outputs from 2019 meeting) - ICES
←
→
Page content transcription
If your browser does not render page correctly, please read the page content below
WORKING GROUP ON THE BIOLOGY AND LIFE
HISTORY OF CRABS (WGCRAB; outputs from
2019 meeting)

VOLUME 3 | ISSUE 32
ICES SCIENTIFIC REPORTS

RAPPORTS
SCIENTIFIQUES DU CIEM

                          IC E S   INTERNATIONAL COUNCIL FOR THE EXPLORATION OF THE SEA
                          CIEM     CONSEIL INTERNATIONAL POUR L’EXPLORATION DE LA MER
International Council for the Exploration of the Sea
Conseil International pour l’Exploration de la Mer
H.C. Andersens Boulevard 44-46
DK-1553 Copenhagen V
Denmark
Telephone (+45) 33 38 67 00
Telefax (+45) 33 93 42 15
www.ices.dk
info@ices.dk

ISSN number: 2618-1371

This document has been produced under the auspices of an ICES Expert Group or Committee. The
contents therein do not necessarily represent the view of the Council.

© 2021 International Council for the Exploration of the Sea.

This work is licensed under the Creative Commons Attribution 4.0 International License (CC BY 4.0).
For citation of datasets or conditions for use of data to be included in other databases, please refer to
ICES data policy.
ICES Scientific Reports

Volume 3 | Issue 32

WORKING GROUP ON THE BIOLOGY AND LIFE HISTORY OF CRABS
(WGCRAB; outputs from 2019 meeting)

Recommended format for purpose of citation:
ICES. 2021. Working Group on the Biology and Life History of Crabs (WGCRAB; outputs from 2019 meet-
ing). ICES Scientific Reports. 3:32. 68 pp. https://doi.org/10.17895/ices.pub.8003

Editor
Martial Laurans

Authors
Ann Lisbeth Agnalt • Ann Merete Hjelset • AnnDorte Burmeister • Carlos Mesquita •
Darrell Mulloway • Fabian Zimmermann • Jack Emmerson • Jan Sundet • Martial Laurans •
Martin Wiech • Mathew Coleman • Paul Chambers • Rosslyn McIntyre • Samantha Stott •
Sara Clarke • Snorre Bakke
ICES   |   WGCRAB 2021                                                                                                                                           |   i

           Contents
           i      Executive summary ....................................................................................................................... ii
           ii     Expert group information ..............................................................................................................iii
           1      Summary of Achievements............................................................................................................ 1
                  1.1      France, lobster (Homarus gammarus) and brown crab (edible crab) stocks ................... 1
                  1.2      Isle of man, lobster (Homarus gammarus) and brown crab (edible crab) stocks ............ 1
                  1.3      Scotland, lobster (Homarus gammarus) and brown crab (edible crab) stocks................ 1
                  1.4      Norway, king crab (Paralithodes camtschaticus) and snow crab (Chionoecetes
                           opilio) and brown crab (edible crab) stocks ..................................................................... 1
                  1.5      England, lobster (Homarus gammarus) and brown crab (edible crab) stocks................. 2
                  1.6      Canada, snow crab (Chionoecetes opilio) stocks.............................................................. 2
           2      Final report on the terms of reference .......................................................................................... 3
                  2.1      Norwegian edible crab (Cancer pagurus) stock ............................................................... 3
                  2.2      Scotland edible crab (Cancer pagurus) stock ................................................................... 5
                  2.3      Scotland Lobster (Hommarus gamarus) stock ............................................................... 10
                  2.4      Ireland edible crab (Cancer pagurus) stock ................................................................... 13
                  2.5      England edible crab (Cancer pagurus) and lobster (Homarus gammarus) stocks ......... 15
                  2.6      Norwegian Snow crab (Chionoecetes opilio) stock ........................................................ 18
                  2.7      Canadian Snow crab (Chionoecetes opilio) stock ........................................................... 19
                  2.8      French Lobster (Homarus gammarus) stock .................................................................. 29
                  2.9      French brown crab (Cancer pagurus) stock ................................................................... 31
           Annex 1:        List of participants.......................................................................................................... 33
           Annex 2:        WGCRAB Resolution ...................................................................................................... 35
           Annex 3:        Updated tables: fishery and survey data ....................................................................... 38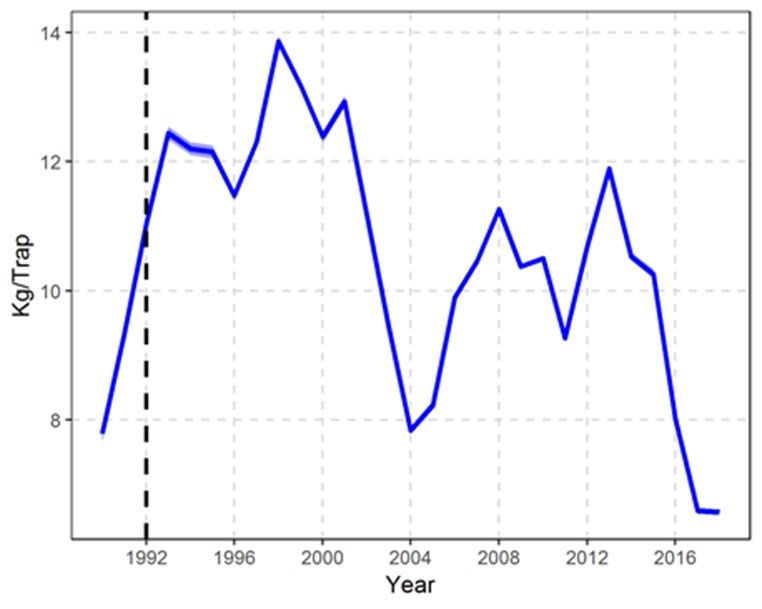
ii   |   ICES SCIENTIFIC REPORTS 3:32                                                                         |   ICES

     i Executive summary

         The Working Group on the Biology and Life History of Crabs (WGCRAB) is focused on the main
         exploited crab and lobster species in North-West Europe and North-East America to deliver
         stocks status and new knowledge on ecology and biology.
         In this report, the working group presents the data and results which were available to develop
         the main methods to produce robust stock diagnostics. The report details where the data are
         missing and what work needs to be put in place to achieve this. Depending on the country, the
         administrative rules, resources available to follow the fisheries in place and the data available
         are different. This has led to different ways to analyse data and produce diagnostics on stocks
         status. Development of indices with long time-series have been used to follow stocks in some
         countries. Other countries produce stock diagnostics every three years from specific models us-
         ing the data recorded during the three year period. The data available by country are variable
         and it is not standardized in a way to develop the same methodology approaches at a large stock
         scale. Many fleets targeting crabs are made of small vessels (less 10 meters) where data on activ-
         ities are scattered without data collection taking place in different national programs. For most
         countries, the management rules in place provide a way to control ongoing trap fisheries The
         control of effort and the access of the fisheries are key to manage the main stocks in particular
         those with quotas.
         There have been several studies on biology and ecology of crabs and lobsters but it is considered
         that more work needs to be performed on growth or migration, for example to establish the im-
         pact of climate change. Few studies have been focused on diseases but some biomass fluctuations
         should be studied looking at this aspect. Further work will be oriented to have diagnostics at
         stock scale when stocks are shared by fleets involving different countries.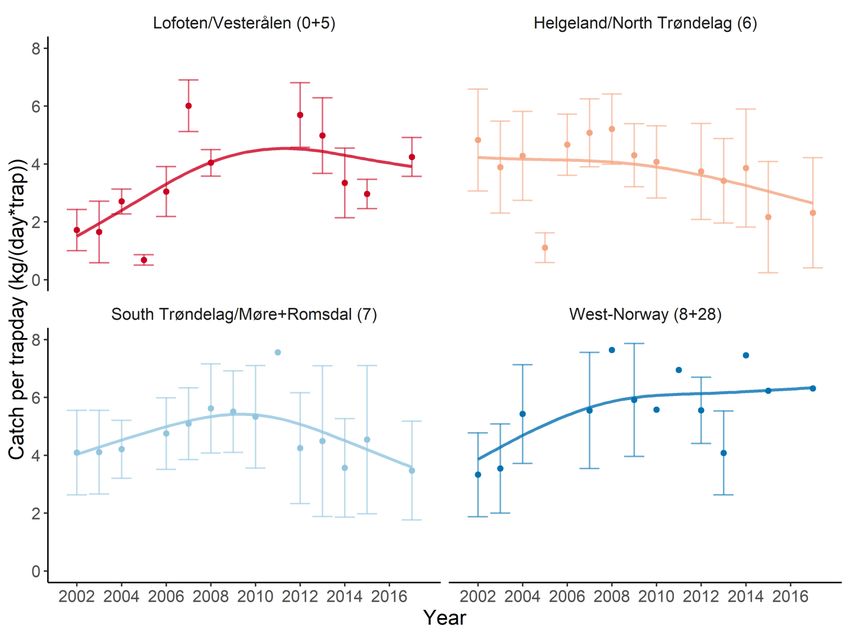
ICES   |   WGCRAB 2021                                                                                    |   iii

       ii Expert group information

           Expert group name            Working Group on the Biology and Life History of Crabs (WGCRAB)

           Expert group cycle           Multiannual

           Year cycle started           2017

           Reporting year in cycle      3/3

           Chair                        Martial Laurans, France

           Meeting venue(s) and dates   3–6 November 2017, Brest, France, 12 participants

                                        3–6 November 2018, Saint Hélier, Jersey, 14 participants

                                        4–8 November 2019, Tromsø, Norway, 13 participants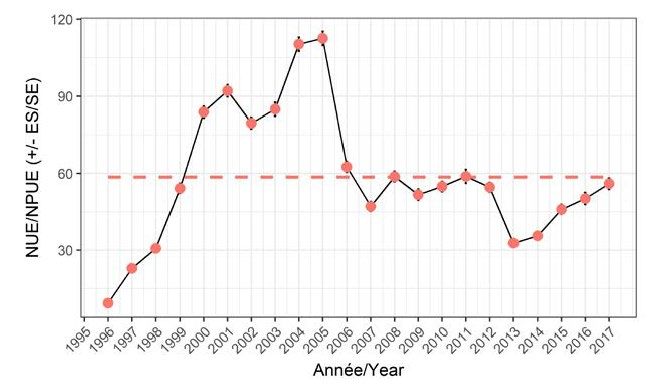
ICES   |   WGCRAB 2021                                                                                                 |   1

       1 Summary of Achievements

           1.1          France, lobster (Homarus gammarus) and brown crab
                        (edible crab) stocks
           From fisherman declarations (logbook and fishing sheet), new approach has been developed
           with a new way to select the data and a new model to estimate abundance index. All fishing
           regions have been studied with a time-series of 10 years or more.

           1.2          Isle of Man, lobster (Homarus gammarus) and brown
                        crab (edible crab) stocks
           In order to get more accurate data, some vessels around Isle of Man have been equipped with
           electronic logbook associated with environmental sensors fixed in some pots. From these new
           data, many data on the spatial distribution of the species and the seasonal variations have been
           recorded. In parallel, some tests are performed to automatize sampling of size for lobster and
           brown crab from automatic analyses of pictures. No assessment at present.
           http://fisheries-conservation.bangor.ac.uk/iom/documents/71.pdf

           1.3          Scotland, lobster (Homarus gammarus) and brown
                        crab (Edible crab) stocks
           Assessments have been performed inside of 12 management regions. The stock assessments for
           lobster and brown crab continue to be based on LCAs for 3-year periods. From current fishery
           data, no long term index can be developed, it is why some analyses to estimate abundance index
           have been developed from independent dredge surveys where brown crab is an untargeted spe-
           cies. Due the protocol used, the abundance index and the spatial distribution seem robust.
           https://data.marine.gov.scot/dataset/crab-and-lobster-fisheries-scotland-results-stock-assess-
           ments-2013-2015

           1.4          Norway, king crab (Paralithodes camtschaticus) and
                        snow crab (Chionoecetes opilio) and brown crab (edible
                        crab) stocks
           Brown crab stock continue to be assessed from reference fleet data. Some vessels along the coast
           record many data which are used to follow the long term trend of several index of the brown
           crab stock.
           Bakke, Snorre; Buhl-Mortensen, Lene; Buhl-Mortensen, Pal, 2019. Some observations of Cancer pagurus, Lin-
               naeus 1758 (Decapoda, Brachy-Ura) in deep water. Crustanea, Volume: 92 Issue: 1 Pages: 95-105 .

           Bakke, Snorre; Larssen, Wenche E; Woll, Astrid K, 2018. Size at maturity and molting probability across
               latitude in female Cancer pagurus. Fisheries Research, Volume: 205 Pages: 43-51

           The king crab stock is followed thanks to trawl surveys independent data and a global model
           with a fitted Bayesian development is applied. On the snow crab, further activities are put in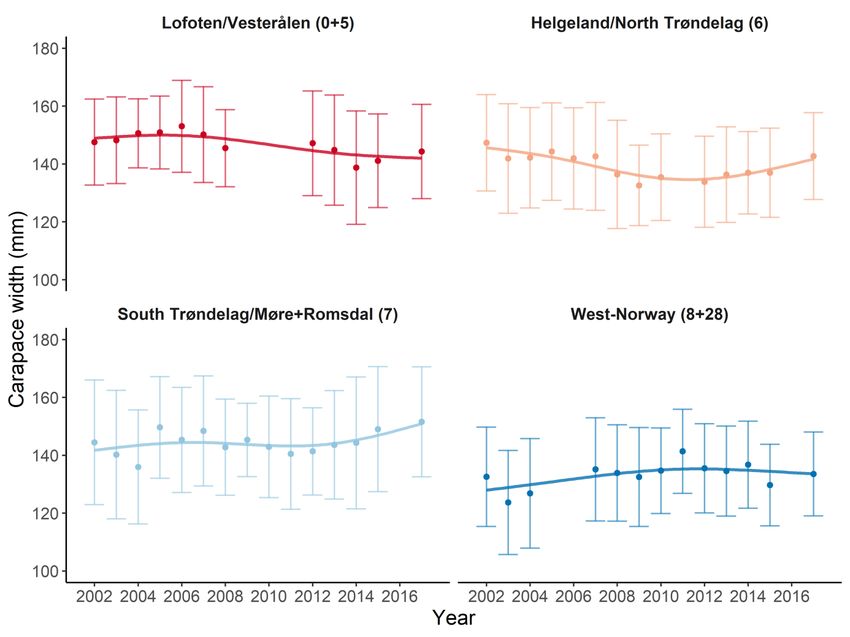
2   |   ICES SCIENTIFIC REPORTS 3:32                                                                                    |   ICES

        place to better understand the increase of the spatial distribution in the Barents Sea. First trap
        surveys have supplied useful data.
        Significant work has been carried out by a Phd regarding contaminants in brown crab. Focus on
        Cadnium level has been studied to understand the origin and the spatial distinction between
        regions. Some other works have been performed too on lobster and nephrops.
        Wiech, Martin; Vik, Eirin; Duinker, Arne, 2017. Effects of cooking and freezing practices on the distribution
           of cadmium in different tissues of the brown crab (Cancer pagurus), 2017. Food Control, Volume:
           75 Pages: 14-20

        1.5          England, lobster (Homarus gammarus) and brown crab
                     (Edible crab) stocks
        As in Scotland, assessment stocks are based on LCA for 3 year periods for lobster and brown
        crab. Several management regions are defined along the coast in North Sea, Western and Eastern
        Channel and Celtic Sea. Currently, works are in place to develop new automatic tools to get more
        data of size structure in region with information. In the same way, a project using video systems
        try to bring data to estimate catpturability of lobster.
        https://www.gov.uk/government/publications/crab-and-lobster-stock-assessment-2017

        1.6          Canada, snow crab (Chionoecetes opilio) stocks
        From many sources of data, index are estimated to follow the state of the stocks. Using environ-
        mental data, some forecast are estimated for the recruitment. Recently, new procedures have
        been developed to propose precautionary approaches.
        Mullowney, D., Baker, K., Pedersen, E., and Osborne, D. 2018. Basis for A Precautionary Approach and
            Decision Making Framework for the Newfoundland and Labrador Snow Crab (Chionoecetes opilio) Fish-
            ery. DFO Can. Sci. Advis. Sec. Res. Doc. 2018/054. iv + 66 p.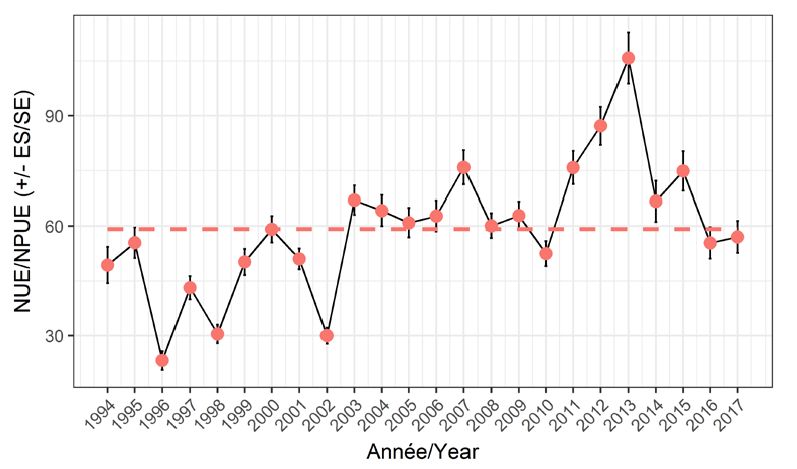
ICES   |   WGCRAB 2021                                                                                            |   3

       2 Final report on the terms of reference

           2.1           Norwegian edible crab (Cancer pagurus) stock
           ToR a) Landing, discard, effort and catch data

           The fishery
           After a peak in 2007 with 8500 tonnes, total landings of edible crab in Norway have reached a
           stable level and fluctuated mostly between 4600 and 5800 tonnes (Figure 1). Edible crab is fished
           along most of the Norwegian coast, from the Skagerrak area in the southeast to the Troms area
           in the north. However, landings of edible crab vary strongly among the regions, and mid-Nor-
           way, specifically the areas between Møre-Romsdal and Helgelandskysten (statistical areas 6 and
           7), have developed into the main fishing areas since the early 2000s.
           The fishing fleet is dominated by small-scale vessels; of 352 vessels reporting more than 100 kg
           of edible crab landings in 2018, 95% were below 11 m vessel length, and only 1 vessel was larger
           than 15 m. Access to the fishery is currently unrestricted and largely unregulated, except for a
           minimum size limit (11 cm and 13 cm carapace width (CW), respectively, south and north of
           59˚30' N). To reduce by-catch of European lobster, escape openings for lobster are required in all
           but a few regions. In addition, a significant recreational fishery targets edible crab. No infor-
           mation on recreational landings are available, although it can be assumed that they are sizeable
           compared to the commercial fishery.
           Reference fleet
           Stock and catch data for Norwegian edible crab is provided by a reference fleet of crab fishers.
           The number of participating crab fishers has varied from 5 to 25 fishermen in the period 2001 to
           2019. The reference fleet provides data on landings and discard rates (unstandardized), size (car-
           apace width) and sex ratio, and discards of females with external roe, soft shell crabs, crabs below
           minimum size limit, and for other reasons (damaged crabs, crab with black spots or missing
           limbs.). In 2017, measurements of 5165 individual crabs were registered.
           Despite substantial variation and uncertainty caused by the low participation rate in some years,
           the time-series of reference fleet offers important insights into stock status and development of
           the fishery for an otherwise strongly data-limited fishery. Since 2015, reporting of the reference
           fleet has been reduced to a biannual cycle to increase instead the number of fishermen reporting
           from all statistical areas and, thus, the data quality.
           Stock status
           Due to the limited data availability, no analytical assessment or reference point exist for the Nor-
           wegian stock of edible crab. However, catch sizes (Figure 2) and CPUE (Figure 3) as registered
           by the reference fleet show no major changes over time. This picture is consistent with the stable
           to positive trend in total landings of the commercial fishery. Considering that the fishery is open-
           access and, thus, self-regulated, the available information indicates a robust status of the stock
           and a sustainable fishing pressure.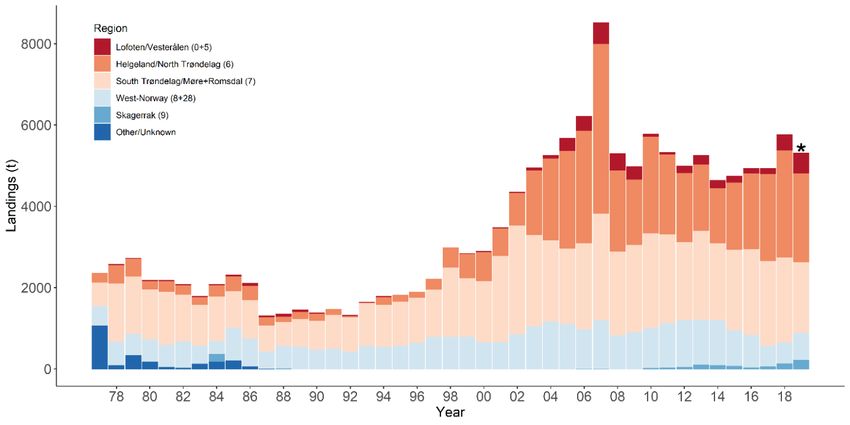
4   |   ICES SCIENTIFIC REPORTS 3:32                                                                                                |   ICES

        Figure 1. Total Norwegian landings of Cancer pagurus per region (statistical area) for the years 1977 to 2019 (*until De-
        cember) based on landing slips.

        Figure 2. Annual mean carapace width (dots) of edible crab and corresponding standard deviation (error bars) as regis-
        tered by the reference fleet in the four major fishing regions (representing 5 statistical areas) between 2002 and 2017.
        Solid lines show trends based on GAM smoothing functions.
ICES | WGCRAB 2021 | 5
Figure 3. Annual mean catch per trapday (kg per days soaking and trap) (dots) of edible crab and corresponding standard
deviation (error bars) as registered by the reference fleet in the four major fishing regions (representing 6 statistical
areas) between 2002 and 2017. Solid lines show trends based on GAM smoothing functions.
2.2 Scotland edible crab (Cancer pagurus) stock
ToR a) Landing, discard, effort and catch data
Total Scottish landings of brown crab fluctuated between 9500 and 12 300 tonnes from 2009 to
2018 (Table 1). The principal fishing areas for brown crab in Scotland are Orkney, East Coast,
Hebrides and South Minch (Figure 4); landings from these areas accounted for over 60% of the
total in 2018. Landings from the offshore areas of Sule and Papa increased sharply in the 1990s
when the fishery expanded, but have decreased in the last years. Landings from Orkney and
East Coast showed an increasing trend in recent years (Figure 5). The majority of crabs fished in
Scottish waters are landed in the third and fourth quarters of the year.6 | ICES SCIENTIFIC REPORTS 3:32 | ICES
Table 1. Annual Brown crab landings (tonnes) into Scotland by creel fishery assessment unit from 2009–2018. Data from
Fisheries Management database.
Assessment unit Year
2009 2010 2011 2012 2013 2014 2015 2016 2017 2018
Clyde 99.4 139.3 137 182.8 159.3 189.6 180.2 181.1 321.4 337.2
East Coast 778.6 1029.0 1091.3 1213.9 1271.3 1305.9 1200.2 1608.7 1768.1 1743.5
Hebrides 1822.3 1885.8 2433.3 1996.5 2130.2 2667.2 2218.2 2391.3 1819.7 1414.4
Mallaig 8.5 12.9 21.3 69.6 6.7 17.5 10.7 25.8 8.3 24.3
North Coast 568.3 681.9 428.7 514.2 571.2 537.8 1015.7 1046.1 869.3 592.6
Orkney 1155.6 1462.1 1746.6 1693.7 1906.2 1958.8 2037.9 2462.9 2444.1 2064.9
Papa 1002.0 878.2 884.2 828.2 936.3 1239.4 929.8 888.4 786.4 617.5
Shetland 390.2 334.4 419 478.4 604.9 666.1 457.5 282 474.7 550.6
South East 308.0 345.7 356.7 447.1 469.9 396.2 457.4 619.6 633.2 582.2
South Minch 1000.7 1651.3 1632.4 1094.4 869.8 1191.6 692.5 982.2 1040.6 1152.0
Sule 1981.8 1928.9 2275.5 1611.2 1491.6 1703.6 1629.9 1298.4 950.3 687.3
Ullapool 192.1 245.4 244.9 687.2 439.0 400.9 207.6 318.1 439.5 434.6
Outside 176.7
Assess. Units 158.7 261.9 188.2 74.7 34.3 31.5 51.4 36.6 44.4
Total 9466.1 10856.7 11859.1 10891.9 10890.6 12306.0 11089.0 12141.2 11599.9 10377.8ICES | WGCRAB 2021 | 7
E1 E2 E3 E4 E5 E6 E7 E8 E9
51
61
50
49
60
Papa Shetland 48
Sule
47
59
Hebrides North Coast
Orkney 46
45
58
Ullapool
East Coast
44
43
57
Mallaig 42
South Minch South East 41
56
40
Clyde
39
55
38
-8 -6 -4 -2 0
Figure 4. Crab and lobster creel fishery assessment units in Scotland.8 | ICES SCIENTIFIC REPORTS 3:32 | ICES
2500
CL EC HE
2000
1500
1000
500
0
2500 MA NC OR
2000
1500
1000
Landings (Tonnes)
500
0
2500
PA SH SE
2000
1500
1000
500
0
2500 SM SU UL
2000
1500
1000
500
0
2500 1980 1990 2000 2010 1980 1990 2000 2010
'Outside'
2000
1500
1000
500
0
1980 1990 2000 2010
Year
Figure 5. Annual brown crab landings (tonnes) into Scotland by fishery assessment unit. ‘Outside’ relates to brown crab
landed outside the creel assessment units; see Figure 1 for area locations.ICES | WGCRAB 2021 | 9
ToR b) Length-based indicators of brown crab in Scotland
Stock assessments based on LCAs for the period 2013–2015 were carried out for nine of the
twelve assessment units, providing estimates of fishing mortality in relation to the FMSY proxies.
No assessments were performed for Mallaig and Ullapool as the sampling data collected were
considered insufficient to run LCAs. In Shetland, fishing mortality for females were deemed in-
conclusive due to inconsistent results obtained when using different biological parameters esti-
mated for Shetland and elsewhere. Of the nine assessed areas, eight were fished above the FMSY
proxy to some extent (Table 2). Fishing mortality was estimated to be above FMSY for both males
and females in Clyde, East Coast, North Coast, Orkney, South East, South Minch and Sule. In
the Hebrides, fishing mortality for males was at FMSY while females were fished above FMSY.
In Papa, recent fishing mortality was around FMSY or lower. Overall, assessment results for the
period 2013–2015 showed that brown crab in most of the assessment units in Scotland were
fished close to or above the FMSY proxy. In many of the assessment units, a higher yield and bio-
mass per recruit in the long term could potentially be obtained by reducing the level of fishing
mortality (effort).
Table 2. Brown crab stock status, relationship between F and FMSY proxy for 2006–2008, 2009–2012 and 2013–2015.
F (Fishing Mortality) F (Fishing Mortality)
Assess- Assess-
2006- 2009- 2006- 2009-
ment pe- 2013-15 ment pe- 2013-15
2008 2012 2008 2012
riod riod
Males Above FMSY East Males Above FMSY
Clyde
Fe- Above FMSY Coast Females Above FMSY
Hebri- Males At FMSY Males Unknown
Mallaig
des Fe- Above FMSY Females Unknown
North Males Above FMSY Males Above FMSY
Orkney
Coast Fe- Above FMSY Females Above FMSY
Males Below FMSY South Males Above FMSY
Papa
Females At FMSY East Females Above FMSY
Shet- Males Above FMSY South Males Above FMSY
land Fe- Unknown Minch Females Above FMSY
Males Above FMSY Males Unknown
Sule Ullapool
Females Above FMSY Fe- Unknown10 | ICES SCIENTIFIC REPORTS 3:32 | ICES
ToR e) Use of survey data to assess the distribution of brown crab in the East of
Scotland
Brown crab (Cancer pagurus) is a widely distributed crustacean that occurs around the British
coastline supporting important commercial fisheries. The habitat preferences of brown crab
around Scotland are poorly documented and for the purposes of stock assessment, the species is
considered data-poor. Based on an analysis of dredge and trawl surveys taking place in the
North Sea (2008–2018), the spatial distribution of brown crab was described and abundance and
recruitment indices for the species were developed. Geostatistical methods and generalized ad-
ditive models (GAMs) were used to model catch rates in relation to a number of explanatory
variables (depth, distance to the coast, sediment type and year). The dredge and trawl abundance
indexes were correlated showing a similar trend of increasing catch rates in the early years of the
time-series up to 2016 and a subsequent reduction. The recruitment index showed a gradual
increase in captured juvenile crabs up to 2014 followed by a steep decrease with 2018 being the
lowest value estimated. The derivation of robust indicators of stock abundance will contribute
to the stock assessment of this species and enable the provision of improved fisheries manage-
ment advice for brown crab around Scotland.
2.3 Scotland Lobster (Hommarus gamarus) stock
ToR a) Landing, discard, effort and catch data
Total Scottish landings of lobster fluctuated between 950 and 1200 tonnes from 2009 to 2018 (Ta-
ble 3). The total tonnage of lobster landed in Scotland has consistently been much lower than
that of crabs. However, reported lobster landings have increased substantially over the last
years. Historically the majority of landings of lobster in Scotland have been from the Hebrides,
Orkney and South Minch, with the South East and East Coast areas becoming increasingly im-
portant in more recent years (Figure 6). Landings from these areas accounted for around 87% of
the total in 2018. Small quantities of lobster were landed from grounds outside the assessment
areas, including ICES rectangles to the west of South Minch, to the south of Clyde and just out-
side the South East and East Coast areas. The majority of lobsters fished in Scottish waters are
landed in the third and fourth quarters of the year.ICES | WGCRAB 2021 | 11
Table 3. Annual Lobster landings (tonnes) into Scotland by creel fishery assessment unit from 2009–2018. Data from
Fisheries Management database.
Assessment unit Year
2009 2010 2011 2012 2013 2014 2015 2016 2017 2018
Clyde 17.4 24.8 26.3 24.7 23.5 46.2 35.4 40.4 47.4 35.6
East Coast 163.9 207.3 279.3 265.5 214.9 226.1 227.8 254.8 347.6 351.9
Hebrides 142.5 155.8 141.7 139.0 97.3 148.6 114.7 127 133.1 171.4
Mallaig 0.4 0.9 1.2 12.7 0.6 1.0 0.5 0.9 1.4 1.9
North Coast 12.0 14.3 15.4 10.0 10.0 10.7 13.3 14.5 16.1 11.3
Orkney 160.3 170.8 177.8 155.5 117.4 163.6 113.9 117.1 113.9 98.3
Papa 10.4 10.3 6.4 5.7 5.7 7.8 3.2 2.9 3.1 1.3
Shetland 25.7 29.8 29.2 36.8 35.9 39.7 40.7 52.6 55.6 39.1
South East 257.3 277.8 374.6 334.4 387.8 409.2 348.8 367.3 326.0 323.1
South Minch 99.8 112.0 89.9 84.7 75.2 101.3 78.7 96.4 102.1 105.5
Sule 4.0 3.4 3.6 2.1 0.6 0.7 0.6 0.4 0.8 0.7
Ullapool 12.3 18.7 10.8 11.6 15.1 16.7 14.4 14.2 18.4 20.7
Outside Assess.
Units 46.8 74.4 62.9 49.7 41.8 36.3 50.4 61.9 48.4 51.5
Total 953.0 1100.3 1219.1 1132.5 1025.9 1207.8 1042.4 1150.4 1214.0 1212.312 | ICES SCIENTIFIC REPORTS 3:32 | ICES
400
CL EC HE
300
200
100
0
400
MA NC OR
300
200
Landings (Tonnes)
100
0
400
PA SH SE
300
200
100
0
400
SM SU UL
300
200
100
0
400 1980 1990 2000 2010 1980 1990 2000 2010
'Outside'
300
200
100
0
1980 1990 2000 2010
Year
Figure 6. Annual lobster landings (tonnes) into Scotland by fishery assessment unit. ‘Outside’ relates to lobster landed
outside the creel assessment units; see Figure 1 for area locations.
ToR b) Length-based indicators of lobster in Scotland
Stock assessments based on LCAs for the period 2013–2015 were carried out for eight of the
twelve assessment units, providing estimates of fishing mortality in relation to the FMSY proxies
(Table 4). Sampling data were considered to be insufficient (low numbers and infrequent sam-
pling) for running assessments in Mallaig, North Coast, Sule and Ullapool. Lobsters in all the
assessed areas were fished above the FMSY proxy to some extent, particularly males. Fishing mor-
tality was estimated to be above FMSY for both males and females in Clyde, East Coast, South East,
Shetland and South Minch. In the Hebrides, Orkney and Papa, fishing mortality for females was
at FMSY or below while males were fished above FMSY. Overall, assessment results for the period
2013–2015 show that lobster in most of the assessment units in Scotland were fished close to orICES | WGCRAB 2021 | 13
above the FMSY proxy. A higher yield and biomass per recruit in the long term could potentially
be obtained in all assessment units by reducing the level of fishing mortality (effort).
Table 4. Lobster stock status, relationship between F and FMSY proxy for 2006–2008, 2009–2012 and 2013–2015.
F (Fishing Mortality) F (Fishing Mortality)
Assess- Assess-
2006- 2009- 2006- 2009-
ment pe- 2013-15 ment pe- 2013-15
2008 2012 2008 2012
riod riod
Males Above FMSY East Males Above FMSY
Clyde
Fe- Above FMSY Coast Females Above FMSY
Hebri- Males Above FMSY Males Unknown
Mallaig
des Females Below FMSY Females Unknown
North Males Unknown Males Above FMSY
Orkney
Coast Fe- Unknown Females At FMSY
Males Above FMSY South Males Above FMSY
Papa
Females Below FMSY East Females Above FMSY
Shet- Males Above FMSY South Males Above FMSY
land Fe- Above FMSY Minch Females Above FMSY
Males Unknown Males Unknown
Sule Ullapool
Females Unknown Fe- Unknown
2.4 Ireland edible crab (Cancer pagurus) stock
ToR a) Landing, discard, effort and catch data
Irish vessels fish for crab in ICES Areas IV, VI and VII. In 2010 the WG agreed a series of assess-
ment units covering fisheries exploited by vessels from UK, Ireland, France, Norway and Swe-
den. Four of these assessment units, (Malin, SW Ireland, SE Ireland/Celtic Sea, N Irish Sea) sur-
round the Irish coast and Irish inshore vessels fish in all four units. Landings (tonnes) into Ire-
land from 2005 to 2018 for these four assessment units and adjacent assessment units by Irish
vessels are shown in Table 5. These landings are collated from the operational landings database.
The quality of the landings data from the official national databases are variable and may at times
reflect changes in the efficacy of recording rather than the crab fishery itself. Landings data for
2019 is incomplete at this time and therefore has not been included.14 | ICES SCIENTIFIC REPORTS 3:32 | ICES
Table 5. Landings (tonnes) by assessment unit of Cancer pagurus by Irish vessels from 2005 to 2018. Data is based on
operational data from logbooks and does not include landings from under 10metre vessels. (‘Outside’ refers to landings
caught from outside the assessment units agreed upon at WGCRAB 2010 and ‘Not Recorded’ refers to landings where
the ICES Rectangle was not recorded.)
Assessment
2005 2006 2007 2008 2009 2010 2011 2012 2013 2014 2015 2016 2017 2018
Unit
Central North
2726.4 1550.6 6.1 79.9 13.8 1319.1 1239.8 1044.8
Sea
Clyde 2.6
Eastern Channel 1.6 0.54
Hebrides 0.9 850.2
Malin 403.1 1436.1 3177.2 4462.8 8931.2 6029.7 3146.2 2631.0 3788.4 3359.2 2906.3 4946.8 5236.0 4333.4
N. Irish Sea 0.5 147.8 34.7 43.4 25.7 35.5 17.0 23.4 19.9 44.9
North Coast 249.9
Norway Sweden
0.04
09
Orkney
Outside 614.0 28.0 692.7 2.0 2.0 5.4 19.7 3.3 2.5 15.2
Papa
SE Ireland/Celtic
143.3 585.4 595.2 110.8 296.5 220.2 118.7 176.0 223.4 569.0 552.3 525.0
Sea
Shetland 0.48
South Minch 157.7 31.8
Southern North
979.7 1182.1 1389.2
Sea
Sule 855.2
SW Ireland 42.1 23.0 114.3 807.1 843.2 554.2 339.6 520.3 365.1 536.4 472.5 734.5 631.6 829.4
Western
0.8 35.4 13.3 0.246
Channel
Not Recorded 4.1
Total 3314.9 3595.6 4650.2 5297.9 9774.4 9503.0 4840.2 4678.9 4297.9 5515.0 3690.3 7595.9 7683.1 6792.6
Size distribution data was collected from the Malin, SW Ireland and SE Ireland/Celtic Sea assess-
ment units during 2016, 2017 and 2018. Measurements of Brown Crab from both at sea and port
sampling around the coast of Ireland totalled 9949 in 2016; 10 138 in 2017 and 5540 in 2018. In
2016 the majority (46%) of brown crab measured were caught from the SW Ireland assessment
unit, while in 2017 and 2018 the largest proportions of brown crab measured were from Malin,
65.38% and 64.96%, respectively. The majority of crab measured were female (67%+) for all three
years in both catch and landings sampling.
The size range of Female and Male brown crab from 4 assessments units is shown in Table 6 with
the modal sizes being displayed in Table 7.
No assessment methods are currently being utilised by Ireland on the four stocks/assessment
units around the Irish coast.ICES | WGCRAB 2021 | 15
Table 6. Size range of both Female and Male Brown Crab from the four main assessment units around the Irish coast in
2016, 2017 and 2018.
Celtic Sea/SE Ireland Irish Sea Malin SW Ireland
Year
Female Male Female Male Female Male Female Male
2016 38-186 59-185 53-220 52-243 57-245 58-265 41-215 10-207
2017 53-215 55-231 61-110 60-115 35-235 36-220 56-207 64-197
2018 99-183 112-191 48-200 15-217 61-211 60-210
Table 7. Modal sizes of Female and Male Brown Crab from the four main assessment units around the Irish coast in 2016,
2017 and 2018.
Celtic Sea/SE Ireland Irish Sea Malin SW Ireland
Year
Female Male Female Male Female Male Female Male
2016 148 (n=610) 131 (n=241) 113 (n=474) 83 (n=508) 160 (n=2715) 110 (n=930) 160 (n=2898) 140 (n=1634)
2017 148 (n=1547) 134 (n=459) 88 (n=51) 94 (n=60) 160 (n=5114) 130 (n=1514) 90 (n=684) 98 (n=613)
2018 173(n=49) 148 (n=28) 160 (n=2364) 120 (n=1235) 162 (n=1313) 165 (n=551)
2.5 England edible crab (Cancer pagurus) and lobster
(Homarus gammarus) stocks
The fisheries for edible crab Cancer pagurus and European lobster Homarus gammarus are both
inshore pot fisheries which mostly consist of small under 10 metre vessels, particularly for lobster
(Figure 7). Management of both fisheries are by technical measures only, consisting of a mini-
mum size limit of 130mm for crab and 87 mm for lobster and a ban on landing berried females
or v-notched lobsters. There are also regional management measures implemented and enforced
by local Inshore Fisheries Conservation Authorities (IFCA’s) within their district up to the 6 nau-
tical mile limit. These include pot limits, escape gaps, maximum vessel size and increased mini-
mum landing sizes.
Figure 7. Vessel size crab (Left) and Vessel size lobster (Right).
ToR a) Landing, discard, effort and catch data of brown crab
Trends in crab landings are highly regional. Step changes are due to changes in data reporting
during the time-series (Figure 8). In the North Sea landings of crab have been increasing in recent
years whilst effort has remained constant or decreased. This could be an artefact of an increasing
number of large vessels fishing offshore with more pots. Effort data are reported as days fished,
which does not give a complete picture, particularly when number of pots set daily by individual
vessels within a fishery can differ by an order of magnitude. Days fished in the Channel and
Celtic Sea has not increased since 2012, but landings have decreased in the Western Channel
since 2016.16 | ICES SCIENTIFIC REPORTS 3:32 | ICES
2a) Central North Sea
2b) Southern North Sea
2c) Eastern Channel 2d) Western Channel
2e) Celtic Sea
Figure 8. England landings and fishing effort: Edible crab.
ToR a) Landing, discard, effort and catch data of lobster
Landings of lobster have remained reasonably steady for the last decade in all regions apart from
the Southeast South Coast, where landings have declined since 2015 (Figure 9). Days fished has
increased in East Anglia, with a drop in 2018. Elsewhere effort has decreased or remained steady.
There could be an increase in vessel size and number of pots set to some extent within the lobster
fishery but it is not evident with the data available.ICES | WGCRAB 2021 | 17
3a) Northumberland and Durham 3b) Yorkshire Humber
3c) East Anglia 3d) Southeast South Coast
3e) Southwest
Figure 9. England landings and fishing effort: Lobster.
ToR b) Length-based indicators of lobster and brown crab in England
Bi-annual stock summaries are produced with estimate sustainability based on the results of
Length-Based Cohort Analyses and Yield Per Recruit assessments. Fishing mortality and spawn-
ing stock biomass estimates are calculated and presented in relation to reference points: Target
reference is a maximum sustainable yield proxy of 35% virgin spawner per recruit (SPR) and the
limit is 15% SPR. In the assessment models natural mortality is assumed to be 20% for crab and
15% for lobster.
Assessments have not yet been published for crab and lobster in 2018 but will be available online
once quality control has been completed. Future work that could improve assessments will aim
to explore models less sensitive to regional minimum landing size, provide more accurate esti-
mates of growth parameters and natural mortality, and explore animal behaviour to obtain more
insight into pot selectivity.18 | ICES SCIENTIFIC REPORTS 3:32 | ICES
2.6 Norwegian Snow crab (Chionoecetes opilio) stock
ToR a) Landing, discard, effort and catch data of snow crab
Regulations:
The snow crab (Chionoecetes opilio) stock has since 1996 increased rapidly both in distribution and
abundance in the Barents Sea. It is now expected that the snow crab inhabits large parts of the
Russian exclusive economic zone, the entire Loophole (international waters in the central Barents
Sea) and increasing parts of the Svalbard Fishery Protection Zone (Svalbard FPZ).
The fishery for snow crab commenced in 2012, and the main fishing area is in the central part of
the Barents Sea. The fishery is an offshore fishery, and the fleet consists of large vessels between
40 and 70m with on-board processing. The vessels probably operate between 1000 and 2000 pots
every day. Snow crab in the Barents Sea fishery are exclusively harvested using conical pots
deployed in strings connected to longline. The minimum legal size for male snow crab in the
Barents Sea is 100 mm carapace width (CW). All undersized snow crabs and females must be
returned to the sea. The management regulations in the Svalbard Fisheries Protection Zone and
Norwegian EEZ are as follows: minimum legal size of 100 mm CW; maximum of 12 000 pots
deployed per vessel; maximum soak time for pots of three weeks; mandatory use of pot gear
only; the fishery is closed and all pots must be removed from the seabed from June to September;
and a maximum of 20% post moult crab caught (Norwegian Fisheries Directorate (www.fisk-
eridir.no), 2018).
The fishery:
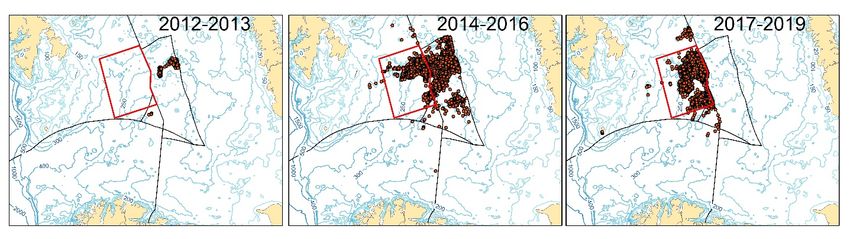
A small fishery was initiated in 2012, and the total landings from the Barents Sea peaked in 2016
with a total of 16 000 tons, all landed in Norwegian harbours (Figure 10). In the beginning, Nor-
wegian, EU vessels and Russian vessels fished in the central parts of the Barents Sea (Figure 11).
From 2017 new regulations caused that only Norwegian vessels can fish on the Norwegian con-
tinental shelf and Russian fishing vessels fish on their shelf. Both Norwegian and Russian gov-
ernments introduced a TAC from 2017. The two last years (2018 and 2019) around 12 000 tones
snow crab were landed by Norwegian and Russian fleet from the Barents Sea in total.ICES | WGCRAB 2021 | 19
Figure 10. Overview of landings of snow crab from the Barents Sea in the period 2012 to 2019.
Figure 11. Showing fishery activity from Norwegian vessels in the period 2012 to 2019 in the Barents Sea.
Management goals:
The snow crab will be managed with the goal of sustainable harvesting based on the knowledge
on how the species affect each other in the ecosystem. This will be achieved by balancing two
sub goals; maximizing long-term catch yield and minimize the risk of unwanted ecosystem ef-
fects.
2.7 Canadian Snow crab (Chionoecetes opilio) stock
ToR a) Landing, discard, effort and catch data of snow crab
This report focuses on snow crab distributed throughout Atlantic Canada in Divisions of the
Northwest Atlantic Fisheries Organization (NAFO, Figure 12) [2HJ3KLNOP4RSTVWX]. Within
the snow crab stock range there are four Department of Fisheries and Oceans (DFO) Regions,
defined in Table 8.
No information is available for Divisions 4VWX for this report because no stock assessment pub-
lication available yet.20 | ICES SCIENTIFIC REPORTS 3:32 | ICES
Table 8. NAFO Divisions, DFO Regions, and associated Geographical Terminology incorporated within the stock range of
Atlantic Canadian snow crab.
NAFO Divisions Region Geographical Terminology
2H,2J,3K,3L,3N,3O,3P,4R Newfoundland & Labrador Newfoundland & Labrador Shelf
4S Quebec Northern Gulf of St. Lawrence
4T Gulf Southern Gulf of St. Lawrence
4VWX Maritimes Eastern Scotian Shelf
Figure 12. Map of Atlantic Canada showing NAFO Divisions.ICES | WGCRAB 2021 | 21
Fishery Landings
Figure 13. Landings of Atlantic Canadian snow crab by NAFO Division.
All Regions have obligatory dockside monitoring of landings implemented in management of
the fishery. The two largest Regions of supply are the Newfoundland & Labrador and Gulf Re-
gions. Landings of snow crab in Atlantic Canada have approximated 67 000–69 000 t in the past
two years, following levels of >80 000 t from 1999 to 2017 (Figure 13). The recent decrease in
landings is most attributable to NAFO Divisions 3LNO in the Newfoundland and Labrador Re-
gion.22 | ICES SCIENTIFIC REPORTS 3:32 | ICES
ToR b) CPUE indicators of snow crab in Canada
Fishery CPUE in the Newfoundland and Labrador Region (NAFO Divisions 2HJ3KLNOP4R)
was at a historic low in 2019 (Figure 14), reflecting broad-scale trends throughout most of the
Region.
Figure 14. Fishery CPUE in the Newfoundland and Labrador Region. Source – DFO, 2019a.
Fishery CPUE in the Southern Gulf of St. Lawrence (NAFO Division 4T) has remained near or
above historic norms in all areas in recent years (Figure 15).
Figure 15. Fishery CPUE in the Gulf Region. Source – DFO, 2019b.ICES | WGCRAB 2021 | 23
Fishery CPUE in the Northern Gulf of St. Lawrence (NAFO Division 4S) in the Quebec Region
has remained near the long-term average in recent years (Figure 16).
Figure 16. Fishery CPUE in the major fishing areas (Area 17 above and area 16 below) of the Quebec Region. Source –
DFO, 2019c.24 | ICES SCIENTIFIC REPORTS 3:32 | ICES
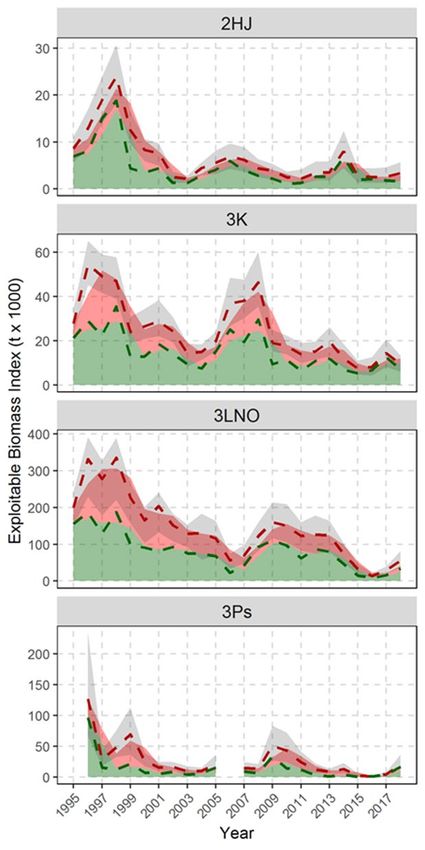
ToR b) Biomass indicators of snow crab in Canada
Trawl survey indices of exploitable (>94 mm Carapace Width) snow crab indicate the biomass is
at or near historic lows throughout the Newfoundland and Labrador Region, although increases
occurred in the Southern Divisions (3LNOPs) in 2018 (Figure 17).
Figure 17. Trawl survey indices of biomass of exploitable snow crab by Assessment Division in the Newfound-land and
Labrador Region. Source – DFO, 2019a.ICES | WGCRAB 2021 | 25
Trawl survey indices of exploitable (>94 mm Carapace Width) snow crab indicate the biomass is
near historic highs in the Southern Gulf of St. Lawrence, comprised predominately of recently
recruited crab (Figure 18).
Figure 18. Trawl survey index of biomass of exploitable snow crab in the Gulf Region. Source – DFO, 2019b.26 | ICES SCIENTIFIC REPORTS 3:32 | ICES
Trap survey indices of exploitable (>94 mm Carapace Width) snow crab in the major fishing areas
of the Northern Gulf of St. Lawrence indicate the biomass is near the long-term average (Figure
19).
Figure 19. Trap survey indices of biomass of exploitable snow crab in the major fishing areas (Area 17 above and area 16
below) of the Quebec Region. Source – DFO, 2019c.ICES | WGCRAB 2021 | 27
In the Southern Gulf of St. Lawrence, the exploitable biomass is predicted to remain unchanged,
at a high level, in 2019 (Figure 20).
Figure 20. Observed and predicted exploitable biomass indices for the Gulf Region. Source – DFO, 2019b.28 | ICES SCIENTIFIC REPORTS 3:32 | ICES
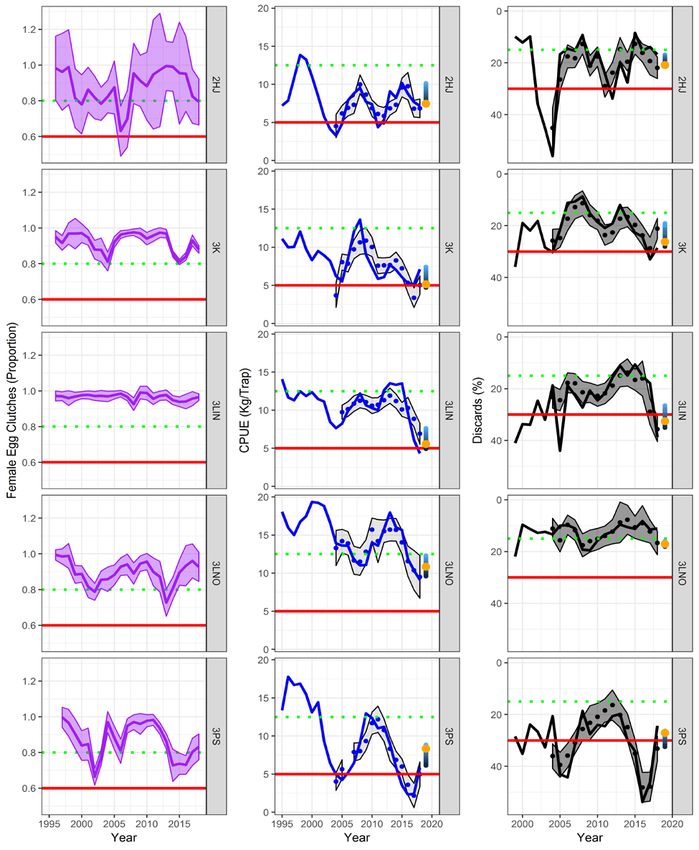
ToR b) Recautionary approach indicators of snow crab in Canada
Figure 21. The Precautionary Approach framework used in the Assessment of the Newfoundland and Labra-dor snow
crab resource. Source – DFO, 2019a.
The two Regions that comprise the majority of landings, Newfoundland & Labrador and the
Gulf, have implemented Precautionary Approach frameworks that include stock status projec-
tions in assessment of the resource and provision of management advice. In the Newfoundland
& Labrador Region, the framework has yet to be formally adopted into management of the re-
source, with upper stock reference points remaining provisional and Harvest Control Rules un-
der refinement. The assessment framework indicates the majority of mature females in the stock
are carrying full clutches of viable eggs and projects fishery CPUE to be in the cautious zone in
all Divisions in 2019, assuming status quo exploitation rates (Figure 21). Assessment Division 3L
Inshore is projected to be in the critical zone for discards.ICES | WGCRAB 2021 | 29
References
DFO. 2019a. Assessment of Newfoundland and Labrador (Divisions 2HJ3KLNOP4R) Snow Crab. DFO Can.
Sci. Advis. Sec. Sci. Advis. Rep. 2019/041.
DFO. 2019b. Assessment of snow crab (Chionoecetes opilio) in the southern Gulf of St. Lawrence (Areas 12,
19, 12E and 12F) to 2018 and advice for the 2019 fishery. DFO Can. Sci. Advis. Sec. Sci. Advis. Rep.
2019/010.
DFO. 2019c. Assessment of the Estuary and Northern Gulf of St. Lawrence (Areas 13 to 17, 12A, 12B, 12C
and 16A) Snow Crab Stocks in 2018. DFO Can. Sci. Advis. Sec. Sci. Advis. Rep. 2019/047.
2.8 French Lobster (Homarus gammarus) stock
ToR a) Landing, discard, effort and catch data of lobster
The French lobster fishery is mainly link to the use of pot as gear, more than 85%, the other part
come from gillnetters and in a lower case from trawlers. This fishery is located in shallow water
(0–50 meters) along the French coast (western and eastern channel and Bay of Biscay) on rocky
grounds. The annual landing are really seasonal with a peak in May and June. The legal size is
87 mm Lc. The two main rules in this fishery concern the access of the fishery with a maximum
number of vessel inside of each fishing area control with licences and a limited number of pot
per fishermen on board. Moreover, the pot needs to respect some characteristics of size and par-
lour pot are ban excepted in some specific areas.
The last decade, the annual landings fluctuated from 500 to 750 tons (Figure 22). The two last
years, the landings reached the maximum values of the last 20 years. The increased trend need
to observe with caution is due to improve of declaration system of fishing data. In fact, today
close to 100% of the fishermen declare their production and their fishing activity on a daily base
with fishing sheets. We can really indicate that a strong change occurred between 2009 and 2010
which allows to conclude that the global increase is less strong due to under declaration and less
performant system before 2009. Recently the number of vessel involve in the fishery is closed to
1000 but the number of vessel with an economical dependence to the lobster (annual catch >= 500
kg) is around 300.
800
700
600
500
400
300
200
100
0
2000 2005 2010 2015 2020
Total Landing (in Ton) Vessel Number
Figure 22. French landing of lobster and number of vessel target lobster (more than 500 kilogram per year).30 | ICES SCIENTIFIC REPORTS 3:32 | ICES
ToR b) CPUE indicators of lobster in France
The total production and effort are estimated from the daily fishing sheets. Today the quality of
the data is considered as high to propose some analyses. For the main vessels in each fishing are-
as, daily data are stored in the national bases. From these data, LPUE are estimated on daily base
per vessel which are using to propose a global LPUE index by fishing areas. A GLM model are
deployed to produce the indices.
The general trend for the main lobster areas seems to show two situations (Figure 23). First, in
the east par of the English Channel from Saint Malo to Boulogne (PCH, BL and SM) the LPUE
index have in-creased between 2014 and 2016 with a trend which stay quite stable on the decade.
For the Boulogne area, the global trend indicate a real increase of the LPUE index. West of these
areas and in the south Brittany, all the index trend increase steadily. The global situation is con-
sidered as good even if no Length-based indicators are yet estimated. The data available seem to
indicate that the size structures are quite stable.
Eastern Channel
Cherbourg Quarter Boulogne Quarter
Western Channel- North Brittany Areas
Brest Quarter Morlaix Quarter Paimpol Quarter Saint Malo Quarter
Bay of Biscay – South Brittany Areas
Concarneau Quarter Croisic Quarter
Figure 23. LPUE index more fishing lobster area.ICES | WGCRAB 2021 | 31
2.9 French brown crab (Cancer pagurus) stock
ToR a) Landing, discard, effort and catch data of brown crab
As for the French lobster fishery, the main gear used to catch brown crab is pot. The potter fleet
follows the same rules to access to the resource as the lobster French fleet: licences and limited
number of pots par vessel. This fleet is composed by offshore potters which perform trips be-
tween 7 to 10 days (in the center of western English Channel and the off the bay of Biscay) and
coastal potters along the French coast. The gillnet fleet land now closed to 20% of the total land-
ings as non target species in the monkfish fishery.
During a long time the French brown crab landings was around 5000 to 6000 tons. In the last 4
years, an important decrease is noted with a landings under 4000 tons in 2018 (Figure 24). The
decrease of the landings is mainly observed in the potter fleet. In the same period, no change has
been noted in the global fishing effort or in the spatial distribution of the fleet. The decrease of
the landings started in coastal water before to reach offshore areas.
French Brown Crab landings
7 000
6 000
5 000
4 000
3 000
2 000
1 000
-
2000 2005 2010 2015 2020
Figure 24. French brown crab landings (ton).32 | ICES SCIENTIFIC REPORTS 3:32 | ICES
ToR b) CPUE indicators of brown crab in France
From the data of the coastal potter, the trend from different areas is quite clear with a decrease
of the lPUE index for 4 or 5 years now (Figure 25). In other areas, where so few vessel data are
available to develop a LPUE index, the trend of single vessel is equivalent.
Eastern Channel Western Channel- North Brittany Areas Bay of Biscay – South Brittany Areas
Boulogne Quarter Brest Quarter Croisic Quarter
Figure 25. LPUE index trend from coastal vessels.
From the offshore potter fleet, the LPUE index trend seems to be equivalent even if the decrease
seem to be more recent (Figure 26). After many year with an LPUE index really stable with some
annual fluctuation with no real trend, the recent change has to be noted.
LPUE Index of french offshore potter fleet
1600
1400
1200
LPUE (kg/1000 pots)
1000
800
600
400
200
0
2008 2010 2012 2014 2016 2018 2020
Figure 26. LPUE index in Western English Channel and Bay of Biscay from the offshore potter fleet data.
No size structure model has been developed yet. With data available is quite difficile to ex-plain
the current decrease of the LPUE index. In the recent years, no change has been noted in the total
fishing effort as for the spatial distribution of the fishing activities. Using the ecological move-
ment for brown crab from shallow water when juvenile to deep areas when they reach maturity
could permit to indicate that the change should come from a recruitment de-crease. This situation
would have been observed first in coastal fishery and later offshore.
We need to understand now which elements in the environmental factors which can explain this
situation and develop an approach in order to be able to build an annual recruitment index.ICES | WGCRAB 2021 | 33
Annex 1: List of participants
WGCRAB 2019 meeting
Name Institute Country Email
Martial Laurans Ifremer, Brest France martial.laurans@ifremer.fr
(chair)
AnnDorte Greenland Institue Groenland anndorte@natur.gl
Burmeister of Natural resources
Darrell Mulloway DFO, St Johns, Canada Darrell.Mullowney@dfo-mpo.gc.ca
Newfoundland
Carlos Mesquita Marine Scotland Scotland, UK C.Mesquita@MARLAB.AC.UK
Science
Ann Merete Hjelset Institute of Marine Norway ann.merete.hjelset@hi.no
Research
Matthew Coleman Orkney Sustainable Orkney, UK matt@orkneysustainablefisheries.co.uk
Fisheries
Ann Lisbeth Agnalt Institute of Marine Norway ann-lisbeth.agnalt@hi.no
Research
Rosslyn McIntyre Cefas UK rosslyn.mcintyre@cefas.co.uk
Jan Sundet Institute of Marine Norway jan.h.sundet@hi.no
Research
Martin Wiech Institute of Marine Norway Martin.Wiech@hi.no
Research
Snorre Bakke Moreforsking Norway snorre.bakke@moreforsk.no
Alesund
Fabian Institute of Marine Norway fabian.zimmermann@hi.no
Zimmermann Research
Samantha Stott Cefas UK samantha.stott@cefas.co.uk34 | ICES SCIENTIFIC REPORTS 3:32 | ICES
WGCRAB 2018 meeting
Name Country/ Institute Email
AnnDorte Burmeister Greenland (Natur) anndorte@natur.gl
Darrell Mulloway Newfoundland (DFO) darrell.mullowney@dfo-mpo.gc.ca
Ann Merete Hjelset Norway (IMR) ann.merete.hjelset@imr.no
Carlos Mesquita UK, Scotland (Marine Lab) c.mesquita@marlab.ac.uk
Jack Emmerson UK (University Bangor) j.emmerson@bangor.ac.uk
Matthew Coleman UK (Orkney Sustainable Fisheries) matt@orkneysustainablefisheries.co.uk
Ann Lisbeth Agnalt Norway (IMR) ann-lisbeth.agnalt@imr.no
Paul Chambers Jersey gov. P.Chambers@gov.je
Rosslyn McIntyre UK (Cefas) rosslyn.mcintyre@cefas.co.uk
Martial Laurans France (Ifremer) Martial.laurans@ifremer.fr
(chair)
Jan Sundet Norway (IMR) jan.h.sundet@hi.no
Martin Wiech Norway (IMR) Martin.Wiech@hi.no
Snorre Bakke Norway (Møreforsking Ålesund) snorre.bakke@moreforsk.no
Sara Clarke Ireland (Marine Institute) Sarah.Clarke@Marine.ie
WGCRAB 2017 meeting
Name Country/ Institute Email
AnnDorte Burmeister Greenland (Natur) anndorte@natur.gl
Darrell Mulloway Newfoundland (DFO) darrell.mullowney@dfo-mpo.gc.ca
Ann Merete Hjelset Norway (IMR) ann.merete.hjelset@imr.no
Carlos Mesquita UK, Scotland (Marine c.mesquita@marlab.ac.uk
Lab)
Jack Emmerson UK (University Bangor) j.emmerson@bangor.ac.uk
Matthew Coleman UK (Orkney Sustainable matt@orkneysustainablefisheries.co.uk
Fisheries)
Ann Lisbeth Agnalt Norway (IMR) ann-lisbeth.agnalt@imr.no
Paul Chambers Jersey gov. P.Chambers@gov.je
Rosslyn McIntyre UK (Cefas) rosslyn.mcintyre@cefas.co.uk
Martial Laurans (chair) France (Ifremer) Martial.laurans@ifremer.fr
Jan Sundet Norway (IMR) jan.h.sundet@hi.no
Martin Wiech Norway (NIFES) Martin.Wiech@hi.noICES | WGCRAB 2021 | 35
Annex 2: WGCRAB Resolution
2016/MA2/SSGEPD08 The Working Group on the Biology and Life History of Crabs
(WGCRAB), chaired by Martial Laurans, France, will work on ToRs and generate deliverables as
listed in the Table below.
C OMMENTS ( CHANGE IN
M EETING DATES V ENUE R EPORTING DETAILS C HAIR, ETC .)
Interim report by 15
Year 2017 7–9 November Brest, France
December 2017
Interim report by 10
Year 2018 6–8 November Jersey
December
Final report by 10 December
Year 2019 4–8 November Tromsø,
to SCICOM
Norway
ToR descriptors
E XPECTED
D ESCRIPTION B ACKGROUND S CIENCE D ELIVERABLES
TOR P LAN CODES D URATION
a Compile data on landings, The fisheries for crabs and 3 years Landing, discard,
discards, effort and catch rates lobster are socio-economically effort and catch data
(CPUE) and provide important and trans-national in on listed species, from
standardised CPUE, size Europe and Canada with the each country.
frequency and research survey demise of fin fisheries in some WG report chapter
data for the important crab and regions.
lobster (Homarus) fisheries in
the ICES area, and Atlantic
Canada and Greenland. Maps
will be produced to synthesise
the data. One part of these data
will be provide to the ICES
Data Centre.
b Evaluate assessment of the Management of stocks in Europe 3 years Report on evaluation
status of crab and lobster is primarily by technical of alternative
(Homarus) stocks including use measures only and in most assessment methods.
of indicators, empirical countries there are generally no
assessment, analytical management instruments to
assessment in relation to data control fishing effort. Knowledge
sources and data quality, of the population dynamics of
development and suitability of these species is still weak. These
reference points for stocks may be at risk from over-
management. fishing due to the lack of control
of fishing effort, and hence an
evaluation of the sustainability
of these fisheries is necessary.
c Review the impact of climate WGCRAB will investigate the 3 years Highlight important
divers (temperature, ocean relative importance of fishing issues to be basis for
acidification, changes and environment on crab and research on effect of
associated climate change and lobster recruitment. climate changes on
disease) on important crab and important crab stocks.
lobster species within the ICES, Furthermore there is a growing Each year a specific
Atlantic Canada and West concern in the WG about the point will be
Greenland. Studying the effects consequences of future climate delivered on the main36 | ICES SCIENTIFIC REPORTS 3:32 | ICES
resulting from changes in change for important crab knowledges and
decreasing pH which can be species in our region. Observed results for the
considered under ocean increases in sea water production of
acidification. Specific parts will temperatures have already WG report chapter
be achieve to work on the entailed expanded distribution (2019).
different subjects. areas of some species in the In reflection, a paper
northeast Atlantic. However, a on the review of the
rise in the seawater pH would main results could be
probably be the most serious expected.
consequences of the climate
change on crustaceans such as
crabs. These issues will be dealt
with by the WGCRAB in future.
d Review research and new Several stock parameters are Updated knowledge
knowledge on vital crab and important for analytical on crucial stock
lobster population biology assessments. Biological parameters for
parameters; information is therefore required important crab stocks.
to provide standardised indices
and for use in analytical
assessments. Crab stock
parameters may change due to
size selective and single sex
fisheries, through by-catch in
other fisheries or through the
impact of other seabed uses,
such as gravel extraction. Since
important crab stocks in Europe
are managed without fishery
independent data it may be an
option to investigate any useful
stock parameter indicators for
assessment purposes.
Summary of the Work Plan
Year 1 Annual standard outputs for a, b. Continue analysis for ToR d, e. Tentative plan for ToR c.
Year 2 Annual standard outputs for a, b. Continue analysis for ToR d, e. Complete evaluation of useful
assessment methods to assess crab and lobster species in ICES areas. Complete request to ACOM
and SCICOM (being both an assessment, advice and working group).
Year 3 Annual standard outputs for a, b. Combine analysis, research and report ToR d and e.
Supporting information
Priority High. The fisheries for crabs and lobster are socio-economically important and trans-
national in Europe and Canada with the demise of fin fisheries in some regions.
Management of stocks in Europe is primarily by technical measures only and in most
countries there are generally no management instruments to control fishing effort.
Knowledge of the population dynamics of these species is still weak. These stocks may be
at risk from over-fishing due to the lack of control on fishing effort, and hence an
evaluation of the sustainability of these fisheries is necessary. The activity of the Group is
therefore considered to be of high priority in particular if it’s activity can move towards
resource assessment without losing biological inputs.
Resource requirements The research programmes which provide the main input to this group are already
underway, and resources are already committed. The additional resource required to
undertake additional activities in the framework of this group is negligible..
Participants The Group is normally attended by some 10–15 members and guests.
Secretariat facilities None.ICES | WGCRAB 2021 | 37
Financial No financial implications.
Linkages to ACOM and There are no obvious direct linkages today, but if the EG will produce stock assessments
groups under ACOM in future WGCRAB will have linkages to several EGs under ACOM.
Linkages to other committees The EG aims to be able to give advises on how to exploit important crab stocks in the
or groups ICES area and is therefore related to EGs such as WGCRAN and the ICES/NAFO NIPAG.
Linkages to other
organizationsYou can also read


