Strength and Opportunity 2017 - The landscape of the medical technology and biopharmaceutical sectors in the UK
←
→
Page content transcription
If your browser does not render page correctly, please read the page content below

Strength and
Opportunity 2017
The landscape of the medical technology
and biopharmaceutical sectors in the UK

Annual Update – 2017
This is the ninth annual report that analyses the information contained in the Health
Life Sciences Database, published in May 2018.
Contents
Ministerial Foreword                                      2
Introduction		                                            4
   The Life Science industry - Key messages               5
Chapter 1 – Industry Overview                            11
   Core Sectors                                          12
   Service and Supply Sectors                            15
Chapter 2– Sector Overviews – Key Facts and Trends       17
   2.1. Biopharma sector                                 17
   2.2. Biopharma – Core businesses                      18
   2.3. Biopharma – service and supply chain             19
   2.4. Med Tech Sector (including digital health)       21
   2.5. Med Tech – Core businesses                       22
   2.6. Med Tech – service and supply chain              22
Chapter 3 – Geographical Analysis                        25
   3.1. Biopharma Geographical analysis                  29
   3.2. Med Tech Geographical Analysis                   31
Chapter 4 – Digital Health and Genomics                  34
   4.1. Digital health                                   34
   4.2. Genomics                                         36
Annex 1 – Full Data partners acknowledgement statement   38
Annex 2 – Summary of Methodology                         40
Annex 3 – Segmentation codes                             48
Annex 4 – Data Quality Principles                        52

                                                          1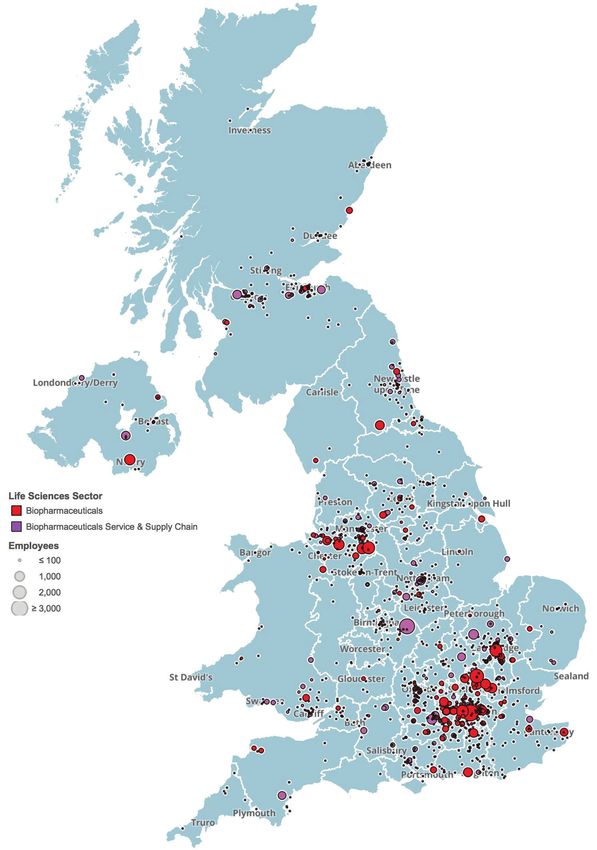
Ministerial Foreword
                  I am pleased to introduce the ninth annual update
                  of the Strength and Opportunity report which gives
                  a detailed picture of the size and shape of the life
                  sciences industry in the UK.

                 This report confirms that the UK remains a global
                 hub for life sciences, building upon previous
                 success. There are now 5,649 life sciences
businesses with a presence in the UK, generating turnover of over £70bn and
employing nearly 241,000 people.

Life sciences in the UK continues to grow across all key performance indicators,
with a 2.4% increase in employment and 9.3% increase in turnover between 2016
and 2017. This equates to 5,700 new jobs and an additional £5.9bn in revenue over
the course of 12 months.

For the first time, employment in medical technology overtook biopharmaceuticals,
with new and emerging segments within the life sciences sector coming to the fore.
Digital health added an extra 1,100 jobs this year alone, bringing employment to
over 10,000 and generating £1.2bn in turnover. Genomics, an emerging field in
which the UK is world-renowned, contributed £1.7bn in turnover in 2017. The
established biopharmaceutical presence also continues to thrive, delivering new
scientific understanding and innovative products to the benefit of patients.

It is pleasing to see that UK life sciences activity is spread across all parts of the
UK with nearly 70% of employment outside of London and the South East, with
significant presence in the East and North West of England. SMEs continue to be
a vital part of the industry accounting for 82% of businesses.

Despite these successes, Government remains focussed and committed to
identifying new opportunities presented to maintain and strengthen this position.
In December 2017, we published the first Life Sciences Sector Deal building on the
ambitious Life Sciences Industrial Strategy paper. As part of the Sector Deal, we will
increase investment in research development to 2.4% of GDP by 2027 and 3% over
the longer term – delivering an estimated increase of £80bn over the next 10 years.
We have also set out plans for the Health Research Authority to speed up approvals
for clinical trials.

Government continues to support collaboration between industry, innovators and
the NHS. This report comes five months after the Government’s response to the
Accelerated Access Review, with the new Accelerated Access Collaborative now in
place. Following the success of the Test Beds Programme a second wave has been
launched, and work continues apace to streamline the medicines pathway enabling
innovative cost-effective products to reach UK patients as quickly as possible.

2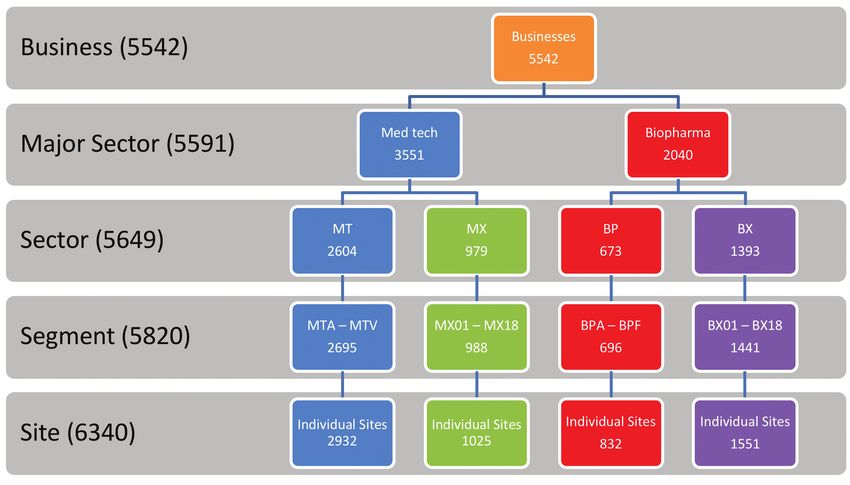
Ministerial Foreword

This report remains the most comprehensive depiction of businesses operating in
the life sciences sector in the UK and we hope continues to provide valuable
information for all seeking to understand life sciences in this country. I would like to
thank all those who contributed to the creation of this report, particularly the external
data partners which include trade associations and the Medilinks.

Lord Henley                                          Lord O’Shaughnessy
Parliamentary Under Secretary of                     Parliamentary Under Secretary of
State of the Department for Business,                State of the Department of Health
Energy and Industrial Strategy                       and Social Care

                                                                                            3
Introduction
0.1        This report identifies the Strengths in the UK Health Life Science industry
           and the Opportunities for future growth. The content of the report provides a
           2017 snapshot of the UK Life Science industry covering the Biopharma and
           Med Tech sectors1. The three main measures of economic contribution and
           industry structure are:

           ●    employment - the number of people employed by life science businesses
           ●    turnover - the amount of money taken by businesses within scope of life
                science sector activities
           ●    number of businesses – the number of life science businesses and their
                sites registered in the UK

0.2        This report demonstrates the significant economic contribution of the life
           science sector in terms of company turnover and employment, distributed
           across the UK.

0.3        It contains analyses of the industry looking at the economic activity of
           businesses that market therapeutic products and medical devices as well as
           the specialist service & supply chains that are key parts of the ecosystem.
           A segmentation approach is applied that enables a detailed analysis of the
           product and service categories that make up the industry2.

0.4        The analysis is based on the 2017 database of sites and businesses updated
           between October and December 20173 using the methodology summarised
           in Annex 2. The number of sites in the 2017 database is 6,340 which
           corresponds to 5,649 businesses. The difference between the numbers of
           records and businesses is due to businesses with multiple trading
           addresses, sites or legal entities and activity in more than one segment.

0.5        There are an additional net 2984 records in the 2017 database compared to
           2016. The change in the number of records is due to the following additions
           and removals:

           ●●   Added 446 records of businesses that were formed more than 12 months
                before the update but not identified in previous annual updates
           ●●   Added 121 records for businesses that were formed in the 12 months
                since the last annual update

1   The data does not include industrial biotechnology, animal health, not-for-profit organisations, public funded
    institutions or universities.
2   See Annex 4 for a description of the segmentation categories.
3   The data used is the most up to date from the sources used for each business and therefore the data on
    employment and turnover is for the last full year accounts.
4   In the 2017 annual update process 8,525 records were received for review from the data partners and other
    sources, of this 3,099 were already in the database, the remaining records were reviewed from which 592
    records were added to the database.

4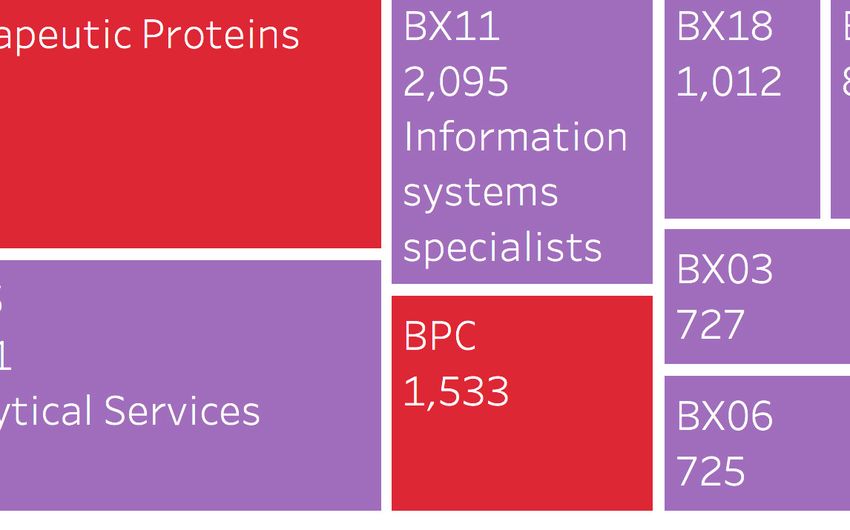
Introduction

          ●●   Added 70 records that are new sites for businesses in the 2016 database
          ●●   Added 19 businesses previously reported as ceased trading now trading
          ●●   Removed 188 businesses that have ceased trading or sites were closed
          ●●   Removed 170 businesses that are either reviewed as now not-in-scope,
               result of merger & acquisition activity or duplicates

0.6       This is the ninth ‘Strength and Opportunity’ annual report in the series. The
          data, charts, figures and maps used in this document, plus separate
          infographics can be found at https://www.gov.uk/government/publications/
          life-science-sector-data-2017

0.7       This year, for the first time, we will be publishing a subsequent supplemental
          report containing analysis of long-term trends utilising a new methodology
          which replaces the trend analysis used in all previous reports.

The Life Science industry – Key messages
0.8       The life science sector employs almost 240,900 people or approximately
          1.0% of all private sector employment5. There are 5,649 businesses
          generating approximately £70.3bn in annual turnover.

0.9       Biopharma and Med Tech each account for half of industry employment,
          with Biopharma generating over two-thirds of turnover (68%) whilst Med
          Tech comprises two-thirds of businesses (63%).

0.10      Between 2016 and 2017 the industry grew by 2.4% for employment and
          9.3% for turnover6. The increase in turnover was due to a significant increase
          in the turnover of three businesses, two of which were in the small
          molecules segment. Excluding the increase due to these businesses,
          turnover for the industry increased 2.5%.

0.11      The industry is composed of four sectors:

          ●●   Biopharma Core sector – comprises 6737 businesses active in developing
               and marketing human therapeutics employing an estimated 64,120
               people and generating £33.3bn in annual turnover.
          ●●   The Biopharma Service & Supply sector contains 1,393 businesses with
               activity in the sector employing an estimated 54,900 people and
               generating £14.9bn in turnover.

5   Based on ONS EMP13: Employment by Industry release 15th Nov 2017 estimating 25.19m private sector
    jobs.
6   Estimate is like-for-like growth based on change associated with trading, company creation and cessation.
    Information on the methodology for these estimates is presented in Annex 2.
7   The sum of the number of businesses in the sector data is greater than the industry total because some
    businesses are active across more than one sector – for example large medical device businesses that also
    produce biopharmaceuticals. See Figure 17 in Annex 2.

                                                                                                                5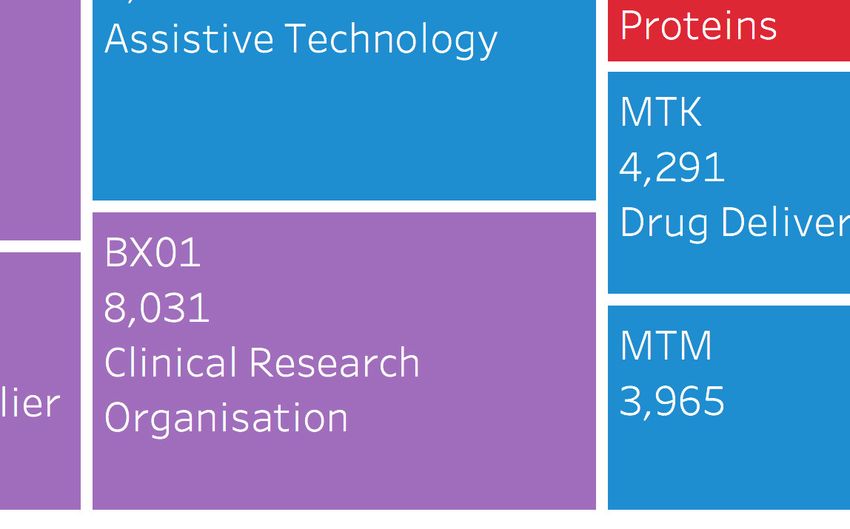
Strength and Opportunity 2017
The landscape of the medical technology and biopharmaceutical sectors in the UK

           ●●   Med Tech Core Sector – comprises 2,604 businesses with activity in
                developing and marketing medical devices, employing an estimated
                97,300 people and generating £17.8bn in annual turnover, of which
                £1.2bn is from businesses with activity in digital health.
           ●●   The Med Tech Service & Supply sector contains 979 businesses with
                activity in the sector employing an estimated 24,600 people generating
                £4.4bn in annual turnover.

0.12       The Top 3 segments in the industry based on number of people employed
           are:

           ●●   Biopharma businesses primarily involved in therapeutics based on small
                molecules
           ●●   Biopharmaceutical contract manufacturers and research businesses
           ●●   Suppliers of Biopharma consumables and equipment.

0.13       The Digital Health sub-segment contains 491 businesses, the largest number
           of all Med Tech segments. It employs an estimated 10,000 people, the
           largest Med Tech segment by employment and generated turnover of
           £1.2bn. The largest sub-segment contains businesses and sites involved in
           hospital information systems such as electronic medical records.

0.14       Business demographics:

           ●●   The majority of industry employment (68%) is outside of London and the
                South East with significant concentrations in East (an estimated 39,000
                people) and North West of England (an estimated 25,500 people).
                Compared to the Biopharma sector where 37% of sector employment is
                focused in London and the South East, the Med Tech sector is less
                focused with this area representing 28% of employment.
           ●●   SMEs comprise a substantial proportion of the life sciences industry,
                accounting for 82% of businesses, over 56,000 jobs and £7.2bn turnover.
                There are 784 large businesses, of which the 150 in Biopharma Core
                generate 98% of turnover in that sector (‘Big Pharma’).
           ●●   Where ownership data is available8, this shows that 59% of these
                businesses and sites are UK owned and they employ 45% of the
                workforce9.

8   Ownership data was available for 3,434 of the records in the source database or 54%.
9   3,434 businesses with records of ownership employs 219,400 out of 240,886 UK life science workforce.

6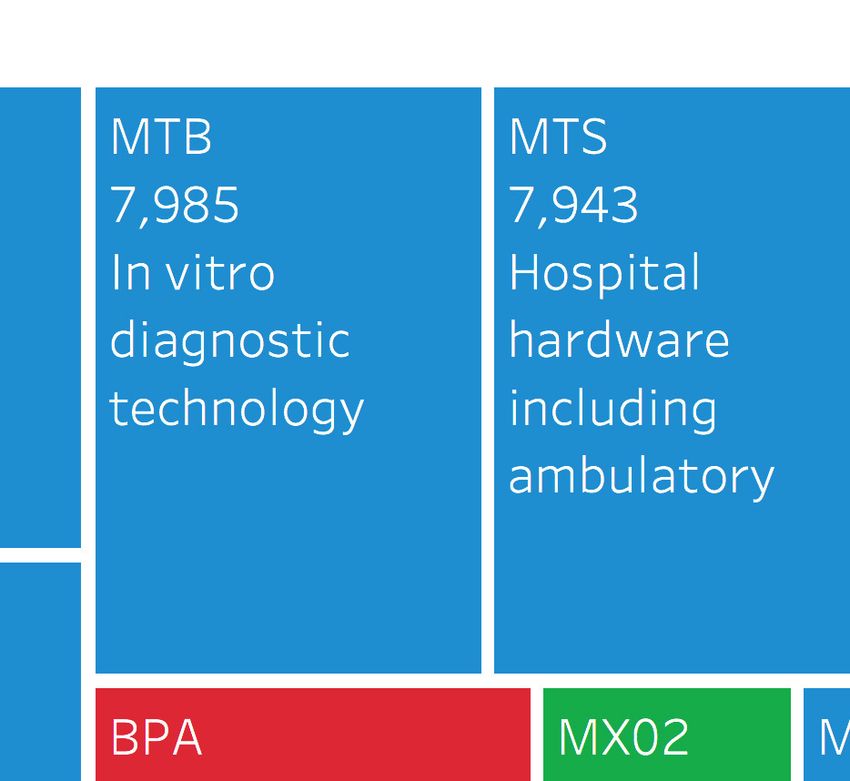
Introduction

Terminology
Industry is the term used to collectively describe all Sectors covered in the
analysis
Sector is the term used to describe Core Biopharma, Core Med Tech,
Biopharma Service & Supply or Med Tech Service & Supply
Segment is the term used to describe the individual product or service
groups within a Sector (see Annex 4 for the detail description of
segments)
“Core Biopharma” includes all businesses involved in developing and/or
producing their own pharmaceutical products – from small, R&D-focused
biotechs to multinational Big Pharma.
Biopharma Service & Supply comprises businesses that offer goods and
services to Core Biopharma businesses including for example Contract
Research and Manufacturing Organisations, suppliers of consumables and
reagents for R&D facilities.
“Core Med Tech” includes all businesses whose primary business
involves developing and producing Med Tech products (ranging from
single-use consumables to complex hospital equipment, including digital
health products).
Med Tech Service & Supply sector comprises businesses that offer
services to Core Med Tech businesses including for example Contract
Research and Manufacturing Organisations, suppliers of consumables and
reagents for R&D facilities.
Digital health includes businesses involved in making products for both
hospitals and consumers including products such as hospital information
systems and mobile medical devices and apps. It is a segment wholly
within the Med Tech Sector.
Genomics is an interdisciplinary field focusing on the study of the human
genome and the application of resulting knowledge to human health. It is
a cross-cutting categorisation across all four sectors.
Real Growth (or like-for-like) refers to analysis of the change in
employment and turnover between 2016 and 2017.
Business is used to describe the entity that is the legal owner of a group of
trading addresses or sites and legal entities. A business may consist of
more than one site or registered company. The term business is used in
this document when discussing the whole life science industry and the
four sectors. There are 107 businesses that are active in more than one
sector which means there is a small difference in the count of businesses
at the industry level (5,542) compared to the sector level (5,649). See
Annex 2 for more detail. There is no difference in the sums of employment
or turnover at the different levels of analysis.

                                                                                 7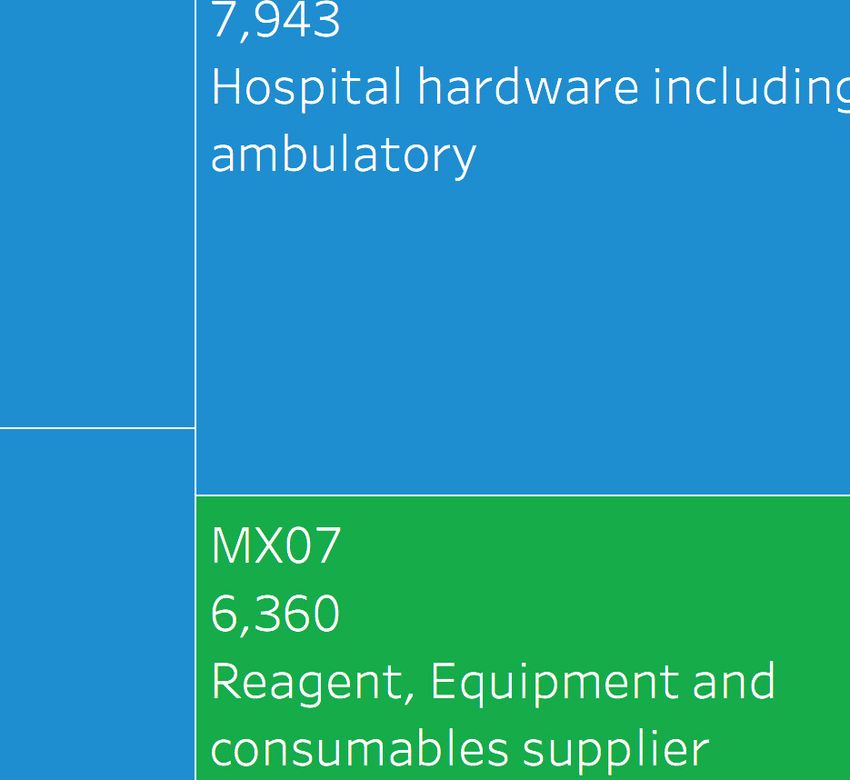
Strength and Opportunity 2017
The landscape of the medical technology and biopharmaceutical sectors in the UK

     Sites is used when referring to the data at the segment or geographical
     level. All of the data in the spreadsheets that accompany this document
     are analysed at the site level. This is the level at which all data entries
     (6,340 records) are held and analysed in the database. A single site is
     segmented and has employment and turnover assigned to it. As a
     business can have multiple sites and can operate in more than one
     segment the total counts of sites at segment level is greater than the
     count of businesses referred to at sector level.
     SME status is based on the European definition of Small and Medium-
     sized Enterprises and refers to businesses with fewer than 250 employees
     and which either have annual turnover up to and including €50m and/or
     have an annual balance sheet total up to and including €43m, and are not
     part of a Non-SME ownership group.

8
List of Figures
Figure 1 Total employment, turnover and number of businesses
in the life science industry by sector 10
Figure 2 Top 5 segments (excluding the service & supply
businesses) in the life science industry in terms of
employment, turnover and number of sites 11
Figure 3 Tree Diagram representation of the employment
per segment for the life science industry 13
Figure 4 Employment, number of sites and turnover
for the Digital Health sub-segments 14
Figure 5 Tree Diagram representation of the employment per
segment for the Biopharma sector 19
Figure 6 Tree Diagram representation of the employment per
segment for the Med Tech sector 23
Figure 7 The distribution of the industry employment by sector across
the regions of England and in Northern Ireland, Scotland
and Wales 24
Figure 8 Regional employment in the life science sector displayed as
a percentage of the total life science employment in the region 25
Figure 9 Regional employment in the life science sector and digital
health segment displayed as a percentage of the total
UK life science employment in the sector or segment 26
Figure 10 Map of the life science sector employment in the UK 27
Figure 11 Regional employment, turnover and number of sites
for the Biopharma Service & Supply sector 28
Figure 12 Map of the Biopharma sector employment in the UK 29
Figure 13 Regional employment, turnover and number of sites
for the Med Tech Service & Supply sector 31
Figure 14 Map of the Med Tech sector employment in the UK 32
Figure 15 The distribution of employment, turnover and number
of sites across the Digital Health sub-segments
(only for sub-segments that employ more than 50 people) 34
9Strength and Opportunity 2017
The landscape of the medical technology and biopharmaceutical sectors in the UK
Figure 16 The distribution of employment, turnover and number of
businesses for Digital Health across the UK 35
Figure 17 The count of records in the database at each level of
classification from site level through segment, sector
and industry 41
Figure 18 Geographical distribution of Life Science industry turnover
based on factoring of regional employment compared to the
primary allocation methodology 45
Figure 19 Distribution of sector employment between UK and Overseas
Businesses 46
Table 1 Turnover, employment and number of sites based on the SIC
codes that cover the main sectorsin the life science industry 42
Table 2 Breakdown of the employment and turnover differences
between the 2016 and 2017 datasets including the elements
that make the calculation of real or like-for-like growth 44
The data, charts and figures included in this document is published at
https://www.gov.uk/government/publications/life-science-sector-data-2017
10Chapter 1
Industry Overview
Figure 1. Total employment, turnover and number of businesses in the life science
industry by sector
24 4.4 673
979
64
33.3 1,393
17.8
97
54
14.9 2,604
Employment Turnover (£bn) Businesses
(thousands)
Total = 240,900 Total = £70.3bn Total = 5,649
Biopharma core Biopharma Service & Supply
Medical Technology core inc. digital health Medical Technology Service & Supply
1.1 The industry employs 240,900 people in the UK. Approximately 123,900
(51% of the industry total) are employed in the Med Tech sector of which
97,300 (40%) are employed in Core Med Tech businesses. Within the Med
Tech sector 10,000 are employed in digital health, and a further 24,600 (10%)
in service & supply businesses that support the sector. The Core Biopharma
sector employs 64,100 (27% of the industry) in 673 businesses supported by
a service & supply sector that employs a further 54,900 people (23% if the
industry).
1.2 The Med Tech core sector has the largest number of businesses in the
industry, with 46% of all businesses. Within this sector the digital health
segment contains the largest number of businesses and is the largest
segment by employment.
1.3 In terms of turnover from UK based activity, the Biopharma core sector has
the largest proportion (47%) of the industry’s £70.3bn annual turnover. The
sector had turnover of £48.2bn of which £33.3bn is from the 673 Biopharma
Core businesses that develop and market therapeutic products.
11Strength and Opportunity 2017
The landscape of the medical technology and biopharmaceutical sectors in the UK
1.1 Core Sectors
1.4 The segment of Biopharma businesses whose main activity is classified as
Small Molecule10 Therapeutics is the largest in terms of employment and
turnover representing 21% (49,500) and 39% (£27.3bn) respectively of the
UK industry totals. The 673 businesses in this segment include all of the
global Top 20 pharmaceutical businesses (based on turnover)11 who have
activity in the UK.
1.5 The contribution of global Top 30 Med Tech businesses12 to Core Med Tech
sector is 20% (19,500) of the total employment and 29% (£5.2bn) of the
turnover. Med Tech businesses and sites with more than 250 employees
represent an estimated 37% (36,200) of the all Core Med Tech employment
compared to 72% (46,000) for Biopharma.
Figure 2. Top 5 segments (excluding the service & supply businesses) in the life
science industry in terms of employment, turnover and number of sites
Employment Turnover Number of Companies
1st Small Molecules Small Molecules Small Molecules
2nd Digital Health Single Use Technology Digital Health
3rd Single Use Technology Therapeutic Proteins Assistive Technology
4th Orthopaedic Devices Antibodies In vitro diagnostic technology
5th Assistive Technology In vitro diagnostic technology Single Use Technology
1.6 Biopharma leads the top 5 segments by turnover with 3 of the top 5, whilst
Med Tech dominates both employment and sites with 4 out of the top 5 for
each.
●● The five segments of small molecules, single use technology, digital
health, orthopaedic devices and assistive technology contain 57% of the
employment for Core Biopharma and Med Tech businesses (86,100
people).
10 Businesses that are classified in the small molecules segments may develop and market other classes of
therapeutic products such as antibodies. Where the proportion of activity associated with other therapeutics
for an individual company is available this will distributed into the appropriate segment. If the data is not
available all activity is classified in the segment where most UK economic activity of a company is estimated
to be derived.
11 The Top 20 ranking as based on http://www.pharmexec.com/pharm-execs-top-50-companies-2017.
12 The Top 30 ranking as based on https://www.mpo-mag.com/issues/2016-07-01/view_features/top30-
medicaldevice-manufacturers.
12Industry Overview
●● The five segments of small molecules, single use technology, therapeutic
proteins, antibodies and in-vitro diagnostics contribute 70% (£34.6bn) of
the total turnover for Core Biopharma and Med Tech businesses.
1.7 An alternative view of the distribution of employment in the life science
industry is shown in the tree diagram format in Figure 3 on the following
page.
1.8 This confirms the importance of small molecule therapy businesses in terms
of employment and of the two largest segments in the Biopharma service &
supply sector: Contract Research and Manufacturing businesses, and
suppliers of Reagents and Equipment13.
1.9 Emerging and growing product segments are key contributors to
employment and turnover of the industry. In Biopharma, new therapies
based on large molecule technologies such as those used to produce
therapeutic proteins and antibodies now account for 49% of sales of the Top
100 biopharmaceutical products, up from 30% in 200814. In UK the
therapeutic proteins segment is the third largest overall in terms of turnover
in Core Biopharma and Med Tech and along with antibodies have an
estimated turnover of £3.6bn.
13 Suppliers of equipment and reagents are not exclusive suppliers to Core Biopharma and also supply the
academic sector.
14 EvaluatePharma® World Preview 2017, Outlook to 2022, June 2017.
13Figure 3. Tree Diagram representation of the employment per segment for the life science industry (Key: Red = Core Biopharma,
14
Blue = Core Med Tech, Purple = Biopharm service & supply, Green = Med Tech service & supply). Data included includes
segment code (BPE etc.) and number of employees
Strength and Opportunity 2017
The landscape of the medical technology and biopharmaceutical sectors in the UKIndustry Overview
1.10 In the Med Tech sector the emerging sector of digital health is a significant
contributor to employment with an estimated 10,000 people employed in
491 sites with activity in the segment15. The segment has the 6th largest
turnover at £1.2bn of the Core Med Tech segment.
1.11 The digital health segment includes businesses producing software to
support the management of primary and secondary healthcare systems
including electronic patient records, health analytics software businesses
that assist healthcare professionals in clinical care and mobile medical device
businesses that rely on software for key elements of their functionality.
Figure 4. The distribution of employment, turnover and number of site cross the
Digital Health sub-segments (only for sub-segments that employ more than 50
people)
4,500 500
4,000
Turnover £m or number of Sites
400
3,500
Number of Employees
3,000
300
2,500
2,000
200
1,500 152
1,000 100
76
66 62
51
500
21 18
8
0 0
s
s
ed
e
s
s
s
cs
ic
em
pp
rd
ar
em
em
yt
ni
ec
co
/a
st
al
ro
st
es
l
re
l
Te
an
sy
Te
ct
sy
ic
al
le
n
a
rv
n
ic
lE
t
io
io
da
se
ed
at
at
a
lm
ic
rm
–
th
m
ed
th
al
or
fo
a
l
he
lM
on
ea
nf
in
li
rs
h
ile
P
ita
E-
ta
G
Pe
ob
ig
pi
D
lM
os
H
na
io
ess
of
Pr
Employment Number of Sites Turnover (£m)
(LH scale) (RH scale) (RH scale)
1.12 The three largest segments in terms of both employment and turnover are
hospital information systems, E-health or data analytics and GP or primary
care information systems. Together these three sub-segments account for
72% digital health employment (7,200 people) and 66%of turnover (£780m).
15 Employment and turnover in the digital health segment is based on data for businesses that have the majority
of the economic activity in the segment. This analysis does not include the activity in large multi-market
businesses that may have a significant level of activity that is a low percentage of their overall activity.
Therefore the overall economic activity in the segment is estimated to be larger than quoted.
15Strength and Opportunity 2017
The landscape of the medical technology and biopharmaceutical sectors in the UK
1.13 The digital health segment is a relatively young industry with 27% (131) of
the businesses incorporated in the last 5 years and 54% or 260 in the last 10
years, this compares with 17% (1,099) and 29% (1,851) respectively for all
life science businesses16.
Service and Supply Sectors
1.14 Both the Core Biopharma and Med Tech businesses are supported by large
specialist UK based service & supply sectors. The Biopharma service &
supply sector employs 54,900 people in 1,393 businesses with turnover of
£14.9bn. The largest segments in the sector are Contract Manufacturing and
Research, Reagent & Equipment suppliers and Clinical Research
Organisation that together employ 38,300 people and account for 83%
(£12.4bn) of the sector turnover.
1.15 The Med Tech service & supply chain sector employs 24,600 people in 979
businesses with a turnover of £4.4bn. The largest segments in the sector are
Reagent & Equipment Suppliers, Contract Manufacturing and Research and
Specialist Consultants (excluding regulatory) that together employ 13,200
people and account for 55% (£2.4bn) of the sector turnover.
16 Data based on the 99% of life science businesses and 98% of digital health businesses for which the date of
formation is known.
16Chapter 2
Sector Overviews – Key Facts
and Trends
2.1 Biopharma sector
●● The Biopharma sector contains 2,066 businesses that generate a
turnover of £48.2bn and employ 119,000 people across the UK.
Biopharma accounts for half of industry employment (49%), over
two-thirds of turnover (68%) and 37% of businesses.
●● The core sector comprises businesses developing, manufacturing
and selling therapeutic products supported by an extensive
network of service & supply businesses. There are 673
businesses selling therapeutic products with turnover of £33.3bn
and employing 64,100 people. The 1,393 service & supply
businesses employ 54,900 people (46% of the sector) and
generate £14.9bn in turnover from UK activity.
●● Businesses developing and producing therapeutic products using
small molecule technology comprise the largest segment
employing 77% (49,500) of Core Biopharma employees and
generating 82% (£27.3bn) of the turnover. Therapeutic proteins
and Antibodies are the next largest segments.
●● Within the service & supply network the 320 businesses and their
sites that supply contract manufacturing or research services
make-up the largest by employment with 17,800 people. Reagent
and equipment suppliers generate the largest revenue at £7.4bn
and are second largest by employment with 12,500 jobs. The
third largest segment by employment is Clinical Research
Organisations generating £2.2bn turnover. Together the top 3
segments account for 70% of Biopharma service & supply
employment.
●● The sector increased employment by 2,200 between 2016 and
2017 representing 1.9% growth driven by growth in service &
supply businesses. Turnover increased 12.3% driven by strong
growth in small molecules.
●● The majority of the sector businesses are SMEs with an estimated
71% (477) of Core Biopharma and 83% (1,154) of service & supply
businesses.
17Strength and Opportunity 2017
The landscape of the medical technology and biopharmaceutical sectors in the UK
●● There are 255 UK-owned Core Biopharma sites that employ
33,700 people and account for £15.3bn of the turnover. In the
service & supply sector the 457 UK-owned sites employ 16,000
people.
●● There is economic activity in the Biopharma sector across the UK
with a concentration in the South East and East of England,
London and the North West of England. These four areas account
for 69% of the employment in the sector (82,300 people) and this
proportion rises to 82% for the Core Biopharma sector.
2.2 Biopharma – Core businesses
2.2.1 “Core Biopharma” includes all businesses whose business falls under
developing and/or producing their own pharmaceutical products – from
small, R&D-focused biotechs to multinational Big Pharma.
2.2.2 Overall the Core Biopharma sector contains 673 businesses with 832 sites
with activity employing 64,100 people and with a turnover of £33.3bn in
2017.
2.2.3 The sector breakdown shows that businesses whose main economic
activity involves small molecule therapeutics form the largest segment,
accounting for 66% (552) of businesses and sites, 77% of employees
(49,500) and 82% (£27.3bn) of turnover. This segment contains some of the
largest businesses in the industry; of the life science businesses that
employee more than 500 people, 21% are in the Small Molecule segment
(11 of 53). Antibodies, Therapeutic Proteins and Vaccines are the next largest
segments, together making up 20% (12,700) and 16% (£5.2bn) of
employment and turnover respectively.
2.2.4 Geographical analysis of employment shows Core Biopharma businesses
in all areas of the UK with the greatest concentration in the South East, East
of England, London and the North West of England which together account
for 82% (52,600) of Core Biopharma employment.
2.2.5 Analysing the size of the businesses shows that 22% of Core Biopharma
businesses are large (150 businessses). These large businesses employ
59,300 people (93% of Core Biopharma employment) and account for
£32.5bn of turnover (98% of Core Biopharma turnover). They represent 46%
of total life sciences industry turnover and 25% of employment.
18Sector Overviews – Key Facts and Trends
2.2.6 Growth based on like-for-like growth between 2016 and 2017 for all Core
Biopharma businesses17 estimates the sector grew turnover by £3.3bn or
11.5% while employment remained essentially constant. Turnover growth
was driven by a large increase in the small molecule segment for two
businesses; without these turnover slightly decreased (by 0.9%).
Between 2016 and 2017 47 new businesses or sites were formed with
another 29 closing.
2.3 Biopharma – service and supply chain
2.3.1 The Biopharma Service & Supply sector comprises businesses which
offer goods and services to Core Biopharma businesses. This includes
Contract Research and Manufacturing Organisations, suppliers of
consumables and reagents for R&D facilities, providers of specialist
analytical, IT, recruitment and logistics services as well as legal and
regulatory expertise and also finance businesses specialising in biopharma
investments (but not counting their portfolio assets).
2.3.2 Overall The Biopharma service & supply chain consists of 1,393 businesses
with 1,551 sites, 54,900 employees and generates a turnover of £14.9bn.
The activity represents 46% of the total employment in the Biopharma
sector and 31% of the turnover.
2.3.3 The sector breakdown shows the largest employing segments are Contract
Manufacturing and Research Organisations that together consist of 320 sites
employing 17,800 people. The largest segment in terms of turnover is
Reagent & Equipment suppliers which represents 50% (£7.4bn) of the total.
Clinical Research Organisations completes the Top 3 Biopharma service &
supply segments; in total the Top 3 account for 70% (38,300) of the
employment.
2.3.4 Geographical analysis of employment shows the South East and East of
England have the most service & supply businesses and employees (39%),
followed by Scotland (10%), and the North West of England (8%).
2.3.5 Analysing the size of the businesses shows that the service & supply
sector is predominated by SMEs (1,153 businesses – 83% of Biopharma
service and supply). However they represent only 24% of employment
(13,000 people) and 11% of turnover (£1.6bn) for the sector. Biopharma
service and supply SMEs constitute 20% of businesses in the life sciences
industry, and 25% of total life sciences SMEs.
2.3.6 Analysis of growth based on like-for-like growth between 2016 and 2017
estimates that the biopharma service & supply sector employment grew by
2,400 and turnover grew by £1.8bn representing increases of 4.8% and 14%
respectively. Between 2016 and 2017 30 new businesses or sites were
formed with another 40 closing.
17 Using a method to estimate “real growth” in data – see Annex 2.
19Figure 5. Tree Diagram representation of the employment per segment for the Biopharma sector (Key: Red = Core Biopharma,
20
Purple = Biopharma service & supply). Data included includes segment code (BPE etc.) and number of employees
Strength and Opportunity 2017
The landscape of the medical technology and biopharmaceutical sectors in the UKSector Overviews – Key Facts and Trends
2.4 Med Tech Sector (including digital health)
●● The Med Tech sector contains 3,583 businesses that generate a
turnover of £22.2bn and employ 121,900 people across the UK.
Med Tech accounts for half of industry employment (51%), one-
third of turnover (32%) and 63% of businesses.
●● The sector comprises businesses developing, manufacturing and
selling medical devices supported by an extensive network of
service & supply businesses. There are 2,604 businesses selling
medical devices with turnover of £17.8bn and employing 97,300
people. The 979 service & supply businesses employ 24,600
people, or 20% of the sector, and generate £4.4bn in turnover
from UK activity.
●● Businesses in the digital health segment comprise the largest
segment in terms of employment with 8% (10,000) of medical
device employees. The single use technology segment is the
largest by turnover generating 11% (£2.0bn) of all Core Med Tech
revenue.
●● The Top 5 medical device segments for employment are: digital
health, single use technology, orthopaedic devices, assistive
technology and in-vitro diagnostics. Together these segments
employ 46% (44,500) of the Core Med Tech total. The Digital
Health segment contains the largest number of businesses and
sites followed by Assistive Technology (wheelchairs and other
non-digital devices) and In-vitro Diagnostics.
●● Within the service & supply network, the 289 sites that supply
consumables and equipment make-up the largest segment
employing 6,400 and generating 33% (£1.4bn) of the turnover.
Businesses involved in contract research or manufacturing and
specialist consulting (non-regulatory) make up the next largest
segments by employment.
●● The sector increased employment by an estimated 3,500 between
2016 and 2017 representing 2.9% growth driven by growth in Core
Med Tech businesses. Turnover for the sector increased by 3.7%
with growth across most segments.
●● The majority of the sector businesses are SMEs with an estimated
83% (2,172) of Core Med Tech and 85% (832) of service & supply
businesses.
●● There are 965 UK owned core Med Tech sites that employ 37,500
and 346 UK-owned sites in the service and supply sector
employing 11,300.
●● The Southeast of England contains the largest number of sector
employees (26,100) but employment is widely distributed with
79% located in the rest of the UK. Core Med Tech employment is
concentrated in South East while service and supply employment
is more widely distributed across the UK.
21Strength and Opportunity 2017
The landscape of the medical technology and biopharmaceutical sectors in the UK
2.5 Med Tech – Core businesses
2.5.1 “Core” Med Tech includes all businesses whose primary business falls
under developing and producing their own Med Tech products (ranging from
single-use consumables to complex hospital equipment and including digital
health products).
2.5.2 Overall the Core Med Tech sector contains 2,604 businesses employing
97,300 people with a turnover of £17.8bn.
2.5.3 The sector break down shows the largest segment by turnover is Single
Use Technology (i.e. disposables) followed by In Vitro Diagnostics,
Orthopaedics, Wound Care and Assistive Technology. These top five
segments account for 43% (£7.6bn) of the Core Med Tech turnover. Digital
Heath technology is the largest segment by employment followed by Single
Use technology, Orthopaedics, Assistive Technology and In-Vitro Diagnostics.
These top five account for 46% (44,500) of sector employment.
2.5.4 Geographical analysis of employment shows there are sites spread
across the UK with a concentration in the South East England and the
Midlands representing 24% (22,900) and 16% (17,900) respectively of the
total Core Med Tech employment followed by Yorkshire and the Humber at
12% (12,000).
2.5.5 Analysis of the size of businesses shows that of the 2,604 businesses in
Core Med Tech, 83% (2,172) are SMEs. They represent 31% (30,000) of
Core Med Tech employment and 21% (£3.7bn) of Core Med Tech turnover.
Core Med Tech SMEs account for nearly half (47%) of the total number of
life sciences SMEs.
2.5.6 Analysis of growth based on like-for-like growth between 2016 and 2017
estimates that the Core Med Tech sector grew employment by 4,100 and
turnover by £0.7bn representing increases of 4.4% and 3.9% respectively.
Between 2016 and 2017 34 new businesses or sites were formed with
another 85 closing.
2.6 Med Tech – service and supply chain
2.6.1 The Med Tech Service & Supply sector comprises businesses which offer
services to Core Med Tech businesses. This includes Contract Research and
Manufacturing Organisations, suppliers of consumables and reagents,
providers of specialist analytical, IT, recruitment and logistics services as well
as legal and regulatory expertise and finance businesses specialising in med
tech investments (but not counting their portfolio assets).
2.6.2 Overall the sector contains 979 businesses that employ 24,600 and
generates a turnover of £4.4 bn.
2.6.3 The sector break down shows the largest segment of the sector is
Reagent, Equipment and Consumables suppliers which contains the highest
22Sector Overviews – Key Facts and Trends
number of sites (289) and employs 26% (6,400) of the sector’s total and
33% (£1.4bn) of its turnover. The next largest segments by employment are
Contract Manufacturing and Research followed by Specialist Consultants.
2.6.4 Geographical analysis shows, in contrast to Core Med Tech, the top 3
areas are the North West and East of England and the East Midlands. These
three areas account for 47% (11,400) of the employment and 43% (£1.9bn)
of the sector turnover.
2.6.5 Analysis of the size of businesses shows that 85% (832) of businesses are
SMEs, employing 8,500 people (35% of Med Tech Service & Supply) and
accounting for £1.2bn (28%) of turnover.
2.6.6 Analysis of growth based on like-for-like growth between 2016 and 2017
estimates that the Med Tech service and supply sector reduced employment
by 600 a decrease of 2.3% while turnover by £0.1bn representing an
increase of 3.1% led by growth in the reagent, equipment and consumables
segment. Between 2016 and 2017 10 new businesses or sites were formed
with another 34 closing.
23Figure 6. Tree Diagram representation of the employment per segment for the Med Tech sector (Key: Blue = Core Med Tech,
24
Green = Med Tech service & supply). Data included includes segment code (MTN etc.) and number of employees
Strength and Opportunity 2017
The landscape of the medical technology and biopharmaceutical sectors in the UKChapter 3
Geographical Analysis
3.0.1 Postcodes attached to records in the database allow geographical analysis of
employment and turnover at site level. Where available, we have validated
employment data for the large businesses by looking at information such as
annual reports or websites to identify the number and types of employment.
3.6.1 The primary allocation of turnover to location is based on the legal entity
information sourced from third party databases, validated for large
businesses from annual accounts. This method of turnover reporting is used
throughout the document.
3.6.2 An alternative geographical allocation of turnover is shown in Annex 2 by
factoring the employment at a location by the average turnover/employment
ratio for the individual segment for that site or company.
Figure 7. The distribution of the industry employment by sector across the
regions of England and in Northern Ireland, Scotland and Wales, ordered by total
employment
25,000
20,000
Employment
15,000
10,000
5,000
0
st
d
t
on
r
s
ds
nd
es
t
st
nd
es
be
es
d
an
Ea
Ea
an
n
al
nd
la
la
W
W
um
gl
la
W
ot
Ire
l
h
th
Lo
id
id
En
th
h
Sc
ut
H
M
tM
or
ut
n
or
So
of
er
e
N
So
st
N
Th
es
th
st
Ea
or
W
Ea
d
an
N
re
hi
rks
Yo
Biopharma Biopharma Medical Medical
core Service & Supply Technology Technology
core Service & Supply
25Strength and Opportunity 2017
The landscape of the medical technology and biopharmaceutical sectors in the UK
3.6.3 The South East of England contains the largest population of life science
industry jobs and the largest number of Core Biopharma and Med Tech jobs.
This region combined with the East of England contains 39% (94,300) of all
the life science industry employees. The North West of England is the 3rd
largest region in terms of employment with the largest regional employment
in the Core Biopharma and Med Tech sectors.
3.6.4 Figure 8 demonstrates which sectors are prominent in a region by showing
sector employment as a percentage as total regional life sciences
employment. For example the Core Med Tech sector has the highest
proportion of life science jobs in the West Midland and East Midlands
regions, whereas in the London, the Core Biopharma sector has the largest
proportion of life science employment.
Figure 8. Regional employment in the life science sector displayed as a percentage
of the total life science employment in the region
100%
90%
80%
70%
Employment
60%
50%
40%
30%
20%
10%
0%
st
nd
t
on
r
s
s
nd
es
t
st
nd
es
be
es
nd
nd
Ea
Ea
al
la
nd
tla
la
W
W
um
la
la
W
ng
Ire
o
th
th
Lo
id
id
th
h
Sc
H
fE
u
M
tM
or
ut
n
or
So
er
e
N
So
to
st
N
Th
es
th
Ea
s
or
W
Ea
d
an
N
re
hi
rks
Yo
Biopharma Biopharma Medical Medical
core Service & Supply Technology Technology
core Service & Supply
3.6.5 Figure 9 demonstrates which regions are most dominant for each sector by
showing a region’s employment for a sector as a percentage of total sector
employment.
26Geographical Analysis
Figure 9. Regional employment in the life science sector and digital health segment
displayed as a percentage of the total UK life science employment in the sector or
segment
110%
Percentage of total UK sector employment
100%
90%
80%
70%
60%
50%
40%
30%
20%
10%
0%
st
d
t
on
r
s
s
nd
es
t
st
nd
es
be
es
nd
nd
an
Ea
Ea
al
nd
la
la
W
W
um
gl
la
la
W
ot
Ire
h
th
Lo
id
id
En
th
h
Sc
ut
H
M
tM
or
ut
n
or
So
of
er
e
N
So
st
N
Th
es
th
st
Ea
or
W
Ea
d
an
N
re
hi
rks
Yo
Biopharma core Biopharma Medical Digital Medical
Service & Supply Technology Health Technology
core Service & Supply
●● Core Biopharma employment is concentrated in the South East, East,
North West of England and London.
●● Core Med Tech employment is concentrated in South East of England,
West Midlands and Yorkshire and the Humber.
●● Biopharma Service & Supply is concentrated in the South East and East
of England and Scotland.
●● Med Tech Service & Supply is concentrated in the North West, East of
England and the East Midlands.
●● Digital Health segment is concentrated in London, the South East of
England and Yorkshire & the Humber.
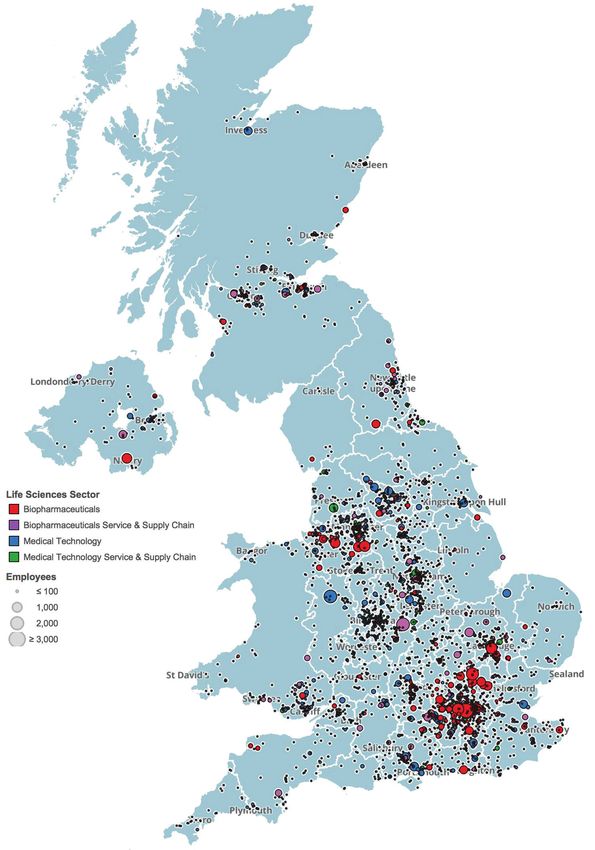
3.6.6 Figure 10 represents the employment information for the life science sector in a
map format with concentrations of employment highlighted. The representation
shows the clustering of the employment around major cities in England, Northern
Ireland, Scotland and Wales in common with a number of industries.
3.6.7 The map also highlights the more dispersed geography of the Core Med Tech
sector compared to the Core Biopharma sector, with the latter showing
concentrations in the London-Stevenage-Cambridge corridor and in the North
West. The service & supply sectors of the industry are also more widely
distributed across the UK, although the Biopharma service & supply chain has
significant concentrations in the South East and East of England and in Scotland.
27Strength and Opportunity 2017 The landscape of the medical technology and biopharmaceutical sectors in the UK Figure 10. Map of the life science sector employment in the UK 28
Geographical Analysis
3.1 Biopharma Geographical analysis
3.1.1 The Core Biopharma sector has a concentration of economic activity in four
regions of England. Of the 832 sites in the sector, 635 are located in the
South East, East, North West of England and London. Together these four
regions contain 82% of all employment and account for 92% of the turnover
in the sector. For all regions, the distribution of the turnover follows that of
employment.
3.1.2 The Biopharma service & supply sector is more distributed across the UK
with the top 4 largest regions by employment employing 57% of the total for
the sector. For the majority of the regions, the Contract Manufacturing and
Research segment is the largest contributor to employment, the exceptions
are: the South East of England where Clinical Research Organisations make
up the largest proportion; the South West where Analytical Services is the
largest; and the Midlands where Reagent and Equipment suppliers make up
the largest employment. The large turnover in the West Midlands is
concentrated in the Reagents and Equipment segment.
Figure 11. Regional employment, turnover and number of sites for the Biopharma
Service & Supply sector
14,000 4,500
4,000
12,000 325
Turnover £m or Number of Sites
3,500
10,000
255 3,000
Employees
8000 2,500
6000 169 2,000
1,500
177
4000 109 60 179
1,000
31
2000 47 61 57 79
500
0 0
st
nd
nd
t
ds
s
on
nd
t
st
es
r
es
es
be
nd
Ea
Ea
n
al
a
la
nd
la
W
W
um
gl
la
la
W
ot
Ire
h
th
Lo
id
id
En
th
h
Sc
ut
H
M
or
M
ut
rn
or
So
of
e
N
So
e
st
t
N
Th
es
th
st
Ea
or
W
Ea
d
an
N
ire
sh
rk
Yo
Number of Employees Number of Sites Turnover (£m)
(LH scale) (RH scale) (RH scale)
29Strength and Opportunity 2017 The landscape of the medical technology and biopharmaceutical sectors in the UK Figure 12. Map of the Biopharma sector employment in the UK 30
Geographical Analysis

3.1.3   The map of Biopharma sector employment shows more detail on the
        location of employment within the regions, highlighting the focus of Core
        Biopharma employment along the Oxford-London-Cambridge, Manchester-
        Liverpool and Edinburgh-Glasgow corridors. The Service & Supply chain
        sector is distributed more widely outside of these corridors;this would be
        expected for segments such as Reagents and Equipment where access to
        nationwide distribution routes is important.

3.1.4   An analysis of the composition of Biopharma sites by region shows that the
        South East and East of England contains 47% of UK sites with over 250
        employees and 50% of all UK sites with 100-249 employees.

3.1.5   Analysis of the number of businesses that were formed in the last 10 years
        by region shows that between them the South East of England, East of
        England and London contain 54% of businesses that were formed between
        2008 and 2017 inclusive. The North West and Scotland are the only regions
        that have more than 10% each of businesses formed over the same period.

3.2     Med Tech Geographical Analysis
3.2.1   The Core Med Tech sector has a concentration of economic activity in three
        regions of England. Of the 2,932 sites in the sector 1,480 (51%) are located
        in the South East, Yokshire and The Humber and the Midlands (East and
        West). Together these three regions contain 54% of all employment in the
        sector.

3.2.2   Analysis of the Med Tech Service & Supply sector distribution of
        employment shows a much more even geographical distribution with the
        North West and East of England followed by East Midlands, South East and
        London as having the highest concentration. For the majority of the regions
        the Reagent and Equipment suppliers make up the largest group of
        employers. All regions have high proportions of employment in contract
        manufacturing and research businesses with the East of England having the
        highest number of employees in this segment.

                                                                                        31
Strength and Opportunity 2017
The landscape of the medical technology and biopharmaceutical sectors in the UK
Figure 13. Regional employment, turnover and number of sites for the Med Tech
Service & Supply sector
5,000 1,000
4,500 900
Number of Sites or Turnover £m
4,000 800
Number of Employees
3,500 107
168
700
155
3,000 600
2,500 500
2,000 400
1,500 123 300
1,000 20 200
500 99 95
100
79 71 56 11
40
0 0
t
d
s
st
on
nd
s
r
t
es
st
nd
es
be
es
nd
nd
an
Ea
Ea
al
nd
la
la
W
W
um
gl
la
la
W
ot
Ire
h
th
Lo
id
id
En
th
h
Sc
ut
H
M
tM
or
ut
n
or
So
of
er
e
N
So
st
N
Th
es
th
st
Ea
or
W
Ea
d
an
N
re
hi
ks
r
Yo
Employment Number of Sites Turnover (£m)
(LH scale) (RH scale) (RH scale)
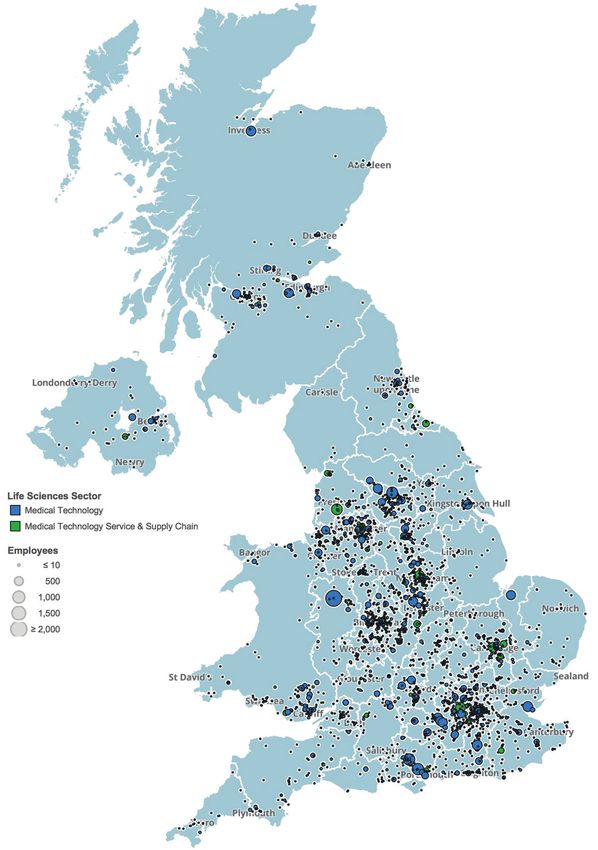
3.2.3 The map of Med Tech sector employment (Figure 14 on the following page)
shows more detail on the location of employment within the regions,
highlighting the economic clusters in the Liverpool-Manchester-Leeds
corridor and south to Sheffield-Nottingham and west to Birmingham. Other
significant clusters are present around London and in the Edinburgh-Glasgow
corridor.
3.2.4 An analysis of the composition of Med Tech businesses by region shows
that the four regions of South East and East England, the Midlands and
Yorkshire and The Humber contain 55% of all UK sites with more than 250
employees.
3.2.5 Analysis of the number of businesses that were formed in the last 10 years
by region shows that the South East of England followed by the Midlands
have the highest numbers of businesses formed since 2008. Together these
regions account for 41% of all businesses formed over this period.
32Geographical Analysis
Figure 14. Map of the Med Tech sector employment in the UK
33Chapter 4
Digital Health and Genomics
In this section we look at the digital health and genomics economic activity based on
the information in the database. The digital health sector in this analysis covers
businesses that that develop and market software and/or devices that rely on
software for their key functionality (digital health data is included in the sections on
med tech). These products are used in hospitals and GP surgeries, in the home to
manage health or deliver services and in areas such as drug development (e.g.
clinical trials or data analysis).
The genomics segment is a cross industry segment and has been analysed by
adding an additional coding to a company independent of the primary sector and
segment coding. For example a company can be coded in the Med Tech Service &
Supply sector under the reagent and equipment segment and have an additional
genomics coding under Sequencing Instruments.
4.1 Digital health
4.1.1 The digital health segment18 is the largest segment in the Med Tech sector
based on employment and the 4th largest in the UK life sciences sector with
strong growth potential. The global market for digital health was estimated
to be worth £70bn in 2016 and is expected to almost double to £150bn by
2020 with mobile health applications and devices forecast to show the
fastest growth.19
4.1.2 The digital health segment is composed of 491 sites, which is the 4th
highest number of sites in the life science industry. The segment employs
10,000 people and has a total turnover of £1.2bn, one of only 13 segments in
the life science industry with a turnover over £1bn and the 6th largest in the
Core Med Tech sector.
4.1.3 The estimated turnover and employment includes only businesses where a
significant proportion (over 20%) of their economic activity is in Digital
Health. This approach does not include all the economic activity associated
with, for example, large diversified businesses where digital health is not
their main activity.
4.1.4 Analysis of growth based on the data for real growth between 2016 and
2017 digital health businesses had the largest increase in employment,
adding an estimated net 1,100 jobs and a strong 11% increase in turnover.
18 See Annex 3 for a description of sub-segments used to further analyse this segment.
19 Data from American Marketing Association presentation.
34Digital Health and Genomics
4.1.5 Of the businesses where the formation date is known and an estimated
54% (260) of digital health businesses were formed in the last 10 years and
27% (131) over the last 5 years.
4.1.6 Analysis of the breakdown of the sector shows that within Digital Health,
Hospital Information Systems accounts for the most sites, turnover and
employees representing 38% of all employment (3,800 people). The E-health
analytics and GP information system are the next largest segments
employing an estimated 3,300 people combined. The E- health analytics
sub-segment has the second highest turnover and number of sites in the
segment.
4.1.7 Analysis of the size of businesses shows that 83% (387) of digital health
businesses are SMEs and employ 34% of digital health jobs (3,451 people),
contributing £0.3bn in turnover (26%) of the digital health activities in the
industry. The hospital information sub-segment has the largest number of
SMEs (109) in digital health.
Figure 15. The distribution of employment, turnover and number of site cross the
Digital Health sub-segments (only for sub-segments that employ more than 50
people)
4,500 500
4,000
Turnover £m or Number of Sites
400
3,500
Number of Employees
3,000
300
2,500
2,000
200
1,500 152
1,000 100
76 62
66
500 51
21 18
8
0 0
s
s
ed
re
ps
s
s
cs
ic
em
rd
em
ca
ap
em
yt
ni
co
le
st
al
tro
/
st
es
re
l
Te
an
sy
Te
sy
ec
ic
al
n
ta
rv
n
ic
El
io
io
da
se
ed
at
al
at
lm
ic
rm
–
th
m
ed
th
al
or
fo
a
al
he
lM
on
nf
in
he
li
rs
ile
P
ita
E-
ta
G
Pe
ob
ig
pi
D
lM
os
H
a
on
si
es
of
Pr
Employment Number of Sites Turnover (£m)
(LH scale) (RH scale) (RH scale)
35You can also read