COLLECTING THE TAX DEFICIT OF MULTINATIONAL COMPANIES: SIMULATIONS FOR THE EUROPEAN UNION
←
→
Page content transcription
If your browser does not render page correctly, please read the page content below

R E P O RT

COLLECTING THE TAX DEFICIT OF
 MULTINATIONAL COMPANIES:
 SIMULATIONS FOR THE
 EUROPEAN UNION
 Mona Barake, Theresa Neef,
 Paul-Emmanuel Chouc,
 Gabriel Zucman

 June 2021
Executive Summary

This study estimates how much tax revenue the European Union could collect by
imposing a minimum tax on the profits of multinational companies. We compute the
tax deficit of multinational firms, defined as the difference between what
multinationals currently pay in taxes, and what they would pay if they were subject to
a minimum tax rate in each country. We then consider three ways for EU countries to
collect this tax deficit.

First, we simulate an international agreement on a minimum tax of the type currently
discussed by the OECD, favored by a number of European Union countries, and by the
United States. In this scenario, each EU country would collect the tax deficit of its own
multinationals. For instance, if the internationally agreed minimum tax rate is 25% and
a German company has an effective tax rate of 10% on the profits it records in
Singapore, then Germany would impose an additional tax of 15% on these profits to
arrive at an effective rate of 25%. More generally, Germany would collect extra taxes
so that its multinationals pay at least 25% in taxes on the profits they book in each
country. Other nations would proceed similarly. We find that such a 25% minimum tax
would increase corporate income tax revenues in the European Union by about €170
billion in 2021. This sum represents more than 50% of the amount of corporate tax
revenue currently collected in the European Union and 12% of total EU health spending.
The revenue potential of a coordinated minimum tax is thus large. However, revenues
significantly depend on the commonly agreed minimum tax rate. With a 21% minimum
rate, the European Union would collect about €100 billion in 2021. Moving from 21%
to 15% would reduce revenues by a factor of two.

Second, we simulate an incomplete international agreement in which only EU
countries apply a minimum tax, while non-EU countries do not change their tax
policies. In this scenario, each EU country would collect the tax deficit of its own
multinationals (as in our first scenario), plus a portion of the tax deficit of

 1
multinationals incorporated outside of the European Union, based on the destination
of sales. For instance, if a British company makes 20% of its sales in Germany, then
Germany would collect 20% of the tax deficit of this company. We find that that in such
a scenario, using a rate of 25% to compute the tax deficit of each multinational, the
European Union would increase its corporate tax revenues by about €200 billion. Out
of this total, €170 billion would come from collecting the tax deficit of EU
multinationals; an additional €30 billion would come from collecting a portion of the
tax deficit of non-EU multinationals. For the European Union, there is thus a much
higher revenue potential from increasing taxes on EU companies than from taxing non-
EU companies. To improve the fairness of its tax system and generate new
government revenues (e.g., to pay for the cost of Covid-19), it is essential that the
European Union polices its own multinationals.

Last, we estimate how much revenue each EU country could collect unilaterally,
assuming all other countries keep their current tax policy unchanged. This
corresponds to a “first-mover” scenario, in which one country alone decides to collect
the tax deficit of multinational companies. This first mover would collect the full tax
deficit of its own multinationals, plus a portion (proportional to the destination of
sales) of the tax deficit of all foreign multinationals, based on a reference rate of 25%.
We find that a first mover in the European Union would increase its corporate tax
revenues by close to 70% relative to its current corporate tax collection. Although
international coordination is always preferable, a unilateral move of a single EU
member state (or a group of member states) would encourage other EU countries to
also collect the tax deficit of multinationals—as not doing so would mean leaving tax
revenues on the table for the first movers to grab. This could pave the way for an
ambitious agreement on a high minimum tax, within the European Union and then
globally. This analysis shows that unilateral action can play a transformative role and
that refusing international coordination is not a sustainable solution, since other
countries can always choose to collect the taxes that tax havens choose not to collect.

Our estimates are based on a transparent methodology that combines newly available
macroeconomic data on the location and effective tax rates of multinational profits.
We illustrate and validate our approach by applying it to firm-level data publicly
disclosed by all European banks and 16 large non-bank multinationals. We find that

 2
European banks would have to pay 44% more in taxes if they were subject to a 25%
country-by-country minimum tax. This estimate is in line with our finding that EU
multinationals as a whole (all sectors combined) would have to pay around 50% more
in taxes, thus suggesting that this number is indeed the correct order of magnitude.
Companies such as Shell, Iberdrola, and Allianz—who voluntarily disclose their
country-by-country profits and taxes—would also have to pay 35%-50% more in taxes
if they were subject to a 25% minimum tax.

This report is supplemented by a pioneering interactive website, https://tax-deficit-
simulator.herokuapp.com. This new tool allows policy makers, journalists, members
of civil society, and all citizens in each EU country to assess the revenue potential from
minimum taxation on both domestic and foreign firms. Users can select various
scenarios (e.g., international coordination or unilateral action), and a full range of
minimum tax rates from 10% to 50%. All the data and computer code are available
online, making our estimates fully reproducible. We plan to regularly update our
findings, as improved and more comprehensive macroeconomic data sources
become available, refined estimation techniques are designed, and more companies
publicly disclose their country-by-country reports.

 3
1 Introduction

Globalization has opened new ways for corporations to reduce their tax bills. As
countries compete to attract investments by reducing corporate taxes, firms can move
activity to low-tax places. Moreover, multinational companies can book earnings in
places where they employ few workers and own little capital, by shifting paper profits
to tax havens. International capital mobility and profit shifting have led to a large
decline in the taxes effectively paid by multinationals globally. This evolution—which
allows some of the biggest winners of globalization to pay less and less in tax—is
unlikely to be sustainable, neither politically nor economically.

While there is a view that tax competition and tax avoidance are laws of nature, the
reality is different. Nothing inherent in globalization prevents governments from taxing
corporate profits at high rates if they so wish. Instead of competition, governments
can choose coordination. Instead of letting companies book earnings in tax havens,
governments can choose to tax offshore profits. These ideas have gained momentum
in recent years. Since 2019 and under the auspices of the Organization for Economic
Cooperation and Development (OECD), many countries have been considering an
agreement on a minimum corporate tax rate for multinational profits. In the Spring of
2021, the U.S. government announced that it was favorable to a high global minimum
tax.

In this report, we estimate how much tax revenue the European Union could collect by
imposing a minimum tax on the profits of multinational companies. We find that the
revenue potential from minimum taxation is large. With a minimum tax at a rate of 25%
applied to the profits of EU multinationals, the European Union would increase its
current corporate tax revenues by about 50 percent in 2021—from the €340 billion
projected to be collected in 2021 under current law to about €510 billion (i.e., an
increase of €170 billion). This would represent an increase in tax revenue of about
1.2% of GDP, bringing total EU corporate tax receipts from 2.4% of the European
Union’s GDP to 3.6%. To generate new revenues in a fair and sustainable manner, a
25% minimum tax is thus a powerful—yet realistic—instrument.

 4
Our estimates are based on a transparent methodology that combines newly available
macroeconomic data on the location and effective tax rates of multinational profits.
Until recently, it was difficult to score the revenues from a minimum tax due to the lack
of publicly available information on the profits booked by corporations in tax havens.
This has started to change in recent years with the publication of two new
macroeconomic datasets: foreign affiliates statistics (published by Eurostat in the
European Union),1 and tabulations of the country-by-country reports of multinational
firms (published by the OECD).2 These new data allow us to better know the location
of multinational profits (in particular, how much are booked in tax havens globally) and
to estimate the effective tax rates to which these profits are subject. We illustrate and
validate our methodology by applying it to a new dataset of firm-level data we
assembled covering all the public country-by-country reports of European
multinationals (all large European banks, two smaller ones, plus 16 non-bank
multinationals).

The starting point of our analysis is the notion of “tax deficit.” The tax deficit is the
difference between what a company currently pays in taxes and what it would have to
pay if it was subject to a minimum tax rate in each country where it operates. As the
definition makes clear, the tax deficit depends on a reference minimum tax rate. In our
main results, we consider a reference minimum tax rate of 25%, a relatively modest tax
rate in an international and especially historical perspective. 3 From there, we compute
the revenues of a minimum tax in three scenarios: a full coordination scenario, an
imperfect coordination scenario, and a unilateral scenario.

In the full coordination scenario, each country would collect the tax deficit of its own
multinationals. For instance, if a German multinational company has an effective tax
rate of 10% on the profits it records in Singapore, then Germany would impose an
additional tax of 15% on these profits to arrive at an effective rate of 25%. More
generally, Germany would collect extra taxes so that its multinationals pay at least 25%
in taxes on the profits they book in each country. Other nations would proceed
similarly. We find that such a 25% minimum tax would increase corporate income tax

1 See Tørsløv et al. (2018) for an analysis of these data.
2 See OECD (2020) for simulations of a minimum tax using these country-by-country tabulations.
3 Between 1985 and 2020, the global average statutory corporate tax rate fell from 49 percent to 23 percent.

 5
revenues in the European Union by about €170 billion in 2021, an increase of about
50% relative to current tax collections.

In the imperfect coordination scenario, only EU countries apply a 25% minimum tax,
while non-EU countries do not change their tax policies. In this scenario, each EU
country would collect the tax deficit of its own multinationals (as in our first scenario),
plus a portion of the tax deficit of multinationals incorporated outside of the European
Union, based on the destination of sales. For instance, if a British company makes 20%
of its sales in Germany, then Germany would collect 20% of the tax deficit of this
company (in addition to collecting the full tax deficit of German multinationals). In this
scenario, the European Union would increase its corporate tax revenues by about €200
billion per year. Out of this total, €170 billion would come from collecting the tax deficit
of EU multinationals; an additional €30 billion would come from collecting a portion of
the tax deficit of non-EU multinationals.

Last, in the unilateral scenario, a single country acts as a “first mover” and decides to
collect the tax deficit of multinational companies. Specifically, this first mover would
collect the full tax deficit of its own multinationals, plus a portion (based on the
destination of sales) of the tax deficit of all foreign multinationals—always using a 25%
minimum tax rate as a reference for the computation of each firm’s tax deficit. We find
that a first mover in the European Union would increase its corporate tax revenues by
close to 70% relative to its current corporate tax collection.

For each scenario we also simulate how revenues would change if the reference
minimum tax rate was lower or higher than 25%. A scenario of full international
coordination on a low minimum rate of 15% would generate only €50 billion in the
European Union, around a quarter of what could be achieve with a 25% minimum tax
rate.

We illustrate and validate our methodology based on macroeconomic data by applying
it to microeconomic data, namely the country-by-country reports disclosed by all large
European banks and 16 large non-bank multinationals. We find that European banks
would have to pay 44% more in taxes if they were subject to a 25% country-by-country
minimum tax. This estimate is in line with our finding that EU multinationals as a whole

 6
(all sectors combined) would have to pay around 50% more in taxes, thus suggesting
that this number is indeed the correct order of magnitude. Companies such as Shell,
Iberdrola, and Allianz—who voluntarily disclose their country-by-country profits and
taxes—would also have to pay 35%-50% more in taxes if they were subject to a 25%
minimum tax.

Beyond these quantitative findings, our analysis reveals a number of important
insights. First, for the European Union as a whole, there is a much higher revenue
potential from increasing taxes on EU companies than from taxing non-EU companies.
If it wants to generate significant resources, for instance to pay for the cost of the
Covid-19 pandemic, it is thus essential that the European Union polices its own
multinationals.

To be sure, the European Union could collect additional tax revenues from American
(and more broadly extra-European) multinationals, a number of which have a large tax
deficit. But because non-EU multinationals generally make the majority of their sales
outside of the European Union, the revenue potential of collecting a fraction (based on
sales) of their tax deficit, although significant, is lower than the revenue potential of
collecting 100% of the tax deficit of EU multinationals. Moreover, if other countries
started to police their own multinationals (for instance, if the United States applied a
high minimum tax to its multinationals), then the tax deficit of non-EU companies
would fall, further reducing what could be collected by the European Union.

Second, our analysis illustrates that although international coordination is always
preferable, a unilateral move of a single EU member state (or a group of member
states) could play a transformative role. A first mover willing to apply a high minimum
tax would de facto collect some of the revenue that other countries (including other
EU member states) choose not to collect. This would encourage other EU countries to
start increasing the tax rate applied to their own multinationals, as not doing so would
mean leaving tax revenues on the table for the first movers to grab. Thus, unilateral
adoption by an EU member state (or a group of states) of an ambitious minimum tax
(say of 25% or more) could pave the way for a race to the top with corporate taxation,
eventually leading to an agreement on a high minimum tax, within the European Union
and then globally.

 7
Third, our analysis suggests that refusing international coordination is not a
sustainable position. According to a widely held view, a high global minimum tax is
utopian, because a single country can always block such an agreement. This view,
however, is incorrect. To be sure, a number of tax havens derive large benefits from
offering low tax rates—by attracting activity and a large amount of paper profits—and
thus have incentives to refuse joining a global agreement. But this does not stand in
the way of an effective international agreement, because other countries can always
choose to collect the taxes that tax havens choose not to collect. For example, the
United States, Germany, or France can always decide to tax the profits recorded by
their multinationals in Ireland at a minimum rate of 25%, thus making the Irish tax rate
of 12.5% irrelevant (in the same way as the United States, Germany, or France tax
individuals on their worldwide income, including income subject to no or low taxes
abroad). This shows that offering low corporate tax rates is a fundamentally unstable
development strategy, one that only works as long as other countries chose to accept
tax competition—and stops to work as soon as they refuse it.

Our study adds to a body of work that estimates the revenue potential of various
international corporate tax reforms. Our work is most closely related to Clausing et al.
(2021) who estimate the tax deficit of U.S. multinationals and how much additional
revenue could be collected by the United States with a 21% minimum tax (see also
Saez and Zucman, 2019, chapter 6). Our study is also closely related to the impact
assessment of the OECD (2020) and of the work of Devereux et al. (2020), among other
recent estimates of the revenue potential of minimum taxation.

Relative to this body of work, we make a number of contributions. First, at the
microeconomic level, we analyze the public country-by-country reports of European
firms (banks and non-bank) using a new dataset that we hand-collected. This allows
us to compute the tax deficit of each of these firms, thus illustrating and validating our
estimation of the tax deficit of EU multinationals as a whole. Second, at the
macroeconomic level, we consider a broader range of rates and scenarios than in
earlier work. Crucially, we consider imperfect coordination scenarios in which the
European Union (or individual EU member states) would collect a portion of the tax

 8
deficit of foreign multinationals, based on apportioning the tax deficit of these foreign
firms proportionally to where sales are made.

This report is accompanied by an interactive simulation website, https://tax-deficit-
simulator.herokuapp.com. This new tool allows policy makers, journalists, members
of civil society, and all citizens in each EU country to assess the revenue potential from
minimum taxation on both domestic and foreign firms. Users can select various
scenarios (e.g., international coordination or unilateral action), and a full range of
minimum tax rates from 10% to 50%. All the data and computer code are available
online, making our estimates fully reproducible.

We plan to regularly update our findings, as improved and more comprehensive
macroeconomic data sources become available, refined estimation techniques are
designed, and more companies publicly disclose their country-by-country reports. Our
estimates should be seen as preliminary and subject to revision. We thank readers in
advance for their comments and suggestions.

2 Collecting Corporate Tax Deficits: Principles

2.1 Tax Deficit

A key notion used in this work is the notion of tax deficit. The tax deficit is the
difference between what a company currently pays in taxes and what it would have to
pay if it was subject to a minimum tax rate in each country where it operates. A number
of remarks are in order about this definition.

First, the computation of the tax deficit requires us to choose a reference minimum
tax rate. In this study, the benchmark minimum rate we consider is 25%—a relatively
modest rate in an international and historical perspective. On our interactive website,
users can select minimum tax rates ranging from 10% to 50% and assess how different
rates would affect revenues for each EU member state. For a country individually, a
natural minimum rate to consider is the statutory corporate tax rate. Other relevant
rates include 21%—the minimum tax rate that President Biden, during his campaign,

 9
proposed to apply to US multinationals—and 15%—the rate that the U.S. administration
in May 2021 viewed as a floor for an international agreement.

The tax deficit captures all the ways in which a firm is able to avoid taxes. To the extent
that a multinational company sees its profits taxed at an effective rate of less than
25% in at least one of the countries where it operates, then this company has a tax
deficit. This is the case no matter the reason why the effective rate is less than 25%—
whether this is because the country has a low statutory rate, because the firm benefits
from tax exemptions (e.g., operates in a tax-free zone), because of tax evasion, etc.
From that perspective, the tax deficit is the broadest possible measure of tax
avoidance.

Tax authorities in each EU country can compute the tax deficit of virtually all the world’s
multinationals. As a result of the Base Erosion and Profit Shifting process launched by
the OECD in 2015, multinational companies must produce country-by-country reports,
which disaggregate their global turnover, profits, taxes, and a number of other
indicators on a country basis. These reports are generally not public, but they are
transmitted to tax authorities. Moreover, there is an international exchange of country-
by-country reports between tax authorities, meaning that the report of a company like
Apple is available to the German tax authority (and vice versa, the report of a company
like Volkswagen is available to the US tax authority). European banks must also
publicly disclose their country-by-country reports and a number of non-bank
multinationals have also chosen to voluntarily do so.

Having defined the tax deficit of each firm, we consider three ways for EU countries to
collect it: a full coordination scenario, an incomplete coordination scenario, and a
unilateral “first-mover” scenario.

2.2 Coordinated Minimum Tax

First, we consider an international agreement on a minimum tax of the type currently
discussed by the OECD, favored by a number of European Union countries, and by the
United States. In this scenario, each EU country would collect the full tax deficit of its
own multinationals. For instance, if the minimum tax rate is 25% and a German

 10
company has an effective tax rate of 10% on the profits it records in Singapore, then
Germany would impose an additional tax of 15% on these profits to arrive at an
effective rate of 25%. More generally, Germany would collect extra taxes so that its
multinationals pay at least 25% in taxes on the profits they book in each country, thus
fully erasing their tax deficit. Other nations would proceed similarly.

A number of points about this scenario must be noted. First, the minimum tax we
simulate is collected on a country-by-country basis. This is in contrast to the minimum
tax introduced in the United States in 2018 at a rate of 10.5%, known as GILTI (for
Global Intangible Low-Tax Income), which applies not to the country-by-country profits
of US multinationals but to their foreign profits combined. A country-by-country
minimum prevents multinationals from averaging their low-taxed income in tax havens
with higher-taxed income in other countries.

Second, in the scenario we consider, all profits are subject to the minimum tax, with
no exception or exemption. This, again, is in contrast to the minimum tax introduced
in the United States in 2018, which only applies to the foreign earnings of US
multinationals in excess of a rate of return of 10 percent on capital. A problem with
this exemption is that it exacerbates incentives for firms to move capital to low-tax
places, since increased capital investment in tax havens lowers the amount of
minimum tax due. Moreover, this kind of carveout can easily destroy a large fraction
of the tax revenues that can be generated with a minimum tax (e.g., Clausing et al.,
2021).

Third, the minimum tax we consider applies to both foreign and domestic profits. This
means that if a company today enjoys a less than 25% effective rate in its home
country (due, e.g., to tax breaks such as tax credits), it would be required to pay more
taxes. There is no particular reason for taxing domestic profits less than foreign
profits.

Fourth, we assume that the minimum would be based on economic profit as defined
and reported in the data we use—country by country reports and foreign affiliates

 11
statistics—and not based on taxable profit as defined in the tax law.4 Economic profit
typically differs from taxable profit for a number of reasons: tax depreciation can be
more generous than economic depreciation, interest deductions can be limited in the
tax law (while all interest is deducted to obtain economic profit), loss carryforwards or
carrybacks are often allowed in the tax law (while only current year profit is recorded
in the economic base), etc. Applying the minimum tax to economic profit makes it
impossible for firms to avoid the minimum tax by exploiting provisions of the tax laws
that reduce the tax base.

Fifth, we simulate the revenue effects of a coordinated minimum tax in the short term
(one yar). For a medium-run or long-run analysis, a number of behavioral responses
would deserve to be modelled. To start with, tax havens would be likely to increase
their tax rates. Indeed, with a country-by-country minimum tax, any income booked in
tax havens immediately generates an offsetting tax liability in the parent’s country. If
sufficiently many parent countries applied a substantial minimum tax, tax havens
couldn’t attract activity or profits anymore by offering low rates. They would thus be
encouraged to raise their own tax rates—as not doing so would mean leaving tax
revenues on the table for the parent countries to collect.

Because most of the profits booked by EU multinationals in tax havens are booked in
EU tax havens today, the fact that tax havens would likely increase their statutory tax
rates does not significantly affect total EU tax revenues in the medium or long-run. It
simply affects which EU country would get those revenues. Everything else equal there
would be, relative to our simulation, more revenues in the current EU havens if those
havens increased their tax rates, and less revenues in the current EU high-tax
countries. However, this would be (at least partly) offset by a second type of behavioral
response, namely that multinationals would relocate their profits and capital away
from today’s tax havens and towards today’s high-tax countries.

In this report, we do not attempt to model the long-run location of profits and capital if
there was a coordinated minimum tax. Instead, we assume that parent countries

4Economic profits reported in the country-by-country reports of multinationals are computed following
harmonized guidelines produced by the OECD; economic profits reported in foreign affiliates statistics are
computed following harmonized guidelines produced by Eurostat.

 12
would collect the minimum tax, which is likely to be accurate in the short-term, and not
unreasonable in the medium and long run.

2.3 EU Minimum Tax

In our second scenario, we simulate an incomplete international agreement in which
only EU countries apply a minimum tax, while non-EU countries do not change their tax
policies. In this scenario, each EU country would collect the tax deficit of its own
multinationals (as in the full coordination scenario), plus a portion of the tax deficit of
multinationals incorporated outside of the European Union. This portion would be
based on the geography of sales to final customers. For instance, if a company
incorporated in the United Kingdom makes 20% of its final (i.e., non-intragroup) sales
in Germany, then Germany would collect 20% of the tax deficit of this company (if it
has any).

Collecting a minimum tax on non-EU multinationals serves two purposes. First, it
would level the playing field by ensuring that firms that pay too little in taxes relative
to the norm in force in the European Union (i.e., have a tax deficit) pay more in taxes,
in proportion to how much they benefit from accessing the EU market—as proxied by
the fraction of their global sales made in the European Union. Second, this mechanism
would reduce the incentives for EU firms to reincorporate outside of the European
Union, which some firms might otherwise be tempted to do to avoid an EU-wide
minimum tax. In the extreme case in which a company that does all its sales in the
European Union chose to relocate to, say, the United Kingdom, then 100% of its tax
deficit would be taxed in the European Union, just as if it was incorporated in the EU.
Collecting the tax deficit of non-EU multinationals would thus alleviate tax competition
for headquarters.

A few remarks about this scenario are in order. First, EU tax authorities have the
information necessary to implement a minimum tax on non-EU multinationals. Thanks
to the automatic exchange of country-by-country reports, Germany, for example, has
access to the country-by-country reports of British multinationals, which contain a
breakdown of their non-intragroup sales. The sales information in these reports can
be cross-checked against VAT filings.

 13
Second, although collecting the tax deficit of non-EU multinationals would deserve a
detailed legal analysis that falls outside of the scope of this report, such a solution
does not evidently violate any international treaty. The minimum tax applied to non-EU
multinationals would come in addition to any regular corporate tax owed in the
European Union according to existing rules and treaties. Its base would be new—
namely, the tax deficit, computed relative to the EU-agreed minimum tax rate, and
applied to economic profit as recorded in country-by-country reports. Conceptually,
this minimum tax can be thought of as a blend of the OECD “Pillar 1” (relocating part
of taxable profits to destination countries) and “Pillar 2” (minimum taxation). It is thus
in line with the current evolution of international corporate taxation.

2.4 Unilateral Minimum Tax

In our third scenario, we estimate how much revenue each EU country could collect
unilaterally, assuming all other countries keep their current tax policy unchanged. This
corresponds to a “first-mover” scenario, in which one country alone decides to collect
the tax deficit of multinational companies. This first-mover would collect the full tax
deficit of its own multinationals, plus a portion (based on the destination of sales) of
the tax deficit of all foreign multinationals, both in and outside of the European Union.

For instance, if this first-mover is Germany, then Germany would collect 100% of the
tax deficit of German multinationals, plus a portion of the tax deficit (if there is one) of
French, UK, US, etc. multinationals. This portion would be equal to the fraction of the
global sales these multinationals make in Germany. As in the case of the tax on non-
EU multinationals described in the imperfect coordination scenario above, this tax on
foreign multinationals would come in addition to any corporate income tax owed under
existing rules. It would be easy to collect thanks to the availability of country-by-
country reports in the tax authorities of each EU member state.

A number of remarks about this scenario are worth noting. First, there is an advantage
to being the first mover. The first mover collects taxes not only on its own
multinationals, but also on all other multinationals that have a non-zero tax deficit and

 14
have access to its market. It thus acts as a de facto “tax collector of last resort,”
collecting part of the taxes that other countries chose not to collect.

The more countries join the club of the first movers, the less revenue there is to collect
by each of these countries. To see this, imagine for instance that Germany is initially
the only country collecting a minimum tax. As such, it would collect some of the tax
deficit of French multinationals. Now assume that France imitates Germany. France
would start collecting 100% of the tax deficit of its own multinationals, plus a portion
of the tax deficit of all foreign multinationals. French multinationals wouldn’t have any
tax deficit anymore. Thus, there would be nothing to collect by Germany on French
multinationals anymore.

A unilateral collection of the tax deficit would encourage other countries to proceed
similarly. In the preceding example, France would be encouraged to imitate Germany,
since not doing so would mean letting Germany collect revenues that France could
easily collect itself. Thus a “first-mover” scenario is not an equilibrium scenario. It
would likely lead to an equilibrium with a significant number of countries joining the
club of first movers, potentially all the way up to an EU-wide or global minimum tax. In
our simulations, we do not attempt to simulate the distribution of corporate tax
revenues in such an equilibrium—we focus on the revenues collected by the first mover
in the short-term, keeping the tax policy of all other countries fixed.

3 Data and Methodology

To conduct our simulations, we rely on two types of macroeconomic statistics:
tabulations of country-by-country reports, and foreign affiliates statistics used in
Tørsløv, Wier and Zucman (2018). We describe these data in turn and explain how we
combined them. We also illustrate and validate our approach using a micro-dataset
that we assembled, which includes all the firm-level publicly available country-by-
country reports of EU multinationals (all European banks plus 16 non-bank
multinationals)

 15
3.1 Macroeconomic data

OECD country-by-country data. The first data source used in this study is the
tabulations of multinational corporations’ country-by-country reports published by the
OECD in July 2020. These tabulations are for the year 2016, the first year that OECD
multinationals had to compile and transmit country-by-country reports. Among other
indicators, this dataset provides information on the profits booked and taxes paid in
the domestic and foreign jurisdictions of multinational corporations headquartered in
26 OECD countries.

The availability of country-by-country data marks an important milestone in the
analysis of globalization. These data are currently the only systematic source on the
taxes effectively paid by multinational companies in each of the country where they
operate (foreign affiliates statistics, discussed below, capture many of the same
information as country-by-country reports, such as profits and turnover, but do not
systematically include corporate taxes paid). Country-by-country statistics, however,
are still in their infancy and suffer from a number of limitations.

First, in 2016 country-by-country reporting was not mandatory in all countries. This led
to significant gaps in coverage. While 137 countries participate in the Inclusive
Framework of the OECD on Base Erosion and Profit Shifting, only 58 gathered country-
by-country data for their own multinationals in 2016. Of these, only 26 nations shared
their results with the OECD, of which 12 are EU member states. Notable gaps include
Germany, the United Kingdom and Spain, which did not report any country-by-country
statistics. We address this issue by complementing the OECD data with the estimates
of the amount of profit booked in tax havens by each parent country of Tørsløv, Wier
and Zucman (2018); see below.

Second, in a number of countries that reported data to the OECD, reporting was not
mandatory and thus total profits, taxes, and other aggregate statistics are too low.
This, most importantly, is the case for the United States (see, e.g., Clausing et al.,
2021).5

5
 This can be seen by comparing the 2016 US country-by-country data to the 2017 data published by the IRS.
Between 2017 and 2016, profits booked by US multinationals in Switzerland rise from -$6 billion to $49 billion;

 16
Third, due to insufficiently detailed guidelines in the first years of reporting, some
profits are double counted (Horst and Curatolo, 2020). Profits assigned to “stateless
entities” (particularly large in the case of US multinationals) are often also counted
elsewhere (either under US domestic profits, or in a non-US jurisdiction). We
conservatively address this issue by dropping profits in stateless entities entirely.
Moreover, intra-company dividend also sometimes led to double counting. When a
multinational from country A owns an affiliate in country B that owns an affiliate in
country C, dividends paid by C to B are not counted as part of B’s revenue, but they are
sometimes counted as part of B’s profit. There is no way to systematically address
this issue at this stage.

Fourth, for cases with only few multinationals having subsidiaries in a foreign
jurisdiction, reporting countries aggregated data of foreign jurisdictions to ensure
taxpayer confidentiality. For example, the Isle of Man, Jersey and Guernsey can be
pooled in the partner jurisdiction “other Europe.”

Tørsløv, Wier and Zucman (2018) data. The second data source used in this study is
the estimates of the profits booked in tax havens by parent country of Tørsløv, Wier
and Zucman (2018). These estimates are obtained by combining foreign affiliates
statistics (from which Tørsløv et al. infer the amount of profits booked in tax havens
globally) and direct investment statistics on an ultimate ownership basis (from which
Tørsløv et al. infer the countries of the parent companies that book profits in tax
havens).6 The original Tørsløv, Wier and Zucman (2018) data are for the year 2015; an
update to 2016 is available at http://missingprofits.world (Tørsløv, Wier and Zucman,
2019). For consistency with the OECD country-by-country data, we use the 2016
estimates of Tørsløv et al.

profits in Jersey from $0 to $12 billion; profits in Singapore from $29 billion to $55 billion, etc. Profits in non-
haven countries also rise, e.g., from $18 billion to $32 billion in Canada.
6 In spirit, foreign affiliates statistics contain similar information as country-by-country reports. More precisely,

these statistics record (among other indicators) the wages and profits of foreign firms, defined as firms more
than 50% owned by foreign shareholders (in practice, affiliates of multinational companies). For EU countries,
foreign affiliates statistics are disseminated by Eurostat; the OECD also disseminates foreign affiliate statistics
for OECD countries and a number of non-OECD countries. See Tørsløv et al. (2018) for a detailed discussion of
these data.

 17
An advantage of this dataset is that it is more comprehensive that the OECD country-
by-country statistics, since it includes multinationals from all countries, while the OECD
statistics only cover 26 parent countries. For example, the Tørsløv, Wier and Zucman
(2019) database includes estimates of the amount of profits booked by UK, German,
and Spanish multinational in tax havens in 2016—information which is unavailable in
the OECD country-by-country statistics since these countries did not report country-by-
country data in 2016.

One limitation of the Tørsløv et al. database is that it does not identify profits in non-
havens at the bilateral level by partner country. For example, the database includes
estimates of the profits booked by German multinationals in tax havens, but no
estimate of the profits booked by German multinationals in France. Moreover, foreign
affiliate statistics generally do not include information on taxes paid (the main
exception being the foreign affiliate statistics of the United States), making it difficult
to estimate effective corporate tax rates.

The Tørsløv et al. database and OECD country-by-country data are generally
consistent. In both datasets about 40% of identified multinational profits (i.e., profits
booked by multinationals outside of the country where they are headquartered) are
booked in tax havens.7 Specifically, tax havens in total have $395 billion in profit in the
OECD statistics, which is 40% of the amount of allocated multinational profits in these
data ($992 billion), a number very close to the one in Tørsløv et al. (2018), 36% in 2016.
In absolute terms, there are more profits (both in havens and overall) in the Tørsløv et
al. data than in the OECD country-by-country statistics. This is due both to the larger
country coverage in Tørsløv et al. (as only 26 country reported country-by-country
statistics to the OECD) and the more exhaustive reporting within a number of countries
(such as the United States). There are some differences at the individual country level
between the Tørsløv et al. data and the OECD country-by-country statistics, due to
differences in coverage and estimation methods. We refer to Appendix G of Tørsløv et
al. (2018) for detailed comparison and reconciliation between these two data
sources.8

7 See list of tax havens in Appendix F.
8 Available online at https://gabriel-zucman.eu/files/TWZ2020Appendix.pdf

 18
Methodology to estimate tax deficits. We describe here the main steps of our
estimation procedure; complete details, robustness tests, and supplementary results
are discussed in Appendices A (full coordination), B (unilateral case) and C (imperfect
coordination).

To estimate the tax deficit, three ingredients are required: (i) a reference minimum tax
rate, (ii) estimates of profits booked in each pair of parent country A and subsidiary
country B, (iii) estimates of effective tax rates in each of these pairs. The reference
minimum tax rate we use in our benchmark computations is 25%; we also provide
results with rates ranging from 15% to 30%. Given data limitations, we focus on
estimating tax deficits for 36 parent countries: all EU countries for which data is
available (23 EU countries) plus 13 non-EU countries that report country-by-country
statistics to the OECD. To estimate tax deficits of these 36 countries, we combine the
OECD and Tørsløv data as follows.

 • Profits booked in tax havens by parent companies that report country-by-
 country data to the OECD: we take the maximum of the tax deficit computed in
 the OECD data (using the observed effective tax rate in the OECD data) and the
 tax deficit computed in the Tørsløv et al. data (assuming haven profits were
 taxed at an effective tax rate of 10%, a rate in line with the one observed in
 country-by-country statistics in 2016). This is motivated by the fact that
 reporting of country-by-country statistics was not mandatory and incomplete in
 2016.

 • Profits booked in tax havens by parent companies that do not report country-
 by-country data: the tax deficit is estimated using the the Tørsløv et al. data,
 assuming haven profits were taxed at an effective tax rate of 10%.

 • Profits booked in non-haven countries by parent companies that report country-
 by-country data: the tax deficit is estimated using the OECD data (profits and
 effective tax rates) with no correction.

 • Profits booked in non-havens by parent companies that do not report country-
 by-country data: these tax deficits are imputed based on the ratio of non-haven

 19
to haven tax deficits for the countries that report country-by-country data to the
 OECD; see Appendix A for complete details.

Two remarks are in order. First, foreign affiliates statistics (that underpin the Tørsløv
et al. database) and even more so country-by-country statistics are still in their infancy
and have known issues. For these reasons, we see our computations as providing
orders of magnitude rather than perfectly accurate estimates. We plan to regularly
update our findings as improved and more comprehensive macroeconomic data
become available, refined estimation techniques are designed, and more companies
publicly disclose their country-by-country reports.

In addition, the orders of magnitude we obtain should be seen as conservative lower
bounds, due to a number of identified sources of downward bias. First, the effective
tax rates we use are based on 2016 data. It is possible that effective tax rates may
have declined from 2016 to 2021, leading to higher tax deficit than we report. Second,
tabulated data by construction deliver downward-biased estimates of tax deficits,
because of heterogeneity in effective tax rates within each country-pair. For example,
imagine that half of French multinationals have an effective tax rate of 30% (euro-
weighted) in Italy and the other have an effective tax rate of 20% in that country. The
average effective tax rate reported in tabulated statistics for French multinationals in
Italy is 25% and thus the estimated tax deficit (relative to a 25% minimum tax rate) is
0. In reality the true tax deficit is positive, since the multinationals with a less than 25%
effective tax rate have a tax deficit.9

The only way to remove this bias is to use firm-level data to estimate tax deficits. To
assess the reliability of our methodology, we therefore applied it to all the micro data
available to us, which we now describe.

9
 Another potential source of bias with tabulated data comes from loss-making companies, which tend to bias
effective tax rates upward. We address this issue by computing effective tax rates for profit-making companies
only (which is possible in the OECD data).

 20
3.2 Firm-level data

Data. A number of multinationals publicly provide their country-by-country reports,
detailing profits and taxes paid on a country-by-country basis. This includes European
banks, which must by law disclose this information publicly, and a number of non-bank
multinationals in other sectors, which chose to voluntarily do so.

The country-by-country reporting for banks started in 2015 following the Article 89 of
the CRD IV Directive 2013/36/EU. Banks with a consolidated turnover above 750
million euros and that operate in the European Union are required to publicly disclose
the activity of all their affiliates (subsidiaries and branches) regarding the allocation of
their income, profit and taxes. We hand-collected all of these reports for the year 2019
from the banks’ annual reports or from a separate report filed by banks under capital
requirements or country-by-country reporting. Our sample includes 38 European
banks, most of which large systemic banks except for two smaller banks.10

In addition, a number of non-bank multinationals voluntarily publish country-by-country
reports of their profits and tax payments. We collect data for 16 multinationals for the
year 2019 from various sectors (oil, mining, telecommunication, insurance, financial
services, etc.). In 8 cases (BP, Eni, Repsol, Rio Tinto, Shell, Iberdrola, Telefonica, Anglo-
American), the report published is the same as the on submitted to tax authorities. In
the other cases, it’s a simplified version.

An illustrative example. We illustrate the principle of collecting the tax deficit of
multinationals using the example of Shell, an oil company incorporated in the
Netherlands.

In 2019, according to its public country-by-country report, Shell reported $2.3 billion in
profit in Singapore, where it paid $50 million in tax, an effective tax rate of 2%. Relative
to a reference minimum tax rate of 25%, Shell thus had a tax deficit of 23 points (25
minus 2) in Singapore. Collecting this tax deficit would have generated 0.23 x $2.3
billion = $530 million in tax revenue in the Netherlands. Other countries where Shell

10 AIB group (Ireland) and Belfius (Belgium). For the full list if banks see Appendix D.

 21
had a large tax deficit included Bermuda, Canada, Switzerland, the United Arab
Emirates, and the Netherlands. Notably, Shell had a significant tax deficit in its home
country ($212 million in taxes paid in the Netherlands out of $2.8 billion in pre-tax
profit, an effective tax rate of 7.4%).

Shell also reported $1 billion in profit in Malaysia, where it paid $415 million in tax—an
effective tax rate of 41.5%, well in excess of 25%. Thus, Shell did not have a tax deficit
in Malaysia. Other countries where Shell paid a significant amount of tax and had a
high effective tax rate included Kazakhstan, Nigeria, Norway, and Oman

Overall, if Shell had been subject to a minimum tax rate of 25% in each country where
it operates, it would have paid $2.9 billion more in taxes, an increase of 45% relative to
the taxes it paid globally in 2019.

4 Results
4.1 Macroeconomic Results: Full Cooperation Case

We start by presenting the revenue effects of our first scenario: an international
agreement on a minimum tax of the type currently discussed by the OECD, favored by
a number of European Union countries, and by the United States. In this scenario, each
parent country would collect taxes on its multinationals to ensure that they pay at least
25% in each of the country where they operate.

Table 1 shows the projected increase in corporate income tax revenues in 23 EU
countries11 and a number of non-EU countries (including the United States, Australia,
Canada, Japan, India, and Mexico) in 2021. We express revenues in billion euros, and
also as a percent of projected corporate tax revenues in 2021 (absent a change in the
tax law) and as a percent of current health spending.12

11 Due to data limitations, we are unable to report estimates for four EU countries: Bulgaria, Croatia, Lithuania,
and Romania.
12 2021 ratios are based on estimated revenues from a minimum tax in 2016, scaled by 2016 corporate tax

revenues (or 2016 health spending). We assume these ratios are constant between 2016 and 2021.

 22
Table 1: Revenues of a 25% coordinated minimum tax in 2021
 As a % of current
 Tax revenues As a% of health
Country corporate income tax
 (billion €) expenditure
 revenue
Austria 7.0 16.6% 73.3%
Belgium 19.0 37.9% 114.8%
Bulgaria . . .
Cyprus 0.9 64.9% 77.5%
Czech Republic 1.1 7.5% 14.3%
Germany 29.1 7.3% 41.5%
Denmark 3.5 10.6% 40.9%
Estonia 0.4 23.3% 88.9%
Spain 12.4 11.0% 43.7%
Finland 4.7 20.4% 86.9%
France 26.1 9.0% 50.9%
Greece 1.6 9.9% 33.0%
Croatia . . .
Hungary 1.9 20.6% 62.7%
Ireland 14.0 61.2% 167.9%
Italy 11.1 6.6% 27.3%
Lithuania . . .
Luxembourg 7.9 243.4% 282.3%
Latvia 0.5 26.0% 95.4%
Malta 0.3 28.8% 40.9%
Netherlands 9.3 11.3% 34.7%
Poland 11.0 35.0% 124.2%
Portugal 0.6 2.9% 9.0%
Romania . . .
Sweden 5.3 9.2% 36.5%
Slovenia 0.1 1.6% 8.4%
Slovak Republic 0.0 0.7% 1.3%
EU total 167.8 12.1% 52.3%
Australia 11.7 9.8% 19.2%
Brazil 7.4 4.4% 12.7%
Canada 34.7 20.2% 64.3%
Chile 1.2 5.6% 11.3%
China 30.2 5.3% 6.8%
Indonesia 0.9 3.2%
India 1.4 1.7% 1.9%
Japan 28.7 5.2% 15.4%
South Korea 6.2 5.9% 12.0%
Mexico 1.3 2.1% 3.4%
Norway 0.4 1.0% 2.6%
United States 165.4 5.1% 43.9%
South Africa 3.0 12.3% 18.2%

 23
For the European Union as a whole, we find that the revenue potential from minimum
taxation is large. With a minimum tax at a rate of 25% applied to the profits of European
multinationals, the European Union would increase its current corporate tax revenues
by about €170 billion in 2021—from the €340 billion projected to be collected in 2021
under current law to about €510 billion. The extra revenues from minimum taxation
represent the equivalent of about 50% of the corporate tax revenues currently
collected, or about 12% of total current health spending in the European Union. These
extra revenues would increase total EU corporate tax receipts from 2.4% of the
European Union’s GDP to 3.6% of EU GDP. To generate new revenues in a fair and
sustainable manner, a 25% minimum tax is thus a powerful—yet realistic—instrument.

A number of additional results are worth noting. First, there is heterogeneity in the
revenues generated by the minimum tax. A number of countries would stand to benefit
particularly significantly from this policy. This includes Eastern European countries
(e.g., Estonia, Hungary, Latvia, Poland) and EU tax havens.

Eastern European countries currently have low effective tax rates on the profits of their
domestic firms. Since the 25% minimum tax we simulate would also apply to the
profits booked locally, it would boost tax collection on domestic profits. In these
countries, a 25% minimum tax essentially would mean doubling tax payments made
by domestic firms.

The case of countries like Cyprus, Ireland, Luxembourg also deserves to be noted.
Table 1 suggests that EU tax havens would stand to benefit a lot from a 25% minimum
tax. However, this result relies on the assumption that these countries would keep the
headquarters they have attracted so far in part by offering low corporate tax rates. In
reality, with an international agreement on a minimum tax, headquarters might move
to currently high-tax countries, which means that tax havens would likely benefit less
than what we report in Table 1 (and other countries would benefit more). To the extent
that headquarters located in EU havens would move to EU non-havens, this would not
affect the extra revenues collected by the European Union as a whole (€170 billion in
2021).

 24
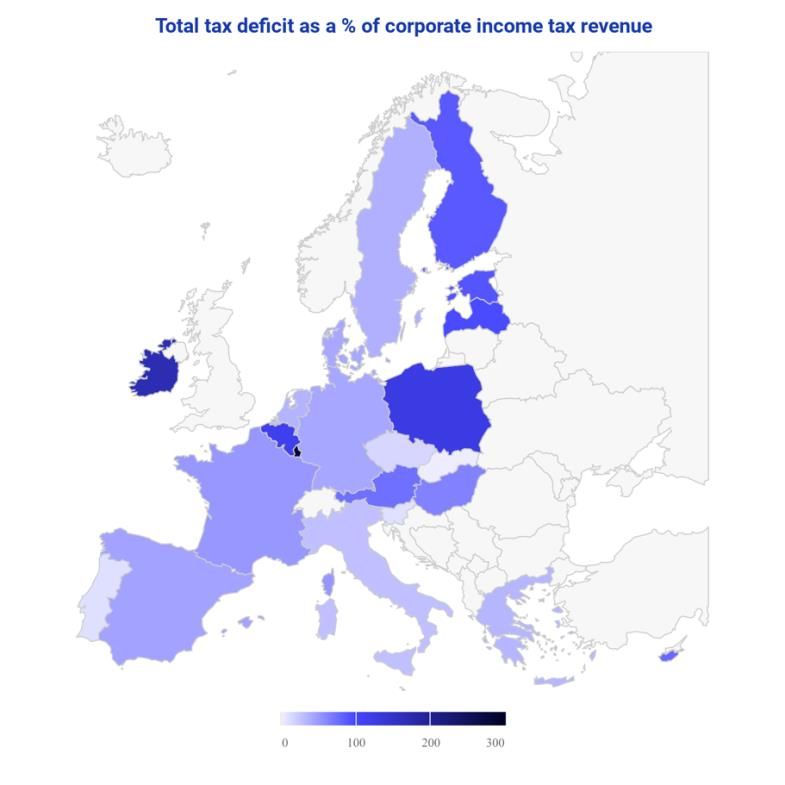
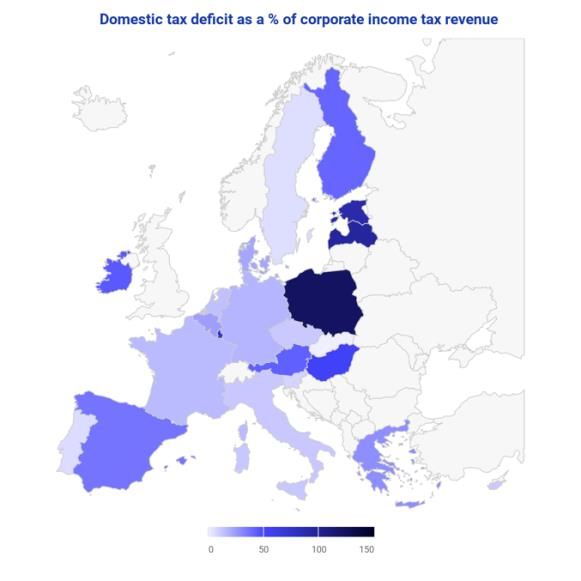
Figure 1: Additional Revenues of a 25% coordinated minimum tax in 2021 (% of
 current corporate income tax revenue)

Notes: the top panel shows the additional tax revenues that would be collected by European countries
if each of them applied a 25% minimum tax on the country-by-country profits of their multinationals; the
results are expressed as a fraction of currently collected corporate income tax revenues. The bottom
panel, left shows the revenues that would be collected on the profits booked by domestic multinationals
domestically, and the bottom panel, right shows the revenues that would be collected on the profits
booked by domestic multinationals abroad.

 25
In the largest EU countries, according to our estimates, corporate tax revenues would
generally increase by 30% to 50%: 42% in Germany (an increase of €29 billion per year),
51% in France (€26 billion), 44% in Spain (€12.5 billion) and close to 30% in Italy (€11.
billion).

We also provide estimates for a number of non-EU countries. Unsurprisingly, corporate
tax revenues would increase the most in countries where multinationals tend to be
incorporated, most notably the United States (with an increase of €165 billion, about
as much as for the European Union as a whole). By contrast, the revenue effects of an
international agreement on a minimum tax would be more muted for developing
countries, since these countries tend to host relatively few headquarters. Note
however that developing countries would indirectly benefit from a high minimum tax,
as this policy would make it easier for them to increase taxation on corporate profits
(including on the profits of subsidiaries of foreign multinationals) without risking
capital flight. We do not attempt to estimate these indirect effects in this report.

Figure 1 illustrates the source of the additional revenues that would be collected by EU
countries. As the top panel shows, all EU member countries would significantly benefit
from a 25% minimum tax—with particularly large increases in currently low-tax
countries (e.g., Eastern European countries). As bottom left panel shows, the bulk of
the additional tax revenues from minimum taxation in currently low-tax countries (e.g.,
Poland) would stem from an increased taxation of the profits booked by domestic
firms locally (e.g., profits booked by Polish firms in Poland). Vice versa, as shown by
the bottom right panel, in currently relatively high-tax countries (e.g., France), a large
fraction of the additional revenues from minimum taxation would come from an
increased taxation of profits booked (e.g., profits booked by French multinationals in
Luxembourg).

In Table 2, we assess how varying the minimum tax rate would affect tax revenues.
Revenues significantly depend on the commonly agreed minimum tax rate. With a 21%
minimum rate, the European Union would collect about €100 billion in 2021 (as
opposed to €170 billion with a 25% minimum tax rate). Moving from 21% to 15% would
reduce revenues by a factor of two.

 26
Table 2: Revenues of a minimum tax in 2021 for different minimum tax rates

Country Revenues (billions of €) for a minimum tax rate of…

 15% 21% 25% 30%
Austria 3.0 5.4 7.0 8.9
Belgium 10.5 15.6 19.0 23.3
Bulgaria – – – –
Cyprus 0.3 0.4 0.9 1.7
Czech Republic 0.1 0.3 1.1 2.1
Germany 5.7 6.6 29.1 69.1
Denmark 0.7 2.3 3.5 4.9
Estonia 0.1 0.3 0.4 0.5
Spain 0.7 5.4 12.4 21.2
Finland 1.7 3.5 4.7 6.2
France 4.3 16.0 26.1 39.2
Greece 0.1 0.6 1.6 2.9
Croatia – – – –
Hungary 0.6 1.3 1.9 2.7
Ireland 7.2 11.3 14.0 17.3
Italy 2.7 7.6 11.1 15.7
Lithuania – – – –
Luxembourg 4.1 6.3 7.9 9.9
Latvia 0.1 0.3 0.5 0.6
Malta 0.1 0.2 0.3 0.5
Netherlands 0.9 4.9 9.3 14.9
Poland 3.7 8.0 11.0 14.8
Portugal 0.1 0.1 0.6 1.9
Romania – – – –
Sweden 1.5 1.7 5.3 10.8
Slovenia 0.0 0.0 0.1 0.1
Slovak Republic 0.0 0.0 0.0 0.4
EU total 48.3 98.0 167.8 269.7
Australia 2.3 7.9 11.7 16.6
Brazil 0.9 3.4 7.4 12.3
Canada 16.0 27.2 34.7 44.2
Chile 0.2 0.8 1.2 1.8
China 4.5 12.0 30.2 53.1
Indonesia 0.1 0.3 0.9 1.8
India 0.5 1.1 1.4 2.2
Japan 6.0 14.4 28.7 61.4
South Korea 0.0 1.5 6.2 12.7
Mexico 0.5 0.9 1.3 3.1
Norway 0.1 0.2 0.4 0.7
United States 40.7 104.4 165.4 245.4
South Africa 0.6 2.0 3.0 4.3

 27
You can also read


