Prediction of COVID-19 using Machine Learning Techniques - Durga Mahesh Matta Meet Kumar Saraf
←
→
Page content transcription
If your browser does not render page correctly, please read the page content below
Bachelor of Science in Computer Science
May 2020

Prediction of COVID-19 using Machine
         Learning Techniques

                          Durga Mahesh Matta
                           Meet Kumar Saraf

  Faculty of Computing, Blekinge Institute of Technology, 371 79 Karlskrona, Sweden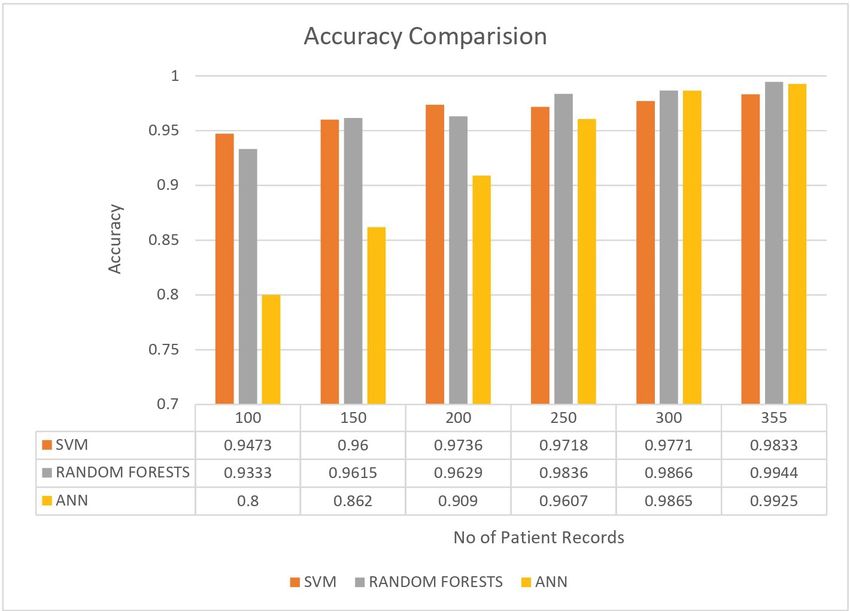
This thesis is submitted to the Faculty of Computing at Blekinge Institute of Technology in
partial fulfilment of the requirements for the degree of Bachelor of Science in Computer Science.
The thesis is equivalent to 10 weeks of full time studies.

The authors declare that they are the sole authors of this thesis and that they have not used
any sources other than those listed in the bibliography and identified as references. They further
declare that they have not submitted this thesis at any other institution to obtain a degree.

Contact Information:
Author(s):
Durga Mahesh Matta
E-mail: duma19@student.bth.se

Meet Kumar Saraf
E-mail: mesa19@student.bth.se

University advisor:
Suejb Memeti
Department of Computer Science

Faculty of Computing                               Internet : www.bth.se
Blekinge Institute of Technology                   Phone    : +46 455 38 50 00
SE–371 79 Karlskrona, Sweden                       Fax      : +46 455 38 50 57
Abstract

Background: Over the past 4-5 months, the Coronavirus has rapidly spread to all
parts of the world. Research is continuing to find a cure for this disease while there
is no exact reason for this outbreak. As the number of cases to test for Coronavirus
is increasing rapidly day by day, it is impossible to test due to the time and cost
factors. Over recent years, machine learning has turned very reliable in the medical
field. Using machine learning to predict COVID-19 in patients will reduce the time
delay for the results of the medical tests and modulate health workers to give proper
medical treatment to them.
Objectives: The main goal of this thesis is to develop a machine learning model
that could predict whether a patient is suffering from COVID-19. To develop such a
model, a literature study alongside an experiment is set to identify a suitable algo-
rithm. To assess the features that impact the prediction model.
Methods: A Systematic Literature Review is performed to identify the most suit-
able algorithms for the prediction model. Then through the findings of the literature
study, an experimental model is developed for prediction of COVID-19 and to iden-
tify the features that impact the model.
Results: A set of algorithms were identified from the Literature study that includes
SVM (Support Vector Machines), RF (Random Forests), ANN (Artificial Neural
Network), which are suitable for prediction. Performance evaluation is conducted
between the chosen algorithms to identify the technique with the highest accuracy.
Feature importance values are generated to identify their impact on the prediction.
Conclusions: Prediction of COVID-19 by using Machine Learning could help in-
crease the speed of disease identification resulting in reduced mortality rate. Ana-
lyzing the results obtained from experiments, Random Forest (RF) was identified to
perform better compared to other algorithms.

Keywords: COVID-19, Machine Learning, Prediction, Supervised Learning, Clas-
sification Techniques
Acknowledgments

We would like to show our sincere gratitude to Prof. Suejb Memeti for supervising
our thesis and guiding us throughout the project with quick and helpful feedback.
    We would also like to thank our dear friend Akhila Dindi for providing construc-
tive comments, which helped in improving our work and would like to extend our
gratitude to all those who helped us directly and indirectly.

                                         iii
Contents
Abstract i
Acknowledgments iii
1 Introduction 1
1.1 Aim . . . . . . . . . . . . . . . . . . . . . . . . . . . . . . . . . . . . 2
1.2 Objectives . . . . . . . . . . . . . . . . . . . . . . . . . . . . . . . . . 2
1.3 Research questions . . . . . . . . . . . . . . . . . . . . . . . . . . . . 2
1.4 Defining the scope of the thesis . . . . . . . . . . . . . . . . . . . . . 2
1.5 Outline . . . . . . . . . . . . . . . . . . . . . . . . . . . . . . . . . . . 3
2 Background 5
2.1 Algorithms . . . . . . . . . . . . . . . . . . . . . . . . . . . . . . . . . 7
3 Related Work 9
4 Method 11
4.1 Literature Review . . . . . . . . . . . . . . . . . . . . . . . . . . . . . 11
4.2 Experiment . . . . . . . . . . . . . . . . . . . . . . . . . . . . . . . . 12
4.2.1 Software Environment . . . . . . . . . . . . . . . . . . . . . . 12
4.2.2 Dataset . . . . . . . . . . . . . . . . . . . . . . . . . . . . . . 13
4.2.3 Data Preprocessing . . . . . . . . . . . . . . . . . . . . . . . . 14
4.2.4 Implementation . . . . . . . . . . . . . . . . . . . . . . . . . . 14
4.2.5 Algorithm Configurations . . . . . . . . . . . . . . . . . . . . 15
4.2.6 Performance Metrics . . . . . . . . . . . . . . . . . . . . . . . 15
5 Results 17
5.1 Literature Review Results . . . . . . . . . . . . . . . . . . . . . . . . 17
5.2 Experiment Results . . . . . . . . . . . . . . . . . . . . . . . . . . . . 20
5.2.1 Support Vector Machine (SVM) Results . . . . . . . . . . . . 21
5.2.2 Random Forest (RF) Results . . . . . . . . . . . . . . . . . . 22
5.2.3 Artificial Neural Networks (ANN) Results . . . . . . . . . . . 23
5.2.4 Results Comparison . . . . . . . . . . . . . . . . . . . . . . . . 23
5.2.5 Feature Importance Results . . . . . . . . . . . . . . . . . . . 24
6 Analysis and Discussion 27
6.1 Analysis of Literature Review . . . . . . . . . . . . . . . . . . . . . . 27
6.2 Analysis of Experiment . . . . . . . . . . . . . . . . . . . . . . . . . . 27
v6.2.1 Experiment Phase 1 . . . . . . . . . . . . . . . . . . . . . . . 27
6.2.2 Experiment Phase 2 . . . . . . . . . . . . . . . . . . . . . . . 28
6.3 Discussion . . . . . . . . . . . . . . . . . . . . . . . . . . . . . . . . . 28
6.4 Validity Threats . . . . . . . . . . . . . . . . . . . . . . . . . . . . . . 29
6.4.1 Internal Validity . . . . . . . . . . . . . . . . . . . . . . . . . 29
6.4.2 External Validity . . . . . . . . . . . . . . . . . . . . . . . . . 29
7 Conclusions and Future Work 31
References 33
viList of Figures
2.1 Support Vector Machine[7] . . . . . . . . . . . . . . . . . . . . . . . 7
2.2 Neural Network [56] . . . . . . . . . . . . . . . . . . . . . . . . . . . . 8
2.3 Visualization of Random Forest making a prediction. [54] . . . . . . . 8
5.1 Support Vector Machine (SVM) Accuracy Chart . . . . . . . . . . . . 21
5.2 Random Forest (RF) Accuracy Chart . . . . . . . . . . . . . . . . . . 22
5.3 Artificial Neural Networks (ANN) Accuracy Chart . . . . . . . . . . . 23
5.4 Performance Comparison Chart . . . . . . . . . . . . . . . . . . . . . 24
5.5 Feature Importance Chart . . . . . . . . . . . . . . . . . . . . . . . . 26
viiList of Tables
4.1 Features in the dataset used. . . . . . . . . . . . . . . . . . . . . . . . 14
5.1 Literature Review Results. . . . . . . . . . . . . . . . . . . . . . . . . 20
5.2 Support Vector Machine (SVM) Accuracy Results . . . . . . . . . . . 21
5.3 Random Forest (RF) Accuracy Results . . . . . . . . . . . . . . . . . 22
5.4 Artificial Neural Networks (ANN) Accuracy Results . . . . . . . . . . 23
5.5 Comparison using Performance Metric - accuracy . . . . . . . . . . . 24
5.6 Feature Importance . . . . . . . . . . . . . . . . . . . . . . . . . . . . 25
6.1 Features that majorly affect the Prediction. . . . . . . . . . . . . . . 29
6.2 Features that have no affect the Prediction. . . . . . . . . . . . . . . 29
ixChapter 1
Introduction
Corona viruses are a large family of viruses that are known to cause illness rang-
ing from the common cold to more severe diseases such as Middle East Respiratory
Syndrome(MERS) and Severe Acute Respiratory Syndrome(SARS) [6]. These two
diseases are spread by the corona viruses named as MERS-CoV and SARS-CoV.
SARS was first seen in 2002 in China and MERS was first seen in 2012 in Saudi
Arabia [8]. The latest virus seen in Wuhan, China is called SARS-COV-2 and it
causes corona virus.
A pneumonia of unknown cause detected in Wuhan, China was first reported to the
World Health Organisation (WHO) Country Office in China on 31 December, 2019
[1]. Since, then the number of cases of corona virus are increasing along with high
death toll. Corona virus spread from one city to whole country in just 30 days [50].
On Feb 11, it was named as COVID-19 by World Health Organisation (WHO)[5].
As this COVID-19 is spread from person to person, Artificial intelligence based elec-
tronic devices can play a pivotal role in preventing the spread of this virus. As
the role of healthcare epidemiologists has expanded, the pervasiveness of electronic
health data has expanded too [13]. The increasing availability of electronic health
data presents a major opportunity in healthcare for both discoveries and practical
applications to improve healthcare [48]. This data can be used for training machine
learning algorithms to improve its decision-making in terms of predicting diseases.
As of May 16, 2020, totally 44,25,485 cases of COVID-19 have been registered and
total number of deaths are 3,02,059 [3]. COVID-19 has spread across the globe with
around 213 countries and territories affected [2]. As the rise in number of cases of in-
fected corona virus quickly outnumbered the available medical resources in hospitals,
resulted a substantial burden on the health care systems [44]. Due to the limited
availability of resources at hospitals and the time delay for the results of the medical
tests, it is a typical situation for health workers to give proper medical treatment to
the patients. As the number of cases to test for corona virus is increasing rapidly
day by day, it is not possible to test due to the time and cost factors [25]. In our
thesis, we would like to use machine learning techniques to predict the infection of
corona virus in patients.
12 Chapter 1. Introduction
1.1 Aim
The aim of this thesis is to predict whether a person has COVID-19 or not, using
machine learning techniques. The prediction is performed using the clinical infor-
mation of the patients. The goal is to identify whether a patient can potentially be
diagnosed with COVID-19.
1.2 Objectives
The main objective of our thesis are,
• Identifying the most suitable machine learning technique for prediction, to
perform on clinical reports of patients.
• Preparing a machine learning model that could make accurate predictions of
COVID-19 in patients.
• Identifying the features that affects the prediction of COVID-19 in patients.
1.3 Research questions
To achieve the objectives of our thesis, there are some research questions that have
been formulated:
1. Which suitable machine learning technique can be used to predict
COVID-19?
Motivation: The motivation of the research question is to conduct a conjunctive
literature study and experiment to see what are the appropriate machine learning
algorithms that can be best applied to the given data and also to find out which
algorithm gives us the best results in predicting COVID-19.
2. What are the features that will influence the predictive result of
COVID-19?
Motivation: The motivation of this research is to conduct an experiment to
identify the features that will influence the results of prediction of Corona virus in
human beings.
1.4 Defining the scope of the thesis
This research focuses on development of a machine learning model for predicting
COVID-19 in patients. We also work to identify the features from the clinical in-
formation of patients that would influence the predictive result of COVID-19. This
study does not focus on outer factors such as weather or any environmental factors
that might influence results.1.5. Outline 3
1.5 Outline
The thesis structure is divided into different chapters which are as follows:
• Chapter 1: This chapter contains the introduction to this thesis, aim and
objectives, research questions, and motivation.
• Chapter 2: In this chapter, we discuss the background of the concepts used
during the research.
• Chapter 3: This chapter contains the summary of the works similar to this
thesis.
• Chapter 4: This contains methods to answer research questions. It includes
experimental analysis like data processing, tools used during the experiment,
and experimental setup details.
• Chapter 5: Results obtained are presented in this chapter.
• Chapter 6: This chapter consists of analysis and discussions about the results
and methods, the contribution of the thesis to the existing research, threats to
the validity of the thesis.
• Chapter 7: In this chapter,we discuss the conclusion of the thesis and discussion
on possible future work.Chapter 2
Background
Machine Learning is a subset of Artificial Intelligence(AI) and was evolved from
pattern recognition where the data can be structured for the understanding of the
users. Recently, many applications have been developed using Machine Learning in
various fields such as healthcare, banking, military equipment, space etc. Currently,
Machine Learning is a rapidly evolving and continuously developing field. It programs
computers using data to optimize their performance. It learns the parameters to
optimize the computer programs using the training data or its past experiences.
Using the data, it can also predict the future. Machine Learning also helps us in
building a mathematical model using the statistics of the data. The main objective
of Machine Learning is that it learns from the feed data without any interference of
humans that is, it automatically learns from given data(experience) and gives us the
desired output where it searches the trends/patterns in the data[43]. It is broadly
classified into four types:
• Supervised Machine Learning.
• Unsupervised Machine Learning.
• Semi-Supervised Machine Learning.
• Reinforcement Machine Learning.
Supervised Machine Learning
Supervised Learning is a Machine Learning model that is built to give out predic-
tions. This algorithm is performed by taking a labelled set of data as input and also
known responses as output to learn the regression/classification model. It develops
predictive models from classification algorithms and regression techniques.
Classification predicts discrete responses. Here, the algorithm labels by choosing
two or more classes for each example. If it is done between two classes then it is
called binary classification and if it is done between two or more classes then it is
called multi- class classification. Applications of classification includes hand writing
recognition, medical imaging etc.
Regression predicts continuous responses. Here, the algorithms returns a statistical
value. For example, a set of data is collected such that the people are happy when
56 Chapter 2. Background
considered the amount of sleep. Here, sleep and happy are both variables. Now,
the analysis is done by making predictions[11]. The types of popular regression
techniques are:
• Linear regression.
• Logical regression.
Unsupervised Machine Learning
Unlike the supervised learning, there is no supervisor here and we only have input
data. Here, the basic aim is to find certain patterns in the data that occur more
than others. According to the statistics, it is called density estimation. One of the
methods for the density estimation is called clustering. Here, the input data is formed
into clusters or groupings. Here, the assumptions are made such that the clusters
are discovered which will match reasonably well with a classification. This is a data-
driven approach that works better when provided with sufficient data. For example,
the movies in Netflix.com are suggested based on the principal of clustering of movies
where several similar movies are grouped based on customer’s recently watched movie
list. It mostly discovers the unknown patterns in the data but most of the time these
approximations are weak when compared with the supervised learning[12].
Semi-supervised Machine Learning
The name “semi-supervised learning” comes from the fact that the data used is be-
tween supervised and unsupervised learning [57]. Semi-supervised algorithm has the
tendency to learn both from labelled and unlabelled data. Semi-supervised machine
learning gives high accuracy with a minimum annotation work. Semi-supervised
machine learning uses mostly unlabelled data together combined with labelled data
to give better classifiers. As less annotation work is enough to give good accuracy,
humans have less work to do here.
Reinforcement Machine Learning
Reinforcement learning learns its behaviour from a trial and error method in a dy-
namic environment. Here, the problem is solved by taking an appropriate action in
a certain situation to maximize the output and to obtain the acquired results. In
Reinforcement Learning, there is presentation of the input or output data. Instead,
when the desired action is chosen, the agent is immediately told the reward and the
next state are not considering the long terms actions. For the agent to act optimally
it should have the knowledge about states, rewards, transitions and actions actively.
Formally,the model consists of [22]:
• a discrete set of environment states, S;
• a discrete set of agent actions, A;
• a set of scalar reinforcement signals; typically {0;1} or the real numbers.2.1. Algorithms 7
2.1 Algorithms
During our research, we have investigated three algorithms through which we have
performed supervised classification.
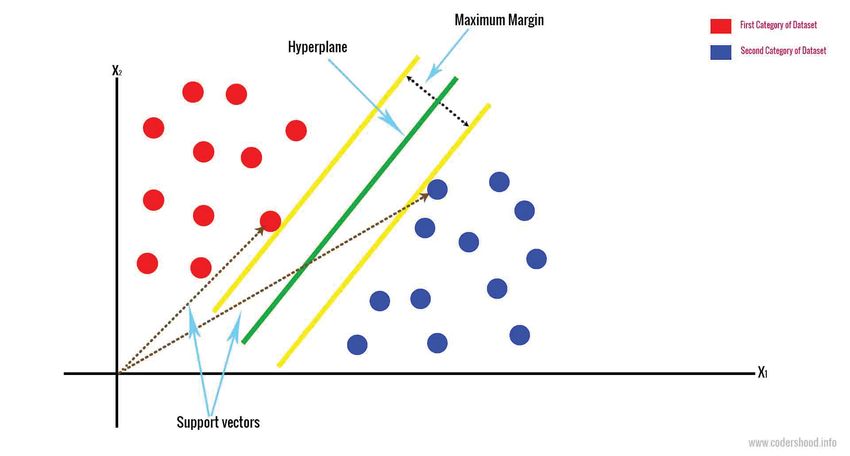
Support Vector Machines(SVM)
Support Vector Machines performs classification by constructing N-dimensional hy-
per plane that separates the data into two categories [12]. In SVM, the predictor
variable is called an attribute and the transformed attribute is called a feature. Se-
lecting the most suitable representative data is called feature selection. A set of
feature describing one case is called a vector.
The ultimate goal of SVM modelling is to find the optimal hyper plane that
separates the clusters where on one side of the plane there is target variable and on
the other side of the plane other category. The vectors which are near the hyper
plane are the support vectors[12].In Figure 2.1, a typical example of support vector
machine is depicted.
Figure 2.1: Support Vector Machine[7]
Artificial Neural Networks(ANN)
ANNs are an attempt, in the simplest way, to imitate the neural system of the
human brain [53]. The basic unit of ANN are neurons. A neuron is said to perform
functions on an input and produces an output [56]. Neurons combined together are
called neural networks. Once the neural networks are formed, training of the data is
started to minimize the error. In the end, an optimizing algorithm is used to further
reduce the errors. The layered architecture of Artificial Neural Networks (ANNs) is
represented in Figure 2.2.8 Chapter 2. Background
Figure 2.2: Neural Network [56]
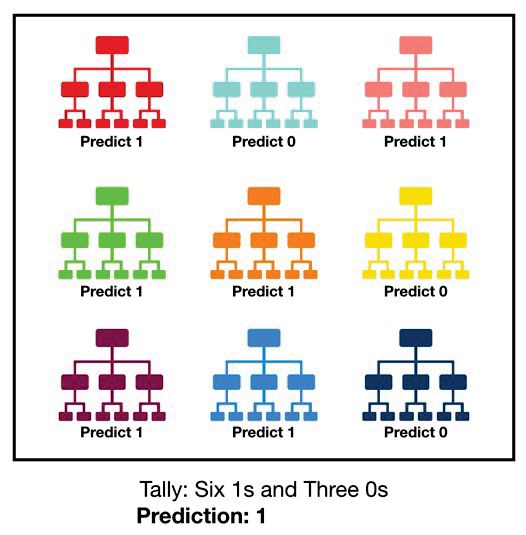
Random Forests(RF)
The random sampling and ensemble strategies utilized in RF enable it to achieve ac-
curate predictions as well as better generalizations [40]. The random forests consists
of large number of trees. The higher the number of uncorrelated trees, the higher
the accuracy [54]. Random Forest classifiers can help filling some missing values.
Prediction in Random Forests (RFs) is represented in Figure 2.3.
Figure 2.3: Visualization of Random Forest making a prediction. [54]Chapter 3
Related Work
Nanshan Chen et al. performed a retrospective, single-centre study of various pa-
tients data from Jinyintan Hospital in Wuhan, China. In this research they described
the epidemiological data(short term) or long term exposure to virus epicenters, signs
and symptoms, laboratory results, CT Findings and clinical outcomes[16]. Though
this research does not directly focus on the prediction of COVID-19, it gives us a
better understanding of the clinical outcomes.
Shuai Wang et al. has identified the radio-graphical changes in CT images of pa-
tients suffering from COVID-19 in China. In this research, he has used deep learning
methods to extract COVID-19’s graphic features through the CT scan images to
develop it as a alternative diagnostic method. They have collected CT images of
confirmed COVID-19 Patients along with those who were diagnosed with pneumo-
nia. The results from their work provide the proof-of-principle for the use of AI for
accurate COVID-19 prediction[47]. This research uses CT Scan images, which is
different from our research as we use clinical features and laboratory results for the
prediction.
Dawei Wang et al. in this research has described the epidemiological, demographic,
clinical, laboratory, radio-logical and treatment data from Zhongnan Hospital, Wuhan
China. The data was analysed and documented to be used to track the infections[46].
The author gives better insights about the radio-logical and treatment data that
could be used for our prediction of COVID-19 in our model.
Halgurd S. Maghdid et al. have proposed a new framework to detect corona virus
disease using the inboard smartphone sensors. The designed AI framework collects
data from various sensors to predict the grade of pneumonia as well as predicting
the infection of the disease [26]. The proposed framework takes uploaded CT Scan
images as the key method to predict COVID-19. This framework relies on multi-
readings from multiple sensors related to the symptoms of COVID-19.
Ali Narin et al. has developed an automatic detection system as an alternative di-
agnosis option of COVID-19. In this study, "three different convolutional neural
network based models (ResNet50, InceptionV3 and Inception-ResNetV2) have been
proposed for the detection of corona virus pneumonia infected patient using chest
X-ray radio graphs [32]". The author also discusses about the classification perfor-
mance accuracy between the three CNN models.
910 Chapter 3. Related Work In [52], the authors proposed a three-indices based model to predict the mortality risk. They built a prognostic prediction model based on XGBoost machine learning algorithm to predict the mortality risk in patients. They determined a clinical route which is simple to check and asses the risk of death. The research focuses on the mortality risk which is different from our research, where the prediction is completely based on the clinical findings of patients suffering from COVID-19. The authors in the article [9], presented a comparative analysis of machine learning models to predict the outbreak of COVID-19 in various countries. Their study and analysis demonstrate the potential of machine learning models for the prediction of COVID-19. The article was based entirely on the outbreak of cases in various coun- tries. In our work we predict the disease by using the clinical information. In [38], the authors performed bench-marking evaluation of various machine learning algorithms, deep learning algorithms and various ICU scoring systems on various clinical prediction tasks. This task was conducted with publicly available clinical data sets. In our work we specifically work on the COVID-19 patient information. In the above mentioned papers, various prediction systems were developed using CT Scan images and symptoms for prediction of COVID-19, mortality risks, outbreak in various countries. As per the existing knowledge, there is not much evidence of pre- diction system using clinical information. This thesis will be using machine learning techniques to predict COVID-19 with clinical information of patients suffering from COVID-19. It will also determine which features would impact the prediction model.
Chapter 4
                                                                     Method

The research methods we used here are Literature review and Experiment. Firstly, we
performed a systematic literature review where we carefully analysed the literature
and from the results we conducted an experiment for research question 1 through
which we identified suitable machine leaning techniques for prediction. For research
question 2, we conducted an experiment, where we determined what features would
influence the results of the prediction of COVID-19.

4.1     Literature Review
A systematic literature through the guidelines of Claes Wohlin[49] and Barbara
Kitchenham[24], has been conducted to analyze and answer RQ1. This literature
review focuses on the understanding of several machine learning algorithms and also
identifying appropriate machine learning algorithms that can be used for prediction.
There are several steps that we performed in our research, which are:
  1. Identifying the key words: We have identified the following keywords which
     are Supervised Machine Learning algorithms, COVID19, classification, predic-
     tion.

  2. Formulating the search strings: From the above identified keywords, pri-
     mary keywords were selected to formulate the search string.

  3. Locating the literature: Using search string, the search was performed on
     various digital database platforms such as Google scholar, IEEE and Science
     Direct.

  4. Following the Inclusion and Exclusion criteria for selection: From the
     collected literature such as articles and conference papers, the inclusion and
     exclusion criteria is implemented to confine our research.
      Inclusion Criteria

        • Papers related to prediction of COVID-19 using Machine Learning algo-
          rithms.
        • All articles should be in English language.

      Exclusion Criteria

        • Incomplete articles.

                                        11
12 Chapter 4. Method
• Articles not in English are not considered.
5. Evaluating and selecting the literature: After the implementation of the
inclusion and exclusion criteria, further the refining is done through careful
evaluation and selection of the gathered literature.
6. Summarizing the literature: The overall findings from the gathered litera-
ture is summarized and represented for analysis.
4.2 Experiment
An experiment is conducted with the results achieved from the SLR (Systematic
Literature Review) to reach the goals of RQ1 where we identify the suitable machine
learning technique for prediction of COVID-19. The experiment is further continued
to build a model of prediction with the selected algorithm to determine RQ2 where
the factors that influence the prediction are identified.
4.2.1 Software Environment
Python
Python is a high level and effective general use programming language. It supports
multi-paradigms. Python has a large standard library which provide tools suited
to perform various tasks. Python is a simple, less-clustered language with extensive
features and libraries. Different programming abilities are utilized for performing the
experiment in our work. In this thesis, the following python libraries were used [45].
• Pandas - It is a python package that provides expressive data structures de-
signed to work with both relational and labelled data. It is an open source
python library that allows reading and writing data between data structures
[30].
• Numpy - It is an open source python package for scientific computing. Numpy
also adds fast array processing capacities to python [29].
• Matplotlib - It is an open source python package used for making plots and
2D representations. It integrates with python to give effective and interactive
plots for visualization [29].
• Tensorflow - It is a mathematical open source python library designed by
Google Brain Team for Machine intelligence [55].
• Sklearn - It is an open source python machine learning library designed to
work alongside Numpy. It features various machine learning algorithms for
classification, clustering and regression.4.2. Experiment 13
4.2.2 Dataset
Data Collection
Data collection was an essential and protracted process. Regardless the field of
research, accuracy of the data collection is essential to maintain cohesion. As the
clinical information of patients was not publicly available, it was an inflexible and
tedious process to collect the data. Various Hospitals and Health Institutes in Sweden
and China were approached to get the most accurate data but due to the present
situation at hospitals with heavy inflow of patients with COVID-19, we couldn’t get
access to direct information. An intense search was conducted on various databases
to gather open source clinical information of patients diagnosed with COVID-19.
Dataset Used
The data set that was used to train the model to predict COVID-19 was gathered
from an open source data shared by Yanyan Xu at a repository figshare[51]. The
data set contained information about hospitalized patients with COVID-19. It in-
cluded demographic data, signs and symptoms, previous medical records, laboratory
values that were extracted from electronic records. To train the model with equal
records of patients with negative samples another data set from Kaggel repository
was used[4]. The original data-set contained details of medications followed by the
doctors to cure the disease. As our model doesn’t require such data, those fields have
been eliminated. The data-set is a combined multi-dimensional data. Some of the
data gives information whether the patient is diagnosed with a particular disease in
the past such as Renal Diseases, Digestive Diseases and other data contains precise
clinical values obtained previously. It contains fields with textual data and some
with precise values. Textual data was encoded with integer values for experimental
setup. The attributes that were considered in the data-set for the machine learning
model are presented in Table 4.1.
Feature Number Feature Name
1 Days from onset of symptoms to hospital admission
2 Gender
3 Clinical Classification
4 Age
5 Respiratory system disease
6 Comorbidity
7 Fatigue
8 Cardiovascular and cerebrovascular disease
9 Malignant tumor
10 Patient Condition
11 Digestive system disease
12 Renal disease
13 Chest tightness
14 Fever
15 Cough14 Chapter 4. Method
16 Liver disease
17 Endocrine system disease
18 Diarrhea Chest
19 CT findings - Advances, Absorption
20 White Blood Cell Count
21 Neutrophil count
22 Lymphocyte count
23 Monocyte count
24 CRP - C-reactive protein
25 PCT - Procalcitonin
Table 4.1: Features in the dataset used.
4.2.3 Data Preprocessing
Data preprocessing is an important process in development of machine learning
model. The data collected is often loosely controlled with out-of-range values, miss-
ing values, etc. Such data can mislead the result of the experiment.
• Imputation of missing values - In our data, missing values have been handled
by using simple imputer from sklearn python package. The missing values are
replaced by using mean strategy.
• Encoding Categorical Data - We used the package of OneHotEncoder in python,
this package handles categorical data by one-hot or dummy encoding scheme.
4.2.4 Implementation
The experiment was conducted in the Python IDLE, which is a default integrated
development and learning environment for python. The experiment was conducted
in various phases that are mentioned below:
• After data collection, the patients data is divided into record sets containing
100 records, 150 records, 200 records, 250 records, 300 records, 355 records
respectively.
• A 5-fold cross validation technique is used to randomize the testing data-set
to get accurate results. Experiment on each machine learning algorithm is
conducted by 5-fold cross validation with each of the record sets.
• The prediction accuracy of each algorithm at each record set is compared and
evaluated for selecting the suitable algorithm for this data-set.
• A feature importance experiment is conducted to evaluate the importance of
each attribute on the artificial classification task.4.2. Experiment 15
4.2.5 Algorithm Configurations
In this section, the configuration of the algorithms is mentioned. Changes made to
the configuration of the algorithm can effect the results.
• Support Vector Machines:
SVC(kernel = ’linear’, random_state = 0)
• Artificial Neural Networks:
Layers:
ann.add(tf.keras.layers.Dense(units=6, activation=’relu’))
ann.add(tf.keras.layers.Dense(units=6, activation=’relu’))
ann.add(tf.keras.layers.Dense(units=1, activation=’sigmoid’))
Compiling the ANN:
ann.compile(optimizer = ’adam’, loss = ’binary_crossentropy’, metrics = [’ac-
curacy’])
• Random Forests:
RandomForestClassifier(n_estimators = 10, criterion = ’entropy’, random_state
= 0)
4.2.6 Performance Metrics
It is an essential task to measure the performance of a machine learning model. As
our model requires classification, we have used accuracy as the performance metric.
Accuracy
Accuracy is the metric used in this thesis for evaluation of the algorithms. It is the
most used performance metric to evaluate classification techniques. This measure
allows us to understand which model is best at identifying patterns in training set
to give better predictions in the unknown test data-set.
TP + TN
Accuracy =
TP + TN + FP + FN
Where TP = True Positives, TN = True Negatives, FP = False Positives, and
FN = False Negatives.Chapter 5
Results
5.1 Literature Review Results
A Systematic Literature Review (SLR) is conducted in order to answer RQ1. Which
machine learning technique can be used to predict COVID-19? The goal of the SLR is
to identify the most suitable algorithms that would facilitate for accurate prediction
of COVID-19.
Title Findings
This paper determines the most efficient classifi-
cation algorithm based on a clinical data-set (Di-
Supervised machine learning abetics). Seven supervised machine learning al-
algorithms: classification and gorithms were considered concluding SVM (Sup-
comparison [34]. port Vector Machines) followed by RF (Random
Forests) that were found with most precision and
accuracy [34].
The author stated that no single supervised al-
gorithm can outperform other algorithms over all
Emerging artificial intelli-
data-sets. The simplest approach is to estimate
gence applications in com-
the accuracy of the algorithms and choose the
puter engineering: real word
suitable one. But in general, SVM (Support Vec-
AI systems with applications
tor Machines) and ANN (Artificial Neural Net-
in E-health [27].
works) tend to perform better when dealing with
multi-dimensional and continuous features [27].
Of all the six algorithms that were compared in
An empirical comparison this paper, Calibrated Boosted trees, Random
of supervised learning algo- Forests give best performance in all metrics. Ar-
rithms [15]. tificial Neural Networks has reached its peak per-
formance with large datasets [15].
Logistic regression acquires highest accuracy
Performance evaluation of
among the compared algorithms followed by Ar-
different machine learning
tificial Neural Networks. SVM (Support Vector
techniques for prediction of
Machines) on the other hand acquires highest pre-
heart disease [19].
cision [19].
1718 Chapter 5. Results
In this paper, an exhaustive bench marking eval-
Bench marking deep learn- uation has been performed to demonstrate that
ing models on large health- deep learning algorithms outperform other ap-
care data-sets [38]. proaches when large number of clinical time series
data is used for prediction tasks [38].
A comparative study classification algorithms like
Decision Tree Induction, Bayesian Network, Neu-
ral Network, K-nearest neighbours and Support
A comparative study of train-
Vector Machine has been conducted to justify
ing algorithms for supervised
that each algorithm has its own field of excellence.
machine learning [14].
They suggested that one can use an algorithm for
their data by comparing the metrics they require
[14].
In this paper, a comparison between Support Vec-
tor Machine (SVM), Decision Tree (C4.5), Naive
Using machine learning algo- Bayes (NB) and k Nearest Neighbors (k-NN) on
rithms for breast cancer risk the Wisconsin Breast Cancer (original) data-sets
prediction and diagnosis [10]. is conducted in terms of accuracy and precision.
SVM is determined to get the highest accuracy
among all other algorithms [10].
Though this paper belongs to a different domain,
as accuracy comparison between algorithms is
performed it has been considered. Machine learn-
Automatic short-term solar
ing algorithms such as Cascade-Correlation Neu-
flare prediction using ma-
ral Networks (CCNNs), Support Vector Machines
chine learning and sunspot
(SVMs) and Radial Basis Function Networks
associations [39].
(RBFN) to conclude that SVM gives highest ac-
curacy. Hybrid model is suggested to be used
based on the datasets [39].
In this research a intelligent heart disease pre-
diction system is developed with Decision Trees,
Intelligent heart disease pre-
Naive Bayes and Artificial Neural Network to
diction system using data
compare the performance. The results of the
mining techniques [35].
research state that each technique has its own
strength in uniquely defined mining goals [35].
In this research Decision trees, Artificial Neural
Networks, Support Vector Machines and Logis-
tic Regression are compared to develop prediction
Analysis of cancer data: a
models for prostate cancer survivability. Support
data mining approach [17].
Vector Machines have been found as the most
accurate followed by Artificial Neural Networks
[17].5.1. Literature Review Results 19
A predictive model to predict mortality rate has
Medical data mining and pre- been designed with Decision Tree, Bayes Net-
dictive model for colon cancer works, and Artificial Neural Network. After the
survivability [33]. experiment, results show that Artificial Neural
Networks give accurate classifications [33].
A comparative experiment on Random Forest,
Support Vector Machine, Naive Bayes, Decision
Tree, Neural Networks and Logistic Regression
Analysis of Machine Learn- has been conducted using Weka (Waikato Envi-
ing Algorithms on Cancer ronment for Knowledge Analysis) tool with Can-
Dataset [37]. cer dataset. The results conclude that Support
Vector Machines (SVMs) have the highest accu-
racy followed by Artificial Neural Networks and
Random Forest [37].
A comparative experiment has been conducted on
Analytical Comparison of
4 machine learning algorithms trained with liver
Machine Learning Tech-
dataset. The results show that Random Forests
niques for Liver Dataset
is the most suitable algorithm among the others
[41].
[41].
The article is a comparative study of Decision
Tree (DT), Artificial Neural Network (ANN), and
Predicting the severity of
Support Vector Machine (SVM) which are an-
breast masses with data min-
alyzed on mammographic masses dataset. The
ing methods [31].
results summarize that SVM perform with the
highest accuracy followed by ANN [31].
This article gives a comparison of various data
mining techniques, summarizes that no single al-
Data mining applications in
gorithm can be decided as the most suitable for
healthcare sector: a study
healthcare sector. They suggested that a compar-
[18].
ative experiment must be conducted to get accu-
rate results [18].
In this research a comparison experiment on
A Machine Learning Ap- Naive Bayes, Logistic Regression and Random
proach for Early Prediction of Forest has been conducted using Breast Cancer
Breast Cancer [28]. dataset. The results summarize that Random
Forest gives the most accurate predictions [28].
Seven algorithms that include Logistic Regres-
Comparison of seven algo- sion model, Artificial Neural Network (ANN),
rithms to predict breast Can- Naive Bayes, Bayes Net, Decision Trees with
cer survival contribution to naive Bayes, Decision Trees (ID3) and Decision
21 century intelligent tech- Trees (J48) have been compared in various met-
nologies and bioinformatics rics. It is stated that Logistic regression model
[20]. gives highest accuracy followed by Artificial Neu-
ral Networks which also has highest precision [20].20 Chapter 5. Results
In this article, the experimental results state that
it is difficult to choose one algorithm superior to
A study on classification tech-
another. It summarizes that classification algo-
niques in data mining [23].
rithms are strictly confined to their problem do-
main [23].
A study of various classification algorithms has
A critical study of selected been performed through which Support Vec-
classification algorithms for tor Machine (SVM) and K-Nearest Neighbour
liver disease diagnosis [42]. (KNN) are summarized as the algorithms with
most accuracy and precision [42].
Comparison of machine
A comparison of four machine learning algo-
learning algorithms to pre-
rithms has been performed and Support Vec-
dict psychological wellness
tor Machine (SVM) and K-Nearest Neighbour
indices for ubiquitous health-
(KNN) are identified as the best performers [36].
care system design [36].
A comparative experimental model between Deci-
Constructing Inpatient Pres-
sion Tree, Logistic Regression, and Random For-
sure Injury Prediction Mod-
est has been conducted and identified that Ran-
els Using Machine Learning
dom Forests give the most accurate predictions
Techniques [21].
[21].
Table 5.1: Literature Review Results.
Numerous works using machine learning algorithms in healthcare domain were
identified in the Systematic Literature Review (SLR). Most of the articles included a
comparison between machine learning techniques. As per [14], [35], [18], [23], health-
care datasets require comparison between algorithms to identify the most suitable
one. Support Vector Machines(SVMs), Artificial Neural Networks (ANNs) and Ran-
dom Forests(RFs) are identified as the most utilized algorithms when accuracy is the
performance metric.
5.2 Experiment Results
This chapter presents the results that are obtained from the experiment. The per-
formance metric mentioned in Section 4.2.5 is utilized to evaluate the performance of
the algorithms that were selected after the Literature Review. Three algorithms that
were identified as the most suitable for the classification task to predict COVID-19
are:
• SVM (Support Vector Machine).
• RF (Random Forests).
• ANN (Artificial Neural Networks).5.2. Experiment Results 21
Each of the above stated algorithms were trained with the data-set that was col-
lected and results were interpreted. Performance of each algorithm was evaluated at
different stages of training set. Each algorithm was trained with records sets con-
taining 100 records, 150 records ,200 records, 250 records, 300 records, 355 records
respectively. This experiment is performed to obtain which algorithm would be the
most suitable for prediction of COVID-19. Also, as the data is split into smaller sets,
we could also asses which algorithm would perform better with different datasets
available.
5.2.1 Support Vector Machine (SVM) Results
Support Vector Machine (SVM) algorithm is trained with each record sets to identify
its accuracy at all stages. At all stages, the data was divided into training and test
data by using k-fold cross validation (5-folds). SVM achieves an accuracy of 98.33%.
Table 5.2 represent the accuracy for every set of records achieved by Support Vector
Machine (SVM) algorithm.
Number of
Patient Accuracy
Records
100 94.73%
150 96%
200 97.36%
250 97.18%
300 97.71%
355 98.33%
Table 5.2: Support Vector Machine (SVM) Accuracy Results
Figure 5.1: Support Vector Machine (SVM) Accuracy Chart22 Chapter 5. Results
The classification accuracy of Support Vector Machine (SVM) at each record set can
be clearly identified from the chart in Figure 5.1
5.2.2 Random Forest (RF) Results
Random Forest (RF) algorithm is trained in a similar way with each records set to
identify its accuracy at all stages. At all stages, the data was divided into training
and test data by using k-fold cross validation (5-folds). RF achieves an accuracy of
99.44%. The classification accuracy of Random Forest (RF) algorithm for every set
of records is represented in Table 5.3.
Number of
Patient Accuracy
Records
100 93.33%
150 96.15%
200 96.29%
250 98.36%
300 98.66%
355 99.44%
Table 5.3: Random Forest (RF) Accuracy Results
Figure 5.2: Random Forest (RF) Accuracy Chart
The classification accuracy of Random Forest (RF) at each record set can be
identified from the chart in Figure 5.2. The figure represents the change in accuracy
while using each record set as training data.5.2. Experiment Results 23
5.2.3 Artificial Neural Networks (ANN) Results
Artificial Neural Networks (ANN) Algorithm is trained on data with record sets and
tested. On implementing ANN Algorithm, it achieves an classification accuracy of
99.25%. The classification accuracy reported with each record set is tabulated in
Table 5.4.
Number of
Patient Accuracy
Records
100 80.00%
150 86.20%
200 90.90%
250 96.07%
300 98.65%
355 99.25%
Table 5.4: Artificial Neural Networks (ANN) Accuracy Results
Figure 5.3: Artificial Neural Networks (ANN) Accuracy Chart
The accuracy of Artificial Neural Networks (ANN) with each record set is represented
in Figure 5.3.
5.2.4 Results Comparison
Based on the experiments conducted, the overall accuracy results are tabulated for
comparison in Table 5.5. A pictorial representation of performance of each algorithm
at different record sets is presented in Figure 5.4.24 Chapter 5. Results
Artificial
Support Vector
Number of Neural
Machine Random Forest
Patient Networks
(SVM) (RF) Accuracy
Records (ANN)
Accuracy
Accuracy
100 0.9473 0.9333 0.8%
150 0.96 0.9615 0.862%
200 0.9736 0.9629 0.909%
250 0.9718 0.9836 0.9607%
300 0.9771 0.9866 0.9865%
355 0.9833 0.9944 0.9925%
Table 5.5: Comparison using Performance Metric - accuracy
Figure 5.4: Performance Comparison Chart
5.2.5 Feature Importance Results
The importance of all the features in the data set are calculated using feature im-
portance experiment conducted through feature_importance package from sklearn
python. The calculated values have been represented in Table 5.6. Features in the
table are arranged as per the feature values calculated.
The values calculated for feature importance are represented in a pictorial repre-
sentation in Figure 5.5.
It was identified that the accuracy of the selected machine learning algorithms
was not changed while eliminating 3 least important features. After each feature
elimination the experiment was re-conducted and the same results are identified.5.2. Experiment Results 25
Feature Feature
Feature Name
Number Value
Chest CT findings -
18 0.155567
Advances, Absorption
13 Fever 0.135102
21 Lymphocyte count 0.133192
4 Respiratory system disease 0.122220
14 Cough 0.094820
24 PCT - Procalcitonin 0.073363
22 Monocyte count 0.058456
20 Neutrophil count 0.056516
3 Age 0.043897
23 CRP - C-reactive protein 0.041181
19 White Blood Cell Count 0.033647
5 Comorbidity 0.012231
6 Fatigue 0.008432
12 Chest tightness 0.006842
2 Clinical Classification 0.004787
Cardiovascular and
7 0.003711
cerebrovascular disease
17 Diarrhea 0.002848
1 Gender 0.002814
8 Malignant tumor 0.002763
10 Digestive system disease 0.002654
Days from onset of symptoms
0 0.002272
to hospital admission
15 Liver disease 0.001315
16 Endocrine system disease 0.001202
9 Patient Condition 0.000153
11 Renal disease 0.000016
Table 5.6: Feature Importance26 Chapter 5. Results
Figure 5.5: Feature Importance ChartChapter 6
Analysis and Discussion
6.1 Analysis of Literature Review
According to the results obtained from the Systematic Literature Review (SLR),
RQ1 could not be answered thoroughly. In many works, a clear comparison between
various machine learning algorithms has been conducted deliberately but the con-
clusion couldn’t be achieved. A comparison model was suggested in [14], [35], [18],
[23].
Considering the results from a set of literature, a particular set of algorithms
that include: Support Vector Machine (SVM), Artificial Neural Networks (ANNs)
and Random Forests (RF) were chosen to perform an experimental evaluation to
select the most suitable algorithm to predict COVID-19.
6.2 Analysis of Experiment
The experiment was conducted in 2 phases :
• Evaluation of machine learning algorithms selected from the Literature Review
to answer RQ1.
• Feature importance generation for identifying the impact of a particular feature
on the prediction of COVID-19 through which RQ2 is answered.
6.2.1 Experiment Phase 1
Quantitative results are analysed with calculated accuracy for each machine learning
algorithm to identify the most suitable algorithm for prediction of COVID-19.
• Support Vector Machines (SVMs) showed better results with smaller training
data records when compared to other algorithms. There was no much difference
observed in the accuracy of prediction when the number of records increased.
• Random Forests (RFs) was found to be the most reliable algorithm among the
other algorithms for prediction of COVID-19. Though ruled out by SVMs for
smallest number of records, RFs showed consistent growth in accuracy at all
stages. RFs has the highest accuracy for classification almost at every record
set used.
2728 Chapter 6. Analysis and Discussion
• Artificial Neural Networks (ANNs) is identified as the most progressive algo-
rithm among the others. In spite of having the lowest accuracy at smaller
record sets, ANNs have shown a consistent growth in accuracy levels as the
number of records in the dataset increase.
It is observed that Random Forests (RFs) comparatively performs better in terms
of accuracy when compared with Support Vector Machines (SVMs) and Artificial
Neural Networks (ANNs).
6.2.2 Experiment Phase 2
Experiment Phase 2 is conducted in order to answer RQ2. The aim of this experi-
ment is to identify which features in the dataset influence the predictive result. A
descending list of factors that effect the prediction of COVID-19 are tabulated in
Table 5.6.
6.3 Discussion
RQ1: Which suitable machine learning technique can be used to predict
COVID-19?
By conducting a literature review, several works were considered in connection
with the research question and the domain of research. It was concluded that no
single algorithm can be marked as the most suitable algorithm. Each technique has
its own positives. A set of algorithms were selected which include: Support Vector
Machine (SVM), Artificial Neural Networks (ANNs) and Random Forests (RF) were
chosen to perform a comparative analysis. For the chosen set of algorithms, accuracy
at various stages is analyzed and evaluated. From the results of the experiment,
Random Forest (RF) is identified as the suitable machine learning technique that
can be used to predict COVID-19.
RQ2: What are the features that will influence the predictive result of
COVID-19?
The influence of all the features in the data are calculated by the experiment
conducted. The features that show a major change in the prediction are tabulated
in Table 6.1. The features that have no affect in the prediction are tabulated in
Table 6.2. When features with no affect in the prediction are removed, there was no
difference in the accuracy of prediction.6.4. Validity Threats 29
Feature
Feature Name
Value
Chest CT findings -
0.155567
Advances, Absorption
Fever 0.135102
Lymphocyte count 0.133192
Respiratory system disease 0.122220
Table 6.1: Features that majorly affect the Prediction.
Feature
Feature Name
Value
Days from onset of symptoms
0.002272
to hospital admission
Liver disease 0.001315
Endocrine system disease 0.001202
Patient Condition 0.000153
Renal disease 0.000016
Table 6.2: Features that have no affect the Prediction.
6.4 Validity Threats
In this section various threats that were identified and mitigated during this research
are mentioned.
6.4.1 Internal Validity
One of the internal validity that was identified is the summarising of the literature
review. A wrong set of algorithms chosen could change the entire course of the
research. To overcome this threat, proper observation was done on the Literature
review study in an iterative approach.
6.4.2 External Validity
Improper data pre-processing would affect the results of the experiment, to avoid
this the data is checked multiple times after pre-processing. To avoid over fitting,
k-fold cross validation has been equipped.Chapter 7
Conclusions and Future Work
In this research, a systematic literature review has been conducted to identify the
suitable algorithm for prediction of COVID-19 in patients. There was no pure ev-
idence found to summarize one algorithm as the suitable technique for prediction.
Hence, a set of algorithms which include Support Vector Machine (SVM), Artificial
Neural Networks (ANNs) and Random Forests (RF) were chosen. The selected algo-
rithms were trained with the patient clinical information. To evaluate the accuracy
of machine learning models, each algorithm is trained with record sets of varying
number of patients. Using accuracy performance metric, the trained algorithms were
assessed. After result analysis, Random Forest (RF) showed better prediction accu-
racy in comparison with both Support Vector Machine (SVM) and Artificial Neural
Networks (ANNs). The trained algorithms were also assessed to find the features
that affect the prediction of COVID-19 in patients.
There is a lot of scope for Machine Learning in Healthcare. For Future work,
it is recommended to work on calibrated and ensemble methods that could resolve
quirky problems faster with better outcomes than the existing algorithms. Also an
AI-based application can be developed using various sensors and features to identify
and help diagnose diseases.
As healthcare prediction is an essential field for future, A prediction system that
could find the possibility of outbreak of novel diseases that could harm mankind
through socio-economic and cultural factor consideration can be developed..
31References
[1] Coronavirus Disease (COVID-19) - events as they happen. Library Catalog:
www.who.int.
[2] Countries where Coronavirus has spread - Worldometer. Library Catalog:
www.worldometers.info.
[3] COVID-19 situation reports. Library Catalog: www.who.int.
[4] Diagnosis of covid-19 and its clinical spectrum dataset.
url=https://kaggle.com/einsteindata4u/covid19.
[5] WHO Director-General’s remarks at the media briefing on 2019-nCoV on 11
February 2020. Library Catalog: www.who.int.
[6] WHO EMRO | Questions and answers | COVID-19 | Health topics.
[7] Support Vector Machine Machine learning algorithm with example and code,
January 2019. Library Catalog: www.codershood.info Section: Machine learn-
ing.
[8] Ali Al-Hazmi. Challenges presented by MERS corona virus, and SARS corona
virus to global health. Saudi journal of biological sciences, 23(4):507–511, 2016.
Publisher: Elsevier.
[9] Sina F Ardabili, Amir Mosavi, Pedram Ghamisi, Filip Ferdinand, Annamaria R
Varkonyi-Koczy, Uwe Reuter, Timon Rabczuk, and Peter M Atkinson. Covid-19
outbreak prediction with machine learning. Available at SSRN 3580188, 2020.
[10] Hiba Asri, Hajar Mousannif, Hassan Al Moatassime, and Thomas Noel. Using
machine learning algorithms for breast cancer risk prediction and diagnosis.
Procedia Computer Science, 83:1064–1069, 2016.
[11] Taiwo Oladipupo Ayodele. Types of machine learning algorithms. New advances
in machine learning, pages 19–48, 2010.
[12] Taiwo Oladipupo Ayodele. Types of machine learning algorithms. New advances
in machine learning, pages 19–48, 2010. Publisher: InTech.
[13] David W Bates, Suchi Saria, Lucila Ohno-Machado, Anand Shah, and Gabriel
Escobar. Big data in health care: using analytics to identify and manage high-
risk and high-cost patients. Health Affairs, 33(7):1123–1131, 2014.
3334 References
[14] Hetal Bhavsar and Amit Ganatra. A comparative study of training algorithms
for supervised machine learning. International Journal of Soft Computing and
Engineering (IJSCE), 2(4):2231–2307, 2012.
[15] Rich Caruana and Alexandru Niculescu-Mizil. An empirical comparison of su-
pervised learning algorithms. In Proceedings of the 23rd international conference
on Machine learning, pages 161–168, 2006.
[16] Nanshan Chen, Min Zhou, Xuan Dong, Jieming Qu, Fengyun Gong, Yang Han,
Yang Qiu, Jingli Wang, Ying Liu, Yuan Wei, et al. Epidemiological and clinical
characteristics of 99 cases of 2019 novel coronavirus pneumonia in wuhan, china:
a descriptive study. The Lancet, 395(10223):507–513, 2020.
[17] Dursun Delen. Analysis of cancer data: a data mining approach. Expert Systems,
26(1):100–112, 2009.
[18] Manoj Durairaj and Veera Ranjani. Data mining applications in healthcare sec-
tor: a study. International journal of scientific & technology research, 2(10):29–
35, 2013.
[19] Ashok Kumar Dwivedi. Performance evaluation of different machine learning
techniques for prediction of heart disease. Neural Computing and Applications,
29(10):685–693, 2018.
[20] Arihito Endo, Takeo Shibata, and Hiroshi Tanaka. Comparison of seven al-
gorithms to predict breast cancer survival (< special issue> contribution to
21 century intelligent technologies and bioinformatics). International Journal
of Biomedical Soft Computing and Human Sciences: the official journal of the
Biomedical Fuzzy Systems Association, 13(2):11–16, 2008.
[21] Ya-Han Hu, Yi-Lien Lee, Ming-Feng Kang, and Pei-Ju Lee. Constructing in-
patient pressure injury prediction models using machine learning techniques.
Computers, Informatics, Nursing: CIN, 2020.
[22] Leslie Pack Kaelbling, Michael L Littman, and Andrew W Moore. Reinforce-
ment learning: A survey. Journal of artificial intelligence research, 4:237–285,
1996.
[23] G. Kesavaraj and S. Sukumaran. A study on classification techniques in data
mining. In 2013 Fourth International Conference on Computing, Communica-
tions and Networking Technologies (ICCCNT), pages 1–7, 2013.
[24] Barbara Kitchenham. Procedures for performing systematic reviews. Keele,
UK, Keele University, 33(2004):1–26, 2004.
[25] Halgurd S. Maghdid, Kayhan Zrar Ghafoor, Ali Safaa Sadiq, Kevin Curran,
and Khaled Rabie. A novel ai-enabled framework to diagnose coronavirus
covid 19 using smartphone embedded sensors: Design study. arXiv preprint
arXiv:2003.07434, 2020.You can also read


