Using MCAT Data in 2019 Medical Student Selection - Medical College Admission Test - AAMC
←
→
Page content transcription
If your browser does not render page correctly, please read the page content below

Medical College Admission Test

                            ®
                 Using MCAT Data in 2019
                 Medical Student Selection

                                    MCAT® is a program of the
                                    Association of American Medical Colleges

18-002 (06/18)                      www.aamc.org/mcat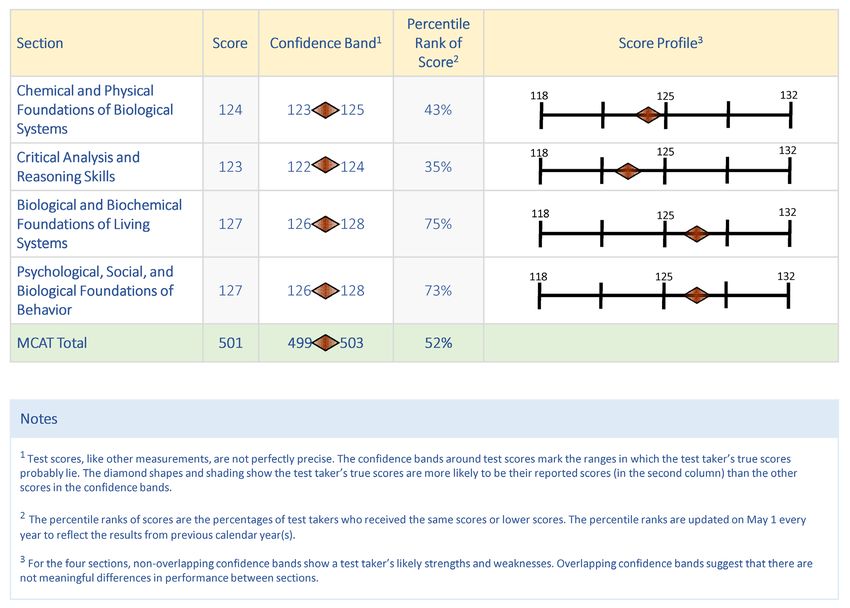
Using MCAT Data in 2019
                      ®

Medical Student Selection

       Association of American Medical Colleges
                   Washington, D.C.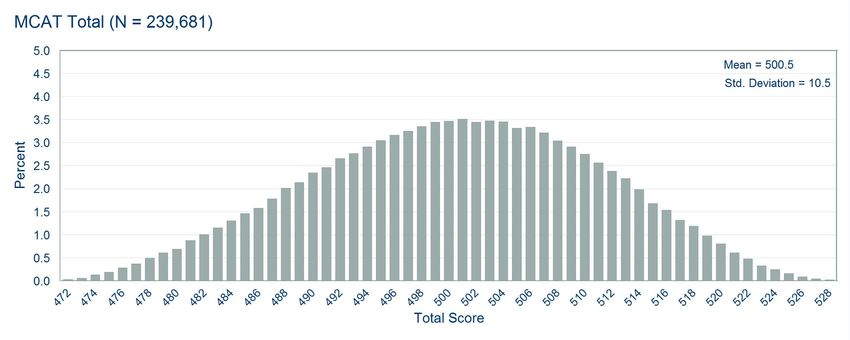
© 2018 Association of American Medical Colleges. May not be reproduced or distributed without prior
written permission.

This is a publication of the Association of American Medical Colleges (AAMC). The AAMC serves and leads
the academic medicine community to improve the health of all. www.aamc.org.
Contents
Letter to Admissions Officers  v

What does the MCAT exam measure?   1

How is the MCAT exam scored?   3

Who takes the MCAT exam?   4

How do examinees prepare for the MCAT exam?   5

How well do examinees score on the MCAT exam?   6

How precise are examinees’ MCAT scores, and how should they be interpreted?   8

How do examinees’ scores change when they retake the MCAT exam,
and how do admissions officers use scores for applicants who test more than once?   11

How do admissions officers use MCAT scores and other application data in the holistic review of applicants’
qualifications?  13

How well do undergraduate GPAs and MCAT scores predict students’ performance in medical school?   16

What else will we learn about the fairness, impact, use, and predictive validity of the MCAT exam?   22

What is the timeline for releasing key findings from the MCAT validity research?   26

Notes  27

References  27

Appendix A. Description of the Foundational Concepts, Scientific Inquiry and Reasoning Skills,
and Information-Processing Skills Tested on the Four Sections of the MCAT Exam   29

Appendix B. Summary of MCAT Total and Section Scores    34

                                                                                             Association of
                                                      iii
                                                                                             American Medical Colleges

My advice to you in 2019 student selection
This guide offers recommendations for using MCAT scores in conjunction with all the information provided by
each medical school applicant. It also describes how medical schools work with MCAT scores in the context
of holistic review.

Applicants provide admissions committees with rich information about their experiences, attributes, and
academic backgrounds through their applications, personal statements, and interviews. Letter writers also provide
information about applicants’ academic and personal competencies. Your institutional mission, goals, and priorities
provide a framework for using this rich and varied information in holistic ways to evaluate applicants and admit
a class of capable, caring students who bring diverse interests, talents, and experiences to your institution.

Holistic review practices provide the foundation for selecting applicants with the academic and personal
competencies that future physicians need. It is important to remember the following recommendations
for considering data about academic preparation in the context of all the information collected during
the admissions process.

•   Carefully consider the rich and assorted data that applicants provide. Weigh these data about applicants’
    experiences, attributes, and academic preparation in ways that help you meet your institution’s goals.

•   Triangulate score information from the MCAT exam with information about applicants’ course
    completion, grades, grade trends, institutions attended, research experience, and other academic
    indicators. You should look for consistencies and inconsistencies in the stories these data tell.

•   For MCAT scores in particular, consider the precision with which total and section scores measure
    applicants’ academic preparation. When making decisions about whom to interview and accept,
    remember: scores that are close together are not meaningfully different.

•   Scores from the MCAT exam should not outweigh other application data in deciding which applicants
    will get secondary application invitations, interview invitations, or acceptance offers.

Considering these recommendations and the data presented in this guide will help your admissions committee
construct a class that meets the academic, clinical, service, and research missions of your medical school.

Please don’t hesitate to reach out to MCAT staff at mcatvalidity@aamc.org with questions.

Sincerely,

Theodore Hall, MD
The David Geffen School of Medicine at UCLA
Associate Dean for Admissions
Director, Medical Student Education in Radiology
Chair, AAMC Group on Student Affairs Committee on Admissions (COA)

                                                                                                 Association of
                                                         v
                                                                                                 American Medical Colleges
Using MCAT Data in 2019 Medical Student Selection

What does the MCAT exam measure?
The MCAT exam is designed to help admissions committees select students who are academically prepared
for medical school. MCAT scores are among many sources of application data that admissions committees
use in student selection. The scores help admissions officers interpret grades and other academic data coming
from undergraduate institutions that have different curricular emphases and grading standards.

                   The MCAT exam tests the foundational concepts and reasoning skills
                            needed to be ready for today’s medical school.

The MCAT exam has four sections:

1. Biological and Biochemical Foundations of Living Systems

2. Chemical and Physical Foundations of Biological Systems

3. Psychological, Social, and Biological Foundations of Behavior

4. Critical Analysis and Reasoning Skills

Shown in Figure 1, the two natural sciences and the behavioral and social sciences sections of the MCAT
exam test 10 foundational concepts and four scientific inquiry and reasoning skills that are the building blocks
for learning in medical school. These sections ask test takers to combine their knowledge of concepts from
courses in first-semester biochemistry, psychology, and sociology and year-long courses in biology, chemistry,
and physics with their scientific inquiry and reasoning skills to solve problems presented in passages and test
questions. The resulting scores provide information about applicants’ readiness to learn in medical school.

The Critical Analysis and Reasoning Skills section tests how well test takers comprehend, analyze, and evaluate
what they read, draw inferences from text, and apply arguments to new ideas and situations. The passages are
drawn from the humanities and social sciences. All the information test takers need to respond to the questions
on this section appears in the passages or in the questions themselves (see Figure 1).

Appendix A provides more detailed descriptions of the concepts and reasoning skills tested by each of the
four sections of the exam.

                                                                                              Association of
                                                       1
                                                                                              American Medical Colleges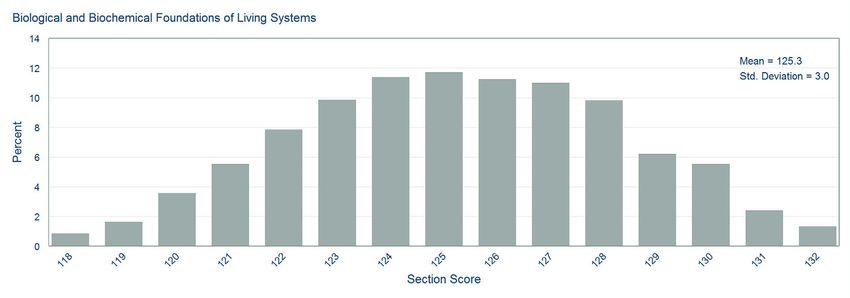
Using MCAT Data in 2019 Medical Student Selection

Figure 1. Foundational concepts and scientific inquiry and reasoning skills tested on the MCAT exam.

 Biological and Biochemical Foundations of Living Systems

                            Biomolecules have unique properties that
                            determine how they contribute to the structure
 Foundational Concept 1
                            and function of cells and how they participate
                            in the processes necessary to sustain life.
                            Highly organized assemblies of molecules, cells,
 Foundational Concept 2     and organs interact to carry out the functions         Scientific Inquiry and Reasoning Skills
                            of living organisms.
                                                                                   MCAT questions on these three sections
                            Complex systems of tissues and organs sense the        ask test takers to solve problems using
                            internal and external environments of multicellular    the following scientific inquiry and
 Foundational Concept 3     organisms and, through integrated functioning,         reasoning skills.
                            maintain a stable internal environment within
                            an ever-changing external environment.                 Knowledge of Scientific Concepts
                                                                                   and Principles
                                                                                   • Demonstrating understanding of scientific
 Chemical and Physical Foundations of Biological Systems                             concepts and principles
                                                                                   • Identifying the relationships between
                            Complex living organisms transport materials,
                                                                                     closely related concepts
                            sense their environment, process signals, and
 Foundational Concept 4
                            respond to changes using processes that can
                                                                                   Scientific Reasoning and Problem Solving
                            be understood in terms of physical principles.
                                                                                   • Reasoning about scientific principles,
                            The principles that govern chemical interactions         theories, and models
                            and reactions form the basis for a broader             • Analyzing and evaluating scientific
 Foundational Concept 5                                                              explanations and predictions
                            understanding of the molecular dynamics
                            of living systems.
                                                                                   Reasoning About the Design
                                                                                   and Execution of Research
 Psychological, Social, and Biological Foundations of Behavior                     • Demonstrating understanding of important
                                                                                     components of scientific research
                            Biological, psychological, and sociocultural factors
                                                                                   • Reasoning about ethical issues in research
 Foundational Concept 6     influence the ways that individuals perceive, think
                            about, and react to the world.                         Data-Based and Statistical Reasoning
                            Biological, psychological, and sociocultural factors   • Interpreting patterns in data presented
 Foundational Concept 7                                                              in tables, figures, and graphs
                            influence behavior and behavior change.
                                                                                   • Reasoning about data and drawing
                            Psychological, sociocultural, and biological             conclusions from them
 Foundational Concept 8     factors influence the way we think about
                            ourselves and others.
                            Cultural and social differences influence
 Foundational Concept 9
                            well-being.
                            Social stratification and access to resources
 Foundational Concept 10
                            influence well-being.

 Critical Analysis and Reasoning Skills

 Examinees demonstrate their information processing skills in three areas.

 Foundations of             • Understanding basic components of the text, such as the main idea and conclusions
 Comprehension              • Inferring meaning from rhetorical devices, word choice, and text structure
 Reasoning Within           • Integrating different components of the text to increase comprehension or analysis
 the Text
                            • Applying or extrapolating ideas from the passage to new contexts, situations, possibilities,
 Reasoning Beyond
                              alternatives, options, or proposals
 the Text
                            • Assessing the impact of introducing new factors, information, or conditions to ideas from the passage

                                                                                                                Association of
                                                                 2
                                                                                                                American Medical Colleges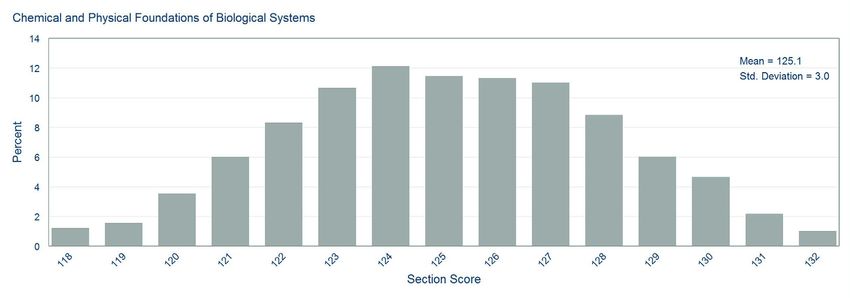
Using MCAT Data in 2019 Medical Student Selection

How is the MCAT exam scored?
The section and total score scales are centered on memorable numbers that draw attention to the center
of the scales. Scores on the four sections of the exam are reported on numeric scales centered at 125 and
ranging from 118 to 132. Scores from the four sections are summed to produce a total score centered at
500 and ranging from 472 to 528.

             The MCAT score scales draw attention to the center of the scales to encourage
               admissions committees to consider applicants with a wide range of scores.

Research on the old exam (administered from 1991 to January 2015) suggests that the students who enter
medical school with scores at the center of the scale succeed; they graduate in four or five years and pass
their licensing exams on the first try (Dunleavy et al 2013). If history is a guide, applicants with a wide range
of scores on the current MCAT exam who are admitted to medical school will also succeed. Early findings
from this exam presented on page 16 show that 2016 entrants with a wide range of scores progressed
to year 2 without delay.

                                                                                                 Association of
                                                         3
                                                                                                 American Medical Colleges
Using MCAT Data in 2019 Medical Student Selection
Who takes the MCAT exam?
Figure 2 shows the percentages of the more than 186,000 examinees, from different backgrounds and
experiences, who took the MCAT exam from 2015 to 2017. More than half of examinees were female. When
describing their race/ethnicity, almost half of examinees identified as white, 10% as black or African American,
11% as Hispanic, and 27% as Asian. About 7% were awardees of the AAMC’s Fee Assistance Program, almost
20% reported that none of their parents had a bachelor’s degree, and about 1% tested with a nonstandard
testing condition. Finally, 24% of examinees took the exam more than once from 2015 to 2017.
Figure 2. Percentages of MCAT examinees from 2015 to 2017, by gender, race/ethnicity, fee assistance
status, parental education, testing condition, and repeater status.1
2 Male 46%
Gender
Female 54%
---------------------------- ----------------------------------------
White 48%
Black or African American 10%
Race/ Hispanic 11%
2,3
Ethnicity Asian 27%
American Indian or Alaska Native 1%
Native Hawaiian or Other Pacific IslanderUsing MCAT Data in 2019 Medical Student Selection
How do examinees prepare for the MCAT exam?
As described previously, the MCAT exam tests concepts from first-semester biochemistry, psychology, and
sociology courses and year-long courses in biology, chemistry, and physics. It asks examinees to demonstrate
that they can reason about research and data to answer questions about those concepts.
Data about the courses examinees completed show how they prepared in these areas (see Figure 3). Almost
all examinees took biology, chemistry, and physics courses. Most examinees also took courses in biochemistry,
psychology, and statistics before testing; many took courses in sociology and research methods.
About half of examinees took either a commercial preparation course or a course based at a university or
medical school before sitting for the exam. Examinees prepared for the MCAT exam in a variety of other
ways, too. Fifty percent of examinees reported using the Khan Academy MCAT collection, which includes
free, online, video-based lessons and test questions covering concepts and reasoning skills tested on the
MCAT exam. On the AAMC’s Post-MCAT Questionnaire (2017), many respondents reported reading on
their own, taking online courses, or volunteering or working in research labs or other settings that provided
exposure to topics tested on the MCAT exam. (The 2017 Post-MCAT Questionnaire Report is available at
aamc.org/data/pmq.)
Figure 3. Percentages of MCAT examinees from 2015 to 2017 who completed college coursework in the
natural, behavioral, and social sciences or who prepared for the MCAT exam by using the Khan Academy
or completing a test preparation course.1
2
Coursework Biochemistry 87%
Introductory Psychology 84%
Introductory Sociology 50%
Research Methods 42%
Statistics 83%
Biology 95%
General Chemistry 93%
Organic Chemistry 96%
Physics 94%
- - - - - - - - - - - - - -3- - - - - - - - - - - - - - - - - - - - - - - - - - - - - - - - - - - - - - - - - - - - - - - - - - - - - - - -
MCAT Preparation Khan Academy 50%
Course from University or Medical School 6%
Commercial Course 42%
0 10% 20% 30% 40% 50% 60% 70% 80% 90% 100%
1. The total number of MCAT examinees from 2015 to 2017 was 186,450.
2. Percentages were calculated from the data supplied by respondents to the Post-MCAT Questionnaire (PMQ) who provided
information about their coursework. Respondents self-reported the courses for which they had Advanced Placement (AP),
International Baccalaureate (IB), College Level Examination Program (CLEP), community college, four-year college,
postbaccalaureate, graduate, and professional school credit. The number of 2015-to-2017 respondents was 62,105. Results
are based on respondents' most recent responses for those who responded to the PMQ more than once.
3. Percentages were calculated from information from examinees who provided information about their MCAT test preparation
after they completed the MCAT exam. The number of 2015-to-2017 examinees who provided this information was 185,782.
Results are based on examinees' most recent responses for those who tested more than once.
Association of
5
American Medical CollegesUsing MCAT Data in 2019 Medical Student Selection
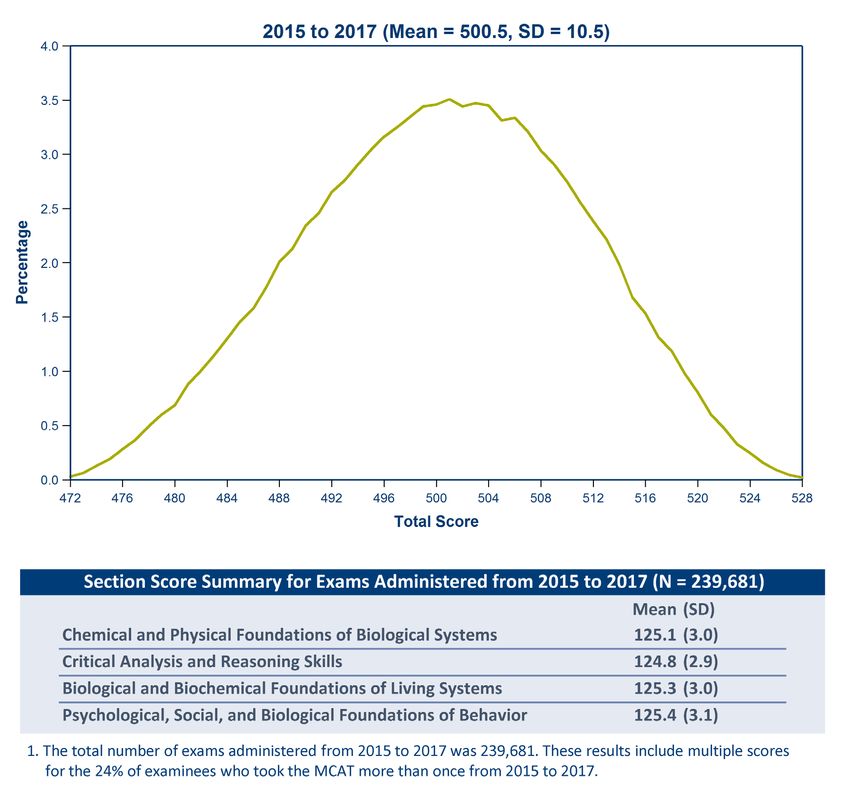
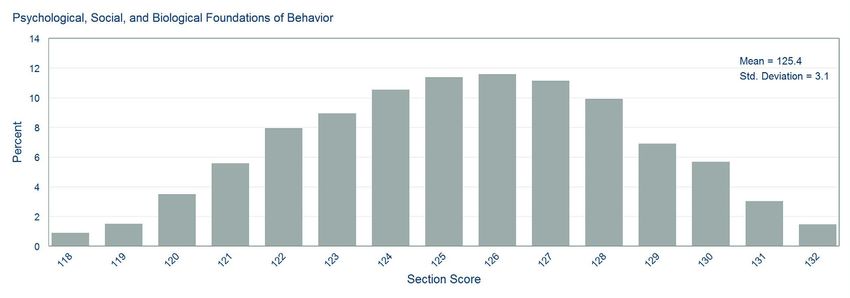
How well do examinees score on the MCAT exam?
Figure 4 shows the distribution of MCAT total and section scores for all exams administered from 2015 to 2017.
These data include scores for students who tested more than once. The mean MCAT total score was 500.5, and
the standard deviation was 10.5. Means and standard deviations for the section scores also appear in Figure 4.
Figure 4. Distributions of MCAT total and section scores for exams administered from 2015 to 2017.1
Figure 5 summarizes the MCAT total scores from 2015 to 2017 overall and for examinees from different
backgrounds and experiences, including gender and race/ethnicity, status in the AAMC’s Fee Assistance
Program, and highest level of parental education. It also shows scores from examinees who tested under
standard and nonstandard testing conditions and first- and second-attempt scores for examinees who took
the exam more than once.
Figure 5 uses box-and-whisker plots to show the median (50th-percentile) score, along with 10th-, 25th-, 75th-,
and 90th-percentile scores. The 10th- and 90th-percentile scores are shown by the ends of the “whiskers,” the 25th-
and 75th-percentile scores are shown by the “box” (the left edge of each box shows the 25th-percentile score, and
Association of
6
American Medical CollegesUsing MCAT Data in 2019 Medical Student Selection
the right edge shows the 75th-percentile score), and the median is shown by the vertical bar inside each box. For
example, for female examinees, the 10th-, 25th-, median-, 75th-, and 90th-percentile scores were 485, 492, 499,
507, and 513, respectively. The mean MCAT total score for each group appears in parentheses by the group label.
For every group, there are examinees with scores near the bottom,
at the middle, and near the top of the MCAT total score scale.
There is variability in the median MCAT total scores for examinees from different sociodemographic
backgrounds. However, there is a great deal of overlap in the scores for different groups. The similarities
and differences in these data are similar to those reported in the literature for other admissions tests (Roth
et al 2001; Sackett and Shen 2010). Research suggests that the differences in MCAT scores for examinees
from groups underrepresented in medicine based on race/ethnicity and other background characteristics
reflect societal inequalities in income, education, and other factors rather than test bias (Davis et al 2013).
Figure 5. MCAT total scores for exams administered from 2015 to 2017, overall and by gender, race/
ethnicity, fee assistance status, parental education, testing condition, and repeater status.1,2
Overall Total (mean = 500.5; N = 239,681)
---------------------------------------------------------------------------------------
Male (mean = 502.1; N = 108,262)
Gender
Female (mean = 499.2; N = 130,777)
---------------------------------------------------------------------------------------
White (mean = 502.3; N = 105,696)
Black or African American (mean = 493.5; N = 24,559)
Race/ Hispanic (mean = 495.7; N = 25,668)
3
Ethnicity Asian (mean = 502.0; N = 63,201)
American Indian or Alaska Native (mean = 496.9; N = 2,452)
Native Hawaiian or Other Pacific Islander (mean = 498.6; N = 690)
---------------------------------------------------------------------------------------
Fee Did not receive (mean = 500.7; N = 188,406)
4
Assistance Received (mean = 496.4; N = 15,025)
---------------------------------------------------------------------------------------
Parental 5 Bachelor's degree or higher (mean = 501.8; N = 124,985)
Education No bachelor's degree (mean = 496.3; N = 27,493)
---------------------------------------------------------------------------------------
Testing 6 Standard (mean = 500.5; N = 237,429)
Condition Nonstandard (mean = 501.9; N = 2,252)
---------------------------------------------------------------------------------------
Nonrepeater (mean = 502.6; N = 141,592)
Repeater
7 Repeater, 1st attempt (mean = 496.1; N = 44,858)
Status
Repeater, 2nd attempt (mean = 499.1; N = 44,858)
472 480 488 496 504 512 520 528
Total Score
1. The total number of exams administered from 2015 to 2017 was 239,681.
2. These results include multiple scores for the 24% of examinees who tested more than once from 2015 to 2017.
3. The numbers of exams in each racial/ethnic group add up to more than the total number of exams because racial/
ethnic minority results include scores for examinees who may have designated more than one race/ethnicity. Data
for examinees who reported their race/ethnicity as "other" are not shown.
4. Fee assistance eligibility is limited to examinees who are U.S. citizens or U.S. permanent residents.
5. Starting in the 2016 testing year, examinees report the highest level of education for up to four parents. These
results are for the highest level of parental education for exams from 2016 to 2017.
6. Score reports do not indicate whether scores were obtained under standard or nonstandard testing conditions.
7. Repeaters are examinees who took the new MCAT exam more than once from 2015 to 2017.
Association of
7
American Medical CollegesUsing MCAT Data in 2019 Medical Student Selection
How precise are examinees’ MCAT scores,
and how should they be interpreted?
Four components are essential for interpreting MCAT scores: the total and section scores, the confidence
bands, the percentile ranks associated with the scores, and the score profile. Figure 6 shows an example
of an examinee’s score report that includes these four components. Details about the confidence bands,
percentile ranks, and the score profile are included below. Other resources—including an interactive version
of the score report; videos describing the concepts and reasoning skills tested by the new exam; and
downloadable fact sheets describing the scores, confidence bands, percentile ranks, and score profile—
can be found at aamc.org/mcatscorereport.
Figure 6. Example score report.
Association of
8
American Medical CollegesUsing MCAT Data in 2019 Medical Student Selection
Confidence bands
Like other measurements, MCAT scores are imperfect measures of examinees’ true levels of preparation. They
are not perfectly precise. Examinees’ scores can be dampened by factors such as fatigue, test anxiety, and less-
than-optimal test room conditions, or they can be boosted by recent exposure to some of the tested topics.
Confidence bands remind admissions committee members
not to overemphasize small differences in scores.
Confidence bands describe the precision of MCAT total and section scores. They show the ranges in which
an examinee’s true scores probably lie. Reviewing applicants’ scores with the confidence bands in mind
prevents overinterpretation of small differences in test scores.
MCAT total scores are reported with a 68% confidence band of plus or minus two points, and MCAT section
scores are reported with 68% confidence bands of plus or minus one point. Adding and subtracting two
points to an MCAT total score of 500, for example, defines a confidence band that begins at 498 and goes
to 502. This means that in 68% of cases, the true score for an examinee with a reported score of 500 lies
within the band that goes from 498 to 502.
Figures 7 and 8 illustrate how confidence bands can be used to interpret MCAT total scores. The reported
score for each examinee is shown as a square. The 68% confidence band around each examinee’s score
is shown by the dashed lines in the figure.
Figure 7 shows that examinee A scored 500 and examinee B scored 502. The 68% confidence bands around
these scores overlap. The overlap between the two confidence bands suggests that the two reported scores
may not be meaningfully different from each other.
Figure 8 shows examinee A’s score of 500 and a score of 506 for examinee C. The confidence bands around
their scores do not overlap, suggesting that the two scores are more likely to be meaningfully different from
each other (compared with the scores for examinees A and B).
Figure 7. Confidence bands for two examinees Figure 8. Confidence bands for two examinees
with similar reported scores. with dissimilar reported scores.
Association of
9
American Medical CollegesUsing MCAT Data in 2019 Medical Student Selection
Percentile ranks
The percentile ranks for the total and section scores show how the scores of individual applicants compare
with the scores of others who took the exam. The percentile ranks show the percentages of test takers who
received the same or lower scores on the exam.
For example, the MCAT total score in Figure 6 is 501. It has a percentile rank of 52%. This means that 52%
of MCAT scores were equal to or less than 501.
Every year on May 1, the percentile ranks for MCAT scores are updated using data from the previous three
administration years. This is a common practice in the standardized test industry and ensures that percentile
ranks reflect current information about applicants’ scores. The current percentile ranks are based on data
from 2015, 2016, and 2017.
Because examinees change from one year to the next, the percentile ranks associated with scale scores may
change over time. Basing the percentiles on data from three administration years instead of one year makes
the results more stable, but it doesn’t prevent year-to-year changes.
That is why MCAT scores have more meaning than percentile ranks. The methods that MCAT developers use
to write test questions and build and equate test forms keep the meaning of scores constant over test forms
and time. The exam is not graded on a curve. No matter when applicants tested, whom they tested with,
or what test forms they took, their scores have common interpretations. MCAT scores describe applicants’
academic readiness in relation to the body of knowledge and skills that medical school faculty have described
as prerequisite for entering medical students.
Appendix B shows the MCAT total and section score percentile ranks that will be in effect from May 1, 2018,
to April 30, 2019. Again, these percentile ranks are based on the scores of everyone who took the exam in
2015, 2016, and 2017.
Score profiles
Score profiles highlight applicants’ strengths and weaknesses across the four sections of the exam through
reported scores for each section. Figure 6 illustrates the score profile associated with an applicant’s MCAT
section scores. Applicants’ strengths and weaknesses on the exam can be considered along with other
information about their academic preparation (e.g., coursework and grades) and in relation to institutional
missions and goals.
Association of
10
American Medical CollegesUsing MCAT Data in 2019 Medical Student Selection
How do examinees’ scores change when they retake the
MCAT exam, and how do admissions officers use scores
for applicants who test more than once?
MCAT examinees can test up to three times in one calendar year and four times across two calendar years.
An examinee cannot take the exam more than seven times in their lifetime. About 24% of examinees tested
more than once from 2015 to 2017.
Analyses of MCAT total scores for test takers who test more than once show the types of score gains obtained
by these examinees. Figure 9 uses box-and-whisker plots (described earlier for Figure 5) to show the distributions
of score gains (and losses) on examinees’ second attempts at the exam, by their initial scores. These results are
from examinees who initially sat for the MCAT exam from 2015 to 2017 and then tested a second time before
the end of the 2017 administration year.
The data show that retesters across a wide range of scores tend to obtain higher scores on their second exams.
Figure 9 shows that the median gain for examinees who tested a second time and whose initial scores ranged
from 472 to 517 was two to three score points, and for examinees whose initial scores ranged from 518 to 528,
it was one point. It is important to note, however, that there was considerable variation in the magnitude and
direction of score changes, with some examinees posting increases or decreases greater than four points.
Figure 9. Changes in MCAT total scores between the first and second attempts for MCAT examinees
from 2015 to 2017 who retested.1
518–528 (N = 45)
514–517 (N = 257)
510–513 (N = 1,342)
506–509 (N = 3,836)
502–505 (N = 6,462)
Initial Total Score Range
498–501 (N = 8,238)
494–497 (N = 8,280)
490–493 (N = 6,859)
486–489 (N = 4,856)
482–485 (N = 2,842)
478–481 (N = 1,411)
474–477 (N = 387)
472–473 (N = 43)
–6 –5 –4 –3 –2 –1 0 1 2 3 4 5 6 7 8 9 10
Score Change
1. These box-and-whisker plots show changes in MCAT total scores from the first
to the second attempt. Twenty-four percent (N = 44,858) of examinees tested
more than once from 2015 to 2017.
Association of
11
American Medical CollegesUsing MCAT Data in 2019 Medical Student Selection
A recent survey asked admissions officers how they work with retesters’ MCAT total scores in the admissions
process (AAMC MCAT Validity Committee unpublished data from 2017). The results showed that admissions
officers use different strategies for examining retesters’ scores. For example, some admissions committees
use all exam scores in conjunction with other information about academic preparation that may explain any
score changes. Other admissions committees use each applicant’s most recent exam scores in the admissions
process or each applicant’s “best score” as represented by the highest total score from a single attempt.
Other committees compute the average total score across the multiple attempts.
It is important for admissions officers to examine the information in applicants’ transcripts and applications
in interpreting retesters’ scores. For example, gains in applicants’ scores over time may be explained by their
completing a postbaccalaureate program or other coursework.
Association of
12
American Medical CollegesUsing MCAT Data in 2019 Medical Student Selection
How do admissions officers use MCAT scores
and other application data in the holistic review
of applicants’ qualifications?
MCAT scores are among many sources of application data that admissions committees use to select medical
students. The scores help admissions officers interpret grades and other academic data that come from
undergraduate institutions with different curricular emphases and grading standards. In addition to applicants’
academic data, admissions officers examine applicants’ experiences and demographic and personal attributes.
Applicants provide a great deal of data about their academic and life experiences, demographics, and personal
characteristics through their applications, personal statements, and interviews. Letter writers also provide rich
information about applicants’ academic, experiential, and personal attributes.
The procedures that admissions officers from different medical schools use to review these data on applicants’
qualifications differ in ways that reflect the schools’ unique educational missions and goals as well as the
sizes of their applicant pools. To learn more about the holistic review of applicants’ qualifications, the AAMC
surveys admissions officers about the importance of different academic, experiential, demographic, and
personal attribute data in making admissions decisions (e.g., Mitchell et al 1994; Monroe et al 2013; AAMC
Admissions Initiative unpublished data from 2013; AAMC and SRA International, Inc. 2016; AAMC MCAT
Validity Committee unpublished data from 2017).
Reviewing more information about the experiences and attributes of applicants
helps admissions committees put academic metrics in better balance.
Table 1 summarizes the results of a 2015 AAMC survey of admissions officers. The table highlights the
importance of different types of data in admissions decision making. The results of this and previous AAMC
surveys on the use and importance of data for making admissions decisions show that experiences, academic
metrics, demographics, and attributes all weigh heavily in decisions to offer acceptances (Dunleavy et al 2011;
AAMC Admissions Initiative unpublished data from 2013).
More recently, admissions officers were surveyed about the relative weight they give to undergraduate grade
point averages (GPAs) and MCAT scores compared with other information in each applicant’s file to learn how
they place these metrics in context at different stages of the admissions process. Gathering richer data about
applicants’ experiences and attributes enhanced admissions officers’ understanding of how these factors shape
applicants’ readiness for medical school (AAMC MCAT Validity Committee unpublished data from 2017).
The importance of undergraduate GPAs and MCAT scores, relative to other criteria, decreases as more
information is gathered. Admissions officers are better able to balance data about academic metrics when
they are placed in the context of applicants’ experiences and attributes. For example, in moving from interview
invitations to acceptance offers, a third more admissions officers rated other criteria just as or more important
than undergraduate GPAs and MCAT scores; that is, 60% of admissions officers rated other criteria just as or
more important in inviting applicants to interview, whereas 80% rated other criteria just as or more important
in making acceptance offers. Placing applicants’ MCAT scores in the context of all the applicants’ information
during the admissions process enables medical schools to meet their missions and goals and not overlook
students who would make valuable contributions.
Association of
13
American Medical CollegesUsing MCAT Data in 2019 Medical Student Selection
Table 1. Mean Importance Ratings of Academic, Experiential, Demographic, and Interview Data Used
by Admissions Committees for Making Decisions About Which Applicants Receive Interview Invitations
and Acceptance Offers1
Mean Academic Metrics Experiences Demographics Other Data
Importance
Ratings2
Highest • GPA: cumulative • Community • U.S. citizenship/permanent • Interview results4
Importance biology, chemistry, service/volunteer: residency (Public)3
Ratings
(≥3.0) physics, and math medical/clinical • State residency
• MCAT total score • Community (Public)3
• GPA: grade trend service/volunteer: not • Rural/urban
• GPA: cumulative total medical/clinical underserved
• GPA: cumulative total • Physician
background
from shadowing/clinical
postbaccalaureate observation
premedical program • Leadership
• MCAT total score
trend
• Completion of
premedical course
requirements
Medium • Completion of challenging • Paid employment: • Race/ethnicity
Importance
Ratings upper‐level science medical/clinical • U.S. citizenship/permanent
(≥2.5 and courses • Research/lab residency (Private)3Using MCAT Data in 2019 Medical Student Selection
National-level data on the academic credentials of applicants whom admissions committees accept reinforce
the messages the survey data provide. Table 2 shows the percentages of applicants with different undergraduate
GPAs and MCAT total scores who were accepted into one or more medical schools in 2017. These data show
that although undergraduate GPAs and MCAT scores are important factors in admissions, they are not the sole
determinants of admissions decisions.
Each year, some applicants with high MCAT scores and undergraduate (GPAs) are rejected by all the medical
schools to which they applied. In contrast, other applicants with more modest MCAT scores and undergraduate
GPAs are accepted by at least one medical school. For example, in 2017 student selection, 11% of applicants
with GPAs of 3.8 or above and MCAT total scores of 518 or above were rejected by all of the medical schools
to which they applied. In contrast, about 14% of applicants with GPAs of 3.0 to 3.19 and MCAT total scores
ranging from 498 to 501 were accepted by at least one medical school.
Table 2. Percentage and Number of 2017 Applicants Accepted Into at Least One Medical School, by MCAT
Total Score and Undergraduate GPA Range
MCAT Total
GPA Total 472–485 486–489 490–493 494–497 498–501 502–505 506–509 510–513 514–517 518–528 All
3.80–4.00 4% 5% 10% 21% 34% 54% 67% 76% 85% 89% 67%
2/51 5/98 23/241 111/528 353/1,040 920/1,692 1,538/2,310 1,870/2,461 1,798/2,112 1,796/2,014 8,416/12,547
3.60–3.79 0% 1% 5% 15% 26% 38% 54% 68% 76% 85% 48%
0/126 3/223 23/442 129/867 366/1,430 764/1,996 1,197/2,225 1,388/2,040 987/1,301 639/755 5,496/11,405
3.40–3.59 2% 1% 4% 10% 21% 29% 40% 55% 61% 71% 33%
4/183 3/293 22/552 100/955 265/1,286 479/1,635 661/1,659 694/1,260 405/660 235/329 2,868/8,812
3.20–3.39 0%Using MCAT Data in 2019 Medical Student Selection
How well do undergraduate GPAs and MCAT scores
predict students’ performance in medical school?
Predictive validity data are available for the students who entered medical school in 2016 with scores from
the current version of the MCAT exam, introduced in 2015. These 2016 entrants provide the first panel of
data showing how well scores from this exam predict year 1 performance in medical school. Nationally,
more than 8,000 students entered medical school in 2016 with these scores.
Overall, 97% of 2016 entrants with scores from the current version of the MCAT exam did well in their first
year and progressed to year 2 without delay, the first hurdle in completing medical school with unimpeded
progress. Figure 10 shows that students with a wide range of MCAT scores progressed. It shows the percentage
of entrants at different ranges of the MCAT total score scale who progressed to year 2 without delay. Medical
students who entered with scores of 494 and above showed similar, high progression rates.
Figure 10. Percentages of 2016 entering students admitted with scores from the current MCAT exam
who progressed to year 2 without delay, by MCAT total score range.
97% 98% 98% 99%
100% 96%
93% 94%
90%
% Students Progressing to Year 2
80% 81%
80%
70%
60%
50%
50%
40%
30%
20%
10%
0%
472–485 486–489 490–493 494–497 498–501 502–505 506–509 510–513 514–517 518–528
(N = 10) (N = 15) (N = 106) (N = 309) (N = 811) (N = 1360) (N = 1727) (N = 1654) (N = 1200) (N = 778)
MCAT Total Score Range
1. This figure summarizes progression data for 2016 entrants in regular, four-year MD programs who reported scores for the current
MCAT exam (N = 7,970). A total of 7,702 (97%) 2016 entrants progressed to year 2 without delay. The highlighted x-axis labels
remind readers that these results are based on very small numbers of medical students.
Medical school faculty evaluate student learning with multiple types of performance outcomes from
matriculation through graduation, tailoring their assessments to their school’s curriculum, academic support,
and learning environment. Researchers from 18 medical schools in the United States and Canada, referred to
here as validity schools, partnered with the AAMC to examine how well scores from the MCAT exam predict
student success in their medical schools, measuring success on local performance outcomes. These predictive
validity data will help admissions committees, faculty, and stakeholders from other institutions understand how
MCAT scores may contribute to decisions about the academic preparation needed to be ready for medical school.
Association of
16
American Medical CollegesUsing MCAT Data in 2019 Medical Student Selection
The schools studied how well MCAT total scores and undergraduate GPAs correlated with institution-specific
performance in the first year of medical school. Each school identified year 1 courses that have reliable
performance measures and defined summative performance as the mean performance across these courses.1
Then, at each validity school, students’ MCAT total scores were correlated with their summative performance
in the first year of medical school. The same analysis was done within each of those schools for undergraduate
GPAs. Finally, an analysis was conducted on the joint contribution of MCAT total scores and undergraduate
GPAs in predicting students’ summative performance in year 1.2
Figure 11 shows the value of MCAT total scores and undergraduate GPAs, alone and together, in predicting
students’ summative performance in the first year of medical school. It shows the distributions of correlations
of MCAT total scores and undergraduate GPAs with students’ summative performance in year 1 at the validity
schools. It also shows the distributions of correlations of MCAT total scores and undergraduate GPAs
combined with students’ summative performance in year 1. These findings are based on data from about 1,000
medical students who matriculated at validity schools in 2016 with scores from the current MCAT exam and
volunteered for the study.
Figure 11. Distributions of correlations across validity schools of 2016 entering medical students’ MCAT
total scores and undergraduate GPAs with their summative performance in year 1.1
0.2 0.4 0.6 0.8 1.0
| |
Corrected Correlation
| |
| |
| |
|
0.65
|
0.56 0.52
| |
| |
Medium
| |
Effect
| |
| |
| |
0
MCAT Total Scores Only Undergraduate GPA Only
| | Undergraduate GPA +
| | MCAT Total Scores
1. These data are for the 15 validity schools with summative year 1 outcomes. MCAT total scores were correlated with students'
performance across year 1 course scores on a scale of 0 to 100. Analyses were conducted within schools. Sample correlations
were corrected for range restriction on MCAT total scores and total undergraduate GPAs due to student selection in the
admissions process (Betty et al 2014) but not for unreliability in MCAT total scores or medical student outcomes. Corrections
for range restriction were made at the institution level. At each medical school, the applicants within each cohort year served
as the reference population. Using established statistical methods, the observed correlations were adjusted to reflect what the
correlations would be if there had been no selection–that is, if all students had been selected for admission. The median corrected
correlation is shown with a diamond, and the two ends of the gray bar show the correlations at the 25th and 75th percentiles. The
horizontal line at a correlation of 0.3 shows the threshold for a medium effect size in the social sciences.
Association of
17
American Medical CollegesUsing MCAT Data in 2019 Medical Student Selection
The left panel in Figure 11 shows the correlations of MCAT total scores with summative performance at
individual validity schools. The correlations were ranked from low to high. The median corrected correlation
(the correlation at the 50th percentile) is shown with a diamond, and the two ends of the gray bar show the
correlations at the 25th and 75th percentiles. The horizontal line at a correlation of 0.3 shows the threshold
for a medium effect size in the social sciences (Cohen 1992).3
The middle panel in Figure 11 shows the distribution of correlations across validity schools of students’
undergraduate GPAs with their summative performance in year 1. Finally, the right panel in Figure 11
shows the distribution of correlations across validity schools of MCAT total scores and undergraduate
GPAs combined in predicting summative performance in year 1.
Overall, the correlations of MCAT total scores with summative performance in year 1 are medium to large
at validity schools that provided year 1 data for the 2016 entrants with scores from this version of the exam.
The correlations of undergraduate GPAs with summative performance in year 1 are also medium to large.
Figure 11 shows that the combination of MCAT total scores and undergraduate GPAs provides better
prediction of performance in the first year of medical school than either one alone.
Importantly, the current and previous research shows that using MCAT scores and GPAs to assess academic
readiness provides a better prediction of future performance in medical school than using any single
academic metric.
Using MCAT total scores and undergraduate GPAs provides better prediction
of performance in the first year of medical school than using either one alone.
These findings are consistent with those from the previous version of the MCAT exam, which show the value
of scores from the old MCAT exam in predicting students’ performance in medical school (Donnon et al 2007;
Dunleavy et al 2013; Julian 2005; Koenig and Wiley 1997; Kroopnick et al 2013; Kuncel and Hezlett 2007).
Studies show that undergraduate grades and scores from the old MCAT exam predict students’ grades in medical
school, academic difficulty or distinction, scores on USMLE Step exams, time to graduation, and unimpeded
progress toward graduation. Future research will examine how well scores from this version of the MCAT exam
predict these same outcomes as medical students in the current study make their way through medical school.
Association of
18
American Medical CollegesUsing MCAT Data in 2019 Medical Student Selection
The median correlation of MCAT scores with summative performance in year 1 in Figure 11 comes from a single
medical school in the validity study. Data from the students at this school can be used to study the association
of MCAT scores with student performance more closely. Figures 12 and 13 use the associations of MCAT
scores with students’ performance at this medical school to illustrate the patterns that may occur at other
schools that use these or similar performance outcomes.
Figure 12 shows data, from this validity school, about students’ progression to year 2 without delay by MCAT
total score range. Mirroring the national results, at this school, the vast majority of students progressed to
year 2. Overall, 96% of 2016 entering medical students at this validity school with scores from the current
MCAT exam progressed to year 2 without delay.
Figure 12. Percentage of 2016 entering students admitted with scores from the current MCAT exam
progressing to year 2 without delay, by MCAT total score range, for the validity school from Figure 11
representing the median correlation of MCAT total scores with summative performance in year 1.1
100% 100% 100%
100% 95% 96%
89%
90%
% Students Progressing to Year 2
80%
70%
60%
50%
50%
40%
30%
20%
10%
0%
472–485 486–489 490–493 494–497 498–501 502–505 506–509 510–513 514–517 518–528
(N = 0) (N = 0) (N = 0) (N = 2) (N = 7) (N = 21) (N = 26) (N = 23) (N = 9) (N = 4)
MCAT Total Score Range
1. The results are for the 92 medical students who entered with scores from this version of the MCAT exam at this validity school
in 2016. The highlighted x-axis labels remind readers that these results are based on very small numbers of medical students.
Association of
19
American Medical CollegesUsing MCAT Data in 2019 Medical Student Selection
Figure 13 shows this validity school’s students’ summative performance in year 1, again by MCAT total score
range. The diamonds show the median performance of students at each score range, and the circles show
the summative performance of each student at this school, in this class, participating in the validity study.
The data in Figure 13 highlight three important findings. First, this validity school accepts students with a
wide range of MCAT total scores. Second, students admitted with higher MCAT total scores, on average,
showed higher performance across year 1 courses. Finally, at every score range, there was variability in
medical student performance. Some students showed higher performance in medical school than others
admitted with the same scores, while others showed lower performance. And, some students with lower
MCAT scores outperformed others with higher MCAT scores.
Figure 13. Distribution of summative performance in year 1, by MCAT total score range, for those
students participating in the validity study at the school from Figure 11 representing the median
correlation of MCAT scores with summative performance in year 1.1
100
Summative Performance in Year 1
80
60
40
20
0
472–485 486–489 490–493 494–497 498–501 502–505 506–509 510–513 514–517 518–528
(N = 0) (N = 0) (N = 0) (N = 2) (N = 5) (N = 20) (N = 25) (N = 20) (N = 9) (N = 3)
MCAT Total Score Range
1. The results are for the 84 medical students who entered with scores from this version of the MCAT exam at this validity school in
2016 and who volunteered to participate in the predictive validity study. Gray dots indicate an individual's summative performance
in year 1; diamonds indicate the median for that score range.
Each medical school admits classes of students that will help meet its educational, research, community
service, and health care mission and goals by carefully considering the rich and assorted data that applicants
provide about their experiences, attributes, and academic preparation. Faculty educate students using
curricula, academic support, and a learning environment tailored to their educational goals and students’
needs. In place at each medical school are also different levels of academic, emotional, and wellness support
services (see, for example, Elks et al 2018). Results from this validity research show that MCAT scores are only
one signal of students’ likely success, and that other factors might have shaped their performance as well.
Association of
20
American Medical CollegesUsing MCAT Data in 2019 Medical Student Selection
Together, the information in this section shows that the MCAT exam is doing its job in assessing academic
readiness for medical school. Figure 11 shows that MCAT total scores, alone and together with undergraduate
GPAs, demonstrate value in predicting applicants’ likely performance across year 1 courses. These data also
reinforce that medical schools support the students they admit—nationally, 97% of 2016 entrants admitted
with scores from this version of the exam progressed to year 2 without delay. Admissions committees select
students who will succeed at their schools, and then these schools support the students they admit—
academically, socially, and in other ways. The academic, social, financial, and other support offered by each
medical school provides the environment where students can learn.
This is the first large-scale study on the predictive validity of scores from the current version of the MCAT
exam. The preliminary results are promising. They support the use of MCAT scores, together with other
application data that are important for admissions decisions. However, there is a lot more to learn about how
students fare in the remaining years of medical school and whether they graduate on time according to each
medical school’s curriculum. The section that follows describes the overall research agenda and timelines for
providing updates on this validity research. Future reports will summarize the research into the predictive
validity of MCAT scores for performance in later years of medical school and include findings based on data
from additional cohorts of medical students.
Association of
21
American Medical CollegesUsing MCAT Data in 2019 Medical Student Selection
What else will we learn about the fairness, impact,
use, and predictive validity of the MCAT exam?
This section describes the full scope of research being conducted on the MCAT exam, including three
specific areas of inquiry: 1) diversity, fairness, and academic preparation, 2) admissions decision making,
and 3) predicting medical student performance.
The predictive validity research presented in the previous section is only part of the work that researchers
are doing to evaluate the MCAT exam. Admissions officers and researchers from 21 medical schools and
prehealth advisors from two undergraduate institutions are researching the validity of the exam. Table 3
shows the schools represented on the two committees conducting this research.
Table 3. Medical Schools Represented on the Two MCAT Validity Committees
Psychological, Social, and
MCAT Validity
Participating Medical School Biological Foundations of
Committee
Behavior Validity Committee
Boston University School of Medicine ü ü
Columbia University Valegos College of Physicians and Surgeons ü ü
East Tennessee State University James H. Quillen College of Medicine ü
Meharry Medical College ü ü
Memorial University of Newfoundland Faculty of Medicine ü ü
Morehouse School of Medicine ü
Philadelphia College of Osteopathic Medicine ü
Rutgers Robert Wood Johnson Medical School ü
Saint Louis University School of Medicine ü
Stanford University School of Medicine ü
The Ohio State University College of Medicine ü
University of Texas School of Medicine at San Antonio ü ü
Tulane University School of Medicine ü
University of Arizona College of Medicine - Tucson ü
University of Calgary Cumming School of Medicine ü
University of California, San Francisco, School of Medicine ü ü
University of Central Florida College of Medicine ü
University of Illinois College of Medicine ü ü
University of Mississippi School of Medicine ü ü
University of North Carolina at Chapel Hill School of Medicine ü
Uniformed Services University of the Health Sciences F. Edward
ü
Hébert School of Medicine
Note: Prehealth advisors from Colgate University and Meredith College are also members of the MCAT Validity
Committee.
Association of
22
American Medical CollegesUsing MCAT Data in 2019 Medical Student Selection
The MCAT Validity Committee is examining the fairness, use, impact,
and predictive value of scores from the MCAT exam.
The validity research agenda includes research questions about how the exam is used and its impact on
examinees, applicants, medical students, and medical school admissions committees.
For example, one of the major goals of this research is to determine how well scores from the MCAT exam
predict performance in medical school. Predictive validity research began in 2013, when a committee of
researchers from 11 medical schools started collaborating with the AAMC to examine the predictive validity
of scores from the Psychological, Social, and Biological Foundations of Behavior section of the exam. This early
research was especially important because this section tested concepts and reasoning skills not previously tested
on the MCAT exam. This study was designed to help admissions committees, faculty, and other stakeholders
understand how scores from the Psychological, Social, and Biological Foundations of Behavior section of the
MCAT exam may contribute to decisions about the academic preparation needed to be ready for medical school
and to provide these findings in time for the 2016 admissions cycle—the first cycle in which applicants reported
scores from this version of the exam.
The MCAT Validity Committee has continued and expanded this research. In addition to studying the predictive
validity of total and section scores, the MCAT Validity Committee is carefully studying how students prepare for
and perform on the exam and whether there are ways to improve the information and resources available to
students. These researchers will also study the ways that MCAT scores are used with other information about
academic preparation, experiences, and attributes in admissions decision making.
Association of
23
American Medical CollegesUsing MCAT Data in 2019 Medical Student Selection
Figure 14 shows the three areas of investigation in the MCAT validity research agenda along with sample
research questions. Early findings are reported in this guide, and the next few pages provide more information
about future work in each area. The AAMC’s website contains a report that describes the research agenda in
more detail (aamc.org/mcatvalidityresearch).
Figure 14. MCAT validity research agenda: the three areas of investigation and sample research questions.
Diversity, Fairness, and Admissions Predicting
Academic Preparation Decision Making Academic Performance
Do scores from the new
Do admissions Do scores from the new
MCAT exam predict
committees balance the MCAT exam predict
academic performance
weight of MCAT scores academic performance
equally well for students
with experiences, attributes, in all four years
from different
and demographics? of medical school?
demographic groups?
Diversity, fairness, and academic preparation
The MCAT Validity Committee has begun examining data related to diversity, fairness, and academic
preparation. It is monitoring trends in the sociodemographic makeup of examinees who take the exam.
The committee is also looking closely at average differences in MCAT scores for examinees from different
sociodemographic groups compared with differences on the old exam and on other standardized tests.
The committee is studying whether scores from the MCAT exam predict performance equally well for
medical students from different sociodemographic backgrounds.
The MCAT Validity Committee is also exploring academic preparation trends, including coursework and other
ways of learning the prerequisite knowledge and skills for medical school, such as reading on one’s own or
participating in study groups. The committee is looking carefully at differences in preparation for examinees
from different sociodemographic backgrounds to understand how the opposing forces of academic preparation
and a disadvantaged environment influence test scores. Understanding these factors will help the committee
look for ways to improve the information and resources available to educationally disadvantaged students.
Association of
24
American Medical CollegesYou can also read