Pseudo-social network targeting from consumer transaction data
←
→
Page content transcription
If your browser does not render page correctly, please read the page content below
New York University - Stern School of Business
Working paper CeDER-11-05

       Pseudo-social network targeting from consumer
                      transaction data*
                                                  David Martens
                  Faculty of Applied Economics, University of Antwerp, Belgium david.martens@ua.ac.be

                                                  Foster Provost
     Department of Information, Operations and Management Sciences, Stern School of Business, New York University,
                                                fprovost@stern.nyu.edu

     This design science paper presents a method for targeting consumers based on a “pseudo-social network”
     (PSN): consumers are linked if they transfer money to the same entities. A marketer can target those
     individuals that are strongly connected to key individuals. We present the PSN design and a large-scale
     empirical study using data from a major bank. For two different product offerings, consumers that are close
     to existing customers in the PSN have significantly higher take rates than the “most likely” candidates
     identified by state-of-the-art socio-demographic (SD) predictive modeling. Interestingly, the PSN targeting
     only does better for the closest neighbors. However, the different models capture different information:
     combining the two does significantly better than either alone. The results demonstrate that social targeting
     can be applied broadly, to settings where the network among consumers is unlikely to be a true social
     network, but nonetheless captures inherent similarity.

     Key words : social network analysis, response modeling, banking, customer analytics

1.     Introduction
This is a design science paper (Hevner et al. 2004) presenting a new method for targeting consumers
for marketing offers in settings where the consumers’ financial transactions can be observed, for
example, in banking. Financial firms increasingly are using predictive modeling to target offers to
cross- or up-sell to existing customers and for customer retention (Van Den Poel and Lariviere
2003, Hormozi and Giles 2004, Hu 2005). Most such modeling is based on data on the consumer
in question’s demographics, psychographics, geographic location, and prior activity with the firm
(tenure, lifetime value so far, services used, etc.). As a shorthand, we will call this state-of-the-art
modeling “socio-demographic” modeling.
  In business domains such as telecommunications, where data are available on explicit connections

* This work also is the basis for provisional patent application PCT/US2011/028175. Note that all data analysis was
conducted by David Martens in Belgium.

                                                          1
Martens and Provost: Pseudo-social network targeting
2 Working paper CeDER-11-05
between consumers, social network targeting has recently been shown to be remarkably effec-
tive (Hill et al. 2006, Dasgupta et al. 2008, Aral et al. 2009, Provost et al. 2009, Richter et al. 2010).
Social network targeting proceeds by (i) creating an explicitly represented social network among
consumers, for example by aggregating communications (calls, emails, IM messages, etc.) between
individual pairs of consumers, and (ii) selecting or ranking consumers to target based (in part) on
their proximity in the network to selected individuals of interest, such as existing customers.
For example, in order to target a telecommunications service offer, Hill et al. (2006) approximate
consumers’ explicit social network using communications observed by a large telecommunications
provider. They then target consumers who are neighbors in this explicit social network to existing
customers of the service. They report a service adoption among the network neighbors that is a
remarkable 3 to 5 times higher than that for non-neighbors, even among consumers selected based
on best-practice targeting by the marketing group (including sophisticated socio-demographic tar-
geting models). Aral et al. (2009) show similar results for a similar targeting setting, except where
the social network is defined based on instant messenger communications. Strong lifts are also
reported by Provost et al. (2009) for targeting online advertising, based on a social network inferred
from visitations to pages on a social networking site; they go on to show that this inferred social
network indeed embeds a true social network.
Social network targeting is so effective for two main reasons. First, word of mouth between
consumers may spread influence from satisfied customers (or even unsatisfied ones) of the prod-
uct to their social network neighbors. Second, due to homophily (McPherson et al. 2001), social
connections between people can capture broad, deep, and often latent similarity (Hill et al. 2006).
Indeed, Aral et al. (2009) show that in their application, a remarkably large portion of the observed
increase in effectiveness of targeting network neighbors can be attributed to similarity, rather than
to social influence.1
Unfortunately, there are many business domains where explicit data on social networks are not
available, or are not usable for various reasons (regulatory, privacy, business data compartmental-
ization, etc.). In this paper, we offer managers an alternative in business domains where data are
available on consumer financial transactions. Specifically, we do not focus on financial transactions
directly between consumers (although presumably those could be used to create a social network
as well). Instead, we consider two consumers to be linked if they transfer money to the same peo-
ple or institutions. These links could include both transfers to the focal consumer (e.g., getting a
paycheck) and transfers from the focal consumer (e.g., paying for a service). Let’s call the resultant
network a pseudo-social network (PSN), since there is no reason to believe that it embeds a true
social network to any substantial degree.
1
And interestingly, that with less data, this effect would likely have been attributed to social influence.Martens and Provost: Pseudo-social network targeting Working paper CeDER-11-05 3 The key idea is that strong connections in the PSN, which represent strongly similar money trans- fer patterns, imply useful similarity between consumers. Model-based targeting generally assumes that similarity between consumers along geographic, demographic, and psychographic dimensions can be the basis of effective targeting. The PSN design extends this idea to similarity in money transfer patterns (which may represent or be driven by other sorts of similarity). The upshot is that once a PSN is built, a marketer can conduct (pseudo-) social targeting: target those individuals that are strongly connected in the network to key individuals of interest, e.g., prior customers of the product. The contributions of this paper are three-fold. First, we introduce this notion of pseudo-social network targeting based on financial transactions, and contrast it with prior targeting approaches. Second, we introduce a novel design of a specific PSN targeting system instantiation based on money transfer data. Third, we present the results of a large-scale empirical study using real data from a major international bank. The results show that for two different products studied, the consumers that are very close to existing customers in the PSN have a substantially elevated take rate—significantly higher than the “most likely” candidates as indentified by state-of-the-art predictive modeling using socio-demographic (SD) variables. Interestingly, the PSN model only does better than the SD model for the closest neighbors; for the bulk of the population, the traditional SD model gives a better targeting ranking. However, the PSN and SD models capture different information: combining the two does significantly better than either alone. An auxiliary potential advantage of the PSN approach is that the predictive power of networked data can be exploited in a privacy-senstive way, since it is not necessary to know the identities of the connected consumers or the institutions that connect them. We only need to know the structure of the resultant network and that certain consumers previously have purchased the focal product. Importantly, besides the direct implications for the banking setting, these results demonstrate that the ideas of social targeting can be applied much more broadly than is evident from the existing literature, to settings where the network among consumers is unlikely to be a true social network, but nonetheless captures inherent similarity. 2. From money transfers to a pseudo-social network Our proposed design constructs a network among consumers, for example, bank customers, which will be our running example. Consumers are linked if they have similar money transfer profiles, based on a log (possibly anonymized) of money transfer transactions. The transfer methods can be seen in a broad perspective, including debit and credit transactions, check payments, etc. We focus on marketing applications, but conjecture that the method may be able to add value more broadly in areas as credit scoring, attrition management, fraud detection, and others, as the marketing results show clearly that the PSN captures useful similarity among consumers.
Martens and Provost: Pseudo-social network targeting
4 Working paper CeDER-11-05
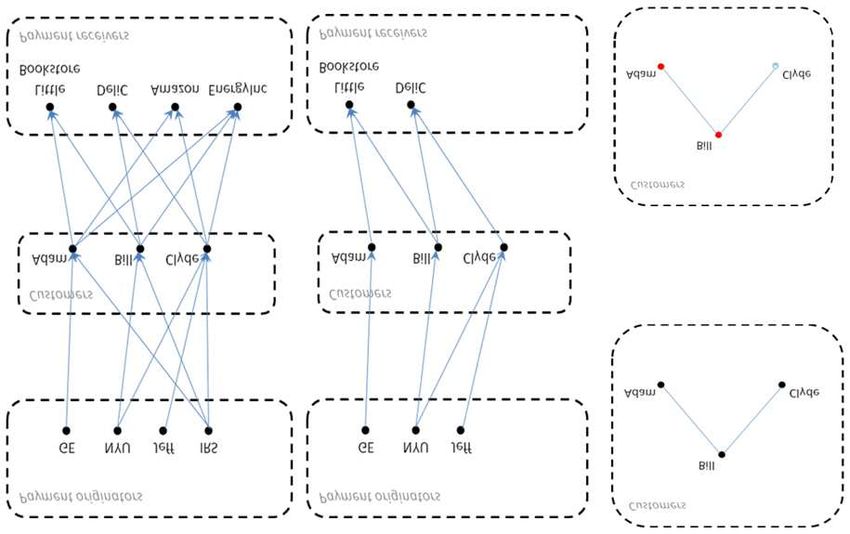
Consider a transaction log containing money transfers between a set of consumers and various
entities, such as firms and institutions, which can be visualized as is done for a very simple illustra-
tion in Figure 1(a). The network could be based on all observed transfers; alternatively, a subset
could be used.2 The intention of the design is to reveal a particular sort of similarity: two consumers
are similar if they make payments to the same entity, or receive payments from the same entity,
and are more similar the more such connections they share and the stronger the connections.
The design is complicated somewhat by the fact that there will be companies that many con-
sumers pay to, such as telecommunication operators or energy providers. These may provide little
information on the similarity between two consumers and could swamp more informative links
based on, for example, the fact that two consumers shop at the same small store. In the case
where consumers receive money, there will also be entities that pay many of them, like the IRS
which pays tax refunds. Such popular payers/payees can be omitted or down-weighted. We will
present specifics below. In our example, taking only the resulting “micro-affinity” into account
yields Figure 1(b).
Next, a data network among consumers is built by linking two consumers if they receive a
payment from the same entity or make a payment to the same entity. Each link provides some
evidence of similarity. For example, in the figure both Bill and Clyde get a monthly payment from
NYU indicating they both work at NYU. Both Adam and Bill shop at the Little Bookstore.
Transactions between the same entities will be aggregated in forming the network. Notably, to
reduce noise it is possible to use (i) only those transactions that exceed a certain minimum amount,
or (ii) only those links for which the aggregated transactions exceed a certain minimum amount,
or (iii) only transactions that exceed a certain link strength or weight, which we will discuss next.
We call the inferred network model among consumers a pseudo-social network (PSN) because as in
a true social network, strongly connected consumers demonstrate a strong similarity, specifically
in the payments they make and receive. The key underlying assumption is that similarly to a true
social network, if two consumers are strongly linked, they will be similar in other ways as well—
such as affinity for a marketing offer. It is a pseudo-social network because, by and large, the linked
consumers probably have no true social relationship with one another.
2.1. From Money Transfer Data to Pseudo-Social Network Scoring
The next step is to produce scores that can be used to rank consumers for targeting, and/or as
input to higher-level analytics. For brevity, in the description that follows we only consider shared
payment receivers; shared payment originators can be incorporated analogously.
2
The network necessarily will be a subset of some grander PSN, since each firm normally only observes the transfers
to and from its own customers.Martens and Provost: Pseudo-social network targeting
Working paper CeDER-11-05 5
(c)
(a) (b) (d)
Figure 1 Going from a transaction log of payments to a network among consumers for a simple example.
Payments to and from consumers can be visualized by denoting an entity as a node and a payment as a directed
edge (a). Relying on micro-affinity and removing common payment originators or receivers leads to (b). A final
pseudo-social network (PSN) is built by defining an edge between two consumers if they have a common payment
originator or payment receiver, as in (c). Finally, based on the PSN, inferences can be made about the target
label (d).
Payment transactions are first converted to a payment receiver matrix, comprising for each
payment receiver a list of consumers making payments to it. The result is a dataset in the form of
Table 1. Next, a score for each consumer (a through i in this example) will be computed. For a
given target product, let’s call consumers that are known to have previously bought the product
the “known buyers” (more generally, “known positive instances”). The score for a consumer x
measures the strength of the links x has to known buyers.
Now consider that a link between consumers is defined by making a payment to the same payment
receiver (PR). The overall score for x is an aggregation, let’s say the sum, of the scores for all
payment receivers that x had made a payment to. This score per PR can incorporate a strength
measure. A straightforward strength measure is the ratio of known buyers that made a payment
to the PR divided by the total number of (unique) consumers making a payment to the PR. The
higher this ratio, the more discriminative the PR is for the target variable (buying the product, inMartens and Provost: Pseudo-social network targeting
6 Working paper CeDER-11-05
our example). Further, we can take into account the concept of micro-affinity, i.e., payment receivers
linking only few consumers provide more information than those linking many. For example, the
Inverse Consumer Frequency (ICF), defined by Eq. (1), provides an indication of the strength of the
tie between the consumers making a payment to the specific PR. ICF is an analogy to a relevance
measure used in text mining, where terms occurring in many documents receive low weights and
terms occurring in fewer documents receive higher weights, known as Inverse Document Frequency.
Combining these ideas, a consumer’s score is formally defined in Eq. (2).
nc = number of consumers
npr = number of payment receivers
N C(pr) = number of unique consumers having made a payment to pr
N B(pr) = number of unique known buyers having made a payment to pr
B(x, pr) = 1 if consumer x made a payment to pr
= 0 if consumer x did not make a payment to pr
nc
ICF (P R) = log10 (1)
N C(pr)
npr
X N B(pri )
Score(x) = × ICF (pri ) × B(x, pri ) (2)
i=1
N C(pri )
The calculation of this score is illustrated further with the simplified example, as shown in
Table 1. For each PR, the consumers are listed that made a payment to it, with the known buyers
denoted in boldface. The number of unique consumers N C(pr) and number of known buyers
N B(pr) are shown in the subsequent columns. Assuming that the bank has a total of 100 consumers
(nc = 100), the inverse consumer frequency ICF (pr) can easily be calculated and is given in the
final column. Based on these statistics, a score for each consumer is obtained.
pr Consumers N C(pr) N B(pr) ICF (pr)
LittleBookStore abc 3 2 1.52
DeliC ade 3 0 1.52
Amazon f ghi 4 1 1.40
EnergyInc bcdef g 6 3 1.22
Table 1 Example: from transaction payment (pr) to PSN. The known buyers among the consumers are
denoted in boldface.
Consumer a made a payment to two payment receivers: LittleBookStore and DeliC. Therefore:
B(a, LittleBookStore) = B(a, DeliC) = 1Martens and Provost: Pseudo-social network targeting
Working paper CeDER-11-05 7
B(a, EnergyInc) = B(a, Amazon) = 0
Hence, the score for a is given by the sum of the score for LittleBookStore and DeliC, where
each of these scores is determined by the known buyer density N B(pr)/N C(pr) and ICF (pr), as
calculated in Eq. (3). For consumer b, the scores for DeliC and EnergyInc are summed, providing
a score of 0.61. The same calculations can be done for all other non-known buyers:
Score(a) = ScoreLittleBookStore + ScoreDeliC
2 0
= × 1.52 + × 1.52
3 3
= 1.01 (3)
Score(d) = ScoreDeliC + ScoreEnergyInc
0 3
= × 1.52 + × 1.22
3 6
= 0.61 (4)
Score(e) = 0.61
Score(f ) = 0.96
Score(h) = 0.35
Score(i) = 0.35
In this example the highest score is obtained by consumer a. This high score originates from Little-
BookStore, which receives relatively few payments (creating strong ties between the few consumers
that make payments there) and most of the resultant neighboring consumers are known buyers
(leading to a strong indication of relative likelihood to buy the product).
3. Empirical Results: Response Modeling with Real-Life Payment
Transaction Data
We now will demonstrate the value of the PSN approach through an empirical analysis (Hevner
et al. 2004), based on real-life payment transaction data from a major international bank. The goal
of this study is to conduct a careful empirical comparison between the PSN method and state-of-
the-art alternatives. Besides being common in the literature on predictive modeling, this sort of
study is used regularly by banks to assess and compare targeting models. Specifically, before using
a targeting model in practice, a bank will conduct hold-out experiments to see whether the model
indeed can discriminate those who have taken the product (already) from those who have not.Martens and Provost: Pseudo-social network targeting
8 Working paper CeDER-11-05
3.1. The data
Data over a period of 11 months was obtained, with over 5 million (debit) transactions made by
1.2 million of the bank’s customers (anonymized) to a total of 3.2 million unique, anonymized
payment receivers (PRs). The predictive task concerns the buying of a financial product during
that time period. Target variables were created for two such products: a pension fund product, and
a long-term deposit.
The PSN data characteristics are visualized in Figure 2. In Figure 2(a) the histogram of the
number of customers per PR is shown (in red, left vertical axis), where we see that most PRs
receive rather few payments (the average number of customers is 6.7).3 However, there exist a few
PRs to which almost all consumers make payments. These are likely monopoly-like companies such
as energy suppliers, large telecommunication operators or the IRS. As this data was anonymized,
we are not able to know exactly what they were. The ICF weight that is given for the PR is given
by the black line (right vertical axis), showing how PRs with many customers are down-weighted
more severely than PRs with only few customers. Figure 2(b) shows the number of neighbors
for each consumer, which are ranked on the X-axis according to this number of neighbors. Most
consumers have about 400,000 neighbors, showing that the pseudo-social network indeed has a
different structure than a typical, true social network. The payment receivers with very many
customers implicitly link all these consumers, leading to this high connectivity.
In addition to the payment transaction data, 289 traditional variables were obtained from the
bank for the consumer in the data set. These are the variables used by the bank for their own
targeting; they summarize socio-demographic characteristics, product possession, product use and
customer behavior. This type of data is traditionally used by large banks for their customer ana-
lytics applications (see e.g., Van Den Poel and Lariviere (2003), Hormozi and Giles (2004), Hu
(2005)).
3.2. Experimental setup
The data are split up into training and test (hold-out) data, where all consumers in the training
data that bought the product are labeled as the known buyers, and all consumers in the test
data are scored (concealing the true buyer status for the experiment, until the time of evaluation).
The resulting model is denoted as the PSN model. This model will be compared against random
targeting and four competing models.
As a state-of-the-art model with which to compare, we build a linear support vector machine
(SVM) (Vapnik 1995) model using the 289 traditional variables on a balanced sample from the
3
Although the number of customers for a PR goes up to several hundred thousands, most of the distribution is given
in the range shown, up to 20.Martens and Provost: Pseudo-social network targeting
Working paper CeDER-11-05 9
6
x 10
3.5 7 x 10
5
Number of neighbors
7
Frequency of PRs with X customers
3 6
6
2.5 5
5
2 4
4
ICF
1.5 3 3
1 2 2
0.5 1 1
0 0 0
0 0.5 1 1.5 2 2.5 3 3.5 4 4.5 5 0 2 4 6 8 10 12 14
Number of customers 5
x 10
5
x 10
(a) (b)
Figure 2 PSN data characteristics: (a) the histogram of the number of customers per payment receiver is
given by the red bars, indicating most payment receivers have few customers. The corresponding ICF weight is
given by the black line. In (b) the number of neighbors for each consumer are given, where the consumers are
ranked according to this frequency on the X axis.
training set, including all the known buyers and just as many randomly selected non-buyer con-
sumers. A forward input selection procedure based on the area under the ROC curve (AUC) was
conducted to select a maximum of thirty variables.4 A validation set (chosen as a third of the
training set) is held out to determine the optimal number of variables and to optimize the SVM’s
regularization parameter using a gridsearch. Although more than just socio-demographic data (e.g.,
prior experience data) is included in this dataset, for simplicity we name the resulting model the
linear Socio-Demographic (SDlin ) model.
Additionally, a non-linear SVM is built using the radial basis function (RBF) kernel. The same
training setup is used as for the linear SVM model, with the addition of also tuning the RBF
bandwith parameter in the same manner as the regularization parameter. The RBF SVM model
is denoted as SDRBF .
We also assess another novel model. As described next, we create a combination of the PSN and
the SD models, to assess to what extent the two models incorporate complementary information.
Specifically, for this experiment we produce a linear combination of the two models’ scores. The
PSN output score is rescaled to the interval [0, 1] by subtracting the minimum and dividing over the
range. All positive examples and just as many negative examples are chosen to create a balanced
sample. Since a PSN score is only available for the test data, we are limited to estimating the
combined model on test data. Therefore, we hold out a randomly selected 10% of the previously
4
At thirty variables a plateau is visible in terms of AUC, as shown by Figure 10 in Appendix B.Martens and Provost: Pseudo-social network targeting
10 Working paper CeDER-11-05
defined test set to estimate the weights that combine the two output scores. The results are then
based on the remaining 90% to evaluate the performance of all models. The model resulting from
combining the PSN and linear SVM models is denoted PSN + SDlin ; the combination with the
RBF SVN is denoted as PSN + SDRBF .
3.3. Results: Lift
We now present results comparing these models in terms of the area under the ROC curve (AUC)
(Fawcett 2006) and the lift (Linoff and Berry 2011) over random targeting. The lift over random
targeting is defined as the ratio of the target response over the average response (corresponding
to random targeting). For example, if 5% of the consumers are known buyers, and we are able to
identify a segment (e.g., the 1% of consumers with the highest score) where the predicted response
is 15%, a lift of 3 is obtained.
For the two products, Tables 2 and 3 report the average AUCs and the lifts at targeting thresholds
of 1%, 5% and 10% averaged over 10 randomizations, each time using 80% of the data as training
data and the remaining 20% as test data. The highest value for each of these performance metrics
is shown in boldface. The PSN model seems to perform comparatively quite badly when viewed
in terms of AUC. However, we see that it actually does extraordinarily well comparing the lifts
at 1%. The PSN’s lift then is comparable with the other models at 5%, and then worse at higher
percentiles. This result is consistent for both products.
Using a one-sided paired t-test over the 10 randomizations, we find that the combined PSN+SDlin
model performs significantly better than the individual PSN and SD models for the AUC, lift
at 5% and lift at 10% (all p-values < 1e-5). For the lift at 1%, the PSN model performs best,
significantly outperforming the SD model (p-value< 1e-5), though the difference with the combined
method is less significant (p-value= 0.02). For product 2, the same techniques perform best, always
significantly outperforming the others (all p-values < 1e-5).
Thus, the PSN does a very good job at the high score range: the top-ranked consumers—those
“closest” in the pseudo-social network—are indeed very likely to buy the product themselves. This
is important because, given budget limitations, marketing campaigns are often limited to these
very high percentiles.
Looking more deeply, the ROC and lift curves shown in Figure 3 illustrate this performance
across all thresholds (for a chosen representative randomization). Indeed, the PSN performs very
well at the top of the rankings, but once the high percentiles have been passed, the PSN model (solid
line) performs quite badly, with the ROC curve becoming almost a straight line—indicating that
the PSN model does not distinguish these consumers at all. The reason for this performance is that
the PSN model only provides a non-trivial score to a few consumers (which seemingly are indeedMartens and Provost: Pseudo-social network targeting
Working paper CeDER-11-05 11
AUC Lift 1% Lift 5% Lift 10%
PSN 63.9 14.9 4.1 2.6
SDlin 75.5 4.9 3.9 3.3
PSN + SDlin 78.2 12.7 5.4 4.0
SDRBF 77.6 4.8 4.3 3.6
PSN + SDRBF 78.2 5.8 4.6 3.8
Table 2 Results product 1 - 80% training data.
AUC Lift 1% Lift 5% Lift 10%
PSN 71.7 31.8 7.6 4.4
SDlin 86.6 10.1 7.8 6.0
PSN + SDlin 89.0 18.2 9.7 6.7
SDRBF 87.3 10.2 7.8 6.2
PSN + SDRBF 87.4 10.6 7.8 6.2
Table 3 Results product 2 - 80% training data.
very likely candidates for the product). Because only the neighbors of known buyers are provided
with a score, most of the social network remains unscored (see Appendix A for more details). More
advanced network inference schemes, including collective inference (Macskassy and Provost 2007),
may further improve the performance of inference over scores based only on immediate neighbors
in the pseudo-social network. In contrast, the performance curve for the SDlin model (dotted line)
exhibits a more typical shape, performing worse than the PSN model at the very high score range
and better everywhere else.
The combined model (PSN + SDlin ) performs strikingly well, over the entire score range. Thus
the PSN score indeed has complementary predictive power to the traditional scoring. This result
is particularly encouraging given the simplicity of the method we used to combine the two sorts of
information. Designing a more sophisticated combining strategy may give considerable additional
lift.
We include the non-linear RBF SVM models in part to ensure that the improvement of the
PSN + SDlin model is not simply the result of capturing non-linearities that are present in the
data, but that also could have been captured by other techniques. For both products, the SDRBF
models outperform the linear ones in terms of AUC, indicating that some useful non-linearities
are indeed present.5 However, the RBF SVM performs worse than the linear model combined
with PSN (PSN + SDlin ). Interestingly, combining the RBF SVM with the PSN does not yield
comparable performance improvements; apparently the PSN scores are more complementary to
the linear scores than to the non-linear ones. From the point of view of model comprehensibility
this is encouraging, as the combined linear and PSN model can still be relatively easily explained
to potential stakeholds (e.g., managers who must sign off on the use of the model), which is not
5
The improved performance is in line with previous comparative studies (see e.g. Lessmann et al. (2008), Baesens
et al. (2003))Martens and Provost: Pseudo-social network targeting
12 Working paper CeDER-11-05
the case when using the black-box RBF SVM model. We return to these issues in the discussion
of directions for future research.
As the best results are obtained for the combined model PSN + SDlin (both in terms of predictive
behavior, comprehensibility and computational requirements), we focus on the performance of this
model and its components on a single (representative) randomization in the additional analyses
presented in the following sections. In the graphs, the SD models correspond to the linear SDlin
models.
3.4. Results: Profit
Comparisons of lift and area under the ROC curve demonstrate that the PSN scores can add
significantly to the predictive power of targeting models. Nonetheless, the level of managerial impact
depends on the potential additional profit that would be generated. Therefore, in this section
we extend the comparison to the estimated (improvement in) profits of the models. Extending
holdout results such as these on observational data to the estimated profit of an actual campaign
requires making assumptions about the generalization performance of the models. We will make
the assumptions precise next. The main idea is that the models’ lifts in finding new buyers will be
similar to their lifts in identifying hidden buyers in holdout data.6
3.4.1. Comparing estimated profits. As described above when comparing model lifts, a
targeting model typically is applied to rank the members of a targeting population by the score
received by the model. Then some portion of the highest-ranking members are targeted (e.g., sent
an offer, solicited by a customer service representative, etc.). To estimate the profit of such a
campaign we need to specify the following quantities (Piatetsky-Shapiro and Masand 1999):
• N : the total number of consumers in the targeting population, some subset of whom will be
targeted;
• P : the targeting threshold, indicating the top percentile of the ranking that will be targeted;
• T : the base rate: the fraction of consumers in the population as a whole, who would exhibit the
desired behavior if targeted (i.e., response to offer, in this case the percentage that will purchase
if targeted);
• B: the benefit of an accepted offer by a targeted consumer (assumed here to be constant);
• C: the cost of making an offer to a consumer, whether accepted or not.
So, to make our assumptions on model generalization performance precise, we will allow that
the size of the population could be different in the targeting environment, and that the base rate
of responders may be different from the base rate in the observational data. However, the lift
6
We have found no research looking specifically at this seemingly important question. Please send us pointers if you
know of relevant work.Martens and Provost: Pseudo-social network targeting
Working paper CeDER-11-05 13
ROC - Product 1 - 80% training Lift curve - Product 1 - 80% training
1 16
PSN PSN
SD SD
0.9 PSN + SD PSN + SD
14
0.8
12
0.7
10
0.6
0.5 8
0.4
6
0.3
4
0.2
2
0.1
0 0
0 0.2 0.4 0.6 0.8 1 0 0.1 0.2 0.3 0.4 0.5
(a)
ROC - Product 2 - 80% training Lift curve - Product 2 - 80% training
1
PSN PSN
SD 16 SD
0.9 PSN + SD PSN + SD
0.8 14
0.7 12
0.6
10
0.5
8
0.4
6
0.3
4
0.2
2
0.1
0 0
0 0.2 0.4 0.6 0.8 1 0 0.1 0.2 0.3 0.4 0.5
(b)
Figure 3 ROC (left) and lift curves (right) for the pseudo-social network (PSN) model, the model with
traditional characteristics, including sociodemographic data (SDlin ) and the combined model (PSN + SDlin ).Martens and Provost: Pseudo-social network targeting
14 Working paper CeDER-11-05
Lif t(P ) over random targeting of a model at a particular targeting threshold is the same as we
have observed.
The profit of a response model when making an offer to the top P percent of all consumers
(those with the highest output score) can be factored in terms of model lift, as defined by Eq. (5).
This calculates the benefits of all N · P · T · Lif t(P ) targeted consumers that actually accept the
offer, minus the costs incurred by making an offer to N · P consumers.
Profit = N · P · (T · Lif t(P ) · B − C) (5)
Given Eq. (5) we can compare the profits of different models at different targeting thresholds,
for different business scenarios {N, P, T, B, C } and estimate the improvement in profit from using a
model with better lift. Often in practice targeting thresholds are determined by budget constraints.
However, pragmatics aside, if we are going to compare two models overall, the percentile P for
each should be chosen such that that model’s profit is maximized, and hence is dependent on
all the aforementioned parameters. Two models will not necessarily maximize profits at the same
percentile threshold (since their lift trajectories may be quite different).
For our two products, we queried the domain experts at the bank for values for the business sce-
nario parameters (rounded for confidentiality reasons). The results that follow should be considered
to be an example, under the assumption that these values are reasonable.
• N = 106
• TP1 = TP2 = 0.01
• Benefit (in e):
— Product 1 (pension fund): Each year a customer pays on average 500e; assume the bank
gets 1% transaction cost. More importantly, customer lifetime value increases substantially as this
is a very long-term product, therefore:
∗ BP 1 =5
lowerbound
∗ BP 1 = 1000
upperbound
∗ BP 1 = 500
estimated
— Product 2 (long term deposit account): the return depends on the market, estimated
between 0.1 and 1%. The average investment will be between 5000e and 50,000e:
∗ BP 2 = 5000 ∗ 0.001 = 5
lowerbound
∗ BP 2 = 50000 ∗ 0.01 = 500
upperbound
∗ BP 2 = 300
estimated
• Cost (in e): the cost of making an offer is the same for both products and limited to sending
out a letter or folder, plus the amortized costs of the design of the campaign and the time of bank
managers that talk to the responding consumers.Martens and Provost: Pseudo-social network targeting
Working paper CeDER-11-05 15
— CP 1,2 =1
lowerbound
— CP 1,2 = 10
upperbound
— CP 1,2 =3
estimated
Figure 4(a) shows the estimated profit trajectories for product 1 for the three models (PSN,
SDlin , PSN+SDlin ) as the targeting threshold is varied, using the estimated values of 500e as the
benefit of an accepted offer and 3e the cost of making an offer.
For thresholds corresponding to small campaigns (very low values for P ), the strikingly higher
lifts observed above for the PSN-based models translate into substantially higher profits. As P
increases so does profit, but with decreasing marginal increases as the lift decreases. As would
be expected, at some point the costs outweigh the benefits and the increases in profit stop and
eventually reverse. For this product and these particular business parameters, this is around P =
35% for the PSN+SDlin model. Here the highest profit is 2,177,692e, obtained by the PSN+SDlin
model, which is 114,323e more than the SDlin model at that percentile. When we compare the
maximum profit of the PSN+SDlin model and the maximum profit of the SDlin model, which are
obtained at different percentiles, profit improvements of the same order are achieved (98,262e).
The figure also shows the maximum profit achieved for the PSN for each scenario and the
difference in profits as compared to the traditional SDlin model (in the figure: Delta profit PSN
over SD), as well as the maximal difference in profit between the PSN+SDlin and SDlin model
(Max delta profit PSN over SD). Figure 4(b) shows the result when we double the estimated
cost C to 6e which of course lowers the profits and leads to a smaller set of targets (smaller
percentage of the population) to be chosen to achieve maximal profit. Since the PSN model (and
PSN+SDlin combination) performs best comparatively at the lower percentiles, the improvement
of the combined model PSN+SDlin is even higher (276,454e) even though the total profit is lower.
The profit curves for product 2 are shown in Figure 5, with an additional 129,722e in profits
achieved by the combined PSN+SDlin model at the threshold corresponding to the maximum
profit. Comparing the maximum profits of the PSN+SDlin model and the maximum profit of the
SDlin model, we again observe an improvement of the same order (123,067e).
Thus, for both products and for different cost settings, the maximum profit obtained by the
combined model is greater than that obtained by the traditional model. More importantly, perhaps,
for smaller campaigns—e.g., where less than 10% of all the bank’s customers are targeted—the
differences in profits over the traditional models are substantial.
Returning briefly to the particular business parameters chosen: for a particular bank (number of
customers fixed), the expected profit depends on T , the lift curve, and the estimated parameters
B and C. For niche products with few customers (lower T ), the optimal profit will be obtained
at low percentiles, where the profit improvements are large. Similarly, as the cost per offer goesMartens and Provost: Pseudo-social network targeting 16 Working paper CeDER-11-05 up or the benefit per accepted offer goes down, the optimal profit is obtained by addressing fewer consumers, hence at the lower percentiles where the additional profit of the PSN-based models is larger. Figure 6 and 7 shows results over varying benefits and costs, limited by the range of values defined by the lower and upper bounds provided by the domain experts. The extra profit achieved by using the PSN+SDlin model runs up to close to 500,000e for a campaign of single product.
Martens and Provost: Pseudo-social network targeting
Working paper CeDER-11-05                                                                                                       17

                                 x 10
                                        6
                                                           Profit for product 1 (B = 500 C = 3)
                                                                                                                       PSN
                                                                                                                       SD
                           2.2
                                                                                                                       PSN+SD

                            2

                           1.8

                           1.6
                  Profit

                           1.4

                           1.2

                            1

                           0.8 ← Delta profit PSN over SD = 395284

                                         ← Max delta profit PSN+SD over SD = 436554
                           0.6

                                                                     Delta profit PSN+SD over SD = 114323 →
                           0.4
                                                                               (Max. profit PSN+SD = 2177692)

                                 0          0.05     0.1     0.15      0.2        0.25      0.3      0.35       0.4   0.45
                                                                                     P

                                                                               (a)

                                 x 10
                                     5
                                                           Profit for product 1 (B = 500 C = 6)

                           14                                                                                         PSN
                                                                                                                      SD
                                                                                                                      PSN+SD
                           12

                           10

                            8
                  Profit

                            6

                            4

                            2 ← Delta profit PSN over SD = 395284

                                        ← Max delta profit PSN+SD over SD = 436554
                            0
                                                                     ← Delta profit PSN+SD over SD = 276454
                                                                             (Max. profit PSN+SD = 1348513)
                           −2

                                0           0.05    0.1      0.15      0.2        0.25      0.3      0.35       0.4   0.45
                                                                                     P

                                                                               (b)
Figure 4    Profits for product 1 for an increasing percent P of consumers that an offer is made to. The profit at
the lower quantile is highest for the PSN model, while the overall profit is largest for the combined PSN + SDlin
model. The increase in profit compared to using the traditional SDlin model is shown in the figures. These profits
are based on an estimated benefit (B) of an accepted offer by a consumer and an estimated cost (C) of making
an offer to a consumer. These values are shown in the titles of the plots (in this case B = 500 and C = 3 or 6).
Martens and Provost: Pseudo-social network targeting
18 Working paper CeDER-11-05
x 10
6
Profit for product 2 (B = 300 C = 3)
PSN
SD
1.6 PSN+SD
1.4
1.2
Profit
1
0.8
← Delta profit PSN over SD = 590132
0.6
← Max delta profit PSN+SD over SD = 305601
← Delta profit PSN+SD over SD = 129722
0.4
(Max. profit PSN+SD = 1616128)
0 0.05 0.1 0.15 0.2 0.25 0.3 0.35 0.4 0.45
P
(a)
x 10
5
Profit for product 2 (B = 300 C = 6)
PSN
12 SD
PSN+SD
10
8
6
4
Profit
2
0
−2
−4 ← Delta profit PSN over SD = 590132
← Max delta profit PSN+SD over SD = 305601
−6
← Delta profit PSN+SD over SD = 213301
−8 (Max. profit PSN+SD = 1211128)
0 0.05 0.1 0.15 0.2 0.25 0.3 0.35 0.4 0.45
P
(b)
Figure 5 Profit trajectories for product 2 with B = 300 and C = 3 or 6.Martens and Provost: Pseudo-social network targeting
Working paper CeDER-11-05 19
5
x 10
4.5
4
3.5
3
2.5
2
1.5
1
0.5
5
115
225
335
445
555 1
2
665 3
4
775 5
6
885 7
8
995 9
10
B C (Cost of an offer)
(a) Profit improvement of PSN+SDlin model over SDlin
model.
0.45
0.4
0.35
0.3
0.25
0.2
0.15
0.1
0.05
995
885
775
665
555
445
335
225
115 9 10
7 8
5 6
5 3 4
2
B 1
C (Cost of an offer)
(b) Percentile at which profit is maximized.
6
x 10
6
5
4
3
2
1
0
995
885
775
665
555
445
335
225
9 10
115 7 8
5 6
5 3 4
1 2
B
C (Cost of an offer)
(c) The maximal profit achieved.
Figure 6 Product 1: The profit improvement of our approach (PSN+SDlin ) over the SDlin model (a), the
optimal percentile (b), and the maximum profit (c) over a range of benefits (B) and costs for an offer (C).Martens and Provost: Pseudo-social network targeting
20 Working paper CeDER-11-05
5
x 10
4
3.5
3
2.5
2
1.5
1
0.5
5
60
115
170
225
280 1
2
335 3
4
390 5
6
445 7
8
500 9
10
B C (Cost of an offer)
(a) Profit improvement of PSN+SDlin model over SDlin
model.
0.45
0.4
0.35
0.3
0.25
0.2
0.15
0.1
0.05
500
445
390
335
280
225
170
115
60 9 10
7 8
5 6
5 3 4
2
B 1
C (Cost of an offer)
(b) Percentile at which profit is maximized.
6
x 10
3.5
3
2.5
2
1.5
1
0.5
0
500
445
390
335
280
225
170
115
9 10
60 7 8
5 6
5 3 4
1 2
B
C (Cost of an offer)
(c) The maximal profit achieved.
Figure 7 Product 2: The profit improvement of our approach (PSN+SDlin ) over the SDlin model (a), the
optimal percentile (b), and the maximum profit (c) over a range of benefits (B) and costs for an offer (C).Martens and Provost: Pseudo-social network targeting
Working paper CeDER-11-05 21
3.5. The effect of more data
Given these results, we should consider that they are generated on a subset of the data—that
provided by the bank for this study. It therefore is important to try to understand how the lifts
of the different models would be affected by having more data (as the bank would in practice). In
theory, the PSN models should be affected strongly by the amount of data available: more data
means more connections among consumers as well as more known buyers becoming available for
inference; both will lead to lower estimation variance (and thus lower error) in the scores. Most
strikingly, many consumers for which the PSN score would be zero due to no connection to any
buyer would with more data receive a non-zero score. Since this study is based on a sample of data,
it may be that the results are conservative compared with what might be expected across a large
bank’s entire customer base (which could be one or two orders of magnitude larger).
We can assess the effect of the data size within the range of our sample by simulating different
data sizes. In Figure 8 we show the evolution of the performance metrics for the models (PSN,
SDlin and PSN+SDlin ) as we increase the training data.7 As expected, the AUCs and lifts for the
PSN model (solid line) increase as we increase the number of known buyers, and do so relatively
constantly across the entire range. As noted above, as more known buyers become linked, more
consumers in the network will receive a non-trivial score. This striking improvement trend is not
observed for any of the performance metrics for the SDlin model, for either product. As is typically
observed in predictive modeling applications (see e.g. Perlich et al. (2003)), after a certain point the
marginal performance improvements obtained by adding more training data become very small.
This indicates that we should expect further model improvements for the PSN model (and the
combined PSN+SDlin model) with larger data sets, even though here we already have data on a
very large number of consumers. If this trend does continue for orders of magnitude more data,
this argues that the largest banks have a remarkable “data asset” from which they could get a
much higher return than banks with smaller customer bases.
Albeit a step removed from the main claims of this paper, it nonetheless is important to assess
whether computational cost would prohibit the practical use of the new techiques on massive data
sets. In fact, inference using the PSN-based techniques is quite efficient. For all of our experiments,
inference over the entire data set took less than an hour.8 As the data size grows, as expected
PSN inference time shows a linear increase. Most time is spent on the initial preprocessing of the
data, going from payment transaction data to the lists of customers for each payment receiver (as
7
For this experiment, for each training size we use all remaining data as testing data. Note that we are unable to
assess the performance with 100% training data, as no more test data would be available to score.
8
Experiments are conducted on an Intel Core 2 Quad (3 GHz) PC with 8GB RAM. The PSN procedure is implemented
in Matlab, so the run time could likely be improved substantially. The linear and RBF SVM models are built using
the LIBLINEAR and LIBSVM packages respectively (Fan et al. 2008, Chang and Lin 2001).Martens and Provost: Pseudo-social network targeting
22 Working paper CeDER-11-05
Product 1 - Learning curves Product 2 - Learning curves
20 40
PSN PSN
15 SD 30 SD
PSN + SD PSN + SD
Lift 1%
Lift 1%
10 20
5 10
0 0
0 20 40 60 80 100 0 20 40 60 80 100
8 15
6
10
Lift 5%
Lift 5%
4
5
2
0 0
0 20 40 60 80 100 0 20 40 60 80 100
0.9 1
0.8 0.9
AUC
AUC
0.7 0.8
0.6 0.7
0.5
0 20 40 60 80 100 0 20 40 60 80 100
% training data % training data
Figure 8 Learning curves: performance metrics on the test set for product 1 (left) and product 2 (right) for
increasing training size. For the PSN (and combined PSN+SDlin model) the performance keeps on improving as
we add training data, unlike for the SDlin model. This indicates we can expect further performance improvements
with larger data sets.
previously shown in Table 1). For our experiments, this requires about a day of computations to
incrementally read in and process the transactions.9 It should be noted that since the PSN model
can be built incrementally, as new data become available the model can be updated efficiently.
3.6. Privacy-friendly
A somewhat surprising aspect of the PSN targeting is that it can be remarkably privacy friendly,
in contrast to how it may seem prima facie. For the PSN component, the only data required are
as follows.
9
NB: Presumably, a large bank with one or two orders of magnitude more data would not be running on a desktop
PC.Martens and Provost: Pseudo-social network targeting Working paper CeDER-11-05 23 1. Anonymized transaction log: a list of anonymized payment transactions, denoting for each transaction the following attributes: • Consumers (anonymized, but reversible for targeting), • Non-consumer payment receiver/originator (anonymized; no need to be reversible), • Timestamp (potentially), • Amount (potentially), 2. The target values for a set of anonymized known buyers. The consumers as well as the non-consumers in the network can be identified by random numbers (a “hash”), not needing any name or account number. In the case of the consumers, the hash would be reversible in order actually to target. However, the reversal could be limited to a protected, task-specific environment. This privacy friendliness is a very attractive feature in a banking setting as it allows consumers’ names and payment information to be hidden from modelers and analysts, until the point that certain consumers would be targeted for a campaign. In addition, the PSN data would be useless to almost any recipient in the case of a data breach. As we have seen, additional data on consumer characteristics, as with traditional SD data, can improve predictive performance. Managers should keep in mind the concomitant additional privacy risk. 3.7. Alternative PSN designs In this paper we presented the general idea of pseudo-social network targeting, as well as a specific design and application to a real bank data. For completeness, some alternative designs choices are described below. In short, we can distinguish between the money transfer data to consider, the definition of a link, the weights of a payment receiver (or payment originator), and the method of calculating scores. Money transfer data to consider. A broad range of money transfers types exist: credit and debit payments, money withdrawals, check payments or any other form of registered money transfer. For each, we can use both the money transfer originators and/or receivers to define links. Defining links. Using money transfer data, links could be defined using any combination of the different types, using additional data available about the money transfer and/or using only a subset of these transactions. Similarity in monetary values can be used to further refine links’ strengths. Often comment fields also accompany money transfers, which could be used with text mining algorithms to define links as well. Further, if attributes are available about the payment receivers or payment sources, these attributes could further affect link strength (e.g., if certain types of payment receivers tend to have more predictive influence).
Martens and Provost: Pseudo-social network targeting
24                                                                                  Working paper CeDER-11-05

  Defining scores. The final calculation of the output score for a consumer is defined by the
neighbors in the PSN: those consumers with a shared money transfer receiver/originator. In the
proposed, specific implementation the strength of a link is the sum of the ICF of all shared pay-
ment receivers. In the formula, this is the multiplier—number of known buyers over number of
consumers—for a single payment receiver. One could include as well negative multipliers, where
payment receivers with very few known buyers actually lower the score. Additionally, schemes to
learn optimal weights for each payment receiver could improve this further.
     For regression tasks, such as customer lifetime value or share of wallet prediction, the scores will
be defined similarly, effectively combining the distribution of the output values of the neighbors,
which is discrete for classification tasks (and in the example case defined as the average, weighted
by the strengths of the links) and continuous for regression tasks.
     More advanced learning schemes can be applied to the constructed PSN to calculate scores, for
example those using neighbors of higher degree (neighbors of neighbors, and beyond), and using
more sophisticated network modeling with collective inference (Macskassy and Provost 2007).

4.      Related work
This work builds on several prior studies of using network data for marketing purposes, and more
generally, for making predictions about consumers. We will describe the main relationships between
these studies and the present work next. To our knowledge, no prior work has presented the
formulation of a consumer network based on money transfer links for the purpose of building or
augmenting targeting models.
     One main advance of the present work is the extension of predictive modeling based on consumer
network data much more broadly off-line, and particularly to the banking sector. Little existing
research makes use of large-scale off-line data on consumer transactions to form network data to
build or augment targeting models. The main exception is the use of telecommunication links to
approximate the (true) social network among consumers. Using such networks, prior work has
shown that network neighbors—those consumers linked to a known buyer—adopt the service at
a rate 3-5 times greater than non-network neighbors selected by the best practices of the firm’s
marketing team, including sophisticated predictive modeling, and that more sophisticated social-
network modeling can improve the performance further (Hill et al. 2006, Doyle 2008). Dasgupta
et al. (2008) and Doyle (2008) use the same sort of network data to significantly improve churn
modeling. An off-line social network is also built by Iyengar et al. (2011), who use mail surveys of
doctors to define a social network among them and report on the existence of product adoption
contagion effects. As the basis is survey data, the scale of course is much smaller and the social
network is a true one.
Martens and Provost: Pseudo-social network targeting Working paper CeDER-11-05 25 Networks among consumers, inferred based on online data, have been used previously to study improved marketing. Richardson and Domingos (2002) build a social network of trust relationships from a knowledge sharing website, where trust is established by giving reviewers good ratings and by explicitly listing reviewers that they trust. They then use this to improve a (simulated) viral marketing campaign, extending their prior theoretical model (Domingos and Richardson 2001). Aral et al. (2009) build a social network among Yahoo.com users based on links formed by instant messaging (IM) traffic, and then use this network for a post-hoc analysis of a prior marketing cam- paign. In a later study, Facebook data is used to define product features that stimulate contagion (Aral and Walker 2011). Also using data from a social network site, Trusov et al. (2009) report on the longer carryover effects of word of mouth compared to traditional marketing actions. Similarly to the above work, all these studies build approximations to a true social network. The primary novelty of the current work is the inference of a pure consumer similarity network, rather than an approximation of the true social network. The notions of homophily and social influ- ence that apply to true social networks do not necessarily apply to these pseudo-social networks, thus the present empirical study is necessary to assess whether indeed the similarity in money transfers generalizes to product affinity (and thus, improved direct marketing). In the most closely related design, Provost et al. (2009) use a bi-partite graph to link browsers to the same user generated content (UGC) pages, such as blogs and social network sites, and then apply the proximity in the resultant network to improving models for online advertising. However, besides being a design specifically for online advertising, they show that their inferred network also embeds a true social network—and that the true social network neighbors of existing customers end up being highly ranked in predictions of who will be good targets for online advertising. More peripherally, but nonetheless relevant, collaborative filtering systems create similarity mea- sures between consumers, in order to recommend products, based on purchases or ratings of these products. In certain cases (e.g., Huang et al. (2007)) explicit network analysis is applied to the corresponding bipartite graph. However, the problem structure of collaborative filtering is signif- icantly different from that of the present problem. Collaborative filtering is based on similarity within a particular area of taste, such as books, movies, music, etc.: prior evidence of similarity in movie preferences (for example) is used to infer future evidence of similarity in movie preferences. Cross-domain recommendations are notoriously problematic (Adomavicius and Tuzhilin 2005). The PSN design instead uses money transfers across all products, services, creditors, employers, etc., to create a broad similarity measure. Then this is applied to estimate affinity for a product that is not (necessarily) within the domain of the money transfers themselves. More technically, the recommender system problem is a “link prediction” task in the net- work (Getoor and Diehl 2005) or alternatively a matrix completion problem. The current work
Martens and Provost: Pseudo-social network targeting
26                                                                                 Working paper CeDER-11-05

uses the similarity measure as an input to a separate predictive modeling task. We are not aware
of any work that has suggested using large-scale, fine-grained data on off-line transactions between
consumers and firms to form a network that will be used for feature creation or for direct network
inference for a separately gathered and labeled target variable (such as response to an unrelated
direct marketing campaign).

5.      Conclusions and Managerial Implications
This paper described a new method for targeting consumers, based on the creation of a pseudo-
social network (PSN) data from money transfer data. For two different products in a banking
setting, PSN targeting is shown to be strikingly better at identifying buyers than targeting based
on a traditional targeting model for small campaigns. Further, the PSN model and the traditional
model comprise complementary information. Combining the two produces a very robust model
that gives better lift and better profit for almost any targeting budget. (The pure PSN still does
better for the smallest campaigns.)
     The PSN design draws out the consumers most similar to key individuals of interest. This sim-
ilarity is broadly based on the tastes, interests, and latent socio-economic constraints represented
by shared recipients and sources of money transfers. In our experiments, the individuals of interest
were prior customers of the products, so the PSN found other consumers who were very similar
along these dimensions to the existing customers. However, the PSN design is not specific to tar-
geting marketing offers. If the individuals of interest instead were chosen to be particularly good
(or bad) known credit risks, the PSN ought to find other very similar consumers. Thus, the PSN
could improve another very common modeling application: estimating creditworthiness. If the indi-
viduals of interest are chosen to be different tranches of total credit exposure, the PSN could be
helpful for predicting wallet share.
     The results have striking implications for larger financial institutions. For traditional modeling,
the results show that the lift (and therefore profit) has stabilized at the sample size used in the
study. Adding more data is not expected to increase the predictive power of socio-demographic
modeling substantially. However, even at this rather large data set size, the PSN modeling is
showing marked improvements in lift. This suggests that the striking results presented in this paper
may underestimate—possibly by a lot—the potential lift achievable by building a PSN from all the
bank’s data. This provides one of the clearest illustrations (of which we are aware) of how large
institutions have an important asset in the data they have collected, an asset from which they
can get substantial competitive advantage over institutions without as much data—for example,
smaller banks.
     The point of this paper was to present and assess a solid, practically implementable PSN design.
We are not claiming that this is in any way the best PSN design possible. For example, using this
You can also read


