VMware Edge Network Intelligence User Guide - VMware Edge Network Intelligence
←
→
Page content transcription
If your browser does not render page correctly, please read the page content below
VMware Edge Network
Intelligence User Guide
VMware Edge Network Intelligence
VMware Edge Network Intelligence User Guide

You can find the most up-to-date technical documentation on the VMware website at:

https://docs.vmware.com/

VMware, Inc.
3401 Hillview Ave.
Palo Alto, CA 94304
www.vmware.com

               ©
Copyright          2021 VMware, Inc. All rights reserved. Copyright and trademark information.

VMware, Inc.                                                                                     2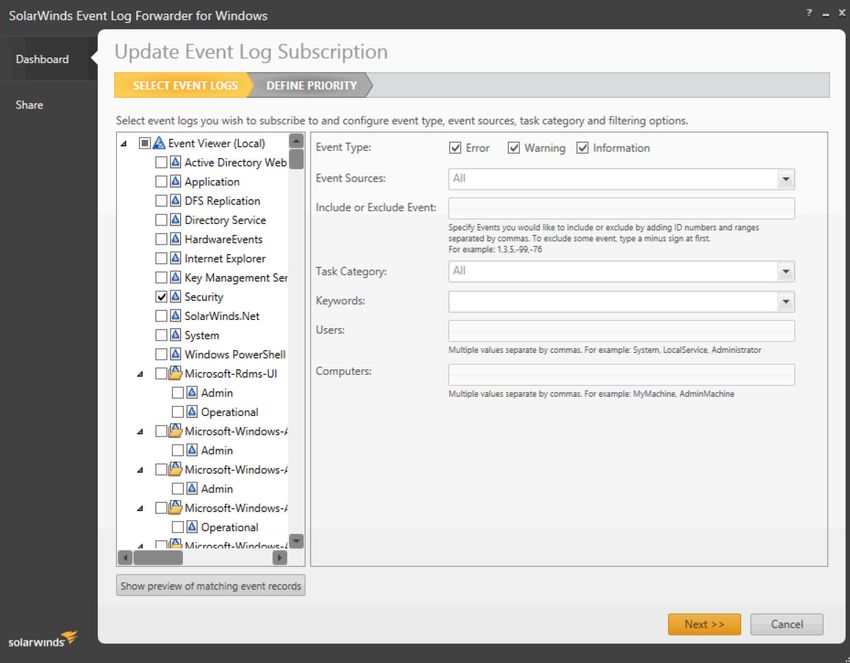
Contents

     1 About This Guide 5

     2 Intended Audience 6

     3 Introduction To VMware Edge Network Intelligence 7
               Overview      7
               Architecture Overview              8

     4 Signing In and User / Role Administration 10
               Signing In    10
               Users and roles         11
                  Magic Link      12
                  Resetting your password                  13
                  SSO       13

     5 Basic Navigation 15

     6 Adding Data Sources 17
               Adding a Native ENI Crawler                 17
               Adding a VMware SD-WAN Edge Crawler for Branch Analytics    19
               RADIUS Integration           20
                  Cisco ISE integration               20
                  Aruba HPEClearpass Integration                      23
                  FreeRADIUS Integration                   25
                  Microsoft RADIUS Integration                   26
               Adding Wireless Controllers                 30
                  Cisco      31
                  Aruba Controller           32
               Zoom API Connector            35
               Crawler Data Collection Flow                 37

     7 Organizing Your Instance by Sites and Groups 39
               Adding Sites       40
               Adding Groups       41

     8 Incidents 43
               Navigating Incidents          43
               Types of Incidents           46

VMware, Inc.                                                                    3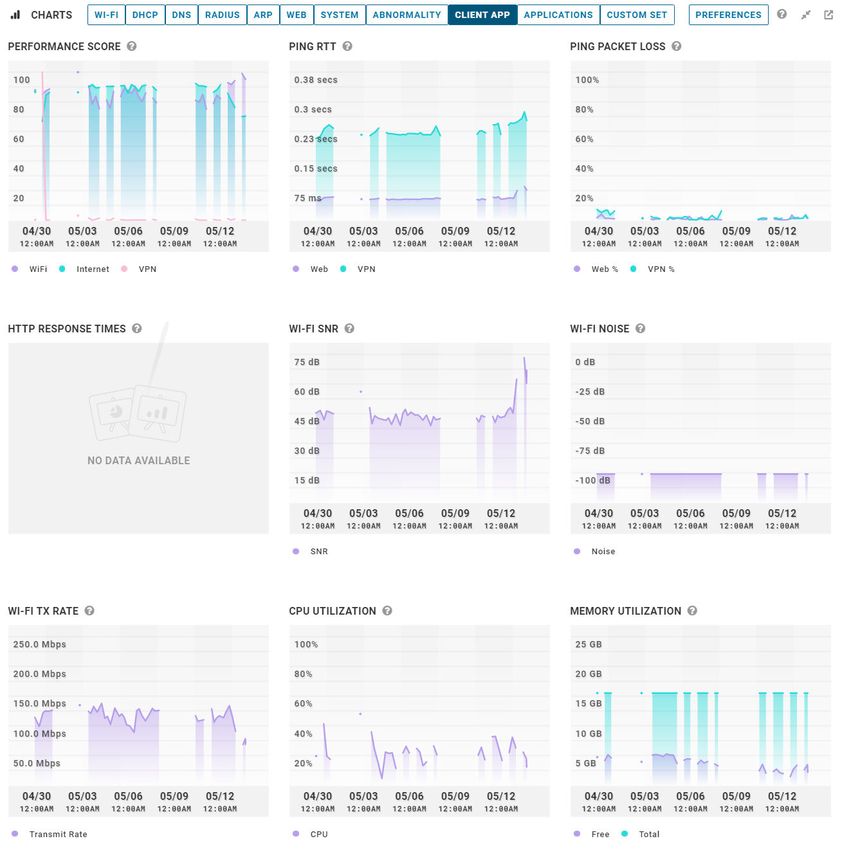
VMware Edge Network Intelligence User Guide
Understanding an Individual Incident 47
Tuning Incidents 48
9 Detail Pages 51
Client Detail 51
AP Details 55
Application Details 64
DHCP/DNS/RADIUS Server Details 65
VLAN Details 67
10 Analytics 68
Network History 68
Hourly Data View 70
Health and Remediation 72
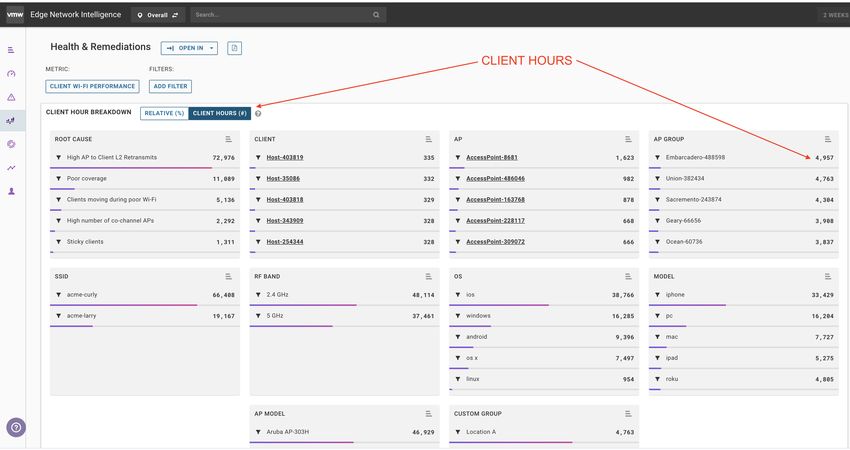
Understanding Relative Percent and Client Hours 73
Filtering in Health and Remediations 74
Benchmarks 77
Performance Metrics 78
11 Introduction to the API 81
12 VMware Edge Network Intelligence Client App 85
Client App Overview 85
Install the Client App 86
Register the Client App 87
Manage Client App Groups for Client App User 90
Access Client App Data in ENI Back-end Analytics Engine 93
Client App Capability Matrix 99
Uninstall the Client App 100
VMware, Inc. 4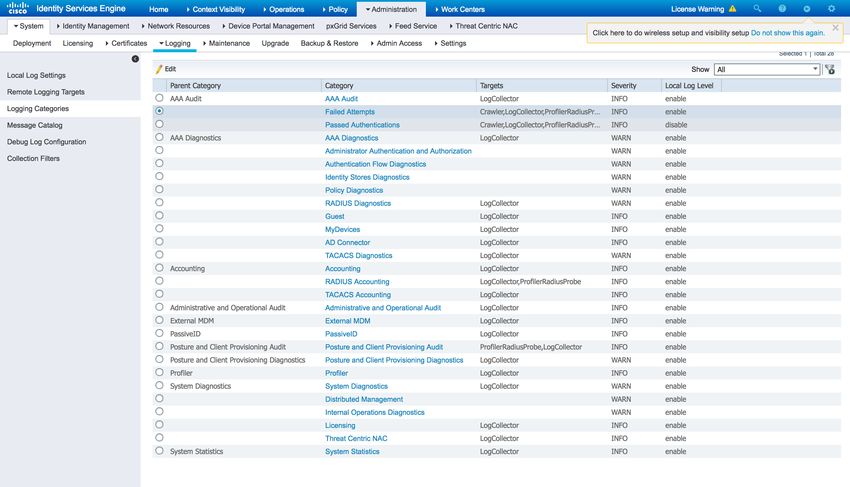
About This Guide
                                                                                             1
This guide covers the basic setup and administration of VMware Edge Network Intelligence™. It
provides information on how to use VMware Edge Network Intelligence. By using this guide and
the Knowledge Base articles, you can set up, tune, and maintain your VMware Edge Network
Intelligence instance. The additional guides cover specific use cases and go deeper into solving
problems with VMware Edge Network Intelligence.

VMware, Inc.                                                                                       5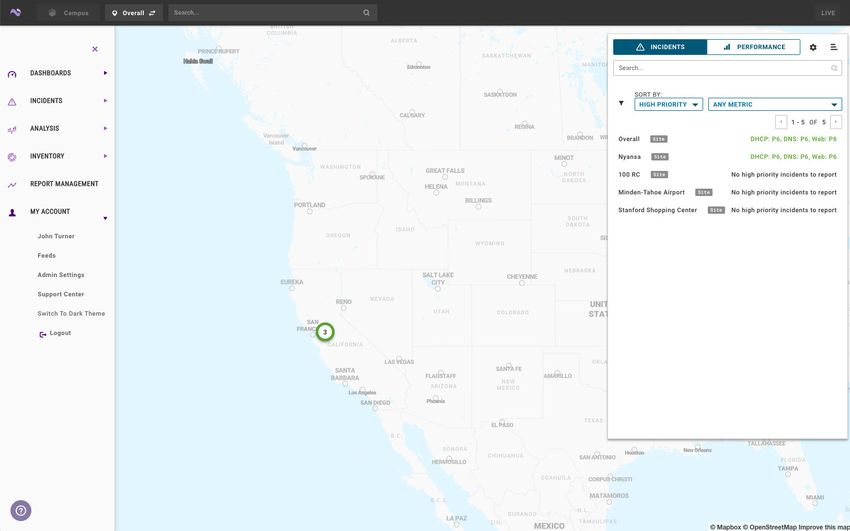
Intended Audience
                                                                                       2
This guide is intended for administrators and users of VMware Edge Network Intelligence.
Depending on your role granted, you might not be able to make changes to the configuration,
but you can view the settings and understand how they affect the data shown.

VMware, Inc.                                                                                  6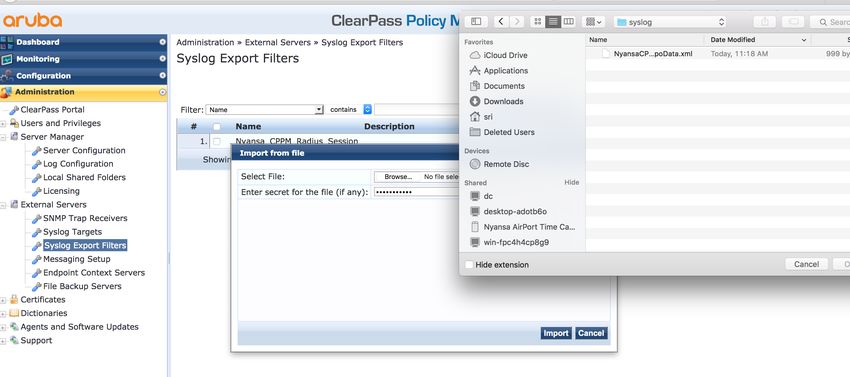
Introduction To VMware Edge
Network Intelligence                                                                         3
This section covers the high-level architecture of VMware Edge Network Intelligence and gives
you a basic understanding of the power of Artificial Intelligence (AI) as it applies to performance
monitoring of the end user.

This section also covers the two main use cases for VMware Edge Network Intelligence:

n   Proactive Troubleshooting

n   Reactive Troubleshooting

This chapter includes the following topics:

n   Overview

n   Architecture Overview

Overview
This section provides an overview of VMware Edge Network Intelligence.

VMware Edge Network Intelligence is an end user performance monitoring tool. It uses machine
learning and big data analytics to baseline device performance on your network and correlate
changes to the baseline to problems in your network. Unlike other network monitoring tools
there are no set thresholds in VMware Edge Network Intelligence. Instead, VMware Edge
Network Intelligence learns what "normal" is in your network and uses that to determine changes
in performance.

VMware, Inc.                                                                                          7

VMware Edge Network Intelligence User Guide

Architecture Overview
This section provides an overview of the architecture of VMware Edge Network Intelligence.

VMware Edge Network Intelligence uses an on-premises device to collect data from many data
sources and then sends that data to the VMware Edge Network Intelligence back-end system
(either in the cloud or on-prem). The device is called a crawler and may be a standalone device, a
virtual machine, or built into a VMware SD-WAN Edge device. The crawler can be located in a
central data center or in branch locations. Multiple crawlers work together to collect data and de-
duplicate any overlapping data. The crawlers collect data from switches, routers, WLAN
controllers, UC systems, RADIUS servers, SPAN sessions, inline data from SDWAN sessions, and
other applications. This data is combined to identify edge devices and their application and
network statistics. Using that data, the VMware Edge Network Intelligence backend creates
baselines for performance and identifies the root cause of any performance or connectivity issue.

Typically, crawlers are placed in the network near to a point where user traffic can be captured
via a SPAN or TAP (this is often near the WLAN controllers). Alternatively, when the crawler is
the same device as the SD-WAN Edge, user data is collected from the pass through traffic. The
crawler management interface is used to collect data from the other components of the system
as well as to send the collected data to the VMware Edge Network Intelligence back-end system.

VMware, Inc.                                                                                      8
VMware Edge Network Intelligence User Guide

Figure 3-1.

VMware, Inc.                                  9
Signing In and User / Role
Administration                                                                           4
This section provides information on how to sign into VMware Edge Network Intelligence and
how to configure user accounts and role-based access.

This chapter includes the following topics:

n   Signing In

n   Users and roles

Signing In
This section provides details on logging into VMware Edge Network Intelligence.

You must have received an email with your sign in information and a link your instance of
VMware Edge Network Intelligence. If you cannot find your email, you can also go to https://
app.nyansa.com and enter your email address to find your instance.

Once you are on your instance, you will be presented with the local VMware Edge Network
Intelligence or you are presented with your organizations single sign-on page.

On your first sign on you will be prompted to set a password.

Important Account access links in email expire within 24 hours. If it has been more than 24
hours, use the forgot password link to set your password.

VMware, Inc.                                                                                   10
VMware Edge Network Intelligence User Guide

Figure 4-1.

Users and roles
This section provides information on users and roles in VMware Edge Network Intelligence.

You can create as many users as you need in VMware Edge Network Intelligence. The users are
identified by email address and can be assigned access permission based on roles.

There are 4 user roles and 3 permission levels in VMware Edge Network Intelligence.

To configure users, navigate to the administration settings menu and the user access tab.

 User Role                                       Description

 All                                             Access to the entire VMware Edge Network Intelligence
                                                 product.

 Network Engineer                                Access to all of the network portions of VMware Edge
                                                 Network Intelligence (Excludes security and Line of
                                                 business).

 Security                                        Access to the IoT portions of VMware Edge Network
                                                 Intelligence.

 Line of Business                                Access to the Critical Devices portions of VMware Edge
                                                 Network Intelligence.

 Service Desk                                    Access to the Service desk dashboard.

VMware, Inc.                                                                                              11
VMware Edge Network Intelligence User Guide
Permissions Description
Owner The primary contact for VMware Edge Network
Intelligence. This role can create and delete all accounts in
the system including admin accounts.
Admin Read Write access to configure VMware Edge Network
Intelligence, can promote other to admin but not demote.
Default Read-only access to VMware Edge Network Intelligence.
Figure 4-2. User Roles
Magic Link
This section provides information on the magic link that help you log in automatically.
If you use the local login (not SSO), VMware Edge Network Intelligence can also send you a
magic link to your email that will log you in automatically.
Note Magic links are for one time use and expire in 48 hours.
VMware, Inc. 12VMware Edge Network Intelligence User Guide Resetting your password This section provides information on resetting the password. If you forget your password, you can reset it using the reset password link on the login page. This will send you a reset password link to your email address. The administrators cannot set or change your password. The only way to set a forgotten password is to use the forgot password link. SSO This section provides information on configuring Single Sign-On (SSO) for VMware Edge Network Intelligence. VMware, Inc. 13
VMware Edge Network Intelligence User Guide

VMware Edge Network Intelligence supports SAML v2.0 based SSO that allows you to use your
corporate identity to log in. Once SSO is enabled, you can no longer sign in or create users in the
user admin section. To deactivate SSO, open a support ticket and we can deactivate it for you.

To configure SSO:

1   Navigate to the admin settings.

2   Click User access.

3   Click SSO is Disabled.

Figure 4-3. SSO Configuration

From there, fill out the SAML information and Role Mapping. Once you click enable SSO, you can
test to make sure it is working.

VMware, Inc.                                                                                      14
Basic Navigation
                                                                                                   5
This section provides information on navigation in VMware Edge Network Intelligence.

Once you log in to VMware Edge Network Intelligence, you will be taken to the dashboard
appropriate to your role and access.

VMware Edge Network Intelligence is broken down into following sections:

 Section                                        Description

 Dashboards                                     Quick summary views of user and device performance

 Incidents                                      Problems with your network or critical devices

 Analysis                                       Information about how your network is performing
                                                compared to internal and industry benchmarks

 Inventory                                      Quick access to device and application level details

 Report Management                              Generate and view reports about your network

 Admin                                          Access to your account settings and configuration for
                                                VMware Edge Network Intelligence

VMware, Inc.                                                                                            15
VMware Edge Network Intelligence User Guide Figure 5-1. VMware, Inc. 16
Adding Data Sources
6
This section describes how to add data sources including crawlers, VMware SD-WAN Edge,
RADIUS, and other external integrations.
VMware Edge Network Intelligence ingests data from many different data sources to identify
users, measure application performance, correlate error messages, and add additional details to
the end-user experience. Adding additional data sources will increase the accuracy of the root
cause analysis that VMware Edge Network Intelligence performs.
This chapter includes the following topics:
n Adding a Native ENI Crawler
n Adding a VMware SD-WAN Edge Crawler for Branch Analytics
n RADIUS Integration
n Adding Wireless Controllers
n Zoom API Connector
n Crawler Data Collection Flow
Adding a Native ENI Crawler
Crawlers in VMware Edge Network Intelligence are the on-prem device that collects data from
your environment to send to the backend. Crawlers can be dedicated devices, , or virtual
machines. This section will cover adding a native ENI crawler.
Prerequisites
Check that your order has arrived complete and in a good condition.
A packing list has been included with your order. If possible, keep the original box and shipping
materials in case you ever have an issue with your hardware that requires a return and
replacement. If there are any problems, from a missing component to shipping damage, email us
immediately at operations@nyansa.com.
Procedure
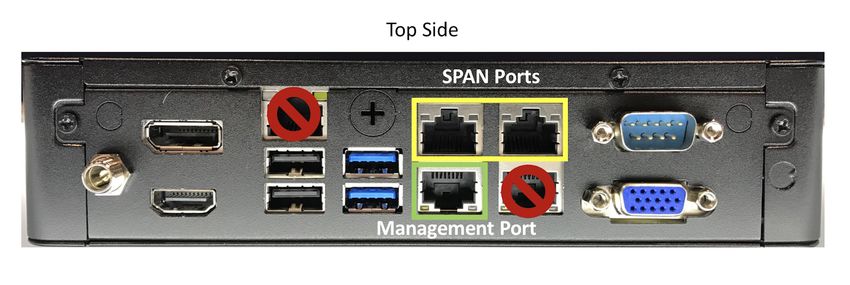
1 Connect the management port (DHCP is enabled by default.
2 Connect the SPAN ports to the SPAN.
VMware, Inc. 17VMware Edge Network Intelligence User Guide 3 Attach the power brick and press the power button. Results The crawler obtains an IP through the DHCP and boot up. Once the crawler is ready, you can log in through SSH or by connecting a keyboard and monitor to the VGA port on the crawler. Figure 6-1. Mini Crawler To attach rails to the mini crawler: 1 Attach the rails with the included screws located in the white box. 2 You can use the shelf on the rail to hold the power supply. Figure 6-2. 19" Rack Mount Crawlers What to do next Once you have connected the crawler, log in to VMware Edge Network Intelligence and navigate to the Feeds section. From there, click Add Crawler and follow the steps to log in and activate your crawler. VMware, Inc. 18
VMware Edge Network Intelligence User Guide

Figure 6-3. Adding a Crawler Guide

Adding a VMware SD-WAN Edge Crawler for Branch
Analytics
VMware SD-WAN Edges can be added to VMware Edge Network Intelligence to collect user
traffic at the branch by configuring them for branch analytics. This process is accomplished
through the SD-WAN Orchestrator interface used to configure your SD-WAN Edges. SD-WAN
Edges can only be added this way and not directly through the VMware Edge Network
Intelligence interface.

To add a SD-WAN Edge you need to be running at least version 4.1 of VMware SD-WAN. Follow
the instructions on this page to add your edge.

For complete information on how to enable VMware Edge Network Intelligence on SD-WAN
Orchestrator, see VMware Edge Network Intelligence Configuration Guide available at https://
docs.vmware.com/en/VMware-SD-WAN/index.html.

Important The analytics interface must be configured with an IP address. This IP address will be
used to communicate with local network devices to collect data such as WLAN statistics, receive
SNMP traps, etc. Make sure this IP address has access to collect data from the network devices.

VMware, Inc.                                                                                   19
VMware Edge Network Intelligence User Guide

RADIUS Integration
Adding RADIUS integration to VMware Edge Network Intelligence allows you to see the specific
RADIUS authentication messages related to a devices network authentication. Without this
integration RADIUS messages are not decoded and can only report the success or failure of an
authentication request.

RADIUS integration is accomplished by creating syslog profiles and adding the Crawler as a
syslog target. Once you add the crawler as a syslog target the crawler will automatically detect
the syslog feed and the feed status will appear.

You will then see specific syslog authentication messages for success and failure on client detail
pages in the event timeline, in RADIUS incidents, and in Health and Remediations as specific
failure reasons.

Cisco ISE integration
Adding Cisco ISE integration to VMware Edge Network Intelligence allows you to see the specific
RADIUS authentication messages related to a devices network authentication. Without this
integration RADIUS messages are not decoded and can only report the success or failure of an
authentication request. This integration is accomplished using the syslog logging target in the ISE
server.

Follow these steps to add the VMware Edge Network Intelligence crawler as a syslog collector in
ISE.

Step 1: Choose Administration > System > Logging > Remote Logging Targets.

Figure 6-4.

Step 2 : Click Add and configure the following fields. Then click Save.

 IP Address                           IP Address of the crawler that will receive the syslogs - can be any crawler

 Port                                 514

VMware, Inc.                                                                                                         20
VMware Edge Network Intelligence User Guide

 Facility Code                        Local6

 Maximum Length                       8192 (Must be over 8000)

 Status                               Enabled

Figure 6-5.

Step 3 : Verify the creation of the new target under the Remote Logging Targets page

Step 4 : After you have created the syslog storage location, in the Logging Target page, you
need to map the storage location to the required logging categories, to receive the logs.

Step 5: Select Administration > System > Logging > Logging Categories.

Under Failed Attempts, click Edit and select the Crawler that you just created.

VMware, Inc.                                                                                   21
VMware Edge Network Intelligence User Guide

Figure 6-6.

Step 6: Add the crawler to the passed authentications logging category.

Under Logging categories, verify whether the crawler is under the Failed attempts or Pass
authentication targets.

VMware, Inc.                                                                                22
VMware Edge Network Intelligence User Guide

Figure 6-7.

Important Anytime the maximum length is changed you must remove and re-add the crawler
target.

Aruba HPEClearpass Integration
Adding Aruba Clearpass integration to VMware Edge Network Intelligence allows you to see the
specific RADIUS authentication messages related to a devices network authentication. Without
this integration RADIUS messages are not decoded and can only report the success or failure of
an authentication request. This integration is accomplished using the syslog logging target in the
Clearpass server.

Integration with Aruba Clearpass is accomplished using a syslog profile template that you will
import into your Clearpass configuration. You will need to download the template before
proceeding with the integration. You can download the template here: Clearpass XML template

Step 1. Download the xml template

Step 2. Log into the Clearpass server and navigate to the syslog export filter: Administration >>
External Servers >> Syslog Export Filters

Step 3. Select IMPORT from the top right corner and select the XML template you downloaded in
the first step "NyansaCPPMSyslogExpoData.xml" and click import

VMware, Inc.                                                                                        23
VMware Edge Network Intelligence User Guide

Figure 6-8.

Step 4. Navigate to the syslog targets page: Administration >> External Servers >> Syslog targets
and select the target with the host address change.me and change the host address to the IP
Address of the crawler that will receive the syslogs (can be any crawler) and click save

Figure 6-9.

Step 5. In a few minutes, you should see the syslog feed indicator appear on the crawler you
pointed the syslog target to.

VMware, Inc.                                                                                   24
VMware Edge Network Intelligence User Guide

FreeRADIUS Integration
Adding FreeRADIUS integration to VMware Edge Network Intelligence allows you to see the
specific RADIUS authentication messages related to a devices network authentication. Without
this integration RADIUS messages are not decoded and can only report the success or failure of
an authentication request. This integration is accomplished by adding the crawler as a syslog
logging target.

Minimum Supported Radius: 3.0.15

You can run radiusd -v to check the version of your freeradius.

Step 1:

Edit the Radius configuration file "radiusd.conf" as shown:

 #logdir replace "/var/log/freeradius" by "syslog"
 ${localstatedir}/log/radius

 Under log settings:
 #destination - replace "files" by "syslog"
 destination = syslog

 #default is daemonsys
 log_facility = daemon
 stripped_names = no

 #Log authentication requests to the log file.
 auth = yes

 #Audit password if it's rejected.
 auth_badpass = no

 #Audit password if it's correct.
 auth_goodpass = no

 Add the format for msg_goodpass and msg_badpass as follows:
 For Aruba:

 msg_goodpass = "CallingStationId=%{Calling-Station-Id}, CalledStationId=%{Called-Station-Id}, ESSID=%
 {Essid-Name}, APName=%{AP-Name}, Subject=%{TLS-Client-Cert-Subject}"

 msg_badpass = "CallingStationId=%{Calling-Station-Id}, CalledStationId=%{Called-Station-Id}, ESSID=%
 {Essid-Name}, APName=%{AP-Name}, Subject=%{TLS-Client-Cert-Subject}"

 For Cisco:
 msg_goodpass = "CallingStationId=%{Calling-Station-Id}, CalledStationId=%{Called-Station-Id}"

 msg_badpass = "CallingStationId=%{Calling-Station-Id}, CalledStationId=%{Called-Station-Id}"

 Note - We support the following formats for CalledStationId -
 MAC address of the Access Point
 AP Name with ESSID separated by a colon, AP-name:ESSID

VMware, Inc.                                                                                             25
VMware Edge Network Intelligence User Guide Step 2: Restart FreeRADIUS If you're running Debian Linux or Ubuntu Linux: /etc/init.d/freeradius restart If you're running Red Hat Enterprise Linux service: radiusd restart If you're running FreeBSD operating system: /etc/rc.d/radiusd restart Step 3 Edit /etc/rsyslog.conf file and add the following #Enable UDP module $ModLoad imudp $UDPServerRun 514 #FreeRADIUS log daemon.* @ Step 4 Restart Rsyslog If you're running Debian Linux or Ubuntu Linux: /etc/init.d/rsyslog restart If you're running Red Hat Enterprise Linux: service rsyslog restart If you're running FreeBSD operating system: /etc/rc.d/syslogd restart Microsoft RADIUS Integration Adding Microsoft RADIUS integration to VMware Edge Network Intelligence allows you to see the specific RADIUS authentication messages related to network authentication. Without this integration RADIUS messages are not decoded and will only report success or failure. This integration is accomplished using the Solarwinds log forwarder for Windows and adding the crawler as a syslog logging target. Download the free event log forwarder from Solarwindshttps://www.solarwinds.com/free-tools/ event-log-forwarder-for-windows Important Make sure you have the event logger enabled on your Microsoft radius server. Step 1: Install the log forwarder and then open it to begin configuration Step 2: Add a subscription to the event logs to forward to the Crawler. From the Solarwinds Dashboard > Subscriptions, add a new subscription by choosing "Add" VMware, Inc. 26
VMware Edge Network Intelligence User Guide

Figure 6-10.

Step 2: Select the event log type "Security" to subscribe from the left column tree view control
and make sure you include Error, Warning, and Information from the Event Type.

VMware, Inc.                                                                                       27
VMware Edge Network Intelligence User Guide

Figure 6-11.

Step 3: Under SolarWinds, From the Dashboard > Syslog Servers, add a new Syslog server by
choosing "Add".

VMware, Inc.                                                                                28
VMware Edge Network Intelligence User Guide

Figure 6-12.

 Server name                                  Crawler Name

 Server address

 Port                                         514

 Protocol                                     UDP

VMware, Inc.                                                        29
VMware Edge Network Intelligence User Guide

Figure 6-13.

Adding Wireless Controllers
VMware Edge Network Intelligence uses data from WLAN controllers to identify wireless users
and collect information about the quality of the Wi-Fi connection. VMware Edge Network
Intelligence supports many different WLAN vendors simultaneously. The following table lists the
vendors supported and required feeds. For detailed configuration, see the chapters on the
specific vendors.

 Vendor               API                     SNMP get   SNMP Trap   CLI         Vendor Specific

 Cisco Controller                             X          X                       Cisco Telemetry

 Cisco Meraki         X

 Aruba HP                                     X          X           X           Aruba Amon

 Mist                 X                                                          Webhook

 Extreme                                      X          X           X

 Ruckus                                       X          X           X

VMware, Inc.                                                                                       30
VMware Edge Network Intelligence User Guide

Cisco
Detailed instructions and requirements for adding a Cisco WLAN controller to VMware Edge
Network Intelligence. You can add as many WLAN controllers as needed.

Prerequisites

Before starting, you must have the IP address of the controller and either an SNMP V1/V2C
community string or an SNMP V3 username and password. In addition, you need to make sure
the crawler has connectivity to the crawler for SNMP and optionally Cisco telemetry.

You will need to set up SNMP traps on your WLAN controller and add the crawler IP address as
the target. If you have multiple crawlers, you must choose the crawler that is associated to the
site where the controller is located. Crawlers use the trap source to identify the controller and
assigns the trap receiver as the SNMP get source. Set the trap source to be the same IP as
defined in the controller setup.

Procedure

1    Navigate to Admin settings > Feeds > Controllers.

2    Click + Add Controller and select Cisco from the Manufacturer drop-down menu.

3    Enter a name for the controller, IP address, and choose the SNMP version and fill out the
     community string, or username and password.

     Figure 6-14. Adding a Cisco Controller

VMware, Inc.                                                                                        31
VMware Edge Network Intelligence User Guide
Results
Once you have added a controller and the controller begins to send SNMP traps, the crawler
reaches out and begin to collect data. If all goes well, the feed must look like the following
example- choosing the controller will display specific details on the feeds.
Figure 6-15. Cisco Feed Status
Aruba Controller
Detailed instructions and requirements for adding an Aruba HP WLAN controller to VMware
Edge Network Intelligence. You can add as many WLAN controllers as needed.
Prerequisites
To add an Aruba WLAN controller to VMware Edge Network Intelligence, you need to configure
a read-only user, Aruba Management (AMON) server, SNMP community or username, and SNMP
trap destination. To do this you will need access to the Aruba WLAN controller and or Aruba
Mobility controller.
Procedure
1 In the Aruba Controller add a new user with read-only access to the controller. This user is
used to pull additional data from the Aruba WLAN controller on a periodic basis.
2 Create a new AMON profile on the Aruba controller with the options shown below.
3 Create a new management server pointing to the crawlers IP address and assign it the profile
you created in Step 2
4 Create an SNMP V2 community string or a V3 username and password
5 Create a trap receiver and point it to the crawler IP
6 Open the feeds section of VMware Edge Network Intelligence, navigate to the controller tab,
and click the add new controller and choose Aruba.
VMware, Inc. 32VMware Edge Network Intelligence User Guide
7 Fill out the details with the information you created above.
Figure 6-16. AOS 6.5.x AMON
VMware, Inc. 33VMware Edge Network Intelligence User Guide
Figure 6-17. Aruba 8.X AMON
VMware, Inc. 34VMware Edge Network Intelligence User Guide Results Figure 6-18. Example: What to do next Once the crawler receives a trap message from the controller it begins SNMP gets and CLI collection from the controller. You must see that the feeds status populates in a few minutes of adding a controller. Zoom API Connector The Zoom API connector allows you to connect your Zoom enterprise account with VMware Edge Network Intelligence to allow you to diagnose Zoom quality issues. By correlating Zoom performance reporting with infrastructure data VMware Edge Network Intelligence can identify root cases for Zoom performance issues. To install the VMware Edge Network Intelligence Zoom connector you will need to work with your enterprise Zoom administrator. Installation of the API connector must be done on the enterprise account and cannot be installed by individual users. Once installed it will report QOS data on every zoom meeting to VMware Edge Network Intelligence. 1 In the Analytics portal, go to My Account > Feeds. The Feeds page appears. VMware, Inc. 35
VMware Edge Network Intelligence User Guide

2   Click the CLOUD API tab.

3   Click ADD CLOUD API CONFIG and from the Vendors drop-down menu, select ZOOM.

4   Click the Authorize Zoom Application link to authenticate as an administrator to your Zoom
    instance, and click SAVE.

    Figure 6-19. Authorize the API Connector

5   After clicking the Authorize link, it may take up to 24 hours to see Zoom data in your system.
    Once the data is flowing, Zoom QoS data should be populating your VMware Edge Network
    Intelligence instance.

6   Validating API Data - Once the connector has been authorized and installed you should see
    the Zoom application in your application inventory. Clicking on the Zoom app will populate
    Zoom data in the graphs as shown below.

VMware, Inc.                                                                                     36
VMware Edge Network Intelligence User Guide
Figure 6-20. Zoom Data
Note
n To remove the Zoom integration on ENI, delete the Cloud API Config by clicking the DELETE
CONFIG button in the Feeds page.
n To de-authorize the Zoom ENI connector, login to the Zoom App Marketplace using your
Administrator Zoom account and then click Manage Installed Apps. Search for the ENI
Connector application and click Uninstall to remove the application from your Zoom account.
Crawler Data Collection Flow
Crawlers collect and send data to the VMware Edge Network Intelligence backend for analysis
and correlation. The crawlers collect data from local sources as described in this doc and from
SPAN or SD-WAN interfaces. Multi crawler deployments use a process to automatically assign
the crawler to collect the data.
Crawlers collect data through SPAN/TAP, SD-WAN integration, and from other network devices
using SNMP, Syslog, and API integration. When network devices are configured in VMware Edge
Network Intelligence the crawler will automatically begin to collect data from the device. The
following table describes how the crawler communicates with the network devices. In multi
crawler or branch deployments crawlers will automatically be assigned to collect data based on
the assignment criteria below
VMware, Inc. 37VMware Edge Network Intelligence User Guide
Feed Data Flow Crawler assignment
WLAN controller SNMP Gets Polling is initiated from the crawler Based on the crawler SNMP Traps are
management interface or analytics sent to. If a crawler receives a trap
interface (SD-WAN Edge) to the from a WLAN controller it will initiate
network device SNMP polling to that WLAN controller
SNMP Traps, Aruba AMON, Cisco From WLAN controller or device to Requires configuration on the
Telemetry, RADIUS syslog crawler management interface or specified device to point the feed to
analytics interface (SD-WAN Edge) the appropriate crawler
CLI From crawler management interface Based on the crawler SNMP Traps are
or analytics interface (SD-WAN Edge) sent to. If a crawler receives a trap
to WLAN controller from a WLAN controller it will initiate
CLI data capture to that WLAN
controller
UPS/SNMP Agent/Network Switch From device to crawler management Crawlers will round robin until
SNMP Gets interface or analytics interface (SD- successful response is received.
WAN Edge) Optionally network switches can be
manually assigned through the ENI
configuration page
SPAN From SPAN/TAP to crawler N/A
SPAN/TAP interface
SD-WAN traffic Automatic for all traffic to/from N/A
Global Segment
MIST API, Zoom API, Client App Direct to Cloud or Private Cloud N/A
VMware, Inc. 38Organizing Your Instance by Sites
and Groups 7
VMware Edge Network Intelligence can be used to manage your entire organization across the
globe. To make it easier to see where performance problems exist you can create sites and
groups.
VMware Edge Network Intelligence has a hierarchical organization of Sites and Groups. Once a
site or group is created, VMware Edge Network Intelligence will begin to create performance
baselines
Sites are typically used for geographically separated parts of your organizations such as branch
offices or campuses. Within VMware Edge Network Intelligence you can assign security roles to
restrict users to specific sites. Alerts in VMware Edge Network Intelligence are also generated on
a per site basis and users can set up notification on a per site basis
Groups are used to define an area within a site, typically buildings and floors, however you are
not limited to just those groups, you could create a group for an area inside a building such as a
cafeteria, lecture hall, or large meeting space. You can also create a group for outdoor users.
Groups are defined as collections of Access Points or as a hierarchical group of groups. The
following table describes the types of groups in VMware Edge Network Intelligence.
Type Parent Required Fields Purpose
Site None/Overall Address Geographical sites
Preset Site None Comes from the WLAN
controller
Custom Site AP List/AP Group Free form grouping of APs
Building Site Address Define building
Floor Building Floor number, AP List/ Define floor can have a
Group floor plan associated
This chapter includes the following topics:
n Adding Sites
n Adding Groups
VMware, Inc. 39VMware Edge Network Intelligence User Guide
Adding Sites
A site in VMware Edge Network Intelligence is a geographic location with a crawler and groups
tied to it. It is used to isolate incidents and alerts to that site that are distinct from other locations.
Typically, sites may have a different ISP, DNS server, WLAN controller. Some examples are
different campus's, branch offices, retail locations, and so on. A site would typically not be a
building on a campus. A site may be a large public venue on campus, such as a stadium or arena.
When scoping VMware Edge Network Intelligence to a particular site, traffic from that site will be
isolated and analyzed as a unit. It also allows for more granular control subscribing to alerts by
site.
Procedure
1 Navigate to the admin settings and click the Sites link - new instances will have no site
defined.
2 Choose the actions menu and choose add site.
3 Fill out the site name, address, and optionally Crawlers, Controllers, or Subnets.
VMware, Inc. 40VMware Edge Network Intelligence User Guide
Results
Figure 7-1. Adding a Site
Adding Groups
A group in VMware Edge Network Intelligence is a collection of APs or is used to hold other
groups (for example, buildings contain floors). Groups allow you to isolate performance baselines
for just those APs. Groups are a powerful way to look at different areas of your environment
without making changes to the actual infrastructure.
Procedure
1 Navigate to the Admin settings and click the AP & CUSTOM GROUPS link - by default
VMware Edge Network Intelligence imports groups from your WLAN controller
2 To add or change an existing group, click the EDIT button
3 To add a group, click the NEW AP GROUP button
4 Fill out the NAME, TYPE, PARENT, and select APs or define a wildcard to match APs for this
group
VMware, Inc. 41VMware Edge Network Intelligence User Guide
5 Click the SAVE button. The SAVE button is enabled only if there are no errors on the page.
Results
Figure 7-2. Adding a Site
Field Purpose Required
Name Display name for the group Always Required
Type One of - Custom, building, floor Always Required
Floor Floor Number When the type is building
Floor Map Upload a floor map to a floor Optional, but only available when the
type is floor
Parent Parent of the group type Required, Groups and buildings must
be set to a site, floor must be set to a
building
AP's A list of AP names or a wild card Required when AP groups are blank
using * for substitution
AP Groups A list of AP groups to match on from Required when AP is blank
the WLAN controller
Address Street address Required for the type building
VMware, Inc. 42Incidents
8
VMware Edge Network Intelligence will begin to baseline your environment as soon as you start
adding data. Within 2 days the AI engine starts creating incidents for performance issues that fall
outside of your established baselines. These incidents can be scoped to a particular site or to the
entire or overall organization.
VMware Edge Network Intelligence has a set of built in performance indicators that analyze your
environment looking for problems that may be causing end user device issues. As the system
learns about your network it will categorize these incidents into P1-P6 level incidents.
Table 8-1. Priority Levels
Level Description
P1 - P2 Production level incidents affecting a significant portion of
your users or that have a major impact on performance.
P3-6 Warning level incidents that are affecting a small
percentage or having a small impact on performance
The priority settings have been tuned by default but can be adjusted in the admin settings to
make them more or less sensitive to baseline changes.
Important It is important to tune incidents on a regular basis to minimize false positives in
VMware Edge Network Intelligence. Tuning incidents teaches the AI what's important and what's
not important to you. Overloading your inbox with false positives will keep you from seeing more
serious issues.
This chapter includes the following topics:
n Navigating Incidents
n Types of Incidents
n Understanding an Individual Incident
n Tuning Incidents
Navigating Incidents
VMware Edge Network Intelligence generates incidents based on machine learning and analysis
of your environment. Systemic incidents are generated for each defined site and for the overall
VMware, Inc. 43VMware Edge Network Intelligence User Guide organization. These incidents are assigned a severity and displayed on the systemic incident page. You can also create alerts for incidents based on the priority and site the incident was generated for, see the alerts section for information about how to subscribe to alerts. Navigate to the Systemic alerts page from the incident menu: Figure 8-1. You can scope the incident page to a specific site by changing the site from the top navigation VMware, Inc. 44
VMware Edge Network Intelligence User Guide

Figure 8-2.

You can filter the incidents by severity and by the type of incident. Incidents with no priority are
shown with a "-" meaning no priority was set.

By default, the incidents shown are scoped to the last 24 hours, to change the date use the date
picker on the upper right corner. Incident details are only saved for maximum of 14 days - this is
not configurable.

VMware, Inc.                                                                                           45
VMware Edge Network Intelligence User Guide

Figure 8-3.

Incidents with the               indicator were generated due to a deviation in the baseline
performance.

Figure 8-4. Example of a Deviation-Based RADIUS Incident

Types of Incidents
VMware Edge Network Intelligence creates incidents based on machine learning and statistical
analysis of the client and infrastructure behavior on your network.

VMware, Inc.                                                                                   46
VMware Edge Network Intelligence User Guide

Understanding an Individual Incident
You can view the details of incidents generated in VMware Edge Network Intelligence by
navigating to the systemic incident page and clicking on an incident or by clicking on an incident
from an alert email.

Depending on the type of incident VMware Edge Network Intelligence will show you why the
incident was generated and allow you to see what clients were affected for this incident. For
analytic incidents you will see the baseline of the metric and the deviation from the baseline. You
will also see the root causes discovered by the machine learning engine. For any given incident
there may be several possible root causes found. VMware Edge Network Intelligence will also
group the devices affected in the incident by the most likely root cause.

In this analytics incident you see the normal baseline and the deviation or change from the
baseline that triggered this incident.

We also see a list of the most common shared properties for the clients affected. This can help
you determine systemic issues with infrastructure, or across specific client types or client OS's

The potential root causes are listed together with suggested remediations or Next Steps.

You can also get a list of the specific clients affected and drill down into each client to see
specific details.

VMware, Inc.                                                                                        47
VMware Edge Network Intelligence User Guide

Figure 8-5.

Tuning Incidents
Incident generation can be tuned in VMware Edge Network Intelligence to better match your
environment. It is especially important to tune new instances to ensure that false positive incident
generation does not create too many alerts and erodes the trust in ENI.

By default, VMware Edge Network Intelligence incident generation comes pre-tuned to the
optimal setting for most Enterprises. You can add custom applications or alter the default
settings from the Admin settings > Incident priority page.

VMware, Inc.                                                                                      48
VMware Edge Network Intelligence User Guide

Terminology
Priority profiles

Presets that let you define how each incident type behaves in your environment. Incidents are of
two types:

1. Incidents that measure the % of clients affected, wherein the key to setting priorities is setting
the amount of deviation from the baseline you are willing to tolerate and the minimum % of
clients that need to be affected before the priority increases to P2 or even P1. For more
important issues, you must set to 'smaller deviation tolerance' to indicate that even a small
deviation from the baseline must increase the incident priority.

2. Incidents that are binary: server outages fall under this bucket wherein either a server is in
outage (for example, not responding to requests), or it's not. For these issues, the priority is
binary, i.e., if the server is in outage, it must be "always priority PX".

Deviation tolerance

Specify how big of a deviation from the baseline and what % of clients must be affected for these
types of issues to become critical.

Profile Descriptions
Large deviation tolerance

Typically used for lesser important incident types (for example clients had slow radius latency).
Incidents with this priority profile starts off as a P6. If there a 1 standard deviation from the
baseline it increases to P5. If there is a 2 standard deviation from the baseline and it affects at
least 5% of clients, it increases to P3. If there is a 3 or more standard deviation and it affects at
least 10% of clients, it increases to P2. Incidents with this priority profile can never reach P1.

Medium deviation tolerance

Typically used for the slightly less important incident types (for example clients had poor web
performance). Incidents with this priority profile starts off as a P5. If there a 1 standard deviation
from the baseline it increases to P4. If there is a 2 standard deviation from the baseline and it
affects at least 5% of clients, it increases to P3. If there is a 3 or more standard deviation and it
affects at least 10% of clients, it increases to P2. Finally, if there is a 4 or more standard deviation
increase and it affects more than 30% of clients it increases to P1.

Small deviation tolerance

Typically used for the most important incident types (for example clients could connect due to
X). Incidents with this priority profile starts off as a P4. If there a 1 standard deviation from the
baseline it increases to P3. If there is a 2 standard deviation from the baseline and it affects at
least 5% of clients, it increases to P2. If there is a 3 or more standard deviation and it affects at
least 10% of clients, it increases to P1

Always PX (for example P2, P3, P4)

VMware, Inc.                                                                                            49
VMware Edge Network Intelligence User Guide

Typically used for server outages that are binary: either they are happening or not. Whenever
incidents of this type are triggered, they must always be of this particular priority.

No Priority

Typically used for incidents where short run deviations are not actionable (for example clients
have poor Wi-Fi performance); incidents of this type become actionable when viewed in the
context of analysis of systemic issues over a longer period of time. Incidents with this profile will
not have a priority assigned to them. Alert emails will not be sent for these incidents; however,
they will still show up at the bottom of the Incident Page when the 'All Incidents' filter has been
selected.

Disabled

Incidents with this profile will not be shown in the UI.

VMware, Inc.                                                                                        50
Detail Pages
                                                                                             9
When looking at Clients, AP's, Servers, Controllers, and so on VMware Edge Network Intelligence
uses a standard detail page format. The elements have a similar format and functionality across
the different device types. It's important to understand these elements as some elements contain
additional detail when clicked

Detail pages are typically made up of one or more detail "cards". The top card is usually the
identifying information for the item and may contain historical information such as the last few IP
addresses a device has had. Other elements of the detail pages include incidents for clients, top
talkers for applications, AP neighbors for APs, and all have some degree of raw data graphs.

Detail pages are also scoped to the time picker in the upper right corner, though not all detail will
follow the constraints as noted below.

This chapter includes the following topics:

n   Client Detail

n   AP Details

n   Application Details

n   DHCP/DNS/RADIUS Server Details

n   VLAN Details

Client Detail
You can get to details page for a client in many ways - including searching by hostname,
Username, IP address, and Mac Address. The client detail page contains connectivity, application
performance, and client level incidents.

VMware, Inc.                                                                                        51
VMware Edge Network Intelligence User Guide Figure 9-1. Client Details The top card contains information about a client device, depending on the identifying information there may be more information in the top card. In this case we have information about the wireless and wired switch port the device was connected to. We may also see ISP information for clients connecting remotely. Figure 9-2. Client detail top card VMware, Inc. 52
VMware Edge Network Intelligence User Guide

Clicking on one of these elements will display additional information. For example, in this Client
detail, there is a (2) next to the SSID, which indicates the client is connected to more than one
SSID. It also includes the date it was last seen by ENI.

Figure 9-3. Multiple values

The next section is the incidents section for the client detail page. If ENI detects an issue with the
performance for a client, it is surfaced in the incident section. The details include all of the times
the client had the issue, any root causes that ENI determined. Clicking on the View Evidence
button will take you directly to the raw data that ENI used to identify the problem.

Figure 9-4. Client Incidents

VMware, Inc.                                                                                         53
VMware Edge Network Intelligence User Guide

The charts section shows RAW details about the client and allows you to zoom into a 1 min level
of detail anytime in the past 2 weeks. To zoom in click and drag with your mouse. You can also
turn off elements by clicking on the small dot in the legend.

Figure 9-5.

On the right side of the client details is the event timeline. The event timeline shows you all of the
connectivity and authentication events for a client, including Wi-Fi associate/de-associate,
RADIUS authentication, DHCP requests, Web connections, and other application events. You can
filter the timeline to a specific event such as AP association to show you the association history
of a client.

VMware, Inc.                                                                                        54
VMware Edge Network Intelligence User Guide

Figure 9-6.

AP Details
You can get to the AP details page from any AP link in ENI or by searching for an Access Point in
the search box. AP details are scoped by the time picker in the upper right corner and show
details to the 1 min level for the last 2 weeks.

VMware, Inc.                                                                                    55
VMware Edge Network Intelligence User Guide

Figure 9-7. AP Details

The top two cards show information about the AP including the switch port it is connected to,
Radio details (channel, power, protocol etc.) and any historical items including HA controller.

VMware, Inc.                                                                                      56
VMware Edge Network Intelligence User Guide

Figure 9-8. AP Top Card

The AP incidents card shows any AP related incidents, including Radar events, Reboots, low
channel availability etc. The details of the events include common attributes such as channel or
AP groups. Clicking the View Evidence button takes you to the raw details ENI used to determine
the issue.

VMware, Inc.                                                                                  57
VMware Edge Network Intelligence User Guide

Figure 9-9. AP Incidents

The AP clients detail card shows the list of clients that were connected to the AP in the time
frame selected. NOTE: the details are the last seen values for the clients not the values scoped to
the time picker.

Figure 9-10.

The AP location card shows the AP location on the floor map if the AP is associated with a floor
plan and placed on the map

VMware, Inc.                                                                                       58
VMware Edge Network Intelligence User Guide

Figure 9-11. AP Location

Access Point Neighbors card shows all of the neighbors to the selected AP. You can use this card
to see what the density of the environment looks like and is a great way to understand how your
radio power levels affect the number of neighbors seen and from a channel perspective where
the overlap exists. You can adjust the SNR and RSSI thresholds to tune to your desired min levels.
The Current, Max, and All buttons show you a snapshot of the history of the neighbors heard by
this AP. The larger the ball the more clients, the darker the line the higher the RSSI, and if the ball
is RED, it indicates the neighbor is on the same channel.

VMware, Inc.                                                                                         59
VMware Edge Network Intelligence User Guide

Figure 9-12. AP Neighbors

Rogue Access Points shows a similar graph with rogue AP's listed

Figure 9-13.

Noise sources is a similar graph showing AP noise sources. If you have spectral scanning turned
on in your WLAN environment ENI will show you them on this graph.

VMware, Inc.                                                                                      60
VMware Edge Network Intelligence User Guide

Figure 9-14. AP Noise Sources

The charts section shows you raw information about the AP and is very useful when debugging
an issue. The RAW data for AP's is available for the past 2 weeks on a min by min basis.

Figure 9-15. AP Charts

VMware, Inc.                                                                                  61
VMware Edge Network Intelligence User Guide

The AP event timeline shows information about channel and power changes, and reboots and
rebootstrap events.

VMware, Inc.                                                                               62
VMware Edge Network Intelligence User Guide

Figure 9-16.

VMware, Inc.                                  63
VMware Edge Network Intelligence User Guide

Application Details
You can get to the application details page through the application inventory page. The
application details page is scoped by the site selector so you can narrow down the application
details to a specific site or for the overall organization.

The application details page is broken down by:

Top talkers - these are the most frequent users of the application by traffic.

Figure 9-17. App Top Talkers

All clients - these are all of the devices that used the application in the time frame selected (2
week window)

Figure 9-18. App All Users

Charts - the raw details showing usage, bytes, retransmit %, round trip, and response times.

VMware, Inc.                                                                                         64
VMware Edge Network Intelligence User Guide

Figure 9-19. App Charts

DHCP/DNS/RADIUS Server Details
ENI tracks the details of DHCP, DNS, and RADIUS server details, including transaction times and
response rates. You have the ability to compare the performance of these servers against each
other.

One of the unique features of ENI is that the system tracks the response rates for critical network
services. Located in the inventory section under the servers section you will see all of the DHCP,
DNS, and RADIUS servers that ENI has detected on the network. This includes DNS servers not
handed out by your DHCP system.

VMware, Inc.                                                                                      65
VMware Edge Network Intelligence User Guide

Figure 9-20. DHCP, DNS, and RADIUS server

Clicking into one of the services allows you to see overall performance, but also allows you to
compare individual server response times against each other by creating a Custom Set

Figure 9-21. DNS Details

VMware, Inc.                                                                                      66
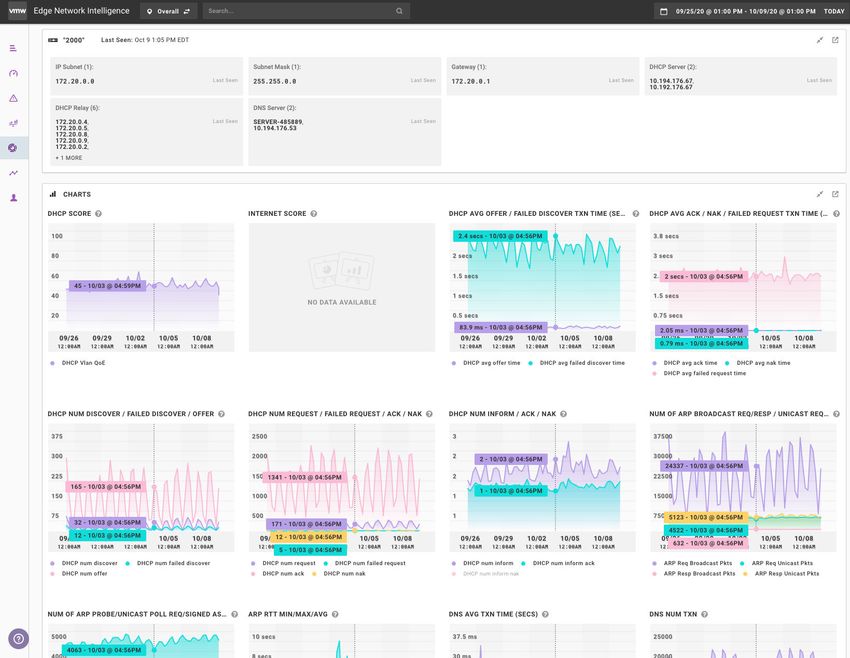
VMware Edge Network Intelligence User Guide

VLAN Details
The VLAN details page tracks a significant amount of information about the clients on a VLAN. It
is very useful when isolating issues on a particular VLAN or to compare to other VLAN's.

You can access the VLAN details page from the inventory section under the VLAN inventory. By
clicking on a VLAN you are taken to the details page for that VLAN. The charts displayed include
information on DHCP transactions, ARP requests/responses, DNS transactions, a general Internet
score, and re-transmit percentages. It also includes a list of clients on the VLAN.

Figure 9-22. VLAN Details

VMware, Inc.                                                                                   67
Analytics
10
At the heart of VMware Edge Network Intelligence (ENI) is our machine learning and analytics
engine. The system is constantly analyzing the data and creating baselines, incidents, root
causes, and correlating device use with network statistics. The analytics section of ENI allows you
to view this data in a many unique ways.
Many parts of ENI can be used to look at a specific device, application, or network infrastructure
to troubleshoot using the 2 weeks of details data. However, the analytics section allows you to
see beyond the device into the long term trends and root cause analysis for your environment.
Use of these sections takes a bit of learning to understand but are probably the most powerful
tools to gain insight into your environment and how it compares to industry averages or internal
benchmarks.
Page Description Scope
Network History Line graph of baseline performance and user counts for all Up to 2 years
performance metrics (Wi-Fi, O365, DHCP latency etc.)
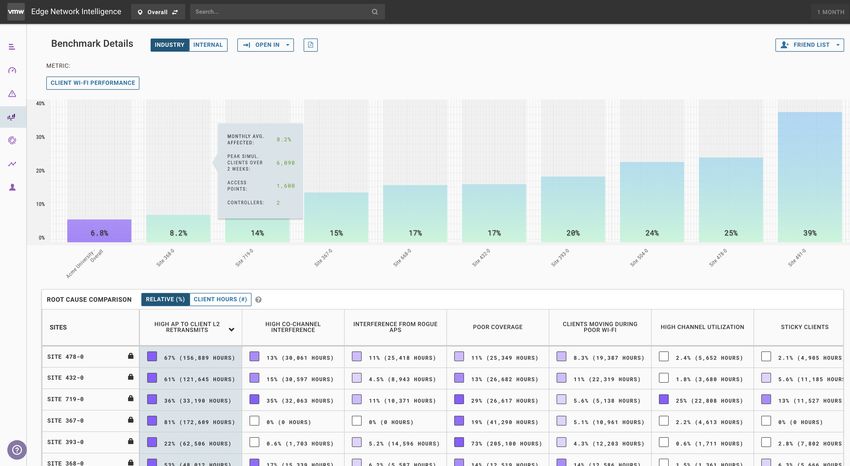
Benchmarks Industry comparisons of performance metrics and root cause 2 weeks
comparisons between internal and industry sites
Health & Remediations Data explorer for performance metrics allowing you to drill into 2 weeks
common attributes related to performance issues
This chapter includes the following topics:
n Network History
n Health and Remediation
n Benchmarks
n Performance Metrics
Network History
The network history page allows you to view performance metrics over a period of up to 2 years.
This page is commonly used to view changes in performance over time and correlate changes in
your environment to performance degradation or improvements. Using this page, you can
quickly see when problem arise. Additionally, VMware Edge Network Intelligence also tracks
VMware, Inc. 68VMware Edge Network Intelligence User Guide
changes to your WLAN config and can use that to create automatic annotations for version and
config changes.
The network history page defaults to the Wi-Fi performance metric, which looks at overall Wi-Fi
performance for your network. The graph shows the percent affected for the metric shown, or
the percentage of clients who were negatively affected by poor performance. Lower numbers
indicate better performance.
These metrics can be scoped by site or shown for the overall enterprise.
Figure 10-1. Network History
There are many options on this page, the following table describes the options and their affect
Option Description
% Affected The default view for network history values. The number is the percent of the total users in
the scope negatively impacted by the shown metric (i.e., Poor Wi-Fi performance)
# Peak users The number of users using the service the metric is based on.
Metric The metric selected for the graph - see the metric table for more info
Add Filter Click to add filters to the graph. Each metric has a set of filters that can be applied. For
example, Wi-Fi performance can be filtered on a specific building or floor. You can add up to
5 of the same type of filter to create a layered line graph
Industry Benchmark This is the average benchmark for the industry you are in (higher education, Healthcare,
Manufacturing, retail etc.) it also takes into consideration size, AP vendor, location etc.
Internal Benchmark This is the internal average for your organization - this is useful when looking at a site and
comparing it to the overall average
VMware, Inc. 69VMware Edge Network Intelligence User Guide
Option Description
Incidents This turns on or off indicators that show when ENI created an incident for the metric
Annotations This turns on and off the annotation indicators in the timeline
Usage Level Networks perform differently depending on the usage level. When a network is under high
usage you may experience more congestion or poorer performance. Using this selector, you
can toggle between High Medium and Low usage. If your graph shows --- lines it is because
for the usage shown there is no baseline calculated for that usage level
Add New Annotation This allows you to add a new manual annotation to the network history. If you are scoped to
a site, it will only be visible for that site. You can also scope it to a custom groups or building.
These are useful for noting when you have added or moved AP's or made changes to your
infrastructure like adding additional bandwidth
Hourly Data View
By default, the network history is scoped to the last month of data. In this view you can see the
daily averages of the metric selected. You can also see hourly data points for this metric, which
may help pinpoint when a change occurred
Procedure
1 Using the time picker on the upper right, select a period of 4 weeks or less. If you choose a
period of 3 days or less, it will display hourly data by default
2 Toggle the hourly data toggle
VMware, Inc. 70VMware Edge Network Intelligence User Guide Results Figure 10-2. Select the date range Figure 10-3. Toggle the hourly data switch VMware, Inc. 71
You can also read