Case Study: Spark GPU-Enabled Framework to Control COVID-19 Spread Using Cell-Phone Spatio-Temporal Data
←
→
Page content transcription
If your browser does not render page correctly, please read the page content below
Computers, Materials & Continua CMC, vol.65, no.2, pp.1303-1320, 2020

 Case Study: Spark GPU-Enabled Framework to Control
 COVID-19 Spread Using Cell-Phone Spatio-Temporal Data

 Hussein Shahata Abdallah 1, *, Mohamed H. Khafagy1 and Fatma A. Omara 2

Abstract: Nowadays, the world is fighting a dangerous form of Coronavirus that
represents an emerging pandemic. Since its early appearance in China Wuhan city, many
countries undertook several strict regulations including lockdowns and social distancing
measures. Unfortunately, these procedures have badly impacted the world economy.
Detecting and isolating positive/probable virus infected cases using a tree tracking
mechanism constitutes a backbone for containing and resisting such fast spreading
disease. For helping this hard effort, this research presents an innovative case study based
on big data processing techniques to build a complete tracking system able to identify the
central areas of infected/suspected people, and the new suspected cases using health
records integration with mobile stations spatio-temporal data logs. The main idea is to
identify the positive cases historical movements by tracking their phone location for the
last 14 days (i.e., the virus incubation period). Then, by acquiring the citizen’s mobile
phone locations for the same period, the system will be able to measure the Euclidean
distances between positive case locations and other nearby people to identify the in-
contact suspected-cases using parallel clustering and classification techniques. Moreover,
the daily change of the clusters size and its centroids will be used to predict new regions
of infection, as well as, new cases. Moreover, this approach will support infection
avoidance by alerting people approaching areas of high probability of infection using their
mobile GPS location. This case study has been developed as a simulation system
consisting of three components; positive cases/citizens movement’s data generation
subsystem, big data processing platform including CPU/GPU tasks, and data
visualization/map geotagging subsystem. The processing of such a big data system
requires intensive computing tasks. Therefore, GPU tasks carried out to achieve high
performance and accelerate the data processing. According to the simulated system
results, data partitioning and processing speed up measures have been examined.

Keywords: Big data, Coronavirus (COVID-19), parallel K-Means, GPU, Spark.

1 Department of Computer Science, Fayoum University, Fayoum, 63514, Egypt.
2 Department of Computer Science, Cairo University, Giza, 1261, Egypt.
* Corresponding Author: Hussein Shahata Abdallah. Email: hussien.shahata@fayoum.edu.eg.

Received: 30 April 2020; Accepted: 25 June 2020.

CMC. doi:10.32604/cmc.2020.011313 www.techscience.com/journal/cmc
1304 CMC, vol.65, no.2, pp.1303-1320, 2020

1 Introduction
COVID-19 is a member of the coronaviruses family. These viruses may infect animals or
humans. For humans, coronaviruses are able to cause respiratory malfunction ranging
from the common cold to Middle East Respiratory Syndrome (MERS) and Severe Acute
Respiratory Syndrome (SARS) [WHO (2020b)].
Regarding the COVID-19 pandemic outbreak, the World Health Organization (Situation
Report-147), has recorded up to 7.8 million confirmed cases and+431,541 deaths
worldwide so far [WHO (2020a)].
It is believed that the patient-zero case has originated in Wuhan/China. Subsequently,
several disorders such as kidney disorder and fluid development in the lungs became
more common in those with critical cases. The just-completed guideline from the
Chinese health authorities describes three main transmission ways of the COVID-19,
droplets transmission, contact transmission, and aerosol transmission. Droplets
transmission occurs when inhaling droplets produced by an infected person in close
proximity. The contact transmission occurs when touching a surface contaminated with
the virus and then touching one’s own mouth, nose, or eyes. The aerosol transmission
occurs when inhaling a high dose of infected aerosols into the lungs in a relatively closed
environment [Adhikari, Meng, Wu et al. (2020)]. Hence, avoidance of contact with
infected cases or around infected areas and maintaining a safe distance to others is
representing the essential defensive mechanism [CDC (2020)]. Also, countries with a
few cases of COVID-19 should rely on their digital surveillance systems for timely case
finding, isolate, test, and trace every contact subject to containment.
The governments’ healthcare systems should control this outbreak among their citizens
by using surveillance systems to track their movements in an automated manner to
effectively identify the in-contact persons with positive cases and isolate them.
Processing such a huge amount of data will eventually need to be adjusted for big data
frameworks and ‘many-core’ high-performance technology, to support the measures
against COVID-19. As such, correct and accurate information will be required to apply the
best regulations and avoid severe economic side effects.
Spatio-temporal data of the population is considered to be a key input for intervention
policy to control the spreading of epidemic diseases because such diseases are contagious,
and spreads significantly with human mobility [Peak, Wesolowski, Erbach-Schoenberg et
al. (2018)]. Call detail records (CDR) data (i.e., mobile phone data) has been attracting
the attention of policymakers and researchers in various fields because of the capacity of
capturing population movement patterns and trajectories. For large scale monitoring,
CDR data from mobile network base stations provide excellent spatial patterns that
reflect the urban life temporal dynamics, and it could potentially become a new way to
extract or identify less evident problems [Shibasaki (2017)].
The Association (GSMA) has developed guidelines for the appropriate use of (CDR) and
Standard Messaging Services (SMS) data in emergency situations such as using mobile
phone data for responding to the Ebola outbreak [GSMA (2014)]. In addition to the
analysis of movements between locations, social network analysis methods are also
commonly applied to CDR data to find connections between mobile phone users [Chen,
Crespi, Ortiz et al. (2017)]. Surveillance data from mobile devices has been used to
Case Study: Spark GPU-Enabled Framework to Control 1305

construct a realistic contact network and determine the changes in that network during the
Ebola outbreak [Chen Crespi, Ortiz et al. (2017)]. Moreover, the smartphones can be
used as simple self-monitoring tools. For example, EbolaTracks, a SMS based platform
has been used for self-monitoring of persons who visited an Ebola-infected region
[Cinnamon, Jones and Adger (2016)]. Usually, Mobile phones became used to collect
and transmit GPS coordinates to be recorded and used for further mapping analysis [Lee,
Asher, Goldlust et al. (2016)]. Similarly, Bluetooth sensors on the phones can also be
used to generate fine-grained contact networks that able to track in-door contacts.
Using such techniques will increase the ability to predict early the positive cases
especially when the critical care resources and intensive care beds are limited, and
therefore clinicians must make difficult decisions to choose urgent mild-cases to help in
time. Many research works have studied such healthcare challenges using Artificial
Intelligence (AI) to provide accurate decision support information [Gianfrancesco,
Tamang, Yazdany et al. (2018); Shortliffe and Sepúlveda (2018)]. Furthermore, machine
learning algorithms can use big data sets to identify risk levels based on clustering and
classification methods to divide observation data into related groups that being used later
for model training and data labeling [Jiang, Coffee, Bari et al. (2020)].
Originally, big data frameworks are used to process a vast amount of data in structured data
formats like Hive [Abdel Azez, Khafagy and Omara (2018); Shanoda, Senbel and Khafagy
(2014)], and unstructured formats in the recommender systems [Mohamed, Khafagy and
Ibrahim (2019)]. Moreover, analyzing healthcare data for positive cases with maintaining
data privacy and security in concern is the urgent solution today. Also, high-performance
computing technologies such as manycore computing system is crucial to shortening the
time required for processing such huge data. So, big data processing technology can ease
the process of detecting infected cases automatically and estimate the infection risk in real-
time. To achieve this, the system must distribute the collected citizen- movement dataset
and the positive-cases dataset over a large spark cluster and calculate the Euclidean distance
between every two points. By identifying the levels of unsafe interaction distance
thresholds, we can simply classify unsafe distances into three risk levels; minor, moderate,
and significant. Therefore, a suitable action could be taken for every case.
Unsafe distances clustering will enable the system to identify the suspected areas of
infection, as well as, classify citizens into levels of risk that will enable governments to
apply more accurate and lower impact regulations on their citizen’s life. Such complex
machine learning techniques will be conducted in a daily regular manner therefore, such
huge and time-consuming processing requires more intelligent parallel processing
frameworks that allows using of GPU and CPU concurrently [Haney and Mohan (2013)].
The work in this paper proposes a tracking system for COVID-19 cases to fight disease
outbreak. Measuring the distance between in contact citizens every day is representing
the backbone of our system to detect the suspected cases of infection, as well as, predict
and estimate the rate of increase in new cases and the new regions of infection. According
to the proposed system, a high performance processing big data platform in addition to
many-core processors are used to achieve a real-time tracking solution that builds an
accurate tree data structure to represent the relationships between cases, explains disease
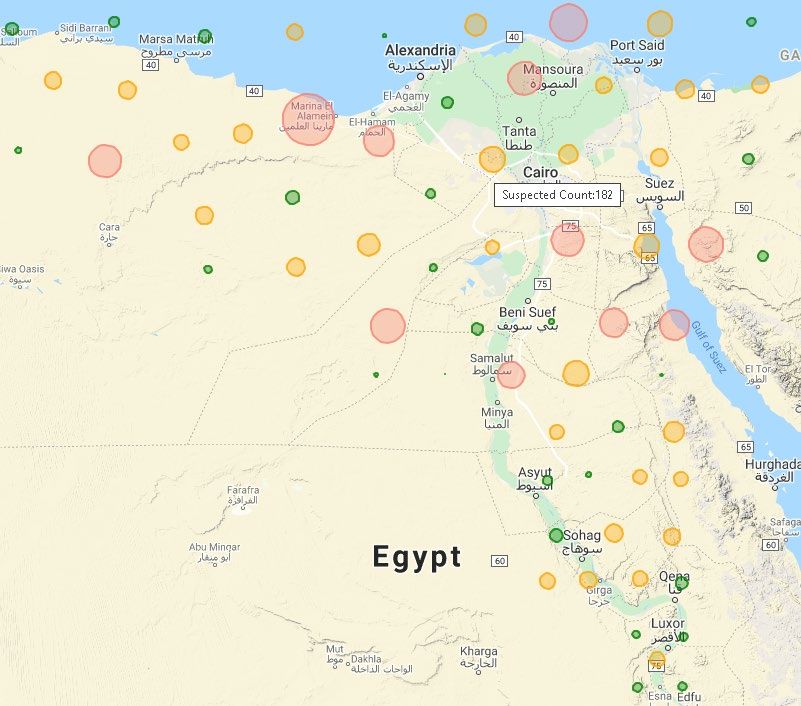
1306 CMC, vol.65, no.2, pp.1303-1320, 2020

spread, and provides end-users mobile application with web service to assess their risk level
and avoid the regions of infection.
The proposed COVID-19 cases tracking system is based on three main components;
positive cases and citizen’s movement datasets generation, heterogeneous CPU/GPU big
data processing platform, and data visualization and map geotagging service. These
components are discussed in more detail in the next section.

2 The proposed tracking system for COVID-19 cases
Several researchers are working on introducing prediction techniques for COVID-19
spread around the world. Tracking positive cases locations using CDR data and using
time series prediction techniques to forecast disease spread levels are the growing areas
of research today [Held and Meyer (2019)].
Tracking the geographic locations of the positive cases, and studying the pathogen
genetic DNA sequences are examined in Harris et al. [Harris, Cartwright, Cartwright et
al. (2013); Jombart and Ahmed (2011)].
Interestingly, advanced genetic data has triggered several research-works to exploit
different types of data in parallel [Mollentze, Nel, Townsend et al. (2014); Zaharia,
Chowdhury, Das et al. (2012)]. However, not all of these works are widely available as
computer software or a complete platform for infection outbreak control, this kind of
analysis is still lacking because it depends on free open-source projects with a poor
community of support. Moreover, advanced mathematical models have been proposed
for forecasting spreading epidemics such as Ebola [Carias, O’Hagan, Gambhir et al.
(2019)], and novel coronavirus [Read, Bridgen, Cummings et al. (2020)].
Unfortunately, all of these works didn’t figure out the solutions for how to track the
suspected cases that are in contact with confirmed cases and provide authorities with
such critical information to help their citizens and avoid the infection. The majority of
these works have focused on the visualization of growth curves in number of confirmed
deaths and recovered cases without real investigation about the pattern of spread or the
suggested areas for being infectious.
Therefore, the work in this paper tries to tackle this challenge by introducing a novel big
data-based tracking system for automatically identifying the infected cases and predicting
the in-contact (suspected) cases by measuring the distance between them using mobile
phone location data. Also, the proposed system can cluster positive cases into central areas
and classify the infection risk of COVID-19 into three risk levels in real-time. A high-
performance framework will be used to process such big data tasks and take advantage of
GPU computing significant features to speed up the processing time of parallel tasks,
Euclidian distance measure, K-Means clustering, and Decision Trees classification.
The proposed tracking system consists of three components; datasets generation, big data
processing framework, visualization and geotagging service. The architecture of the
proposed tracking system is described in Fig. 1. The data collecting component is
responsible for receiving streaming data from telecommunication-companies (cell phone
stations) logs, in addition to the information about confirmed cases from the official health
records daily. The big data framework (spark cluster) component is responsible for
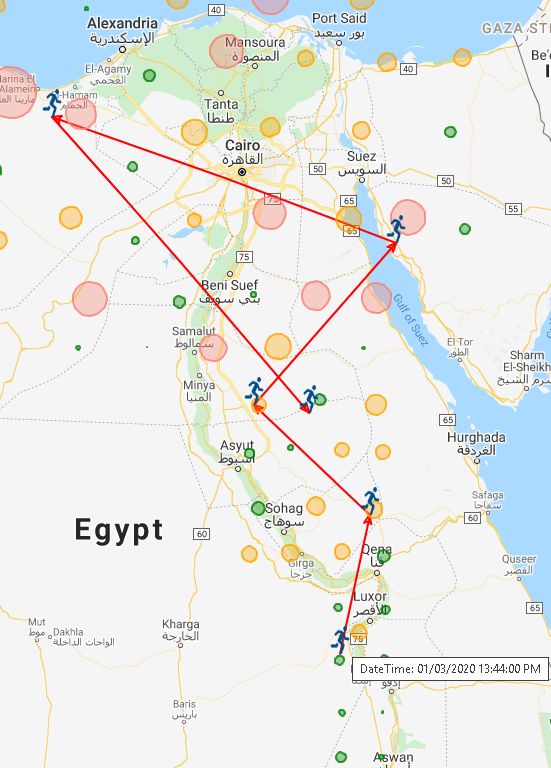
Case Study: Spark GPU-Enabled Framework to Control 1307

distributing such huge data into cluster nodes and performs several parallel processing tasks,
including Euclidean distance measure between two latitude/longitude points, clustering
positive cases locations using K-Means and classifying cell phone numbers into their risk
status using decision trees. The data visualization and geotagging service is responsible for
providing decision-makers with a real-time dashboard about infection status, and providing
web services that can integrate with mobile application to provide the user with a geotagged
areas of infection or suspicion and tracking the cell-phone locations on the infection
annotated map.

 Figure 1: The proposed tracking system architecture

2.1 Data collecting/generation component
The zero-patient confirmed case of the COVID-19 virus represents the seed of the
infection. Hence, the in contact person with this case is representing a new source of
infection, and in turn, becomes a new seed. The way of tracking the source cases and
their infected cases is the most effective way to control virus spread and build a solid tree
for later investigations and prediction [Möller, du Plessis and Stadler (2018)]. Using a
citizen’s cell phone location tracking is an interesting technique to identify the proximate
person based on the distance measure. The main advantage of this technique is that many
suspected cases from a single source can be derived by measuring the distance between
their moving locations points and all other citizens for the last 14 days. This kind of data is
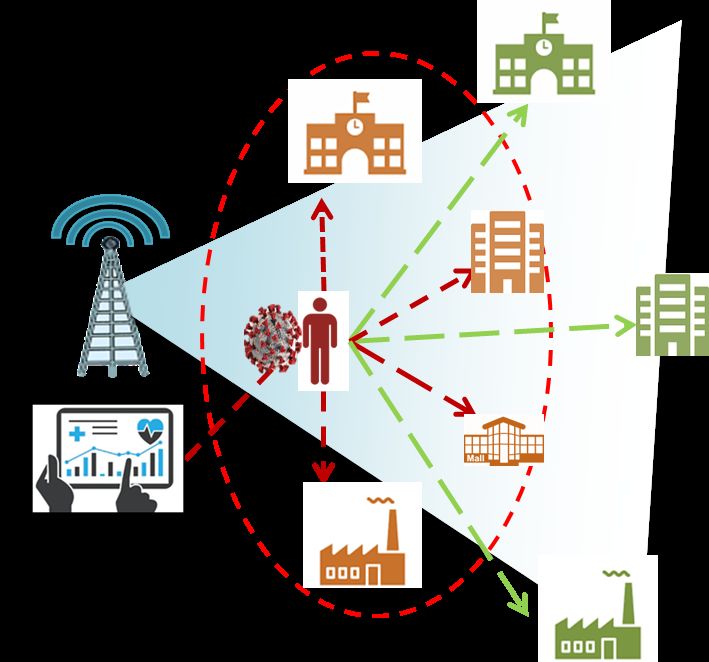
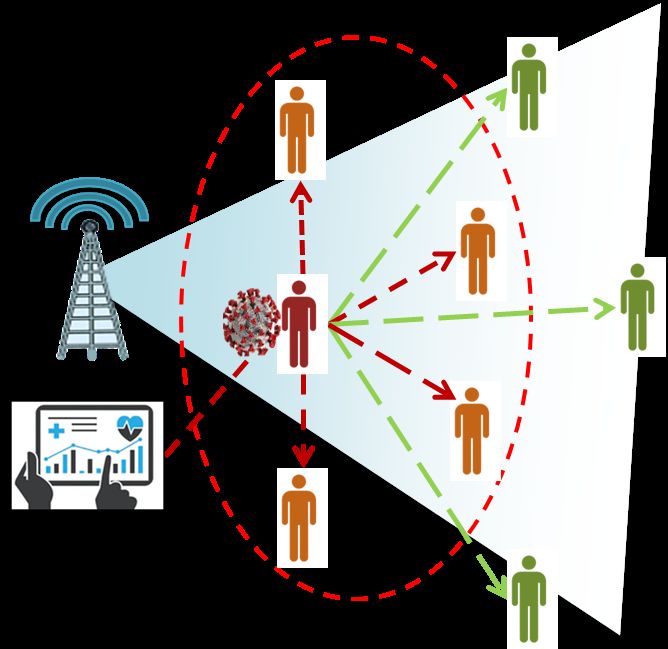
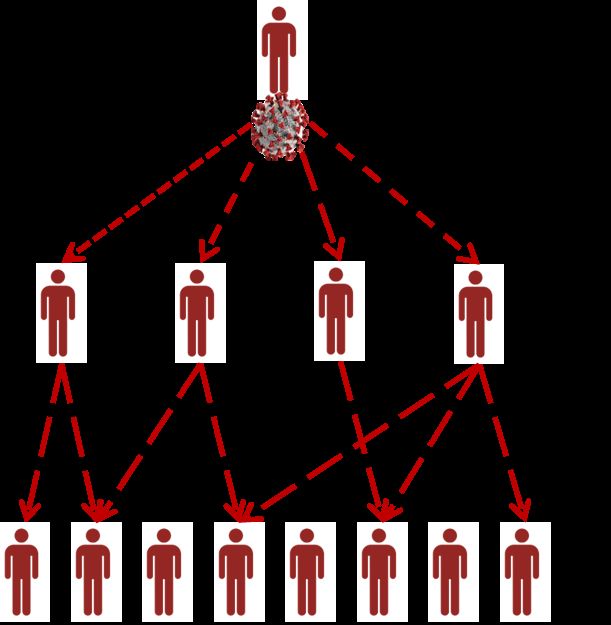
1308 CMC, vol.65, no.2, pp.1303-1320, 2020

available at cell-phone communication companies, as well as, positive cases (seeds) can be
collected from official health records. Also, these data are updatable regularly, so the
calculation can be performed on a regular basis.
So, the spread of COVID-19 can be digitally represented using a tree to narrow the area
of investigation for close persons whose confirmed as a contagion source using medical
tests. The positive case will be added as a tree node with its probable sources of infection
as parents. In addition, the places in which this person went in last 14 days will be
recursively added to the suspected places tree. Hence, each infection case can generate
many infection instances as shown in Figs. 2 and 3.

 Figure 2: Calculated cell phone distance to Figure 3: Calculated cell phone distance
 identify suspected cases to identify suspected places

The red person represents the seed of infection, and the red dashed oval represents an
area of suspicion. According to Fig. 2, the orange person is a suspected case of infection,
which needs fast medical examination while the green person outside the suspicion area
is safe. In case of any suspected person confirmed as a positive case, this case will be
converted to a new seed of infection as well. The places in Fig. 3 are put in the suspicion
area which may have persons in contact with a positive case.
In case of any suspected instance confirmed as a positive case, the area of suspicion will
increase, and so the calculation of distance threshold will re-execute recursively to
identify the new suspected cases and update the infection tree as shown in Fig. 4.
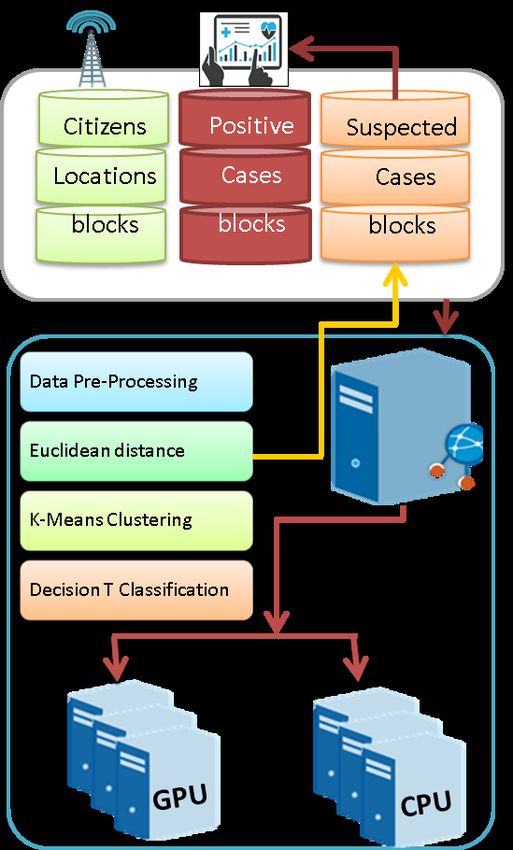
Case Study: Spark GPU-Enabled Framework to Control 1309

 Figure 4: Infection tree and case relations

Additional benefits of the tree structure are the ability to identify the missed
relationships between cases and easily predict these relationships, as well as, the tree is
a parallel enabled data structure that able to search through using parallel search
algorithms in a distributed processing framework.

2.2 Big data processing component
The centralized design of real-time tracking of confirmed cases alongside the citizen’s
locations requires measuring the distances for each citizen’s movements per day. For
instance, if we have 100 moving points for each citizen per a day and on average
1 million smartphones, hence, we have 100 million points per day to calculate its distance
with the confirmed cases points. In addition, we should include in this calculation the
points of the last 14 days’ for all citizens and all positive cases in the same period.
Therefore, we have more than 108 points to measure their distances per a day. Moreover,
the system has two extra tasks to do; 1) clustering the infection cases to highlight central
areas of infection and clustering the areas of suspicion to maintain a list of highly
suspected areas of infection for all suspected cases locations. 2) For each citizen who
requests to assess his risk status, the system should classify the status into three levels of
risk (i.e., minor, moderate, and significant). These intensive calculations require high-
performance parallel architecture to maintain its calculation periodically.
Spark architecture [Zaharia, Chowdhury, Das et al. (2012)] is considered faster than
Hadoop architecture because of its in-memory data processing technique, which
outperforms Hadoop from 10 to 100 times [Dittrich and Quiané-Ruiz (2012)]. Therefore,
the system uses spark jobs to execute almost tasks besides spark has the Mlib library,
which contains a lot of implemented machine learning algorithms that saved a lot of
effort [Assefi, Behravesh, Liu et al. (2017)]. In addition, Spark architecture supports
python scikit-learn library to easily demonstrate all algorithms and Matplot library to
visualize the demonstration results [Hao and Ho (2019)].
1310 CMC, vol.65, no.2, pp.1303-1320, 2020

To achieve noticeable acceleration, we decided to choose the K-Means algorithm for cases
clustering and Decision Tree algorithm for risk assessment classification because these
algorithms have been implemented with CUDA language and can run on GPU using spark
CUDA driver [Soyata (2018)]. Fig. 5 illustrates the spark cluster architecture, and the
algorithms (i.e., K-Means and Decision Tree) which will be executed on spark environment.

 Figure 5: Spark cluster architecture

According to Fig. 5, the data processing passes through four steps as follows:

Step 1: Data preprocessing
CDR data contains all information about the cell-phone connections, such as, which cell
towers the SIM card connected to at any time, the connection source and destinations
(endpoints). So, CDR data can approximately identify the location of both sides of the
connection. Telecommunication networks use the base tower location to infer the
geographic location of the connected devices with accuracy varies from 50 to 300 meters
only in dense urban environments. Also, the availability of data in most countries is limited
to intelligence agencies and requires a lot of security approval procedures and regulations.
Besides, the variation of data format requires data preprocessing and cleansing before the
data being ready for analysis. In sum, this geospatial information is extremely useful for
social distancing measures in application development [Shibasaki (2017)].
The preprocessing step is responsible for cleansing data from non-important attributes,
deleting redundant or fixed position points, and reformatting data into a suitable format
that includes a set of attributes which presented in Tab. 1.
Case Study: Spark GPU-Enabled Framework to Control 1311

 Table 1: CDR Data attributes [Shibasaki (2017)]
 Attribute Type Notes
 Mobile phone number String Maybe irreversibly encrypted using a one to one
 hash function
 Timestamp Date Time The heartbeat of communication between the base
 station and the device in the format of YYYY-
 MM-DD
 Device longitude Double The geographical location of a base station
 Device latitude Double
 Base station radio frequency Float Frequency of radio signal between a base station
 and device
 Base station longitude Double The geographical location of the device
 Base station latitude Double
 Signal strength Float The strength of the signal between the base station
 and device

Step 2: Measure euclidian distance
After the preprocessing step, the longitude and latitude of the cell phone become
available. So, the daily updated citizen’s phone location dataset is ready to be
compared with the daily updated health records. The distance between every two
locations can be measured using the Euclidean distance Haversine formula (see Eq. (1))
[Monawar, Mahmud and Hira (2017)]. This formula is used to calculate the great-circle
distance between two points (the shortest distance over the earth’s surface).

 2 − 1 λ2 − λ1
 = 2 ∗ sin−1 �� 2 � � + cos 1 ∗ cos 2 ∗ 2 � �� (1)
 2 2

where: θ1, 2: Latitude of point 1 and latitude of point 2 (in radians), λ1, λ2: Longitude of
point 1 and longitude of point 2 (in radians), R: Earth radius where mean radius=6,371 km.
Because there is a large amount of data to be processed daily, the citizen’s locations
dataset will be split across cluster nodes to run in parallel. The distribution of blocks
between CPU and GPU machines will be relative to the computation power of each
processing node. therefore, the task partitioner can determine the amount of time required
to calculate the distance between 1000 points on both CPU and GPU, and then decide the
ratio of data dividing alpha (α) between all devices using static partitioning schema
[Grewe, Wang and O’Boyle (2013)] and the haversine formula CUDA implementation
for GPU [Harris (2015)].
Based on the measured distances, the system can build/update the suspected cases dataset
that will guide health decision-makers to decide the priority cases examination.

Step 3: K-means clustering
The positive cases dataset is incrementally updated with the positive cases everyday. So,
identifying the central areas of infection will be more beneficial to focus the
governmental lockdown and isolation procedures on these areas besides saving health
care and hygiene resources. Similarly, defining the central areas of suspicion will help
1312 CMC, vol.65, no.2, pp.1303-1320, 2020

early identification for the expected positive cases, as well as, apply more accurate
isolation restrictions. Hence, the parallel K-Means clustering technique based on
geospatial data is used to identify the central areas of infection/suspicion in real-time
[Mills, Sripathi, Kumar et al. (2018)].

Step 4: Decision tree classification
The mobile application user can ask to assess the health risk status using the integrated
web service. Hence, the system will extract the last 14 day movements of this user, and
according to the distances thresholds from the confirmed or suspected cases, it can be
classified into safe or at risk with the measured level (i.e., minor, moderate, significant).
Hence, the parallel decision tree classification technique based on distance measure
results has been used to classify every person regularly and push warning notification to
those persons and the government agencies about whose at a significant risk levels in
real-time [Wu, Wang, Yan et al. (2019)].

3 Dashboard and geotagging component
Visualizing and reporting the results of tracked citizens’ geospatial data in combination
with the infected cases is the most important and crucial component for system
stakeholders. Subsequently, they can evaluate the overall situation of their citizens and
decide the suitable precautions to be applied on time.
The live dashboard will pull data from the analyzed datasets to show the confirmed,
suspected, and recovered cases of coronavirus along with the deaths numbers. Similarly,
the central regions of infection or suspicion with their cases counts will be tagged on the
country map. The interactive series of infection and suspicion counts for last month will
be available as well. Also, a person's movements tracking map will be available to
investigate each suspected case location and determine the in-contact cases.
Geotagging is a process where geographical data such as pictures and videos can be tagged
with latitude and longitude points of that place to help end-users to reach or evaluate this
place easily. So, geotagged maps of positive and suspected cases will be available for
decision-makers, similarly, a geotagged map for certain citizen movements.
Normally, statistical reports about cases counts and their distributions with their places and
time will be available. Also, future forecasting tasks can be applied to predict the disease
cases increase rate and identify the new places of infection for a short period like a week.

4 Case study experiments
4.1 Used datasets
Because of the lack of CDR Datasets, COVID-19 positive cases Spatio-temporal data, and
the general security approvals constraints to accessing such datasets in almost all
countries, two random datasets have been generated to simulate the positive cases and
citizens’ CDR information. During the generation of these datasets, the distribution of
Egyptian population density in Egyptian cities are considered using longitude and latitude
points of Egypt coordinates [World Population Review (2020)]. The datasets simulate the
movement’s points in March 2020 at different times throughout the day. The positive
cases dataset contains 2000 records (geolocation points) with just 200 unique mobile
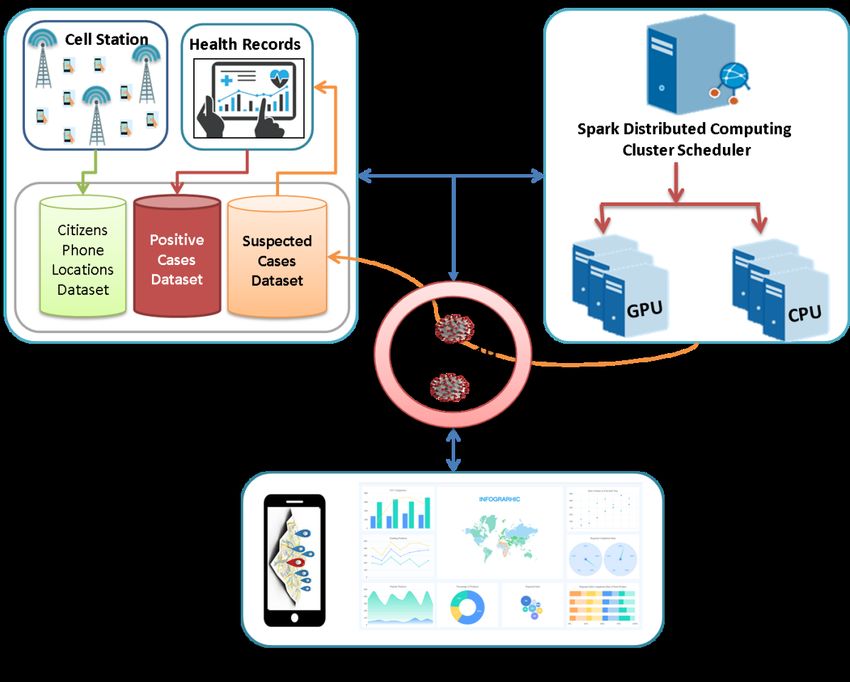
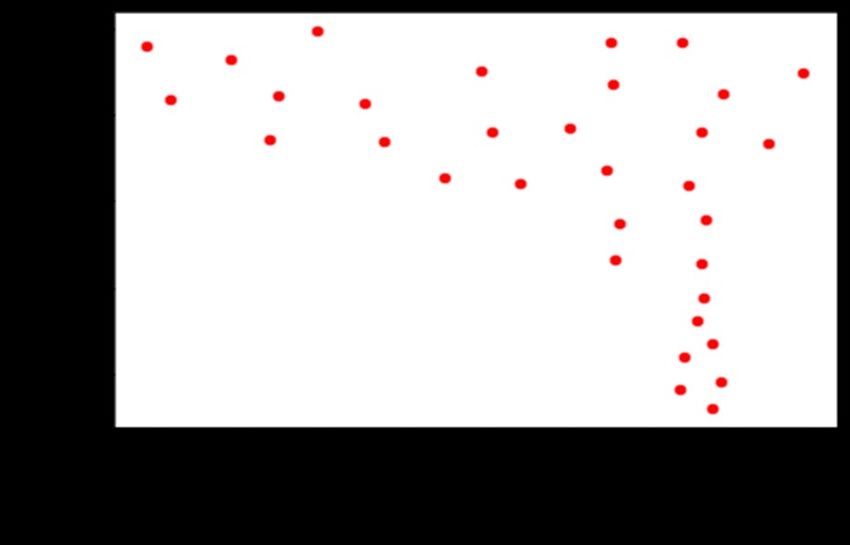
Case Study: Spark GPU-Enabled Framework to Control 1313

numbers (person) where dates starting from 01 March 2020 and ending on 15 March 2020.
Similarly, the Citizens movements’ dataset contains 2 Million records with just 20 K
unique mobile number where dates start from 01 March 2020 until 30 March 2020.

4.2 Environment setup
The case study has been implemented using a virtual environment consisting of three
virtual machines with Ubuntu LTS 16.04 operating system. Each machine has 5 GB of
RAM, 50 GB of HDD, and two processing cores with a speed of 2.7 GHz for each.
One of these machines has NVIDIA Quadro K3000M GPU with 2 GB of RAM. All
machines act as worker nodes except one of them, which act as a master node.

4.3 Experimental results
K-means algorithm requires the number of the cluster as input. So, HDSCAN has used to
determine the number of clusters based on Euclidean distance between two points as a
threshold [Santos, Syed, Naldi et al. (2019)]. The positive cases and its clusters are shown
in Figs. 6 and 7.

 Figure 6: COVID-19 Positive cases points Figure 7: COVID-19 positive cases K-
 for 15 day Means clusters
1314 CMC, vol.65, no.2, pp.1303-1320, 2020

 These clusters have generated just for simulation. These points have generated just for simulation.

Figure 8: suspected cases clusters using Figure 9: Citizen location tracking with
K-Means infection clusters geotagging

After calculating the Euclidian distances between citizens and positive cases locations,
suspected cases dataset has been generated with 106K locations and just 1770 suspected
unique mobile numbers. The geotagging of suspected cases clusters according to its risk
levels are shown in Fig. 8 while the red clusters are the significant risk regions with the
number of suspected cases>150, the orange clusters are the moderate risk regions with
the number of suspected cases>50, and the green clusters are the minor risk clusters with
the number of suspected cases
Case Study: Spark GPU-Enabled Framework to Control 1315

determined according to the static data partitioning technique based on the algorithm time
and space complexity [Grewe, Wang and O’Boyle (2013)]. Fig. 10 shows the task divide
ratio between CPU and GPU nodes for compute-intensive tasks. According to Fig. 10, we
can conclude that K-Means task has the largest percentage share on GPU with about 78%
followed by haversine with 62% and decision tree with 48%.

 CPU Node 1 CPU Node 2 GPU Node
 100%
 90%
 partitioning perentage

 80%
 70%
 60%
 50%
 40%
 30%
 20%
 10%
 0%
 K-Means Decision Tree haversine

 Figure 10: Tasks partitioning percentage between CPU and GPU nodes
 6000
 5600 haversine
 5200 Decision Tree
 4800 K-Means
 4400
 time in seconds

 4000
 3600
 3200
 2800
 2400
 2000
 1600
 1200
 800
 400
 0
 CPU 3 CPU GPU 2CPU+GPU
 Figure 11: Tasks execution time on different system configrations
1316 CMC, vol.65, no.2, pp.1303-1320, 2020

 8 K-Means
 7 Decision Tree
 haversine
 6
 Computed Speedup 5
 4
 3
 2
 1
 0
 CPU 3 CPU GPU 2CPU+GPU
 Figure 12: Tasks speedup with different system configurations
The percentage of data partitioning between CPU and GPU nodes in Figs. 11, 12
indicates that GPU can save the execution time and achieve a noticeable speedup
compared to CPU. The execution time and the achieved speedup has tested for every
algorithm on four different system configurations, one CPU node, one GPU node, three
CPU nodes, and 2 CPU nodes with a GPU node. According to the results in Fig. 11, 12,
the heterogeneous system containing two CPUs and one GPU achieves the lowest
execution time with all algorithms, On the other hand, the highest speedup, where K-
Means algorithm achieved +7x speedup followed by Haversine algorithm and Decision
Tree algorithm with +5x and 4x respectively has obtained on the three CPU nodes or one
GPU node system configuration. Hence, the static data partitioning technique between
CPU and GPU in big data systems is applicable and can achieve remarkable performance.
To conclude, the speedup depends on the number of computing devices that work
concurrently in addition to the task degree of parallelism. Hence, any increase in the
number of GPU devices or their processing power capabilities would accelerate the
speedup steadily.

5 Conclusion & future work
In this paper, a novel approach for controlling the spread of COVID-19 and tracking the
infected cases has been studied. A big data framework has been proposed to help
governments and health authorities in identifying the in-contact persons with a positive-
case, determining the regions of virus outbreak, and build a representation tree data
structure for all cases. The tree data structure represents the relationship between the
confirmed cases and supports making critical decisions by governments, health
authorities, and individuals on time. The proposed framework has implemented as a case
study that consists of three components; datasets generation, big data processing
framework, and data visualization and geotagging service for results demonstration.
Therefore, a simulated CDR Data of citizen’s movements and COVID-19 confirmed
cases have been aggregated to generate a suspected cases dataset and identify the
probable regions of infection or suspicion. The mobile phone GPS location is determined
Case Study: Spark GPU-Enabled Framework to Control 1317

by the mobile network base-station communication signals that is used in combination
with the confirmed cases locations to determine the in-contact persons within specified
area during the virus incubation period. Normally, the processing of such huge data is
passed through four steps; data cleansing and preprocessing, calculating the Euclidian
distances between a citizen and the confirmed cases GPS points, identifying the central
points of infected regions (clusters) using parallel k-means clustering algorithm, and
finally classifying person risk into three levels using the decision tree classification
algorithm. Such complex computations require high performance distributed big data
environment to perform these computations in real-time. Spark GPU-enabled cluster has
been used in addition to computation partitioning between CPU and GPU nodes to
achieve full utilization of the available resources and gain remarkable speedup.
The experimental results show that the concurrent processing of the datasets on GPU-
enables spark cluster obtained a noticeable performance gain in comparison to CPU only
cluster up to 7x.
Finally, building a parallel time-series data regression model such as LSTM will be
studied as a future work to predict the future number of confirmed/suspected cases and
the new regions of infection for short term periods.

Funding Statement: The authors received no specific funding for this study.

Conflicts of Interest: The authors declare that they have no conflicts of interest to report
regarding the present study.

References
Abdel Azez, H; Khafagy, M.; Omara, F. (2018): Optimizing join in hive star schema
using key/facts indexing. IETE Technical Review (Institution of Electronics and
Telecommunication Engineers, India), vol. 35, no. 2, pp. 132-144.
Adhikari, S.; Meng, S.; Wu, Y.; Mao, Y.; Ye, R. et al. (2020): Epidemiology, causes,
clinical manifestation and diagnosis, prevention and control of coronavirus disease
(COVID-19) during the early outbreak period: a scoping review. Infectious Diseases of
Poverty, vol. 9, no. 1, pp. 1-12.
Assefi, M.; Behravesh, E.; Liu, G.; Tafti, A. (2017): Big data machine learning using
apache spark MLlib. IEEE International Conference on Big Data, pp. 3492-3498.
Calatayud, L.; Kurkela, S.; Neave, P.; Brock, A.; Perkins, S. et al. (2010): Pandemic
(h1n1) 2009 virus outbreak in a school in london, april-may 2009: an observational study.
Epidemiology Infection, vol. 138, no. 2, pp. 183-191.
Carias, C.; O’Hagan, J.; Gambhir, M.; Kahn, E.; Swerdlow, D. et al. (2019):
Forecasting the 2014 west african ebola outbreak. Epidemiologic Reviews, vol. 41, no. 1,
pp. 34-50.
Cauchemez, S.; Bhattarai, A.; Marchbanks, T.; Fagan, R.; Ostroff, S. et al. (2011):
Role of social networks in shaping disease transmission during a community outbreak of
2009 H1N1 pandemic influenza. Proceedings of the National Academy of Sciences, vol.
108, no. 7, pp. 2825-2830.
1318 CMC, vol.65, no.2, pp.1303-1320, 2020

CDC (2020): Coronavirus Disease 2019. https://www.cdc.gov /coronavirus/2019-
nCoV/summary.html.
Chen, Y.; Crespi, N.; Ortiz, A.; Shu, L. (2016): Reality mining: A prediction algorithm
for disease dynamics based on mobile big data. Information Sciences, vol. 379, pp. 82-93.
Cinnamon, J.; Jones, S.; Adger, W. (2016): Evidence and future potential of mobile
phone data for disease disaster management. Geoforum, vol. 75, pp. 253-264.
Dittrich, J.; Quiané-Ruiz, J. (2012): Efficient big data processing in Hadoop
MapReduce. Proceedings of the VLDB Endowment, vol. 5, no. 12, pp. 2014-2015.
Gianfrancesco, M.; Tamang, S.; Yazdany, J.; Schmajuk, G. (2018): Potential biases
in machine learning algorithms using electronic health record data. JAMA Internal
Medicine, vol. 178, no. 11, pp. 1544-1547.
Grewe, D.; Wang, Z.; O’Boyle, M. (2013): OpenCL task partitioning in the presence of
GPU contention. International Workshop on Languages and Compilers for Parallel
Computing, pp. 87-101.
GSMA (2014): Gsma guidelines on the protection of privacy in the use of mobile phone
data for responding to the ebola outbreak. London.
https://www.gsma.com/mobilefordevelopment/wp-content/uploads/2014/11/GSMA-
guidelines-on-protecting-privacy-in-the-use-of-mobile-phone-data-for-responding-to-the-
Ebola-outbreak-_October-2014.pdf.
Haney, R.; Mohan, R. (2013): Comparison and performance analysis of multiple
cpu/gpu computing systems–resin infusion flow modeling application. Computer
Modeling in Engineering and Sciences, vol. 95, no. 5, pp. 431-452.
Hao, J.; Ho, T. (2019): Machine learning made easy: a review of scikit-learn package in
python programming language. Journal of Educational and Behavioral Statistics, vol. 44,
no. 3, pp. 348-361.
Harris, M. (2015): Gpu pro tip: fast great-circle distance calculation in cuda c++.
https://devblogs.nvidia.com/fast-great-circle-distance-calculation-cuda-c.
Harris, S.; Cartwright, E.; Török, M.; Holden, M.; Brown, N. et al. (2013): Whole-
genome sequencing for analysis of an outbreak of meticillin-resistant Staphylococcus
aureus: a descriptive study. The Lancet Infectious Diseases, vol. 13, no. 2, pp. 130-136.
Held, L.; Meyer, S. (2019): Forecasting Based on Surveillance Data. Handbook of
Infectious Disease Data Analysis. London, UK: Chapman & Hall.
Jiang, X.; Coffee, M.; Bari, A.; Wang, J.; Jiang, X. et al. (2020): Towards an artificial
intelligence framework for data-driven prediction of coronavirus clinical severity.
Computers, Materials & Continua, vol. 63, no. 1, pp. 537-551.
Jombart, T.; Ahmed, I. (2011): New tools for the analysis of genome-wide SNP data.
Bioinformatics, vol. 27, no. 21, pp. 3070-3071.
Lee, E.; Asher, J.; Goldlust, S.; Kraemer, J.; Lawson, A. et al. (2016): Mind the
scales: Harnessing spatial big data for infectious disease surveillance and inference. The
Journal of Infectious Diseases, vol. 214, no. 4, pp. 409-413.
Case Study: Spark GPU-Enabled Framework to Control 1319

Mills, R.; Sripathi, V.; Kumar, J.; Sreepathi, S.; Hoffman, F. et al. (2018): Parallel
k-means clustering of geospatial data sets using manycore cpu architectures. IEEE
International Conference On Data Mining Workshops, pp. 787-794.
Mohamed, M.; Khafagy, M.; Ibrahim, M. (2019): Recommender systems challenges
and solutions survey. International Conference On Innovative Trends In Computer
Engineering, pp. 149-155.
Mollentze, N.; Nel, L.; Townsend, S.; Le Roux, K.; Hampson, K. et al. (2014): A
Bayesian approach for inferring the dynamics of partially observed endemic infectious
diseases from space-time-genetic data. Proceedings of the Royal Society B: Biological
Sciences, vol. 281, no. 1782, pp. 2013-3251.
Möller, S.; du Plessis, L.; Stadler, T. (2018): Impact of the tree prior on estimating
clock rates during epidemic outbreaks. Proceedings of the National Academy of Sciences,
vol. 115, no. 16, pp. 4200-4205.
Monawar, T.; Mahmud, S.; Hira, A. (2017): Anti-theft vehicle tracking and regaining
system with automatic police notifying using Haversine formula. 4th International
Conference on Advances in Electrical Engineering, pp. 775-779.
Peak, C.; Wesolowski, A.; zu Erbach-Schoenberg, E.; Tatem, A.; Wetter, E. et al.
(2018): Population mobility reductions associated with travel restrictions during the
Ebola epidemic in Sierra Leone: use of mobile phone data. International Journal of
Epidemiology, vol. 47, no. 5, pp. 1562-1570.
Read, J.; Bridgen, J.; Cummings, D.; Ho, A.; Jewell, C. (2020): Novel coronavirus
2019-nCoV: early estimation of epidemiological parameters and epidemic predictions.
MedRxiv Preprint. doi: 10.1101/2020.01.23.20018549.
Santos, J; Syed, T; Naldi, M; Campello, R; Sander, J. (2019): Hierarchical Density-
Based Clustering using MapReduce. IEEE Transactions on Big Data.
Shanoda, M.; Senbel, S.; Khafagy, M. (2014): Jomr: multi-join optimizer technique to
enhance map-reduce job. 9th International Conference on Informatics and Systems, pp.
PDC-80-PDC-87.
Shibasaki, R. (2017): Call detail record (CDR) analysis: Sierra Leone. Bureau.
https://www.itu.int/en/ITU-D/Emergency-Telecommunications/Doc uments/2017/Report
s/SL/D012A0000CA3301PDFE.pdf.
Shortliffe, E.; Sepúlveda, M. (2018): Clinical decision support in the era of artificial
intelligence. Jama, vol. 320, no. 21, pp. 2199-2200.
Soyata, T. (2018): GPU Parallel Program Development Using CUDA. Chapman and
Hall/CRC, pp.137-182. https://doi.org/10.1201/9781315368290.
WHO (2020a): Coronavirus disease 2019 (COVID-19) Situation Report-147.
https://www.who.int/docs/default-source/coronaviruse/situation-reports/20200415-sitrep-
86-COVID-147.pdf.
WHO (2020b): Q&A on coronaviruses (COVID-19). Retrieved 16 April, 2020, from
https://www.who.int/news-room/q-a-detail/q-a-coronaviruses.
World Population Review (2020): Egypt Population Density Map.
https://worldpopulationreview.com/countries/egyptpopulation/#popDensity Map.
1320 CMC, vol.65, no.2, pp.1303-1320, 2020

Wu, Q.; Wang, H.; Yan, X.; Liu, X. (2019): Mapreduce-based adaptive random forest
algorithm for multi-label classification. Neural Computing And Applications, vol. 31, no.
12, pp. 8239-8252.
Zaharia, M.; Chowdhury, M.; Das, T.; Dave, A.; Ma, J. et al. (2012): Resilient
distributed datasets: a fault-tolerant abstraction for in-memory cluster computing.
Presented As Part of The 9th Symposium on Networked Systems Design and
Implementation, vol. 12, pp. 15-28.
Zhu, J.; Hou, R.; Wang, X.; Wang, W.; Cao, J. et al. (2019): Enabling privacy-
preserving, compute-and data-intensive computing using heterogeneous trusted execution
environment. ArXiv Preprint ArXiv:1904.04782.
You can also read