Solvent Effects on Radical Copolymerization Kinetics of 2-Hydroxyethyl Methacrylate and Butyl Methacrylate - MDPI
←
→
Page content transcription
If your browser does not render page correctly, please read the page content below
polymers
Article
Solvent Effects on Radical Copolymerization
Kinetics of 2-Hydroxyethyl Methacrylate and
Butyl Methacrylate
Loretta A. Idowu and Robin A. Hutchinson *
 Department of Chemical Engineering, Queen’s University, 19 Division St., Kingston, ON K7L 3N6, Canada;
 16lai@queensu.ca
 * Correspondence: robin.hutchinson@queensu.ca; Tel.: +1-613-533-3097

 Received: 16 February 2019; Accepted: 8 March 2019; Published: 13 March 2019

 Abstract: 2-Hydroxyethyl methacrylate (HEMA) is an important component of many acrylic
 resins used in coatings formulations, as the functionality ensures that the chains participate in
 the cross-linking reactions required to form the final product. Hence, the knowledge of their radical
 copolymerization kinetic coefficients is vital for both process and recipe improvements. The pulsed
 laser polymerization (PLP) technique is paired with size exclusion chromatography (SEC) and nuclear
 magnetic resonance (NMR) to provide kinetic coefficients for the copolymerization of HEMA with
 butyl methacrylate (BMA) in various solvents. The choice of solvent has a significant impact on
 both copolymer composition and on the composition-averaged propagation rate coefficient (kp,cop ).
 Compared to the bulk system, both n-butanol and dimethylformamide reduce the relative reactivity
 of HEMA during copolymerization, while xylene as a solvent enhances HEMA reactivity. The
 magnitude of the solvent effect varies with monomer concentration, as shown by a systematic study
 of monomer/solvent mixtures containing 50 vol%, 20 vol%, and 10 vol% monomer. The observed
 behavior is related to the influence of hydrogen bonding on monomer reactivity, with the experimental
 results fit using the terminal model of radical copolymerization to provide estimates of reactivity
 ratios and kp,HEMA .

 Keywords: radical polymerization; polymerization kinetics; copolymerization; reactivity ratios;
 PLP-SEC; radical propagation; 2-hydroxyethyl methacrylate; hydrogen bonding; solvent effects.

1. Introduction
      Acrylic copolymers are commonly used as binder resins in automotive coatings because of their
contributions to film properties, including adhesion, strength (crack resistance), appearance, and
chemical and water resistances [1]. These resins are prepared through the free radical polymerization
(FRP) of a mixture of acrylate, methacrylate, and other vinyl unsaturated compounds. Led by
an expectation from the consumer for improvement in coatings characteristics balanced with the
burden of rising raw material cost, the industry is constantly seeking to improve their recipes and
methodologies. In the pursuit of these goals, solvent-borne coatings employ monomers with reactive
functionalities, in order to reduce the amount of solvent required in the formulation by also reducing the
average molecular weight (MW) of the polymer being produced. Such a monomer is 2-hydroxyethyl
methacrylate (HEMA); hydrophilic and easily polymerized, its primary alcohol allows for easy post
modification (such as crosslinking) to impart the durability and strength needed in the final coating.
In order to distribute the crosslink sites along the polymer chain, as well as to reduce the impact of
its higher relative cost, the fraction of HEMA used as a comonomer in automotive coatings is kept
relatively low. A knowledge of its copolymerization kinetics with other common acrylate, methacrylate,

Polymers 2019, 11, 487; doi:10.3390/polym11030487                           www.mdpi.com/journal/polymers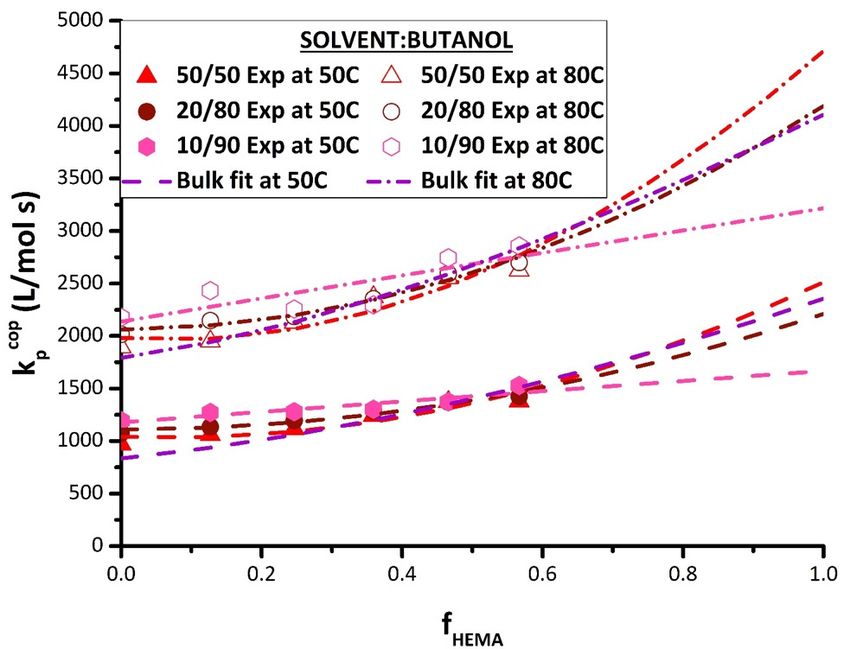
Polymers 2019, 11, 487                                                                               2 of 18

and styrenic monomers is required in order to understand how the functional groups are distributed
in the acrylic resin.
      FRP is used to produce these materials, owing to its lower cost, its tolerance to trace impurities,
and its robustness to monomer choice. In FRP, however, the lifetime of a single chain is a fraction of a
second, while the overall reaction time to completely convert the monomer to polymer is typically
several hours. Thus, there is the need to tightly control reactor conditions so that the chains produced
at the beginning of the batch are of similar composition and MW as those produced at the end. In other
words, it is necessary to be able to predict how the relative consumption rates of monomers and initiator
in the reactor vary with reaction conditions. The reaction system is further complicated by the presence
of hydroxy-functional monomers, as the solvent choice affects the FRP copolymerization kinetics.
      A very important parameter controlling both polymerization rate and polymer molecular weight
is the propagation rate coefficient (kp ), which can be determined by pulsed laser polymerization in
conjunction with size exclusion chromatography (PLP-SEC). This specialized method developed by
Olaj et al. [2] allows for an accurate determination of kp from the molecular weight distribution (MWD)
of the resultant polymer. A mixture of monomer and photoinitiator is exposed to a series of laser pulses
at a set repetition rate, with each pulse creating a fresh population of radicals in the system. While
initiation only occurs with each pulse, propagation and termination of radicals proceed continuously
between the pulses. At the subsequent pulse, a fresh set of radicals is created, causing a burst of
termination to occur with the previously created radicals that have survived termination for the t0
seconds between pulses:
                                               Li = ikp [M]t0 .                                       (1)

      The dead chains formed at that instant have a specific chain length (Li ), which is the product of
kp , monomer concentration [M], assumed to be constant for the experiment, as monomer conversion is
kept low, generally < 5%), and t0 . The isolated polymer product from the PLP experiment analyzed by
SEC shows distinct features corresponding to Li , with the position of the inflection point of the second
peak (L2 ) having a molecular weight approximately twice the value of the first (L1 ) [2–9].
      Validated by extensive theoretical and experimental investigations, the PLP technique has been
successfully used to determine the propagation coefficients for various monomers, with results
summarized by a series of IUPAC-endorsed publications providing benchmark values for styrene [3],
methacrylates [4–6], acrylates [7,8], and vinyl acetate [9]. With these studies and more, variations
within and between the acrylate and methacrylate families of monomers are generalized. In the
methacrylate family, an increase in kp by ~30% is seen with an increase in the size of ester-side chain,
with no significant change in the activation energy observed [5]. Similar behavior is seen for the acrylate
family, although the acrylate chain-end propagation rate coefficients are roughly 50 times greater than
those of methacrylates [8]. The most relevant observation to this work is the variation in trend by
monomers containing an OH-group. For example, HEMA [10] and 2-hydroxethyl acrylate (HEA) [11]
are characterized by kp values up to a factor of two higher than the values for the other members of
their respective families, a result attributed to intermolecular hydrogen-bonding between monomer
units that reduces the electron density (and hence increases reactivity) of the double bond [11–14].
The PLP-SEC technique was also used to demonstrate that an H-bonding solvent such as n-butanol
increases the kp value of n-butyl methacrylate (BMA) by greater than 50% [12]. The influence of solvent
is strongest when hydrogen bonding between solvent and monomer occurs, as solvent influences on
kp are limited to at most 20% in the absence of H-bonding [13].
      Recent efforts have explored the influence of H-bonding on copolymerization kinetics, both
rate and copolymer composition. Compared with common alkyl methacrylates such as BMA and
dodecyl methacrylate (DMA) copolymerized with styrene (ST), the copolymerization of HEMA
with ST in bulk is characterized by a higher incorporation of HEMA into the ST-methacrylate
copolymer compared with the other systems [14]. A follow-up study determined that solvent
choice greatly influences both copolymer composition and the composition-averaged propagation
rate coefficient (kp,cop ) for ST/HEMA, but has a negligible influence on the kinetics of ST/BMA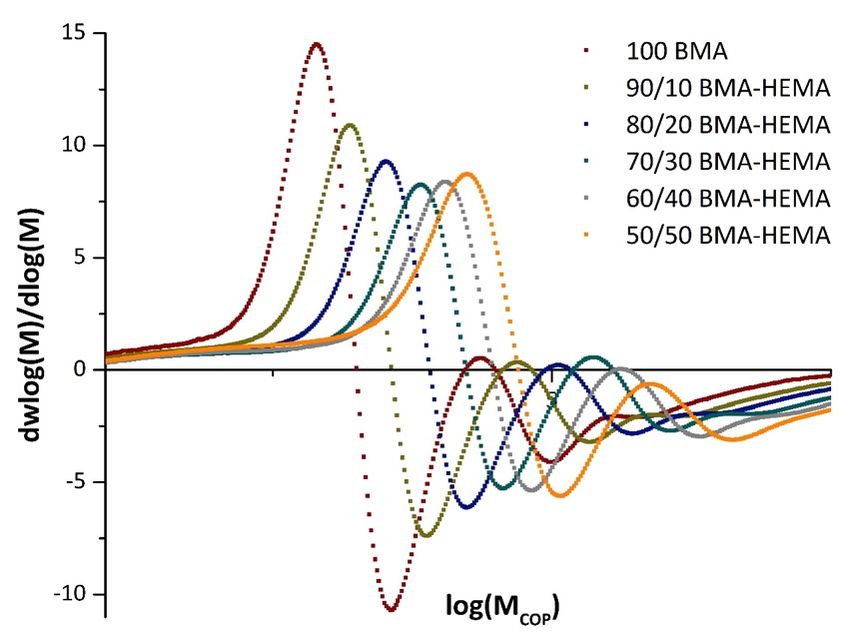
Polymers 2019, 11, 487                                                                             3 of 18

copolymerization [15]. In particular, polar solvents were shown to reduce the relative reactivity
of HEMA during copolymerization, but not influence BMA reactivity. The findings aligned with
the hypothesis by Beuermann [12,13] that competitive monomer/monomer and monomer/solvent
H-bonding impacts the electron density around the double bond, and thus its reactivity to
radical addition.
     While similar behavior has been observed when HEMA or 2-hydroxyethyl acrylate (HEA) are
copolymerized with other acrylates and methacrylates [16,17], the influence of solvent choice on the
system reactivity ratios has yet to be generalized. Rooney and Hutchinson [18] recently hypothesized
that both the type and the amount of solvent significantly impact relative monomer reactivities by
influencing the extent of H-bonding interactions between functionalized monomers (HEMA, HEA) and
the same units incorporated into the copolymer chain. However, more data are required to determine
whether this representation can be applied across a broad range of conditions.
     With that goal in mind, the copolymerization of HEMA with BMA is an attractive system to
study, as the relative incorporation rates of monomers in methacrylate–methacrylate copolymerization
are equal in the absence of H-bonding effects, such that copolymer composition matches that of the
monomer mixture. BMA is widely used for coatings owing to its lower cost and the fact that its
hydrophobic nature traits make it a desirable monomer to copolymerize with HEMA. Liang et al. [19]
reported that n-butanol (BUOH) boosted BMA incorporation such that it eased towards the same
reactivity as HEMA, whereas the reactivity of HEMA was suppressed in dimethylformamide (DMF)
because of the disruption of H-bonding between HEMA molecules. These results were in line
with the solvent effects reported in the comparison of ST/HEMA and ST/BMA copolymerization
kinetics [14,15]. However, the experimental dataset was limited and the fraction of solvent relative
to the BMA/HEMA mixture was kept constant at 50 vol% [19]. In this paper, we conduct PLP-SEC
experiments at two temperatures to completely determine how copolymer composition and kp,cop are
affected by the solvent to monomer ratio as well as the solvent type. In addition, the ability of the
terminal model to represent the dataset is assessed.

2. Materials and Methods
      The chemicals HEMA (97% purity, containing ≤250 ppm monomethyl ether hydroquinone
inhibitor (MEHQ)), BMA (99% purity, containing 10 ppm MEHQ as inhibitor), BUOH (≥99.9% purity),
DMF (99.8% purity), THF (tetrahydrofuran containing 250 ppm BHT as inhibitor, ≥99.0% purity),
and photoinitiator DMPA (2,2-dimethoxy-2-phenylacetophenone, 99% purity) were obtained from
Sigma-Aldrich and used as received. Xylene (isomeric mixture, ≥98.5% purity) procured from Fisher
Scientific and DMSO-d6 (dimethyl sulfoxide-d6 , 99.9% D) from Cambridge Isotope Laboratories Inc.
(Tewksbury, MA USA) were all also used as received.
      Polymerizations were performed to low conversions in a pulsed laser setup following previously
established procedures [14–18]. A Coherent (Santa Clara, CA, USA) Excimer Xantos XS Laser (XeF as
the reactive gas) capable of producing a 351 nm laser pulse was used as the radiation source, with 5 ns
pulse duration, 500 Hz pulse repetition capability, and 6 mJ maximum energy per pulse. The laser
beam was reflected into a ThorLabs Inc. (Newton, NJ, USA) Q3500 µL quartz sample cell used as the
PLP reactor.
      BMA/HEMA comonomer mixtures of varying composition (vol %) were prepared with 5 mmol/L
DMPA photoinitiator. The comonomer mixtures were then diluted to 10% (90 vol% solvent), 20%
(80 vol% solvent), and 50% (50 vol% solvent) for the study, with some experiments also conducted in
bulk (0% solvent). The comonomer/solvent mixture (~2 mL) was added to the cell and exposed to
the laser energy with temperature controlled by a circulating oil bath and measured in the cell to be
at ±1 ◦ C of the desired set point (50 or 80 ◦ C). The conversions save for bulk (no solvent used) were
kept below 3% to avoid composition drift. Conversions in bulk were slightly higher but below 10%,
still providing reliable kinetic data [16,17,20]. The resulting polymer was dried under air to aid in the
removal of supernatant solution (solvent and unreacted monomer mixture).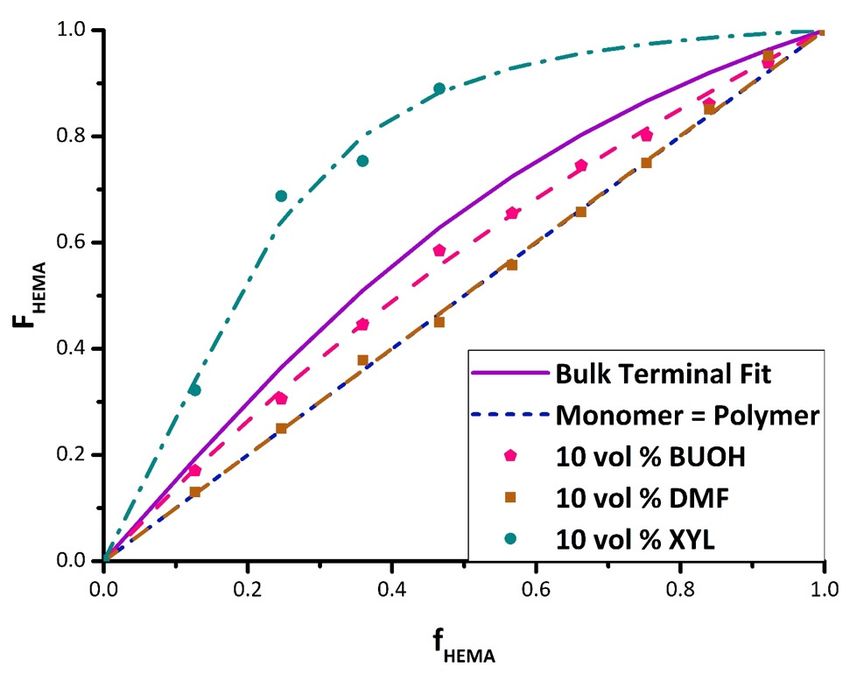
Polymers 2019, 11, 487                                                                                     4 of 18

      To determine propagation kinetics (kp,cop ), size exclusion chromatography (SEC) was used to
analyze the molecular weight distribution (MWD) of the polymer. Polymer samples analyzed for
propagation kinetics were dissolved in THF at a concentration of 3 mg/mL and passed through 0.2 µm
filters for size exclusion chromatography (SEC) analysis. As copolymer samples with greater than
70 mol% HEMA were insoluble in THF, kp values of these HEMA-rich copolymers could not be
evaluated. The SEC setup consisted of a Waters Corporation (Milford, MA, USA) 2960 separation
module with a Waters 410 differential refractometer (RI detector) and a Wyatt Instruments (Santa
Barbara, CA, USA) Dawn EOS 690 nm multi-angle light scattering detector (LS detector). Calibration
for the RI detector was performed using polystyrene standards that ranged from 890–3.55 × 10⁵ g/mol,
while the MWs of the copolymers were calculated via universal calibration using a weighted average
of the known Mark–Houwink parameters for poly(HEMA) and poly(BMA) homopolymer [14,19]. The
LS output was determined from known dn/dc values, and thus is independent from the standards
used to calibrate the RI detector. A comparison showed that the kp,cop values estimated from the
two detectors were within 10% of each other. As polymer concentrations were sometimes too low
for reliable analysis by the LS detector, the RI results, which also showed better reproducibility, are
reported in the study.
      Differentiation of the resultant MWD slices gives values for the inflection points from which kp,cop
is calculated according to Equation (1), modified for copolymerization as follows:

                                                           MWi
                                              kp,cop =             ,                                           (2)
                                                         iφmon ρt0

where MWi is the polymer molecular weight at the ith inflection point maximum determined from
SEC analysis, φmon is the volume fraction of the monomer in the monomer/solvent mixture, ρ is the
monomer mixture density (assuming volume additivity), and t0 is the time between the pulses
(inverse of the laser frequency). Table 1 summarizes the necessary monomer densities, dn/dc
values, and Mark–Houwink (K and a) constants required to analyze the system. On the basis of
previous practices [14–17], copolymer values are estimated using a weighted average of the known
homopolymer values.

      Table 1. Parameters required for kp,cop calculation from pulsed laser polymerization (PLP) experiments
      for butyl methacrylate (BMA)/2-hydroxyethyl methacrylate (HEMA) [14,19], with temperature T in ◦ C.

           Monomer        Monomer Density (g/mL)           dn/dc (mL/g)         K (dL/g)           a
            HEMA              1.092–9.80 × 10⁻⁴ T               0.056          2.39 × 10⁻⁴       0.537
            BMA              0.9145–9.64 × 10⁻⁴ T               0.080          1.48 × 10⁻⁴       0.664

      Copolymer composition was determined by proton nuclear magnetic resonance (NMR). After
air drying, the samples were precipitated in an appropriate solvent/non-solvent mixture. Copolymer
produced in BMA/HEMA mixtures varying between 100:0 and 80:20 were precipitated in a 1:1 v/v
methanol/water mixture and the remaining compositions in a diethyl ether/heptane mixture. The
excess solvent was decanted and the samples dried in a vacuum oven at 60 ◦ C for at least 24 h. The
polymer was then dissolved in DMSO-d6 at ~10 mg/mL for proton NMR analysis conducted on a
500 MHz Bruker at room temperature. An example spectrum is shown in Figure 1, with copolymer
fraction determined using an integral analysis of side chain proton signals according to the following:
                                      R                       R
                                     2 OH| 4.8ppm               CH2 |3.56ppm
                           FHEMA   = R             or FHEMA = R              .                                 (3)
                                       CH2 |3.9ppm              CH2 |3.9ppm

    The estimates from the two calculations were in good agreement (less than 5% difference) with
average values reported. Monomer presence (if any) was determined by integration of the double bond
peaks (5.68 and 6.06). These peak integration values were subtracted from polymer integrations, to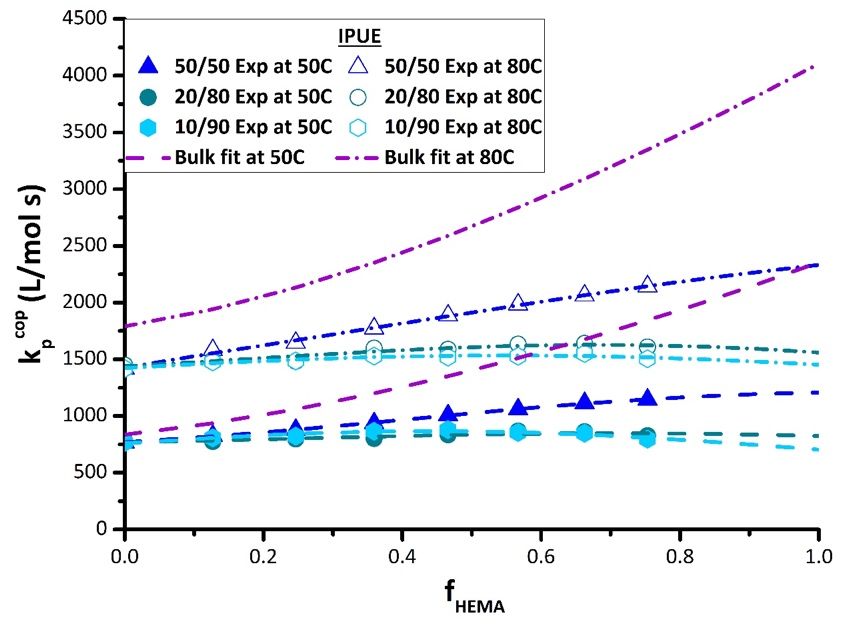
Polymers 2019, 11, 487                                                                                   5 of 18

           ensure composition was determined based on polymer content alone. Some samples had interference
           with the peak at 3.56 ppm owing to a water peak overlap from the DMSO-d6 . For these cases, a
           600 MHz Bruker with a water peak removal function was used and though the differences were kept
Polymers 2019, 11, 10%,
           under   x FORonly
                         PEERtheREVIEW
                                 OH peak calculation values were reported.                                 5 of 18

                  Figure 1.     Expanded proton nuclear magnetic resonance (NMR) spectrum showing peaks
       Figure 1. Expanded proton nuclear magnetic resonance (NMR) spectrum showing peaks used for
                used for determination of butyl methacrylate (BMA)/2-hydroxyethyl methacrylate (HEMA)
       determination   of composition.
                copolymer  butyl methacrylate (BMA)/2-hydroxyethyl methacrylate (HEMA) copolymer
       composition.
           3. Results and Discussion

3. Results3.1.
            and  Discussion
               Analysis of Copolymer Composition
                  Samples analyzed for copolymer composition were synthesized in the PLP setup at 50 ◦ C, with a
3.1. Analysis of Copolymer Composition
         few samples produced at 80 ◦ C also characterized. In accord with previous studies [16,21], copolymer
          composition
     Samples           was for
                analyzed    independent
                                  copolymer   of temperature
                                                   composition    in this
                                                                        wererange.   Experiments
                                                                                 synthesized     inwere  conducted
                                                                                                     the PLP    setupfor
                                                                                                                       atbulk
                                                                                                                          50 °C, with
          HEMA/BMA, as well as for comonomer mixtues diluted with DMF, xylenes, and BUOH to 10 vol%,
a few samples produced at 80 °C also characterized. In accord with previous studies [16,21],
          20 vol%, and 50 vol% monomer content.
copolymer composition        was
               Each data set is      independent
                                fit by  the well-known ofMayo–Lewis
                                                            temperature           in thismodel
                                                                             terminal     range.
                                                                                               [22],Experiments     were conducted
                                                                                                     which relates copolymer
for bulk HEMA/BMA,
          molar compositionas well
                                (F1 ) toasthe
                                            forcorresponding
                                                 comonomercomonomer  mixtues diluted        with DMF,(f1xylenes,
                                                                                    molar composition       ) in termsand   BUOH to
                                                                                                                       of the
10 vol%, reactivity
          20 vol%,ratios
                     and (r
                          501 and
                               vol% r2 ) monomer
                                         that describecontent.
                                                        the relative monomer reactivity in the system.
     Each data set is fit by the well-known Mayo–Lewis                       terminal model [22], which relates copolymer
                                                                 r1 (f1 )2 + f1 f2
molar composition (F1) to the corresponding       F 1 =          comonomer molar        ,    composition (f1) in terms     (4) of the
                                                         r1 (f1 )2 + 2f1 f2 + r2 (f2 )2
reactivity ratios (r1 and r2) that describe the relative monomer reactivity in the system.
           with
                                                                      2
                                                    , r2 = r1 (, ff11)= + f1 f 21
                                              kp,11       kp,22            [M ]
                                       r1 =                                          , f + f = 1,                     (4a)
                                               F1 =
                                              kp,12       kp,21
                                                              2
                                                                        [M1 ] + [M2 ] 1, 2
                                                                                       2                                         (4)
           and kp,ij
                                                  r1 ( the
                      the propagation coefficient for
                                                              + 2 f1 fof2 monomer
                                                        f1 ) addition     + r2 ( f 2 ) j to radical i.
                A set of experiments were run in bulk to establish a baseline relationship between comonomer
with       and copolymer composition in the absence of solvent. The reactivity ratios were calculated using
           non-linear parameter estimation in Origin Lab software and confirmed with parameter estimation
           routines in MATLAB. The     k p,11current data
                                                      k p,22are in reasonable
                                                                         [M1 ]agreement with results reported by
                                r1 =           , r2 =        , f1 =                , f1 + f 2 = 1 ,                            (4a)
                                       k p,12         k p,21         [M1 ] + [M 2 ] as demonstrated in Figure 2.
           Fernández-García et al. [23] and Hill et al. [24] for bulk BMA/HEMA,
           The best fit reactivity ratios (with 95% confidence intervals) from the data obtained in this study are

and kp,ij the propagation coefficient for the addition of monomer j to radical i.
     A set of experiments were run in bulk to establish a baseline relationship between comonomer
and copolymer composition in the absence of solvent. The reactivity ratios were calculated using non-
linear parameter estimation in Origin Lab software and confirmed with parameter estimation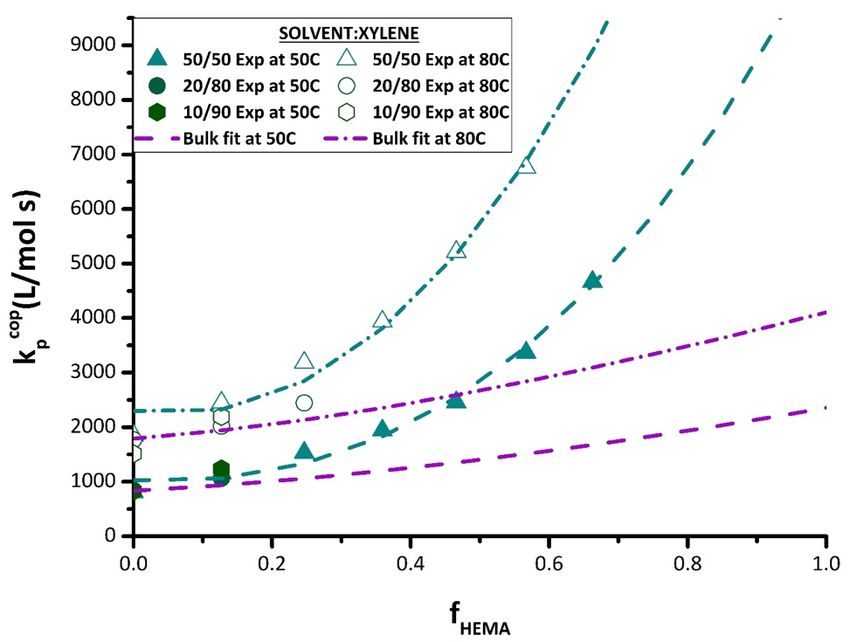
Polymers 2019, 11, 487                                                                                               6 of 18
Polymers 2019, 11, x FOR PEER REVIEW                                                                                 6 of 18

rHEMA = 2.27 ± 0.18 and rBMA = 0.66 ± 0.06, whereas the values from Hill et al., based on fewer data
 not also enhance BMA reactivity to the same extent through H-bonding with the BMA carbonyl
points and reported without confidence intervals, are rHEMA = 1.73 and rBMA = 0.65. The fit of the
 group; previous work has shown that BUOH as a solvent enhances BMA reactivity both during
combined dataset yields estimates of rHEMA = 2.25 ± 0.20 and rBMA = 0.72 ± 0.07, within confidence
 homopolymerization [12] and when copolymerized with styrene [15]. The result suggests that the
limits of the values estimated using the new data alone.
 intermolecular bonding between HEMA units is stronger than that between HEMA and BMA.

      Figure
       Figure 2.
               2. MayoMayo   Lewis
                          Lewis   plot plot
                                       of HEMAof HEMAmolar molar     composition
                                                             composition            in the copolymer
                                                                            in the copolymer   (FHEMA) vs.(Fcomonomer
                                                                                                             HEMA ) vs.
      comonomer      mixture  (f HEMA
       mixture (fHEMA) for BMA/HEMA     ) for BMA/HEMA           in bulk, compared   with  literature values
                                               in bulk, compared with literature values reported by Fernández-reported
      by
       García et al. [23] and Hill et al. [24]. Experimental data given by symbols, terminal model fits bymodel
          Fernández-García   et al. [23]  and  Hill et al. [24]. Experimental  data given by  symbols, terminal  dotted
      fits by
       lines. dotted  lines.

      In line with previous studies, the polar HEMA has higher incorporation into the copolymer
       Recognizing the influence of H-bonding on HEMA relative reactivity, previous studies have
than the non-polar BMA. While this enhanced reactivity is explained by H-bonding between HEMA
 studied the possibility of modifying this effect by introducing solvents that introduce competitive H-
molecules, it is somewhat surprising, as discussed by Rooney and Hutchinson [18], that HEMA does
 bonding or disrupt H-bonding in the system. This work goes further, varying not only solvent type
not also enhance BMA reactivity to the same extent through H-bonding with the BMA carbonyl
 but also monomer concentration (solvent fraction) to systematically explore the extent of H-bond
group; previous work has shown that BUOH as a solvent enhances BMA reactivity both during
 influences on reactivity. The solvents used in this work—n-butanol (BUOH), dimethylformamide
homopolymerization [12] and when copolymerized with styrene [15]. The result suggests that the
 (DMF), and xylene—were chosen based on previous research that highlighted their impact on related
intermolecular bonding between HEMA units is stronger than that between HEMA and BMA.
 systems [15–17].
      Recognizing the influence of H-bonding on HEMA relative reactivity, previous studies have
       Using the bulk copolymer composition results as a reference, experiments with BMA/HEMA in
studied the possibility of modifying this effect by introducing solvents that introduce competitive
 the three solvents were carried out at comonomer/solvent volume ratios of 50/50, 20/80, and 10/90.
H-bonding or disrupt H-bonding in the system. This work goes further, varying not only solvent
 Although in some cases it was not possible to cover the complete composition range because of
type but also monomer concentration (solvent fraction) to systematically explore the extent of H-bond
 heterogeneity (i.e., polymer precipitation) in the system, the data were used to estimate reactivity
influences on reactivity. The solvents used in this work—n-butanol (BUOH), dimethylformamide
 ratios for all conditions. Figure 3 summarizes the complete set of experimental results in the form of
(DMF), and xylene—were chosen based on previous research that highlighted their impact on related
 Mayo–Lewis plots, with data tabulated as Supporting Information (Tables S1 and S2). The figure also
systems [15–17].
 presents the best-fit representation of the data according to the terminal model, with the
      Using the bulk copolymer composition results as a reference, experiments with BMA/HEMA
 corresponding estimates of reactivity ratios summarized in Table 2. The values were determined with
in the three solvents were carried out at comonomer/solvent volume ratios of 50/50, 20/80, and
 some high HEMA data points excluded during the fit because of concerns regarding NMR
10/90. Although in some cases it was not possible to cover the complete composition range because
 integrations and the precipitation of copolymer from the solvent/monomer mixture [25].
of heterogeneity (i.e., polymer precipitation) in the system, the data were used to estimate reactivity
       The data shows the expected dampening effect of polar solvents BUOH and DMF on HEMA
ratios for all conditions. Figure 3 summarizes the complete set of experimental results in the form of
 incorporation [15,19], with the extent of the variation from the bulk system dependent on the solvent
Mayo–Lewis plots, with data tabulated as Supporting Information (Tables S1 and S2). The figure also
 level. In addition, a boosting effect of xylene on HEMA reactivity is observed. For example, with 20
presents the best-fit representation of the data according to the terminal model, with the corresponding
 vol% monomer in solution (Figure 3b) and fHEMA = 0.47, the HEMA fraction incorporated into the
estimates of reactivity ratios summarized in Table 2. The values were determined with some high
 copolymer increases from its bulk value of 0.63 to 0.88 in xylene, but decreases to 0.55 in BUOH and
HEMA data points excluded during the fit because of concerns regarding NMR integrations and the
 0.43 in DMF. Previous studies [15–17] have attributed the decrease in HEMA incorporation (relative
precipitation of copolymer from the solvent/monomer mixture [25].
 to bulk) to the role of the solvent in enhancing (BUOH) or disrupting (DMF) H-bonding, although a
 clear interpretation of xylene on relative reactivity has not been established. Further discussion of the
 data, organized by solvent, follows.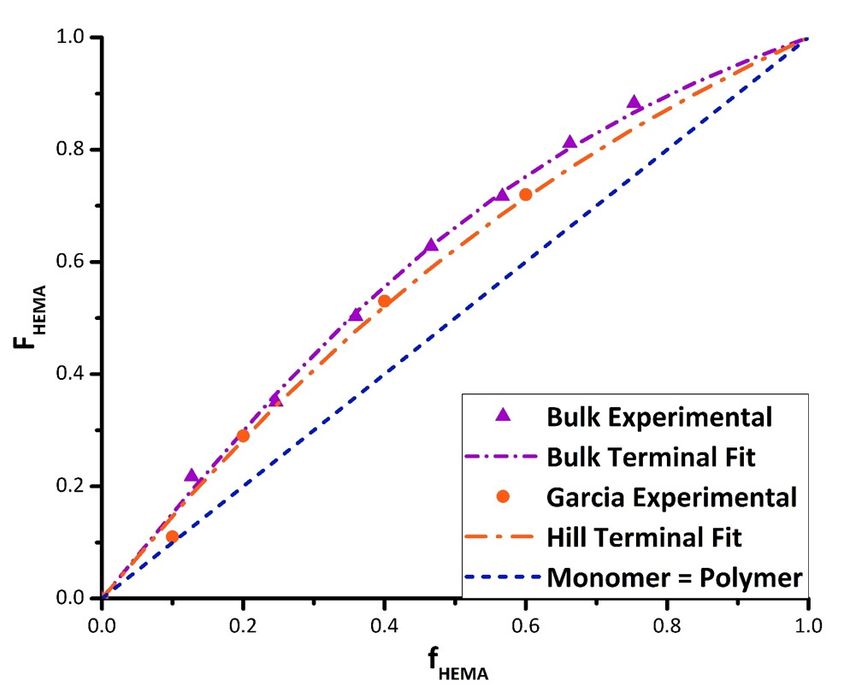
Polymers 2019, 11, 487                                                                                                  7 of 18
Polymers 2019, 11, x FOR PEER REVIEW                                                                                   7 of 18

                             (a)                                                            (b)

                                                             (c)
                BMA/HEMAMayo
     Figure 3. BMA/HEMA         MayoLewis
                                        Lewisplots
                                                plotsofofHEMA
                                                          HEMAmolarmolar  composition
                                                                       composition     inin
                                                                                          thethe copolymer
                                                                                               copolymer       (FHEMA
                                                                                                            (FHEMA ) vs.)
     vs.  comonomer
     comonomer         mixture
                   mixture      (fHEMA
                            (fHEMA       ), grouped
                                   ), grouped          by vol%
                                                 by vol%        monomer
                                                           monomer     in thein the mixture:
                                                                                 mixture:  (a) (a) 50 vol%
                                                                                               50 vol%       monomer
                                                                                                         monomer      in
     in  solvent; (b) 20 vol%   monomer      in solvent;  and  (c) 10 vol%    monomer     in  solvent.
     solvent; (b) 20 vol% monomer in solvent; and (c) 10 vol% monomer in solvent. Lines are the best-fitLines   are the
     best-fit representation
     representation           of experimental
                      of experimental             data according
                                         data points    points according    to the terminal
                                                                   to the terminal    model model     using reactivity
                                                                                               using reactivity  ratios
     ratios summarized    in Table  2. Each    plot contains the  curve  for  the bulk  system
     summarized in Table 2. Each plot contains the curve for the bulk system (solid line), and   (solid line),
                                                                                                           the and  the=
                                                                                                                FHEMA
     F
     fHEMA    = fHEMA (dashed
      HEMAdiagonal     diagonalline)
                                  (dashed    line) indicating
                                       indicating              equal comonomer
                                                     equal comonomer                 reactivity.
                                                                           reactivity.            BUOH—n-butanol;
                                                                                        BUOH—n-butanol;         DMF—
     DMF—dimethylformamide;
     dimethylformamide; XYL—xylene.  XYL—xylene.
     Table 2. Reactivity ratios determined by terminal model fit to data, with 95% confidence intervals.
     As studied
     “System”     by Beuermann
               refers               [12,13],
                       to the vol% of        the OH
                                      comonomer       group
                                                   in the   in BUOH undergoes
                                                          monomer/solvent  mixture.hydrogen  bonding with
                                                                                    BUOH—n-butanol;
the BMA   carbonyl    group,  decreasing
     DMF—dimethylformamide; XYL—xylene.   the  electron density of the double  bond, thereby  increasing its
reactivity towards radical attack, as demonstrated by the increase in its homopropagation rate
coefficient. The role of BUOH  System
                                   in the presence of rHEMA
                                                        HEMA is less clear,rBMAas both species can participate
                                Bulk the addition
in H-bonding. At 50 vol% solvent,                     of±BUOH
                                                   2.27    0.18 enhances     ± 0.06
                                                                        0.66the reactivity of BMA to a greater
                            50% in  BUOH           2.78  ± 0.38         1.10 ±  0.15
extent than HEMA does, as the fraction of HEMA incorporated into the copolymer decreases towards
                            20% in BUOH            1.99 ± 0.22          1.00 ± 0.13
the diagonal compared 10%   within in  bulk for fHEMA
                                    BUOH
                                                          < 0.5; at higher
                                                   1.43 ± 0.09
                                                                             HEMA fractions, however, the
                                                                        0.69 ± 0.05
copolymer composition is50%   the in
                                   same
                                     DMF as measured     for the
                                                   2.39 ± 0.49   bulk system.   Increasing the BUOH fraction
                                                                        1.18 ± 0.28
to 80 vol% and 90 vol% lowers20% inthe
                                     DMF           1.18 ± 0.12 over the
                                        HEMA incorporation              1.11 ± 0.12 composition range, such
                                                                           complete
that the best-fit curves lie 10%  in DMF
                             entirely  below that 1.01   ± 0.07
                                                    of the                   ± 0.07 in HEMA incorporation
                                                                        1.00decrease
                                                            bulk case. The
                             50% in XYL              14 ± 5.3           1.97 ± 0.80
is largely captured by a decrease in the HEMA reactivity ratio (see Table 2), although HEMA
                             20% in XYL             57.6 ± 273           5.41 ± 26
monomer addition to a HEMA   10% inradical
                                     XYL    is still14.9
                                                     favored
                                                         ± 7.3 over BMA    monomer
                                                                        0.75 ± 0.41 addition even at a high
BUOH fraction. Though the solvent contribution towards H-bonding boosts the reactivity of BMA, it
is not selective and also increases the probability of increased H-bonding for HEMA, allowing the
     The data shows the expected dampening effect of polar solvents BUOH and DMF on HEMA
preferential incorporation of HEMA to persist.
incorporation [15,19], with the extent of the variation from the bulk system dependent on the solvent
level. In addition, a boosting effect of xylene on HEMA reactivity is observed. For example, with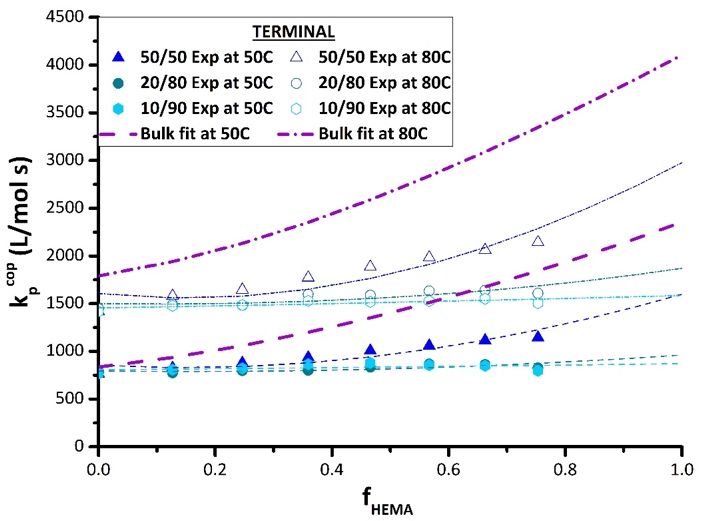
Polymers 2019, 11, 487                                                                             8 of 18

20 vol% monomer in solution (Figure 3b) and fHEMA = 0.47, the HEMA fraction incorporated into the
copolymer increases from its bulk value of 0.63 to 0.88 in xylene, but decreases to 0.55 in BUOH and
0.43 in DMF. Previous studies [15–17] have attributed the decrease in HEMA incorporation (relative to
bulk) to the role of the solvent in enhancing (BUOH) or disrupting (DMF) H-bonding, although a clear
interpretation of xylene on relative reactivity has not been established. Further discussion of the data,
organized by solvent, follows.
      As studied by Beuermann [12,13], the OH group in BUOH undergoes hydrogen bonding with
the BMA carbonyl group, decreasing the electron density of the double bond, thereby increasing
its reactivity towards radical attack, as demonstrated by the increase in its homopropagation rate
coefficient. The role of BUOH in the presence of HEMA is less clear, as both species can participate in
H-bonding. At 50 vol% solvent, the addition of BUOH enhances the reactivity of BMA to a greater
extent than HEMA does, as the fraction of HEMA incorporated into the copolymer decreases towards
the diagonal compared with in bulk for fHEMA < 0.5; at higher HEMA fractions, however, the copolymer
composition is the same as measured for the bulk system. Increasing the BUOH fraction to 80 vol%
and 90 vol% lowers the HEMA incorporation over the complete composition range, such that the
best-fit curves lie entirely below that of the bulk case. The decrease in HEMA incorporation is largely
captured by a decrease in the HEMA reactivity ratio (see Table 2), although HEMA monomer addition
to a HEMA radical is still favored over BMA monomer addition even at a high BUOH fraction. Though
the solvent contribution towards H-bonding boosts the reactivity of BMA, it is not selective and also
increases the probability of increased H-bonding for HEMA, allowing the preferential incorporation of
HEMA to persist.
      Adding DMF as solvent also decreases the HEMA incorporation into the copolymer relative to
bulk. DMF has a greater influence than BUOH, however, such that the reactivity of BMA becomes
equal to that of HEMA (i.e., copolymer composition along the diagonal in Figure 3) for 20 vol% and
10 vol% monomer in solution; the corresponding reactivity ratio estimates decrease to unity within
experimental error (Table 2). This result can be attributed to the aprotic nature of DMF that serves to
disrupt the H-bonding between HEMA molecules rather than increasing BMA reactivity [15,19]. DMF
levels the playing field for the two monomers, completely eliminating the higher relative reactivity for
HEMA seen in bulk copolymerization with BMA.
      As a non-polar solvent, xylene might be expected to be inert and hence yield the same copolymer
composition as measured in bulk. However, there is a substantial increase in the relative reactivity of
HEMA in xylene compared with the bulk case seen at all solvent levels. Schier and Hutchinson [16]
and Ito et al. [26] also observed that HEMA (or HEA) has an abnormally high relative reactivity when
copolymerized in aromatic compounds such as toluene and xylene that is not seen in other non-polar
solvents. The reason for this behavior is not evident. Aromatic compounds are capable of forming
weak hydrogen bonds owing to their π electrons, with substitution by a methyl group increasing
the donor ability of the ring [27]. It has been hypothesized that this reduces the electron density of
the HEMA double bond and further enhances its reactivity, as suggested in a recent computational
study [28]. However, it is unlikely that this effect is stronger than that introduced by intermolecular
H-bonding between HEMA units.
      Others [23,29] propose that solvent effects in HEMA copolymerization result from a bootstrap
effect, where the preferential solvation of HEMA next to the growing chain causes a higher localized
concentration. This microphase separation isolates pockets of monomer, which leads to preferential
HEMA incorporation without any change in the actual reactivity ratios. However, a careful study by
Ito et al. [26] argues that the magnitude of the change is too large to be explained by the bootstrap
effect alone. Their investigation of HEMA copolymerized with dodecyl methacrylate (DMA) reports
very similar results to what is found in the current study for BMA/HEMA; with all experiments
conducted at a total monomer concentration of 0.5 mol/L, the reactivity of HEMA is abnormally high
in benzene (rHEMA = 11, rDMA = 0.7), HEMA is more reactive than DMA in tert-BUOH (rHEMA = 1.6,
rDMA = 0.5), and copolymerization in DMF leads to equal incorporation of the two monomers (rHEMA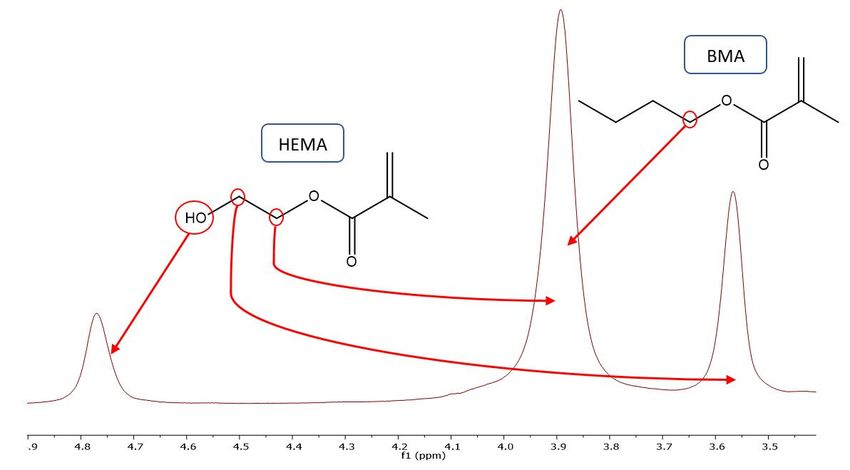
Polymers 2019, 11, 487 9 of 18
= rDMA ∼
∼ = 1.0). These reported reactivity ratio values for HEMA/DMA are in excellent agreement
with the Table 2 best-fit values for HEMA/BMA with 10 vol% and 20 vol% monomer in solution. The
study by Ito et al. [26] determined that the more than ten-fold increase in rHEMA greatly surpassed
the increased mean degree of HEMA aggregation in benzene, which was measured to be a factor of
two based on cryoscopic measurements. Thus, it was concluded that the bootstrap effect alone cannot
explain the magnitude of the increased HEMA incorporation. Rooney and Hutchinson [18] propose
that the increased reactivity of HEMA results not from monomer aggregation, but rather from HEMA
hydrogen bonding between monomer and a HEMA unit located on the growing chain close to the
radical2019,
Polymers end11,
in xthe
FORnon-polar solvent, increasing the incorporation rate of the HEMA into the9copolymer
PEER REVIEW of 18
relative to the bulk system.
radical end the
While in origin
the non-polar solvent, HEMA
of the enhanced increasing the incorporation
incorporation in xylenerate of theaHEMA
remains into
matter of the the
debate,
copolymer relative to the bulk system.
series of plots in Figure 3 demonstrate that the magnitude of the increased reactivity is accentuated
While the origin of the enhanced HEMA incorporation in xylene remains a matter of debate, the
as the solvent fraction is increased from 50 vol% to 90 vol%. However, the change in reactivity is
series of plots in Figure 3 demonstrate that the magnitude of the increased reactivity is accentuated
not necessarily proportional to solvent level in general; in DMF and BUOH, a decreased HEMA
as the solvent fraction is increased from 50 vol% to 90 vol%. However, the change in reactivity is not
incorporation is seen as the solvent level is increased from 50% to 80%, but little further change is
necessarily proportional to solvent level in general; in DMF and BUOH, a decreased HEMA
observed for 90% solvent.
incorporation is seen as the solvent level is increased from 50% to 80%, but little further change is
observed for 90% solvent.
3.2. Analysis of Composition-Averaged Propagation Rate Coefficient
Copolymer
3.2. Analysis composition provides
of Composition-Averaged a means
Propagation toCoefficient
Rate examine the effect of solvent on relative reactivity.
Further insights can be gained by also considering kp,cop the
Copolymer composition provides a means to examine
values, which measure the solvent influence
effect of solvent on relative reactivity.
Further insights can be gained by also considering kp,cop values, whichthe
on absolute (rather than relative) monomer addition rates. Using IUPACthe
measure recommended PLP-SEC
solvent influence
method, k data were collected at two temperatures (50 and 80 ◦ C) and two repetition rates per
on absolutep,cop
(rather than relative) monomer addition rates. Using the IUPAC recommended PLP-SEC
method, kp,cop data 4were
condition. Figure illustrates theattypical
collected PLP structures
two temperatures (50 achieved.
and 80 °C)With
and several maximarates
two repetition observed
per on
condition. Figure 4 illustrates the typical PLP structures achieved. With several maxima observed on1 used
the corresponding first derivative plots, the first inflection point is taken as the position of MW
to calculate
the kp,copfirst
corresponding according to Equation
derivative (2). To
plots, the first check the
inflection pointvalidity
is takenofasthe
thedata, the of
position second inflection
MW1 used
point
to is alsokp,cop
calculate analyzed to verify
according that MW
to Equation (2).2 is
Toatcheck
aboutthetwice the value
validity of the of the the
data, first. The complete
second inflectionset of
data are
point tabulated
is also analyzedas to
Supporting
verify thatInformation
MW2 is at about (Tables S3–S6).
twice the value of the first. The complete set of
data are tabulated as Supporting Information (Tables S3–S6).
(a) (b)
Figure
Figure4.4.(a) Size exclusion
(a) Size chromatography
exclusion (SEC)-measured
chromatography molecular molecular
(SEC)-measured weight distributions and (b)
weight distributions
resultant first derivative
and (b) resultant curves of curves
first derivative BMA/HEMA copolymers copolymers
of BMA/HEMA generated by pulsed by
generated laser
pulsed
polymerization (PLP) of bulk BMA/HEMA mixtures of varying monomer
laser polymerization (PLP) of bulk BMA/HEMA mixtures of varying monomer composition. composition. PLP
experiments
PLP experimentsconducted at 80 °C with
conducted at 80a pulse repetition
◦ C with raterepetition
a pulse of 35 Hz using
rate5 of
mmol/L
35 Hz2,2-dimethoxy-
using 5 mmol/L
2-phenylacetophenone (DMPA).
2,2-dimethoxy-2-phenylacetophenone (DMPA).
The
Thecomplete
completesetsetofof
experimental
experimental data is plotted
data in Figure
is plotted 5, comparing
in Figure kp,cop results
5, comparing found infound
kp,cop results
each solvent at both 50 and 80 °C against
◦ values obtained for the bulk system,
in each solvent at both 50 and 80 C against values obtained for the bulk system, to examine to examine for for
differences
differencesthat
thatmay
may bebeattributed to solvent
attributed effects.
to solvent The values
effects. displayed
The values are averaged
displayed from the two
are averaged from the
repetition results per temperature. As previously mentioned, data are not available for HEMA
homopolymerization or HEMA-rich copolymers, as the samples were not soluble in THF for SEC
analysis. In bulk (Figure 5a), the values of kp,cop increase in a close-to-linear fashion from the BMA
homopolymerization value as HEMA is added, as also evidenced by the shift of the distributions
(and corresponding inflection points) to higher MWs seen in Figure 4. The same general trend is seen
in the various solutions, with the exception of DMF. The plots for the solution data include the bulk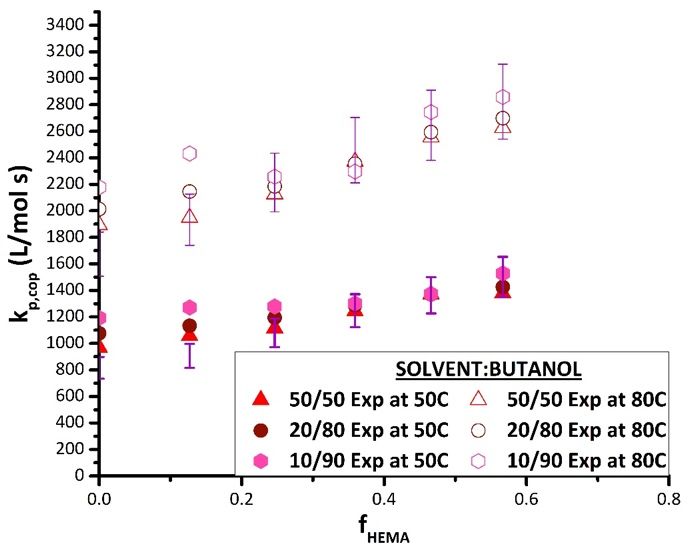
Polymers 2019, 11, 487 10 of 18
two repetition results per temperature. As previously mentioned, data are not available for HEMA
homopolymerization or HEMA-rich copolymers, as the samples were not soluble in THF for SEC
analysis. In bulk (Figure 5a), the values of kp,cop increase in a close-to-linear fashion from the BMA
homopolymerization value as HEMA is added, as also evidenced by the shift of the distributions (and
corresponding inflection points) to higher MWs seen in Figure 4. The same general trend is seen in
the various solutions, with the exception of DMF. The plots for the solution data include the bulk
values with ±10% error bars, the generally accepted uncertainty in PLP-determined kp values [4–9];
deviations outside this range can be attributed to solvent effects rather than experimental error. As H
bonds are weaker at higher temperatures, the difference (if any) between the bulk and solvent values
Polymers 2019, 11, x FOR PEER REVIEW 10 of 18
may be decreased at 80 ◦ C compared with at 50 ◦ C [12,13].
(a) (b)
(c) (d)
Figure5.5.Copolymer
Figure Copolymerkp,cop kp,copvalues
valuesplotted
plottedagainst
againstHEMA
HEMAmolarmolarfraction
fractionininthe
theBMA/HEMA
BMA/HEMAmonomer
monomer
mixture (fHEMA ◦
mixture (fHEMA))as
asmeasured
measuredby byPLP/SEC
PLP/SECat at50
50and
and80 C atatdifferent
80 °C differentmonomer/solvent
monomer/solventvolume
volumeratios
ratios
(see
(seelegends)
legends)inin(a)(a)bulk, (b)n-butanol,
bulk,(b) n-butanol,(c)(c)dimethylformamide,
dimethylformamide,and and(d)
(d)xylenes.
xylenes.The
Theresults
resultsobtained
obtained
ininbulk
bulkare
areincluded
includedininthe theplots
plotsfor
forsolvents with
solvents 10%
with 10%error
errorbars.
bars.
InInBUOH,
BUOH,kkp,cop
p,cop of the BMA/HEMA
of the BMA/HEMAsystem systemisisboosted
boostedcompared
comparedwith with bulk
bulk atat lower
lower (f HEMA
(fHEMA <
< 0.25)
0.25) HEMA content (Figure 5b). This increase
HEMA content (Figure 5b). This increase in kp,cop in k is more pronounced as solvent concentration
p,copis more pronounced as solvent concentration
increases
increases(monomer
(monomer content
contentlowered from from
lowered 50 vol%
50 tovol%
10 vol%).
to 10Invol%).
agreement with previously
In agreement with published
previously
data
published data [12,15], the increase is dependent on the ratio of BUOH to BMA in the system, andtois
[12,15], the increase is dependent on the ratio of BUOH to BMA in the system, and is attributed
anattributed
increase in
to BMA reactivity
an increase due to
in BMA the interactions
reactivity due to theof its carbonyl group
interactions with BUOH.
of its carbonyl groupThis increased
with BUOH.
reactivity persistsreactivity
This increased when small amounts
persists of HEMA
when small are added of
amounts to the
HEMAsystem,
are but disappears
added to the completely
system, but
disappears completely when HEMA fraction in the monomer mixture is raised to 0.3 (at 50 °C) or 0.2
(at 80 °C). There is no significant difference in kp,cop values between bulk and BUOH solution for
higher HEMA contents, although there is some indication that the values in BUOH solution are
decreasing to lower than bulk for the higher HEMA fractions of 0.5 and 0.6. These results suggest
that BUOH promotes the reactivity of BMA, but may reduce the reactivity of HEMA through itsPolymers 2019, 11, 487 11 of 18
when HEMA fraction in the monomer mixture is raised to 0.3 (at 50 ◦ C) or 0.2 (at 80 ◦ C). There is no
significant difference in kp,cop values between bulk and BUOH solution for higher HEMA contents,
although there is some indication that the values in BUOH solution are decreasing to lower than bulk
for the higher HEMA fractions of 0.5 and 0.6. These results suggest that BUOH promotes the reactivity
of BMA, but may reduce the reactivity of HEMA through its competitive H-bonding, a result also
consistent with the reduced HEMA incorporation seen in the copolymer composition data (Figure 3).
As also seen in the copolymer composition results, the relative reactivity of HEMA is greatly
reduced in BMA/HEMA copolymerization in DMF relative to the bulk system (Figure 5c). Although
kp,cop still increases with increasing HEMA level in 50 vol% DMF, the enhanced reactivity of
HEMA completely disappears once DMF becomes the predominant species; for 20 vol% and
10 vol% monomer mixtures in solvent, the kp,cop values are within 10% of the BMA experimental
homopropagation value at both 50 and 80 ◦ C. While this disruption of HEMA reactivity has been
previously observed in copolymerization with ST [15,30], the complete flattening of the curve in this
methacrylate/methacrylate study relative to the bulk system is particularly illuminating, illustrating
both the strong influence of HEMA H-bonding on its reactivity in the absence of solvent and its equal
reactivity to a “normal” methacrylate such as BMA when that H-bonding is disrupted.
Though an increase in kp,cop values in xylene relative to bulk can be clearly seen (Figure 5d),
poor copolymer solubility in the mixtures restricted the experimental range that could be studied at
higher HEMA levels. Higher xylene levels (80 vol% and 90 vol%) resulted in turbidity and eventual
separation during the low conversion PLP experiment, a result perhaps also exacerbated by the
increased incorporation rates of HEMA into the copolymer (see Figure 3). Even at 50 vol% solvent, the
reaction cell became cloudy at increased HEMA levels. A second issue limiting the xylene data set was
that, even for concentrations for which the solution remained homogeneous, the resultant polymer
(containing a high HEMA fraction) was insoluble in THF and thus could not be analyzed by SEC.
Previous studies have also found a significant increase in the reactivity of hydroxyfunctional monomers
HPMA (hydroxypropyl methacrylate) [13] and HEA [17] when polymerized in xylenes. While all
studies relate the behavior to the hydroxyl functional group, the literature has been unable to reach
a consensus on the cause of the increased reactivity. It has been hypothesized that a donor–acceptor
complex between the growing polymer radical and the aromatic solvent affects reactivity [28,31], and
that the non-polar solvent may lead to partial solubility that results in localization of the monomer
species and preferential solvation [23,26] or to enhanced H-bonding involving HEMA units in the
polymer chain [18]. As discussed for the copolymer composition results, perhaps all of these factors
contribute to the behavior observed.
3.3. Fitting of Propagation Data
Propagation kinetics in a two monomer system can be represented by the terminal model
(Equation (5)) or by the implicit unit model (IPUE) (Equation (6)). While the terminal model assumes
that the reactivity of a growing chain is dependent only on the last monomer unit added, the IPUE
model assumes that the identity of the unit preceding the radical influences its reactivity (kp,cop ) but
not its selectivity (i.e., copolymer composition) [32]. Thus, the need to use the IPUE to represent kp,cop
does not discredit the terminal model representation of composition, and the monomer reactivity ratios
estimated from the terminal-model fit of composition data are still employed in the IPUE treatment
of kp,cop .
r (f )2 + 2f1 f2 + r2 (f2 )2
kp,cop = 1 1 , (5)
r1 f1/kp,11 + r2 f2/kp,22
r1 (f1 )2 + 2f1 f2 + r2 (f2 )2
kp,cop = , (6)
r1 f1/k11 + r2 f2/k22
with
kp,111 (r1 f1 + f2 ) kp,222 (r2 f2 + f1 ) kp,211 kp,122
k11 = ; k22 = ; s1 = ; s2 = . (6a)
r1 f1 + f2 /s1 r2 f2 + f1 /s2 kp,111 kp,222Polymers 2019, 11, 487 12 of 18
The new parameters in the IPUE model, radical reactivity ratios s1 and s2 , capture the influence
of the penultimate unit on the reactivity of the radical taking part in the homopropagation of the
monomer [32].
For the analysis of kp,cop , it is good practice to start by comparing terminal model predictions
to the experimental data. While shown not to be valid for many mixed monomer systems (e.g.,
styrene/methacrylate, styrene/acrylate, acrylate/methacrylate) [14,16,32–35], the terminal model
has provided
Polymers 2019, 11, xa FOR
reasonable
PEER REVIEW estimate of kp,cop data in the few methacrylate/methacrylate studies 12 of 18
that could be found in the literature [32]. However, in order to compare predictions to the data,
be found in the literature
homopolymerization kp values[32]. However,
for each monomer in order
in eachtosolvent
compare predictionsThis
are required. to task
the isdata,
not
homopolymerization
straightforward because,kp values
as seenfor eachdata
by the monomer
of Figure in5,each solvent are required.endpoints
the homopolymerization This taskare is not
not
straightforward because, as seen by the data of Figure 5, the homopolymerization
only dependent on the monomer/solvent pairing, but also vary with the solvent fraction in the system. endpoints are not
only dependent
Though kp valueson arethe monomer/solvent
experimentally pairing,
determined for but
BMAalso vary the
directly, with the solvent
insolubility fraction in the
of poly(HEMA) in
system.
THF madeThough kp values
it impossible are experimentally
to measure the corresponding determinedkp,HEMA forvalues.
BMA directly, the insolubility
Thus, non-linear parameter of
poly(HEMA)
estimation wasinusedTHFtomadeestimateit impossible
the necessary to measure the corresponding
homopolymerization kp,HEMA values.
values, assuming that theThus, non-
terminal
linear parameter estimation was used to estimate the necessary homopolymerization
model (Equation (5)) provides a valid description of the kp,cop datasets and using the reactivity ratios values,
assuming
fit from thethat the terminal
composition datamodel (Equationin(5))
summarized Tableprovides
2. a valid description of the kp,cop datasets and
usingThe thefitting
reactivity ratios fit from the composition data summarized
methodology was first tested using the bulk kp,cop experimental in Table data
2. plotted in Figure 6,
usingThe thefitting methodology
bulk reactivity ratioswas first tested
reported using
in Table 2. the
Thebulk kp,cop experimental
resulting estimates of thedata plotted
BMA in Figure
(kp,BMA ) and
6, using the bulk reactivity ratios reported in Table 2. The resulting
HEMA (kp,HEMA ) endpoint values are compared to literature and experimental (available for BMA estimates of the BMA (k p,BMA) and
HEMA
only) (kp,HEMA
values in )Table
endpoint
3. The values are compared
agreement to literature
with literature valuesand for experimental
kp,BMA at both(available
temperatures for BMAand
only) values in Table ◦ 3. The agreement with literature values for k p,BMA at both temperatures and with
with kp,HEMA at 50 C is within the 10% uncertainty generally associated with the method. However,
kp,HEMA
the at 50 °C isinwithin
discrepancy the 10%
the kp,HEMA uncertainty
value estimated generally
at 80 ◦ Cassociated with the
with literature [10]method.
is closerHowever,
to 20%. The the
discrepancy in the kp,HEMA value estimated at 80 °C with literature [10] is closer to 20%. The
corresponding predictions of the terminal model are compared to the experimental bulk kp,cop in
corresponding
Figure 6 over the predictions
complete of the terminal
composition model
range. are compared
While the curves to the experimental
generated using the bulk kp,cop kinp
literature
Figure 6 over the complete composition range. ◦ While the curves generated
values go through most of the data points, at 80 C, the deviation between predicted and experimental using the literature kp
values gogreater
becomes through most
than theoferror
the data
barspoints, at 80 HEMA
at a higher °C, the deviation
content (fHEMAbetween predicted
> 0.6). and experimental
This deviation might be
becomes greater than the error bars at a higher HEMA content (f HEMA > 0.6). This deviation might be
attributed to uncertainty in the HEMA homopropagation kp value, available from a single literature
attributed
study [10],to uncertainty
but could alsoinindicate
the HEMA that homopropagation
the terminal model kpdoes
value, not available
providefrom
a gooda single literature
representation
study
of [10],
kp,cop at but
the could
higheralso indicate that
temperature theExperimental
level. terminal model datadoes not provide
measured a good
at a high representation
HEMA content are of
k p,cop at the higher temperature level. Experimental data measured at a high HEMA content are
required to resolve this issue.
required to resolve this issue.
Figure 6. Comparison of kkp,cop
p,cop HEMA/BMA
HEMA/BMAexperimental
experimentaldata
datameasured
measuredby by PLP-SEC
PLP-SEC experiments
experiments at
symbols) and
50 (solid symbols) and 80 ◦
80 °C (open symbols)
C (open symbols) toto terminal
terminalmodel
modelpredictions
predictionsusing
usingliterature kp,BMA and
literaturekp,BMA
p,HEMAvalues
kp,HEMA values(blue
(blue lines),
lines), and with
with best-fit
best-fitkkp,BMA
p,BMA and kp,HEMA
p,HEMA values
valuesfrom
from parameter
parameter estimation
(purple lines) as summarized in TableTable 3.
3. Data
Data are
are shown
shown with
with 10%
10% error
errorbars.
bars.
Table 3. A comparison of BMA and HEMA homopolymerization kp (L/mol s) values in bulk taken
from literature [5,10], experimentally determined in this study (BMA only), and estimated (with 95%
confidence intervals) according to the terminal model (Equation (5)) with rHEMA = 2.27 and rBMA = 0.66.
Monomer Literature Experimental Fit Values
50 °C 80 °C 50 °C 80 °C 50 °C 80 °C
BMA 756 1559 816 1673 835 ± 19 1791 ± 63Polymers 2019, 11, 487 13 of 18
Table 3. A comparison of BMA and HEMA homopolymerization kp (L/mol s) values in bulk taken
from literature [5,10], experimentally determined in this study (BMA only), and estimated (with 95%
confidence intervals) according to the terminal model (Equation (5)) with rHEMA = 2.27 and rBMA = 0.66.
Literature Experimental Fit Values
Monomer
50 ◦ C 80 ◦ C 50 ◦ C 80 ◦ C 50 ◦ C 80 ◦ C
BMA 756 1559 816 1673 835 ± 19 1791 ± 63
HEMA 2563 5123 2355 ± 56 4105 ± 142
The strategy developed to fit the terminal model to estimate homopolymer kp values from
experimental kp,cop data was then applied to the various sets of solution kp,cop data measured in this
Polymers 2019, 11, x FOR PEER REVIEW 13 of 18
study. The best-fit kp,BMA and kp,HEMA values for BUOH and xylene solvents are summarized in
Table
4, with4,the
with the corresponding
corresponding terminalterminal modelcompared
model curves curves compared to experimental
to experimental data7.inAs
data in Figure Figure
there 7.
As
were insufficient data for the experiments conducted with 10 vol% and 20 vol% monomer in xylene,in
there were insufficient data for the experiments conducted with 10 vol% and 20 vol% monomer
xylene, theconducted
the fit was fit was conducted
using onlyusing
the only the xylene
50 vol% 50 vol% xylene
data. Whiledata.
the While the curve generated
curve generated by the
by the terminal
terminal model fit provides a good representation of the k p,cop data measured
model fit provides a good representation of the kp,cop data measured in xylene (Figure 7b), it should in xylene (Figure 7b),
it should be noted the best-fit
be noted the best-fit kp,BMA endpoint k p,BMA is higher than the experimental values measured at 80 °C; otherat
endpoint is higher than the experimental values measured
80 ◦ C; other
studies havestudies have also
also shown thatshown
xylenethat doesxylene does not the
not influence influence
value theof kvalue of kp,BMA
p,BMA [15,16].
[15,16].
What What
is most
is most remarkable is that the value
remarkable is that the value of kp,HEMA required of kp,HEMA required to represent the
to represent the kp,cop dataset inp,cop k xylene is greater than is
dataset in xylene
greater
the bulkthanvaluethebybulk valueofby4–5.
a factor a factor
Whileofthis
4–5.value
While is this value assuming
estimated is estimated theassuming the terminal
terminal model, the
model, the actual experimental k values measured at f = 0.6 already
actual experimental kp,cop values measured at fHEMA = 0.6 already exceed the literature values for bulk
p,cop HEMA exceed the literature
values
HEMA.for bulk HEMA.
Although Although
the reason for the
thisreason
behaviorfor is
this behavior
not clear, itiscannot
not clear, it cannot be
be explained byexplained by the
the bootstrap
bootstrap
model; themodel;
required themonomer
required concentration
monomer concentration
around thearound the radical
radical would exceed would
that exceed that
in a bulk in a bulk
monomer
monomer system, a physically impossible
system, a physically impossible situation. situation.
(a) (b)
Figure 7. Experimental results (points) for BMA/HEMA
BMA/HEMAkkp,cop determined
p,cop determined atat
5050
and
and 8080°C◦ C
byby
PLP-SEC
PLP-SEC
experimentation in in(a)
(a)BUOH
BUOH andand
(b) (b) xylene
xylene at different
at different monomer/solvent
monomer/solvent volumevolume ratios
ratios (see (see
legends).
legends). fits
Terminal Terminal fits represented
represented by the dottedby lines,
the dotted lines,
with best fit with
valuesbest
of kfit values
p,BMA andof
k k p,BMA
p,HEMA and k
summarized
p,HEMA
summarized
in Table 4. Thein best-fit
Table 4.lines
The representing
best-fit lines representing the bulk
the bulk system system
are taken fromareFigure
taken from
6. Figure 6.
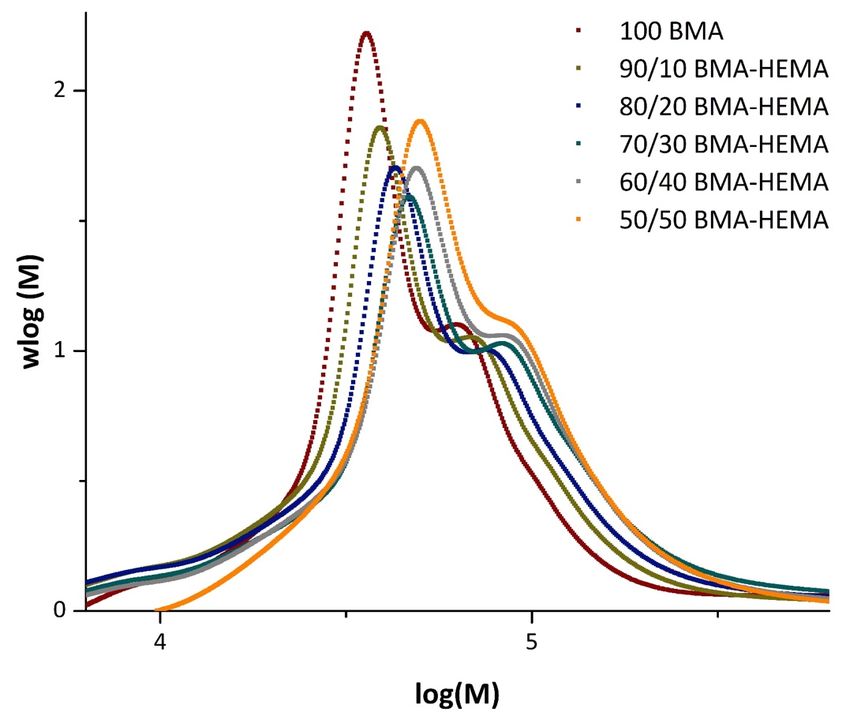
The kp,cop dataobtained
p,cop data obtainedininBUOH
BUOHare arealso
alsowell-represented
well-representedbybythe theterminal
terminal model
model (Figure
(Figure 7a).
7a).
Consistent
Consistent with withprevious
previousinvestigations
investigations [12,13,15,16]
[12–13,15–16]and also
and matching the experimental
also matching data obtained
the experimental data
in this study,
obtained in thisthestudy,
estimate
the of kp,BMAof
estimate is kaffected by H-bonding
p,BMA is affected of the monomer
by H-bonding with BUOH,
of the monomer with the
with BUOH,
with thevalue
best-fit best-fit value
(Table 4)(Table 4) systematically
systematically increasing increasing as the monomer
as the monomer fractionfraction is decreased
is decreased from 50from
vol%
50 10
to vol%
vol%.to 10 Atvol%. At the
the other endother endkof
of the thecurve,
p,cop kp,cop curve, the opposite
the opposite trendtrend is required
is required to fit to
thefitdata
the data
to the
to the terminal
terminal model;model;
that is,that is, kp,HEMA
kp,HEMA is predicted
is predicted to decrease
to decrease from
from the the value
bulk bulk value with increasing
with increasing BUOH
BUOH fraction.
fraction. It is alsoIt interesting
is also interesting
to notetothat
note that higher
while while higher
BUOHBUOH content content
slightlyslightly increases
increases the
the values
values
of kp,copoffor
kp,cop for BMA-rich
BMA-rich mixtures
mixtures (fHEMA
(fHEMA < 0.5),
< 0.5), thethe three
three curvesconverge
curves convergeatatan an ffHEMA
HEMA value
valueofof~0.6,
~0.6,
with the increased BUOH content then predicted to decrease the averaged propagation rate
coefficient in the system as fHEMA increases further. The ability to analyze PLP-generated HEMA-rich
polymer samples is necessary to verify these predictions.You can also read