Optimizing Machine Learning Parameters for Classifying the Sweetness of Pineapple Aroma Using Electronic Nose - inass
←
→
Page content transcription
If your browser does not render page correctly, please read the page content below
Received: March 1, 2020. Revised: May 22, 2020. 122

 Optimizing Machine Learning Parameters for Classifying the Sweetness of
 Pineapple Aroma Using Electronic Nose

 Mhd Arief Hasan1 Riyanarto Sarno2* Shoffi Izza Sabilla2

 1
 Informatics Study Program, Universitas Lancang Kuning, Pekanbaru 28265, Indonesia
 2
 Department of Informatics, Faculty of Intelligent Electrical and Informatics Technology,
 Institut Teknologi Sepuluh Nopember (ITS), Surabaya 60111, Indonesia
 * Corresponding author’s Email: riyanarto@if.its.ac.id

 Abstract: Electronic nose (e-nose) has been widely used to distinguish various scents in food. The output of e-nose
 is a signal that can be identified, compared, and analyzed. However, many researchers use e-nose without using
 standardization tools, therefore e-nose is still often questioned for its validity. This paper proposes an electronic nose
 (e-nose) to classify the sweetness of pineapples. The standard sweetness levels are measured by using a Brix meter
 as a standardization tool. The e-nose consists of a series of gas sensors MQ Series which are connected to the
 Arduino micro-controller. The sweetness levels measured by the Brix meter are then ordered into low, medium, high
 sweetness groups. These sweetness groups are used as label ground-truth for the e-nose. Signal processing PCA and
 mother wavelet is employed to reduce noise from the e-nose signals. The signal processing methods obtain optimal
 parameters to find the characteristics of each signal. Machine learning methods were successfully carried out with
 optimized parameters for the classification of three levels of sweetness of pineapple. The best accuracy is 82% using
 KNN with 3 neighbors.
 Keywords: E-nose, Classification, Pineapple, Statistical parameters, PCA, Threshold, Wavelet.

 array with each with a different sensitivity. Then,
1. Introduction the electrical signals in the form of sensor responses
 form specific patterns for the type of scent that is
 An electronic nose (e-nose) has been widely
 captured. To be able to identify or classify the
used to distinguish various scents in food. The
 pattern of a sample object, it cannot be done just by
working principle of e-nose is to mimic the function
 looking directly at the pattern produced
of the human nose, in which there are several
 quantitatively, further analysis is needed using a
receptors to identify an aroma. These receptors will
 pattern recognition machine. However, many
be replaced by sensors on the electronic nose. The
 researchers use e-nose without using standardization
electronic nose consists of several sets of gas
 tools, therefore e-nose is still often questioned for its
sensors with different selectivity, a signal collection
 validity.
unit, and a series of pattern recognition software. E-
 Pineapple, or ananas (Ananas comosus (L.)
nose has been widely used for research in the field
 Merr.) It is a type of tropical plant originating from
of food [1] and fruits [2].
 Brazil, Bolivia, and Paraguay. This plant belongs to
 The output of e-nose is a signal that can be
 the Bromeliaceae family. Smell the pineapple scent
identified, compared, and analyzed. The e-nose,
 is one of the techniques to distinguish young and
which consists of an array of non-selective chemical
 mature pineapple. A ripe pineapple is a pineapple
gas sensors, functions to capture and convert odors
 whose bottom has a distinctive aroma of ripe, sweet,
into electrical signals or sensor responses. The
 and fruity fruit. Whereas if a pineapple has an aroma
generated electrical signals are overlapping aromas
 like acid or something fermented like the smell of
forming compounds that are captured by the sensor
International Journal of Intelligent Engineering and Systems, Vol.13, No.5, 2020 DOI: 10.22266/ijies2020.1031.12
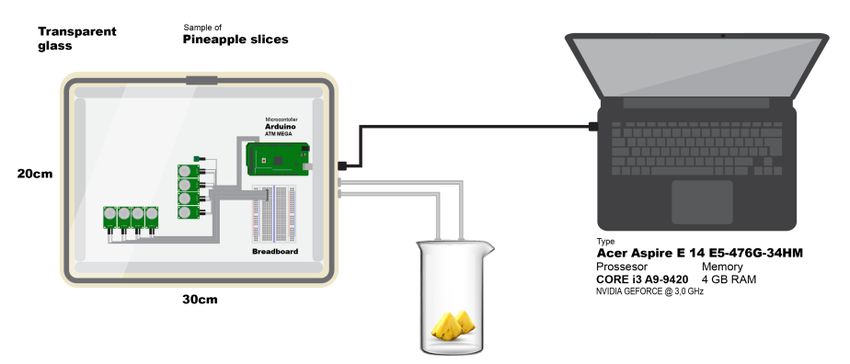
Received: March 1, 2020. Revised: May 22, 2020. 123

vinegar, then this pineapple is classified as young [2]. Many studies have used E-nose to measure fruit
pineapple. At present, to determine the level of fruit maturity using E-nose. In the research [3], E-nose is
sweetness, people still rely on trained people. used to calculate the levels of OXIDE in ripe and
Therefore this study proposes to classify pineapples young fruit. This study concluded that the resulting
using E-Nose based on the sweetness level. OXIDE levels could affect the young and ripe of
 For the standard sweetness level is measured fruit. Electronic noses can also distinguish odor
using a Brix meter as a standardization tool. Brix differences between different fruit varieties such as
Meter is a tool used to determine sugar levels in apples [4]. The use of E-Nose allows complex
food or fruit. This study uses a Brix meter to aroma changes in the fruit to be monitored [5]. It is
determine the sweetness level of each pineapple allowing a fresh pineapple to be very easily
sample to be tested using E-nose. perishable (rotten) as it affects the results of the e-
 The sweetness level measured by the Brix meter nose data that is produced. Another story in the
is then divided into 3 groups, namely low, medium, research of [6] calculates the quality level of ripe
and high sweetness. These groups are used as olive oil. European regulations govern the
ground-truth labels for e-nose. Signal processing parameters and methodology for determining the
using Principal Component Analysis (PCA) and quality of olive oil, and this quality mainly depends
wavelets aims to reduce the noise from signals on the condition of the olives after harvest. They
generated by e-nose. PCA is a technique used to succeeded in classifying with three methods of
simplify data, by transforming data linearly to form Naive Bayes (NB), Partial Least Squares
a new coordinate system with maximum variance. Discriminant Analysis (PLS-DA) and Multilayer
Principal component analysis can be used to reduce Perceptron (MLP) neural network. We determined
the dimensions of data without significantly the sweetness level of the pineapple with several
reducing the characteristics of the data. Meanwhile, sweetness levels measured using a Brix meter.
Wavelet is one tool that can be used to analyze non- Previous studies have also carried out the
stationary signals. Wavelet analysis can be used to classification process using E-nose for Java cocoa
show temporary behavior on a signal. This Wavelet fruit [7]. The best predictive classification process is
Transform Method can be used to filter data or obtained by the E-nose - MLP- ANN procedure.
improve the quality of data. The signal processing However, this research only still discusses the odor
method is calculated to obtain the optimal that occurs. Not yet discussed the integration of the
parameters and find the characteristics of each content of the fruit that affects the quality of the fruit
signal. itself. This research has not selected the best sensor
 The next process, the use of learning machines in the feature selection process using E-Nose [8].
for the classification of three levels of sweetness Instead, our research team tried to classify the
pineapple. There are four methods used in this pineapple we shared in the sweetness level process
machine learning process, namely Support Vector using E-nose and Brix Meter. Of course, this
Machine (SVM), k-nearest neighbor (KNN), research is very useful for pineapple processing
Multilayer Perceptron (MLP), and Random Forest. companies, where they require to choose the best
Of the four Machine Learning methods, the highest pineapple in large quantities (container). We begin
accuracy value with optimal parameters will be used this basic research for broader development, namely
as the success level of this study. the detection of pineapples in industrial capacity
 later.
2. E-Nose to determine the level of fruit
 sweetness. 3. Research methodology
 E-Nose technology began to be created and 3.1 Materials
developed in the early 1990s. A few years later,
Benady and Simon in 1995 began to explore E-Nose In this research, the E-Nose used is an MQ
research for the use of electronic noses to examine Series. There are ten types of gas sensors used.
the use of E-Nose in the level of fruit maturity Then These sensors are used to apprehend the difference
three years later Maul Et Early (1998) started to from the aroma of pineapple. In communicating the
create a product for commercialization, also called data, a Universal Serial Bus (USB) port is connected
the e-NOSE 4000 projects from Neotronics to the Arduino microcontroller to transfer the data
Scientific Inc., USA, which consists of 12 into a computer. The collection of gas sensors is
conductive polymers. This electronic nose has inside a sample chamber of transparent glass. In Fig.
proven useful in predicting in a non-destructive way

International Journal of Intelligent Engineering and Systems, Vol.13, No.5, 2020 DOI: 10.22266/ijies2020.1031.12
Received: March 1, 2020. Revised: May 22, 2020. 124

1, it is explained how the mechanism of the E-Nose Table 1. Sensors used and their gas compounds
tool system works. The pineapple was purchased Sensors Gas Types
from the same fruit store and was ripe at the same MQ 2 CH4, Hydrogen (H2), Carbon
age as a sample. The pineapple was cut with the size Monoxide (CO), LPG, Alcohol,
of a dice and the weight of each sample of pineapple Propane, Smoke
 MQ 4 CH4, Natural Gas, Alcohol, Smoke
(dice) used was the same, specifically 100 grams.
 MQ 6 H2, Alcohol, LPG, Cooking Fumes
 The steps in sampling the data were as follows:
 MQ 9 Coal Gas, CO, Liquefied Gas
 1. e-nose was turned on and warmed for 5 MQ 135 NH3, alcohol, NOx, smoke,
 minutes; benzene, and CO2
 2. before the sample was put into the sample room. MQ 136 H2S
 The sample of pineapple was measured by MQ 137 CO, Ammonia
 sugar content using Brix meter; MQ 138 phenyl methane, ethanol, acetone,
 3. the sample was put into the sample chamber; and methanol
 4. the process of taking data took place where the DHT – 22 Temperature and Humidity
 USB port from the sample room was inserted
 into the computer. The data collection process others. For fruit plants, refractometers help to
 lasted for approximately 10-15 minutes; determine when is the right time to harvest and
 5. the sample room was cleaned of existing classifying fruit based on the level of sweetness.
 samples; this was managed to avoid the This refractometer has a measurement range of: 0-
 occurrence of residuals from gases that occur 32% Brix, Resolution: 0.2%, Working Temperature
 from previous data collection. This process average in 10 ~ 30º C, Dimensions: 20.5 x 8 x 5.5
 took approximately 5 minutes. Therefore the cm or 8 x 3.5 x 2.3 inch. How to use this tool is by
 sample chamber was released entirely from the using a pipette to take the liquid to be measured.
 smell of the existing gas. Open the prism cover, and place 2-3 drops on the
 surface of the prism, then close it again. Point the
3.2 E-nose system prism to the light source, and observe from the side
 of the glass binoculars. Then Adjust the knob;
 The E-nose system developed in this study is
 therefore, the size is visible, its value is read based
shown in Fig. 1. Consisted of three components,
 on the boundary between the blue and white areas.
which are data acquisition and transmission unit;
 We use this to measure the sugar content in
sensor arrays and space units; power and gas supply
 pineapples.
unit. E-nose systems were always equipped with
sensors that used gas sensors that were sensitive to 3.4 Stages of research
aromatic compounds, nitrogen oxides, hydrogen,
alkanes, methane, sulfur compounds, alcohol [9]– This research used several experimental
[11]. According to volatile compounds emitted by techniques to produce the best quality data.
peaches in ripening procedures [12], volatile Following Fig. 2 which explains the research flow
metabolites were released during the growth of are explained as follows:
microorganisms [13], [14], and sensor array 1. pineapple data samples are measured using a
selection in related literature [9]–[11], our E-nose Brix meter. Then proceed with the collection of
sensor arrays were built with various sensors of E-Nose data for 15 minutes through Arduino
eight semiconductor metal oxide sensors. with the output format in the form of Comma
 Table 1 explains the use of the number of Separated Value (CSV). Resulting in E-Nose
sensors used on this e-nose. There were nine sensors data of 518 Data Lines;
that we use as described. The Gas Type column is 2. then a threshold is conducted to measure the
the type of gas produced by the sensor. However, in sweetness of the existing pineapple. So that there
this study, we did not discuss what type of sensors are 3 classes of pineapple (Low, Medium, and
and what gases would dominate the data collection High);
of pineapple using E-nose, as previous studies have 3. because the data generated in the calculation of
done [15, 16]. pineapple time is not the same. So we decided to
 take lines 113 to 300 with the aim that data
3.3 Brix meter processing can be optimized;
 4. then we reduce the noise that occurs in the data
 Brix Refractometer is used to measure sugar
 using the Mother wavelet method by using
levels in fruits, fruit juices, coffee, soft drinks, and

International Journal of Intelligent Engineering and Systems, Vol.13, No.5, 2020 DOI: 10.22266/ijies2020.1031.12
Received: March 1, 2020. Revised: May 22, 2020. 125

 Figure. 1 E-nose system

 several functions namely Sym5, db1, rbior1,1 Thus, the class interval length ( ) is obtained.
 using levels 1-10;
 ℎ
5. then we calculate the statistical parameters from = (2)
 the previous step (step 4). So we get 5400
 features from these statistical parameters;
6. Then we did a feature selection using Pearson So as the following intervals and number of data are
 Correlation and Chi-Square; obtained, the result of the interval level shown in
7. After obtaining the features then enter the Table 2.
 Principal Component Analysis (PCA) process. Table 2 explains the range of sweetness levels
 To simplify data, by transforming data linearly obtained after being calculated using a Brix meter.
 so that a new coordinate system with a maximum Then proceed with the threshold process. The
 variant is formed. The PCA process is intended interval is calculated using the manual Brix meter
 to determine the best components. The tool. In this range, there is no comma value, because
 experiment continued with classification. This the needle in the Brix meter is right in each row of
 classification process uses four methods namely numbers shown. Therefore, this study does not take
 SVM, KNN, MLP, and Random Forest; into account the fraction of the range of sweetness
8. So from the 4 experimental methods obtained the of pineapple.
 best accuracy value. Obtained accuracy with The data generated is in the form of CSV format
 optimal parameters. with the amount following the explanation in Table
 1. Each CSV produces 518 lines. Because during
3.4.1. Determination of the brix meter threshold value the data collection process there is a difference in
 the time difference between each turn on e-nose. We
 In the initial stage, the value of the limit range of decided to retrieve data from row 113 to row 300.
the sweetness of the pineapple is made. This This is intended to get maximum results. Because
calculation is done by determining the threshold these lines are lines of data retrieval directly from
value contained in the Brix meter. Brix meter value sensors that are on the E-Nose System tool
with a maximum value of 32%. This range produces described in Fig. 1.
three classes, mainly sweet, half sweet, and less
sweet. The calculation uses the following formula. If Table 2. Pineapple sweetness interval level
based on the interval formula, the interval values are Class Sweetness Value Number of
calculated wherein: Interval data
 1 0 15 High 28 Data
 =7

International Journal of Intelligent Engineering and Systems, Vol.13, No.5, 2020 DOI: 10.22266/ijies2020.1031.12
Received: March 1, 2020. Revised: May 22, 2020. 126

 Parameter Selection
 Data Treshold Selection
 Statistics Feature
 Feature
 (Pearson
 Cut Of Data Reduice Noive Parameter Correlation,
 (Line 113 to 300) (Wavelet) Statistic Chi Square)

 Best Accuracy Classification PCA
 End With Optimal For 3 Classes
 Parameter

 Automatically to
 0
Received: March 1, 2020. Revised: May 22, 2020. 127

 Table 3. The Statistical Parameter function used the appearance of the feature and the appearance of
Function Description the category, which then each term value is ranked
 H5 The h5py package is a Pythonic interface to from the highest. Chi-Square test in statistics is
 the HDF5 binary data format. HDF5 allows applied to test the independence of two events.
 users to store large amounts of numerical ( − )2
 data, and easily manipulate that data from 2 = ∑ (6)

 NumPy. where,
 N25 The binomial opportunity data distribution O : Observation value
 for N equals 25 E : Expected value (desire)
 N75 The binomial opportunity data distribution
 for N equals 75
 = ( − 1)( − 1) (7)
 N95 The binomial opportunity data distribution
 for N equals 95
 where :
 Median Used to find the middle value of data b : number of rows
 Mean The average value obtained from the sum of k : number of columns
 all values from each data, then divided by the
 amount of data available
 3.4.5. Machine learning

3.4.4. Feature selection using pearson correlation and One of the main topics in data mining or
chi-square machine learning is classification. Classification is
 an activity to group data consisting of classes then
 Feature selection is an essential part of labeled and targeted. The purpose of this algorithm
optimizing the performance of classification is to solve the problem then create a classification
methods. The primary purpose of feature selection is category that is included in the process of supervised
to reduce complexity, increase accuracy, and choose learning. The purpose of supervised learning is that
optimal features from a data feature set [20]. label data or targets play a role as a 'supervisor' or
Research conducted by Aytug Onan and Serdar 'teacher' who oversees the learning process in
Korukoglu discusses the comparison of several achieving a certain level of accuracy or precision.
feature selection methods, the feature selection This classification process uses python because it
method using Pearson Correlation Coefficient can has full features and has a platform that can be used
improve accuracy and has the advantage of being both for research and for building production
practical and fast for a massive number of features systems. This study uses four classification methods
[21]. Following is the Pearson Correlation as follows:
Coefficient equation shown in Eq. (5). a. SVM (Support Vector Machine) SVM is a
 machine learning method that carries out
 (∑ )− (∑ )( ) activities based on the rules of Structural Risk
 = (5)
 √[ ∑ 2 −(∑ )2] √[ ∑ 2 −(∑ )2] Minimization (SRM). SVM has a target to find
 the best hyperplane. The goal is to separate the
where: two classes in the input space. The basic
 : Pearson’s Product Moment Correlation principle of SVM is a linear classifier and
 Coefficient subsequently developed to work on non-linear
 : Number of data pairs of and problems. SVM tries to find the best
∑ : Total number of variables hyperplane in the input space. The basic
∑ : Total number of variables principle of SVM is a linear classifier and
∑ 2 : The square of the total number of subsequently developed to work on non-linear
 variables problems. SVM has two parameters, which are
∑ 2 C and gamma. This research creates an array
 : The square of the total number of
 variables for these parameters, as follows:
 ‘model_C’ : [0.0001; 0.001; 0.01; 0.1; 1; 10;
 Chi-Square feature selection uses statistical 100]
theory to test the independence of a term with its ‘model_gamma’ : [0.0001; 0.001; 0.01; 0.1; 1;
category [20]. One of the purposes of using this 10; 100]
feature selection is to eliminate disruptive features
in the classification. In the Chi-Square feature b. KNN (k-nearest neighbor). KNN classifies
selection based on statistical theory, two of them are objects based on learning data that is the closest

International Journal of Intelligent Engineering and Systems, Vol.13, No.5, 2020 DOI: 10.22266/ijies2020.1031.12
Received: March 1, 2020. Revised: May 22, 2020. 128

 distance to the object. KNN classifies the pineapple. Data processing methods are used to
 projected learning data in multiple dimensions. determine its classification using the PCA method.
 This space is divided into sections that This technique is widely used to reduce the number
 represent learning data criteria. Each learning of dimensions in a data set as it only uses the
 data is represented as points c in many- components that most contribute to tasks such as
 dimensional spaces. The functions of KNN in classification or regression in Machine Learning.
 Python are used as follows: The introduction of this pattern is expected to
 ‘model_n_neighbor’ : [1; 2; 3; 4; 5; 6; 7; 8; 9;
 simplify testing the difference in the sweetness level
 10] of pineapple based on the aroma of pineapple.
 ‘model_weights’ : [distance; uniform]
 3.4.7. Accuracy
c. MLP Multilayer Perceptron (MLP) MLP is Accuracy is one of the metrics for evaluating
 one type of classification method with an classification models. Informally, accuracy is the
 artificial neural network algorithm that adopts prediction fraction of our correct model. Formally,
 the workings of neural networks in living accuracy has the following definition :.
 things. This algorithm is known to be reliable
 because of the learning process that can be Accuracy
 carried out in a directed direction. Learning ℎ
 this algorithm is done by updating the back =
 ℎ
 weight (backpropagation). Determination of
 the optimal weight will produce the right
 classification results. MLP consists of a simple For binary classification, accuracy can also be
 system of interconnecting networks. The MLP calculated in terms of positive and negative as
 functions that we use in Python are as follows : follows:
 ‘model_activation’:[relu; logistic; tanh; relu] +
 ‘model_hidden_layer_sizes’:[500] =
 + + +
 ‘model_max_iter’:[10000]

d. Random Forest. This technique generates Where,
 many decision tree classifications, then make = True Positive
 decisions based on several decision trees that = True Negative
 have been made. The advantage of using = False Positive
 random forest is being able to classify data that = False Negative
 has incomplete attributes and can be used for
 classification and regression. The Random 4. Result and discussion
 Forest function used in python is as follows :
 As described in Fig. 2, researchers conducted
 ‘model_n_estimator’:[50; 100; 500; 1000] several models of machine learning testing
 experiments to determine the best results for data
3.4.6. Principal component analysis accuracy. In discussing these results we present the
 experiments that we have carried out and what the
 Principal Component Analysis (PCA) is a accuracy values obtained from these experiments.
method used to reduce the amount of data when a The experiments we use include processing data by
correlation occurs [22–24]. The aim is to find the classification, wavelets, PCA, Selection Feature.
essential part of which is a linear combination with The following is a complete explanation of the
an origin variable that explains each sensor. PCA results of the experiment and the results obtained for
projects a data matrix that initially has a high accuracy.
dimension to the lowest dimension (3 dimensions or
two dimensions) without losing the necessary 4.1 Data-classifier experiments
information. The correlation among samples can be
visualized by a plot of each significant component The first experiment conducted by us was to
[1, 25–30]. process pineapple data from E-Nose by using the
 In this research, researchers want to find out the SVM classification method. By using python we do
response pattern of a series of 10 gas sensors SVM Classification so that the result of Parameter C
(electronic nose) toward the odor pattern on is 100, The Gamma model is 0.001 with an accuracy

International Journal of Intelligent Engineering and Systems, Vol.13, No.5, 2020 DOI: 10.22266/ijies2020.1031.12
Received: March 1, 2020. Revised: May 22, 2020. 129

of 0.770. This accuracy value does not meet the reduce_dim n_components equal to 10 with
ideal classification value above 0.8. Therefore we do an accuracy value of 0.689.
other clarification methods. c. Classification using MLP obtained parameter
 activation model is equal to relu,
4.2 Data-wavelet-classifier experiments model__hidden_layer_sizes is equal to 500,
 max_iter model is equal to 10000,
 In the second experiment is to process E-Nose reduce_dim n_components is equal to 20 with
data from pineapple earlier by denoising the signal an accuracy value of 0.672.
obtained using wavelet. As explained in the previous d. Classification using Random Forest obtained
experimental method in Fig. 2. Wavelet used is the parameter model n_estimators equal to 500
mother wavelet Sym 5, db1, record 1.1 with levels with an accuracy value of 0.770.
1-10. After Denoising, classification was continued From the results of this test, it was proven that
with 4 methods namely SVM, KNN, MLP, Random the PCA process was able to improve the accuracy
Forest. In this experiment obtained better of classification testing. The best value obtained
classification parameters than previous experiments. from the results of the classification using this SVM
The parameter results obtained are as follows: method is 0.803.
a. Classification using SVM obtained values
 obtained parameter C is 10, Gamma Model is 4.4 Data-wavelet-selection feature-classifier
 0.0001 with an accuracy of 0.787. experiments
b. Classification using KNN obtained value
 obtained results 'model n_neighbors' is 6, In the fourth test, we replaced the third test,
 'model__weights' is ‘distance' with an replacing the PCA process with feature selection.
 accuracy of 0.656. Feature selection is useful for removing data that
c. Classification using MLP obtained value does not correlate So that it will improve the
 obtained results ‘activation model’ is ‘relu’, accuracy of the data in making predictions. After the
 ‘model__hidden_layer_sizes’ is 500, max_iter wavelet data is obtained then a Feature selection is
 model is 1000 with accuracy is 0.705. done using Python. After the wavelet data is
d. Classification using Random Forest obtained obtained then a Feature selection is done using
 the value of the 'n_estimators model is 1000 Python:
 with an accuracy of 0.738. a. The classification using the SVM method
 From this second step of experimentation, we shows that the parameter value of model C is
have not to get maximum results. The accuracy equal to 10, the gamma model is equal to
value obtained is still far lower than the results of 0.0001 with an accuracy value of 0.803.
the previous stage. b. Classification using the KNN Method
 obtained parameters with the n_neighbors
4.3 Data-wavelet-PCA-classifier experiments model is 6, model__weights is 'distance' with
 an accuracy value equal to 0.770
 Then we proceed with the next experiment. c. Classification with MLP is obtained The
Before doing the classification, we performed the activation model parameter is relu
PCA process, after the wavelet was obtained from model__hidden_layer_sizes is equal to 500,
the pineapple data E-Nose signal. The PCA process max_iter model is equal to 10000 with an
aims to carry out statistical processes on data to accuracy value of 0.705.
simplify existing data, By way of transforming data d. Random Forest classification obtained the
linearly so that a new coordinate system is formed results with the parameter model n_estimators
with maximum variance. After conducting this is 500 with an accuracy value of 0.770.
experiment which ended with the classification
process, obtained better results with the following 4.5 Data-wavelet-selection feature-PCA-
details, classifier experiments
a. Classification using SVM model C is equal to
 1, the gamma model is equal to 0.001, In this final test, we performed all stages from
 reduce_dim n_components is equal to 20 with steps 1 to four. Where after the data is processed
 an accuracy value of 0.803. with wavelet then performed Feature Selection the
b. Classification using KNN obtained Parameter PCA process. Finally, the classification process is
 model ‘n_neighbors’ equals 1, carried out. The results of this fifth test turned out to
 ‘model__weights’ equals distance, produce the best results from the previous test, the
 results of the test classification are as follows:
International Journal of Intelligent Engineering and Systems, Vol.13, No.5, 2020 DOI: 10.22266/ijies2020.1031.12
Received: March 1, 2020. Revised: May 22, 2020. 130

 Table 3. Experimental results with a few steps classification experiments
 Experiment Classifier Optimal parameter Accuracy
 Data – Classifier SVM With Prarameter {'model_C': 100, 'model_gamma': 0.001} 0.770
 SVM With Prarameter {'model C': 10, 'model gamma': 0.0001} 0.787
 With Prarameter {'model n_neighbors': 6,
 KNN 0.656
 'model__weights': 'distance'}
 Data – Wavelet – With Prarameter {'model activation': 'relu',
 Classifier MLP 'model__hidden_layer_sizes': 500, 'model 0.705
 max_iter': 10000}
 RandomForest With Prarameter {'model n_estimators': 1000} 0.738
 With Prarameter {'model C': 1, 'model gamma': 0.001,
 SVM 0.803
 'reduce_dim n_components': 20}
 With Prarameter {'model n_neighbors': 1,
 KNN 'model__weights': 'distance', 0.688
 Data – Wavelet– 'reduce_dim n_components': 10}
 PCA – Classifier With Prarameter {'model activation': 'relu',
 MLP 'model__hidden_layer_sizes': 500, 'model max_iter': 10000, 0.672
 'reduce_dim n_components': 20}
 With Prarameter {'model n_estimators': 50, 'reduce_dim
 RandomForest 0.787
 n_components': 10}
 SVM With Prarameter {'model C': 10, 'model gamma': 0.0001} 0.803
 With Prarameter {'model n_neighbors': 6,
 KNN 0.770
 Data – Wavelet– 'model__weights': 'distance'}
Selection Feature – With Prarameter {'model activation': 'relu',
 Classifier MLP 'model__hidden_layer_sizes': 500, 0.705
 'model max_iter': 10000}
 RandomForest With Prarameter {'model n_estimators': 500} 0.770
 With Prarameter {'model_ _activation': 'relu', 'model
 MLP hidden_layer_sizes': 500, 'model max_iter': 10000, 0.738
 'reduce_dim n_components': 10}
 With Prarameter {'model n_neighbors': 3,
 Data - Wavelet –
 KNN 'model__weights': 'uniform', 0.820
Selection Feature –
 'reduce_dim n_components': 10}
 PCA – Classifier
 With Prarameter {'model C': 1, 'model gamma': 0.001,
 SVM 0.803
 'reduce_dim n_components': 10}
 With Prarameter {'model n_estimators': 100, 'reduce_dim
 RandomForest 0.787
 n_components': 30}

a. KNN classification with Parameter that makes KNN as the best Machine Learning in
 n_neighbors model equal to 3, model the classification process [31]. Overall the results of
 _weights equal to uniform, reduce_dim this test are conveyed in Table 3. Experimental
 n_components equal to 10 with an accuracy results with several steps of experimentation and
 of 0.820. classification.
b. Classification SVM resulted for C and gamma
 parameters are 1 and 0.001 respectively. The 5. Conclusion
 reduction dimension using 10 n_component
 with accuracy is 0.803. From the results of several experiments in this
c. Random Forest Classification with Parameter study, we have managed to find the best accuracy in
 model n_estimators is 100, reduce_sum processing pineapple data using E-nose and Brix
 n_components is 30 with accuracy results is meters.We have processed the E-Nose data into
 0.787. three classes which are divided based on the
 The best accuracy is obtained by KNN threshold of the sweetness of pineapple. The best
Classification with an accuracy value of 0.820, It accuracy results we got with a value of 0.820. The
also provides the same thing as previous research accuracy results obtained by using the classification
International Journal of Intelligent Engineering and Systems, Vol.13, No.5, 2020 DOI: 10.22266/ijies2020.1031.12
Received: March 1, 2020. Revised: May 22, 2020. 131 using K-Nearest neighbor (KNN). In this study, e-Nose”, Mater. Today Proc., Vol. 5, No. 3, pp. KNN is the best method for obtaining accuracy 9866–9870, 2018. results from machine learning. These results are [4] D. Zhu, X. Ren, L. Wei, X. Cao, Y. Ge, H. Liu, preceded by a wavelet process and then a selection and J. Li “Collaborative analysis on difference feature. of apple fruits flavour using electronic nose and electronic tongue”, Sci. Hortic. (Amsterdam)., In the next research, we will do a regression Vol. 260, No. August 2019, p. 108879, 2020. process from the E-Nose and Brixmeter data that we [5] L. Torri, N. Sinelli, and S. Limbo, “Shelf life have found. This is intended to be able to see the evaluation of fresh-cut pineapple by using an effect between two or more variables. The variable electronic nose”, Postharvest Biol. Technol., relationship in question is functional which is Vol. 56, No. 3, pp. 239–245, 2010. realized in the form of a mathematical model. Then [6] D. M. Martínez Gila, J. Gámez García, A. later from the results of this regression we will get a Bellincontro, F. Mencarelli, and J. Gómez machine learning pattern linking historical data and Ortega, “Fast tool based on electronic nose to labels or outputs that are interrelated, not alone. predict olive fruit quality after harvest,” Postharvest Biol. Technol., Vol. 160, Vo. Conflicts of Interest November 2019, p. 111058, 2020. The authors declare that there is no conflict of [7] S. N. Hidayat, A. Rusman, T. Julian, K. interest. Triyana, A. C. A. Veloso, and A. M. Peres, “Electronic nose coupled with linear and Author Contributions nonlinear supervised learning methods for rapid discriminating quality grades of superior java RS is supervision that has the idea to classify the cocoa beans”, International Journal of sweetness of pineapple using E-nose. He gave an Intelligent Engineering and Systems, Vol. 12, idea to take Pineapple sample data using E-Nose and No. 6, pp. 167–176, 2019. provide a threshold on the sweetness level of [8] S. Sabilla, R. Sarno, and K. Triyana, pineapple using Brix Meter. SIS gives a role to E- “Optimizing Threshold using Pearson Nose development, she also calculating the Correlation for Selecting Features of Electronic threshold and classification process E-Nose and Nose Signals”, International Journal of Brixmeter data using Python. MAH gives a role to Intelligent Engineering and Systems, Vol. 12, the completion of this article so that this article can No. 6, pp. 81–90, 2019. be written accordingly with the problem of this [9] A. Hernández Gómez, J. Wang, G. Hu, and A. research. García Pereira, “Discrimination of storage shelf-life for mandarin by electronic nose Acknowledgments technique”, LWT - Food Sci. Technol., Vol. 40, This research was partially funded by the No. 4, pp. 681–689, 2007. Indonesian Ministry of Research, Technology and [10] H. Zhang and J. Wang, “Evaluation of peach Higher Education of the Republic of Indonesia quality attribute using an electronic nose”, under the PMDSU Program managed by Institut Sensors Mater., Vol. 21, No. 8, pp. 419–431, Teknologi Sepuluh Nopember (ITS), under the 2009. WCU Program managed by Institut Teknologi [11] S. Benedetti, S. Buratti, A. Spinardi, S. Bandung (ITB). Mannino, and I. Mignani, “Electronic nose as a non-destructive tool to characterise peach References cultivars and to monitor their ripening stage during shelf-life”, Postharvest Biol. Technol., [1] A. Loutfi, S. Coradeschi, G. K. Mani, P. Vol. 47, No. 2, pp. 181–188, 2008. Shankar, and J. B. B. Rayappan, “Electronic [12] N. Narain, T. C. ‐. Hseih, and C. E. Johnson, noses for food quality: A review”, J. Food Eng., “Dynamic Headspace Concentration and Gas Vol. 144, pp. 103–111, 2015. Chromatography of Volatile Flavor [2] J. Brezmes and E. Llobet, Electronic Noses for Components in Peach”, J. Food Sci., Vol. 55, Monitoring the Quality of Fruit. Elsevier Inc., No. 5, pp. 1303–1307, 1990. 2016. [13] R. Article, A. Sani, A. A. Aliero, and S. E. [3] M. Mallick, S. Minhaz Hossain, and J. Das, Yakubu, “Volatile metabolites profiling to “Graphene Oxide Based Fruit Ripeness Sensing discriminate diseases of tomato fruits inoculated with three toxigenic fungal International Journal of Intelligent Engineering and Systems, Vol.13, No.5, 2020 DOI: 10.22266/ijies2020.1031.12
Received: March 1, 2020. Revised: May 22, 2020. 132

 pathogens”, Mol. Plant Pathol., Vol. 2, No. 3, Food Meas. Charact., Vol. 12, No. 4, pp.
 pp. 14–22, 2011. 2385–2393, 2018.
[14] A. D. Ibrahim, A. Sani, S. B. Manga, A. A. [25] C. Li, P. Heinemann, and R. Sherry, “Neural
 Aliero, R. U. Joseph, S. E. Yakubu, and H. network and Bayesian network fusion models
 Ibafidon, “Microorganisms Associated with to fuse electronic nose and surface acoustic
 Volatile Metabolites Production in Soft Rot wave sensor data for apple defect detection”,
 Disease of Sweet Pepper Fruits (Tattase)”, Int. Sensors Actuators, B Chem., Vol. 125, No. 1,
 J. Biotechnol. Biochem., Vol. 7, No. 6, pp. 25– pp. 301–310, 2007.
 35, 2011. [26] B. Wang, S. Xu, and D. W. Sun, “Application
[15] S. I. Sabilla, R. Sarno, and J. Siswantoro, of the electronic nose to the identification of
 “Estimating Gas Concentration using Artificial different milk flavorings”, Food Res. Int., Vol.
 Neural Network for Electronic Nose”, Procedia 43, No. 1, pp. 255–262, 2010.
 Comput. Sci., Vol. 124, pp. 181–188, 2017. [27] Y. B. Che Man, A. Rohman, and T. S. T.
[16] D. R. Wijaya, R. Sarno, and E. Zulaika, Mansor, “Differentiation of lard from other
 “Sensor array optimization for mobile edible fats and oils by means of Fourier
 electronic nose: Wavelet transform and filter transform infrared spectroscopy and
 based feature selection approach”, Int. Rev. chemometrics”, JAOCS, J. Am. Oil Chem. Soc.,
 Comput. Softw., Vol. 11, No. 8, pp. 659–671, Vol. 88, No. 2, pp. 187–192, 2011.
 2016. [28] Z. Haddia, A. Amaria,b, A. Ould. Alia, N. El
[17] R. Patil, “Noise Reduction using Wavelet Baric, H. Barhoumid, A. Maarefd, N. Jaffrezic-
 Transform and Singular Vector Renaulte, and B. Bouchikhia, “Discrimination
 Decomposition”, Procedia Comput. Sci., Vol. and identification of geographical origin virgin
 54, pp. 849–853, 2015. olive oil by an e-nose based on MOS sensors
[18] L. Sharma and N. Mehta, “Data Mining and pattern recognition techniques”, Procedia
 Techniques: A Tool For Knowledge Eng., Vol. 25, pp. 1137–1140, 2011.
 Management System In Agriculture”, Int. J. Sci. [29] M. Nurjuliana, Y. B. Che Man, and D. Mat
 Technol. Res., Vol. 1, No. 5, pp. 67–73, 2012. Hashim, “Analysis of lard’s aroma by an
[19] M. Sushama, G. Tulasi Ram Das, and A. Jaya electronic nose for rapid Halal authentication”,
 Laxmi, “Detection of high-impedance faults in JAOCS, J. Am. Oil Chem. Soc., Vol. 88, No. 1,
 transmission lines using Wavelet Transform”, J. pp. 75–82, 2011.
 Eng. Appl. Sci., Vol. 4, No. 3, pp. 6–12, 2009. [30] R. Upadhyay, S. Sehwag, and H. N. Mishra,
[20] A. Sharma and S. Dey, “Performance Electronic nose guided determination of frying
 Investigation of Feature Selection Methods and disposal time of sunflower oil using fuzzy logic
 Sentiment Lexicons for Sentiment Analysis”, analysis, Vol. 221. 2017.
 Int. J. Comput. Appl., No. June, pp. 15–20, [31] D. R. Wijaya, R. Sarno, E. Zulaika, and S. I.
 2012. Sabila, “Development of mobile electronic nose
[21] M. Shardlow, “An Analysis of Feature for beef quality monitoring”, Procedia Comput.
 Selection Techniques”, Univ. Manchester, No. Sci., Vol. 124, pp. 728–735, 2017.
 1, pp. 1–7, 2016.
[22] I. Tazi, K. Triyana, and D. Siswanta, “A novel
 Arduino Mega 2560 microcontroller-based
 electronic tongue for dairy product
 classification”, AIP Conf. Proc., Vol. 1755, No.
 July, 2016.
[23] I. Tazi, A. Choiriyah, D. Siswanta, and K.
 Triyana, “Detection of taste change of bovine
 and goat milk in room ambient using electronic
 tongue”, Indones. J. Chem., Vol. 17, No. 3, pp.
 422–430, 2017.
[24] I. Tazi, K. Triyana, D. Siswanta, A. C. A.
 Veloso, A. M. Peres, and L. G. Dias, “Dairy
 products discrimination according to the milk
 type using an electrochemical multisensor
 device coupled with chemometric tools”, J.

International Journal of Intelligent Engineering and Systems, Vol.13, No.5, 2020 DOI: 10.22266/ijies2020.1031.12
You can also read