GOOGLE EARTH ENGINE AS A REMOTE SENSING TOOL
←
→
Page content transcription
If your browser does not render page correctly, please read the page content below
GOOGLE EARTH ENGINE AS A REMOTE SENSING TOOL
                            Rachel Venturino, UCLA; Michael Schall, UCLA; Jonathan Solichin, UCLA

                                                                  empowering the public in unprecedented ways by increasing
Introduction                                                      the visibility and viability of remote sensing.
   Increasing availability of publicly accessible remotely        Google is a quintessential player in the information age and
sensed data and software via Google Earth has provided a          if they seek to fulfill their aim “to organize the world’s in-
unique tool for the general public, allowing them to discern      formation and make it universally accessible and useful” the
alterations of the global environment etc. which has histori-     aforementioned concepts are imperative in their business
cally been limited to industry professionals. Liberalization of   model [1].
this material permits the general public to analyze various
global phenomenon that have proven difficult to convey
abstractly. Provided pressing issues, ranging from climate        Methodology
change to real time storm tracking, these data sets can be
utilized in new ways, from preventive studies to post-              Our first step is to survey the present public and academic
analysis. While there has been much movement in ways to           usage of Google Earth, since they represent the end user’s
acquire data, platforms for processing these data into infor-     perspective. Although there were some papers and analysis
mation has been lacking. Presently, the only publicly availa-     on Google Earth, studies of the software, particularly for
ble software known to the general public for remote sensing       remote sensing, is seldom, which increases the importance
analysis is, by and large, Google Earth.                          of this paper because it suggests that Google Earth is not
                                                                  being used to its full potential in the remote sensing space.
   Despite initial, monumental changes in user access de-         To expand our search for literature we also looked for dis-
scribed above we presume that Google is neglecting to             cussion on the use of cloud computation in remote sensing,
achieve the entirety of impact they could, based on deficien-     as well as other remote sensing computation engine.
cies in further data manipulation. Applications such as ENVI
allow users greater manipulation of imagery, yielding expo-          Once we gain preliminary understanding on the present
nential benefit to analysis and processes not obtainable with     field, our next step in our project was to acquire access to
the present functionality of Google Earth.                        Google Earth Engine Beta, since this will reveal to us where
                                                                  Google is in their development in this field, and the provid-
                                                                  er’s perspective. We applied too this program, suggesting
Background                                                        that we were in the academic remote sensing space, wanting
                                                                  to survey their Data Catalog, and their current techniques for
   Presently, Google is making headway with their Google          remote sensing analysis.
Earth Engine Beta project (hereafter: EE), a software cur-
rently available by sign up that allows remote sensing via          EE’s data catalog was then compared against freely avail-
their hosted cloud computation platform. Similarly, they          able remote sensing data through governmental databases
have begun collecting data that is becoming more publicly         such as USGS, NOAA and their sundry satellites (e.g. Land-
available to augment their current remote sensing library,        sat, GOES, EOG, etc.).
employed on Google Earth, through EE’s Data Catalog.
They have similarly started projects in the academic space           We then surveyed Earth Engine’s capability. We looked at
that demonstrates their interest in developing public aware-      its ability to deal with remote sensing from their front end
ness of remote sensing, for example: Global Forest Change         graphical user interface, as well as their programming API.
in conjunction with the University of Maryland.                   In order to learn more, we also considered the present use of
                                                                  Earth Engine.
  The present paper will attempt to survey Google Earth
Engine’s current capability, and how we can augment it with
remote sensing data and processes used in academia. We            Results
hypothesize that some ENVI functions (i.e. spectral band
selection, NDVI analysis, etc.), as well as basic algorithms        At it’s core, EE allows user to tap into Google’s massive
often used in remote sensing, as well as data freely available    computation capability to apply remote sensing research to
for the public through USGS, NOAA, and so forth, can be           general public. Their first massive project, Global Forest
baked into their publicly visible Google Earth Enging soft-       Fire, was done in conjunction with the University of Mary-
ware through an intuitive GUI, Thus allowing Google to            land, to demonstrate this capability. “Google Earth Engine is
capitalize on some of the proprietary market share while          a massively parallel technology for high-performance pro-

ISSN NO: XXXX-XXXX                                        DEC. 2014                                               PAGE NO. 1
International Journal of Remote Sensing & Geoscience (IJRSG)

cessing of geospatial data, and houses a copy of the entire         though they promote “custom web pages designed to enable
Landsat image catalog […] what would have taken a single            those capabilities for the end-user. “
computer 15 years to perform was completed in a matter of
days using Google Earth Engine computing [2]. This project
have already been cited in recent papers for its potential in       A. Applying to Google Earth Engine
helping developing areas obtain information which may oth-
erwise be unavailable due to resource. In his survey of cloud         Without applying to EE, users can test drive basic features
computation in remote sensing, Kshetri utilizes EE’s defor-         of EE. For example, they may add data from the Data Cata-
estation data as an example in which cloud computation “can         logue and experiment with how the data is viewed (e.g.
help address environmental issues”, thereby offsetting the          bands allocation, gain, palette, range, and year). However,
environmental impact caused by large server farms [3]. In           more advanced remote sensing analysis is not possible with-
fact, EE was first unveiled during a United Nations climate         out registration.
talk in Mexico, whereby it was positioned as a resource
““for measuring, reporting and verifying anthropogenic for-           We applied to Earth Engine by submitting a request to the
est-related emissions” [4].                                         Earth Engine Beta Signup, which can be obtain through this
                                                                    form [6]. Earth Engine Beta applicants must have a Gmail
  EE provides several other processed products available for        account, but other than that there does not seem to be any
browsing to the public on its website. They provide specific        restrictions. An example of our request looks like, “Some
examples for area study through application of temporal             colleagues and I are working on remote sensing application
Landsat data such as: “Saudi Arabia Irrigation” “Drying of          and analysis, at UCLA, were hoping to be permitted access
Lake Urmia, Iran”, “Columbia glacier Retreat,” “Dubai               to the Earth Engine Beta. Our work has previously utilized
Coastal Expansion”, and “Drying of the Aral Sea,” as well           programs such as ENVI and Earth Explorer. In addition we
as products done through computation such as “Global road-          are interested to see how Earth Engine might fit into the aca-
less Areas,” “water Mask of central Africa,” “NDFI over the         demic sphere.” Within roughly 24-hours we all go emails
Amazon,” and “Landsat 7 L1T Coverage” [2].                          outlining how to access the EE workspace. Provided full
                                                                    beta access you are able to do a variety of things, which we
   Another major contribution to the field is Exelis’ Service       will discuss later in in the paper.
Engine. Service Engine is a buyable product that follows
“the concept of master and worker nodes,” whereby con-              B. Data Catalog Availability
sumers would load their product on a centralized servers
which contains the computation power, as well as the data,          Table 1. Earth Explorer sans ASTER, MODIS, LAND-
which the consumer can then access through thin clients             SAT
remotely, in other words allows ENVI analytics in the cloud
[5]. Examples provided include “environmental responder[s]           Product                          Availability
getting real-time updates on rescue efforts while in the field,      Name            Coverage         on EE           Notes
a deployed soldier getting updates on enemy troop move-                                                               NAIP:
ments, severe weather warnings going out to disaster re-                                                              National
sponse teams, or even an assessment of civil unrest within a                                                          Agricul-
region” [5]. On top of existing data on servers, Service En-                                                          ture Im-
gine enables information uploads through clients on the                                                               agery
ground to provide more real-time results. They also tout in-         Aerial          Regional         L               Program
teroperability, being adherent to Open Geospatial Consorti-          Cal/Val-
um and the Esri Geo Services REST specification, and ac-             Referece
cessible via the IDL programming language [5]. Such in-              Sites           Regional         N
teroperability is demonstrated with their example of working         Declassified
in conjunction with Milcord on dPlan which optimizes UAV             (Old-
routing and analysis [5]. In fact, Service Engine is largely         Military)                        N
only a component in Exelis’ cloud strategy, since it depends         Digital Ele-
on interfaces for users to use. One such example is Exelis’          vation                           L
Jagwire, which is a “web-based software system that is spe-
                                                                     Digital Line
cifically designed for ingest, storage, management, discov-
                                                                     Graphs          Regional         N
ery, and delivery of geospatial full motion video (FMV),
                                                                     Digital Maps    Regional         N
imagery, and derived products with near real-time access,”
                                                                     USGS            Regional         N

ISSN NO: XXXX-XXXX                                        DEC. 2014                                                  PAGE NO. 2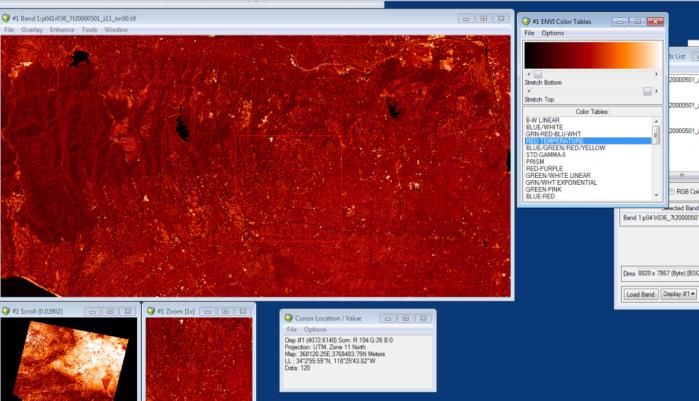
International Journal of Remote Sensing & Geoscience (IJRSG)

Group on                                                                                           ing. data
Earth Obser-                                                                                       may in-
vations                                                                                            tersect
(GEO)                                                                                              with
Global Agri-                                                                                       NAIP,
cultural                                                                                           although
Monitoring                                                                                         it seems
(GLAM)                                                                                             its for
Global Fidu-                                                                                       Canada
cials Library                                                                                      only
(GFL)                      N                                                                       Orbview
Global For-                                                                                        itself is
est Observa-                                                                                       not listed,
tion Initia-                                                                                       but may-
tive                       N                                                                       be it is a
Global Land                                                                                        part of
Survey                     Y                                                                       EE’s base
Heat Capaci-                                   Orbview                         L                   map
ty Mapping                                     National
Mission         Regional   N                   Land Cover
Lidar           Regional   N                   Data           Regional         Y
                               EE has          NASA
                               surface         LPDACC                          Y
                               tempera-        GEO-Eye                         N
AVHRR                          ture from
1km global                 L   AVHRR          Table 2. Landsat Data
                               EE has
                               NDVI            Satellites    Availability on EE
AVHRR                          from oth-       Landsat 1     Available as part of Land Survey 1975
Composites                     er satel-       Landsat 2     Available as part of Land Survey 1975
(NDVI)                     L   lites           Landsat 3     Available as part of Land Survey 1975
IKONOS-2        Regional   N                   Landsat 4     Yes
                               USGS            Landsat 5     Yes
                               has de-         Landsat 7     Yes
                               classified      Landsat 8     Yes
                               military
                               aerial         Table 3. NOAA Data
                               photos
                               from Co-        Name of Data                        Availability
                               rona,           VIIRS (Night fire / infrared
                               Argon,          spectral)                           No
                               and Lan-        DMSP (Night time lights)            Yes
                               yard,           Nightsat (Moderate resolution
Declassified                   originally      human settlements sprawl)           No
Military        Regional   N   for recon.
                                               GOES (Continuous atmos-
EO-1                       N                   phere monitoring)                   No
                               Joint Ex-
                               periment
                               of Crop
                               Assess-
                               ment and       Table 4. MEaSUREs Data Products Availability in
JECAMM          Regional   L   Monitor-       Google Earth Explorer

ISSN NO: XXXX-XXXX                     DEC. 2014                                                  PAGE NO. 3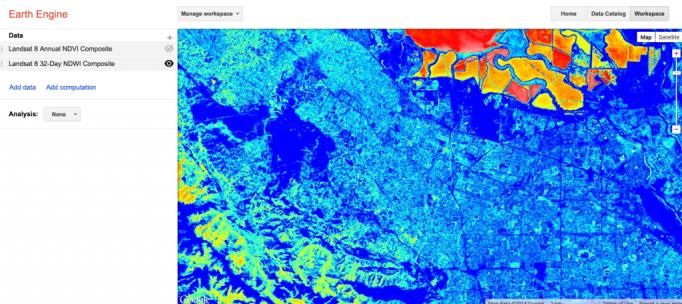
International Journal of Remote Sensing & Geoscience (IJRSG)

                                              Avai                             Annual
                  MEaSURE                     lable                            WELD
Short   Collec-   s Data       Spatial Res-   in         WEL-                  CONUS
Name    tion      Product      olution        EE         DUSLL        WELD     Lat/Long      30 m            No
                  SRTM                                   WEL-                  WELD
SRTM              Global 1                               DUSM                  CONUS
GL1     SRTM      arc second   1 arc-second   No         O            WELD     Monthly       30 m            No
                  SRTM                                                         WELD
                  Global 1                               WEL-                  CONUS
SRTM              arc second                             DUSSE        WELD     Seasonal      30 m            No
GL1N    SRTM      number       1 arc-second   No         WEL-                  WELD
                  SRTM                                   DUSW                  CONUS
SRTM              Global 3                               K            WELD     Weekly        30 m            No
GL3     SRTM      arc second   3 arc-second   No                               WELD
                  SRTM                                   WEL-                  CONUS
SRTM              Global 30    30 arc-                   DUSYR        WELD     Annual        30 m            No
GL30    SRTM      arc second   second         No
                  SRTM
                  Global 3                              Table 5. ASTER Data Products Availability in Google
SRTM              arc second                            Earth Explorer
GL3N    SRTM      number       3 arc-second   No
                  SRTM                                                                      Avai
                  Global 3                                                           Res    lable
                  arc second                             Short    Lev   Aster Data   olu-   in      Alternative in
SRTM              sub-                                   name     el    Product      tion   EE      EE
GL3S    SRTM      sampled      3 arc-second   No                        Registered
                  SRTM                                                  Radiance
                  Water                                                 at the       15,
                  Body Data                              AST_           Sensor –     30,
                  Shapefiles                             L1BE     1B    Expedited    90     No
SRTMS             & Raster                                              Recon-
WBD     SRTM      Files        1 arc-second   No                        structed
                  SRTM US                                               Unpro-
SRT-              1 arc sec-                                            cessed
MUS1    SRTM      ond          1 arc-second   No                        Instru-
                  SRTM US                                               ment Data    15,
                  1 arc sec-                             AST_           – Expedit-   30,
SRT-              ond num-                               L1AE     1A    ed           90     No
MUS1N   SRTM      ber          1 arc-second   No                        Surface
                  WELD                                                  Reflec-
WELD              Alaska                                                tance –                     Landsat 5
AKLL    WELD      Lat/Longs    30 m           No         AST_           VNIR &       15,            Surface Re-
                                                         07       2     SWIR         30     No      flectance
                  WELD
WELD              Alaska                                                Surface
AKMO    WELD      Monthly      30 m           No                        Reflec-
                                                                        tance –
                  WELD
                                                                        VNIR &
WELD              Alaska
                                                                        Crosstalk                   Landsat 5
AKSE    WELD      Seasonal     30 m           No
                                                         AST_           Corrected    15,            Surface Re-
                  WELD
                                                         07XT     2     SWIR         30     No      flectance
WELD              Alaska
                                                                        Surface
AKWK    WELD      Weekly       30 m           No
                                                                        Radiance
WELD              WELD
                                                         AST_           – VNIR &     15,
AKYR    WELD      Alaska       30 m           No
                                                         09       2     SWIR         30     No

ISSN NO: XXXX-XXXX                               DEC. 2014                                             PAGE NO. 4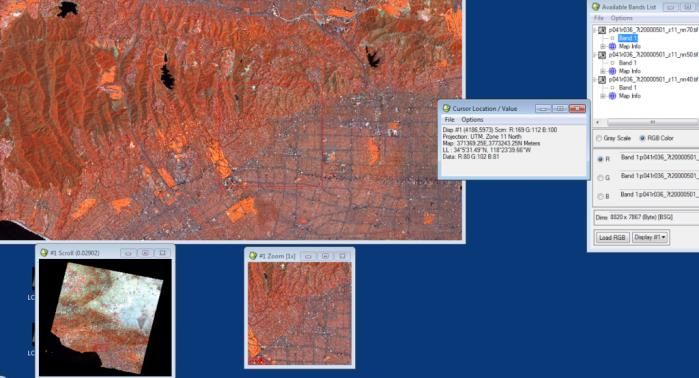
International Journal of Remote Sensing & Geoscience (IJRSG)

            Surface                                                    ASTER
            Radiance                                                   Global                        SRTM Digi-
            – VNIR &                                                   Digital                       tal Elevation
            Crosstalk                                  AST             Elevation                     Data Version
AST_        Corrected    15,                           GTM      3      Model         30     No       4
09XT   2    SWIR         30    No
            Surface
AST_        Radiance                                  Table 6. MODIS Data Products Availability in Google
09T    2    TIR          90    No                     Earth Explorer. See Appendix.
                                    MOD11A1
                                    Land Surface
                                    Temperature
                                                      C. GUI & Programming
            Surface                 and Emissivi-
                                                        Both EE and alternative software, such as ENVI have their
            Kinetic                 ty Daily
                                                      benefits and drawbacks when it comes to UI . However, the
AST_        Tempera-                Global 1 km
                                                      breadth of manipulation in EE is highly dependent on the
08     2    ture         90    No   Grid SIN
                                                      users programming capabilities (either java or python).
                                    MOD11A1
                                    Land Surface
                                    Temperature          Generally speaking microscale analysis is much more dif-
                                    and Emissivi-     ficult in EE than alternative, proprietary platforms. It should
                                    ty Daily          be mentioned that this is largely with regard to non-
AST_        Surface                 Global 1 km       classified data. Imagery and analysis that has been published
05     2    Emissivity   90    No   Grid SIN          in EE allows quite intuitive manipulation. Furthermore, not
            Registered                                having to download imagery via platforms such as Earth
            Radiance                                  Explorer and then upload it into the desired program can be
            at the                                    very efficient.
AST1        Sensor –     15,
4OT         Orthorec-    30,
H      3    tified       90    No                       Macro or global scale analysis of precomputed data sets
                                                      including NDWI, NDVI, etc. facilitate tremendously power-
            Registered
                                                      ful computation processed with Google’s serves. If one
            Radiance     15,
                                                      wanted to do the similar scale analysis on their own ma-
AST_        at the       30,
                                                      chine, not only would it take a tremendous amount of time
L1B    1B   Sensor       90    No
                                                      but would surely strain your computer (if even possible).
            Digital
                                                      Additional benefits of EE’s platform and data repository
            Elevation
                                                      include pre-written java templates for image classification.
            Model &
                                                      Again the downside of this is needing Java programming
            Registered
                                                      experience and the disorganization of resource material.
            Radiance
            at the                  SRTM Digi-
AST1        Sensor –     15,        tal Elevation        To the same end, working with imagery that is not includ-
4DM         Orthorec-    30,        Data Version      ed in the EE catalog requires laborious processes. Simple
O      3    tified       90    No   4                 functions that can be completed in ENVI such as color map-
            Recon-                                    ping, are much more complex to mimic using EE palette
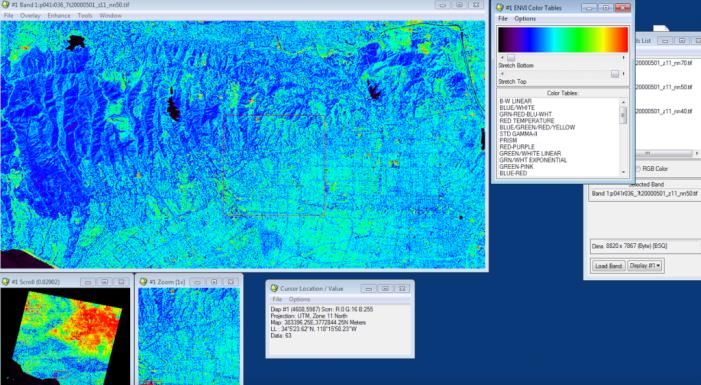
            structed                                  classification (Figure 4). The ability to obtain a cursor loca-
            Unpro-                                    tion/value in ENVI is something that does not seem possible
            cessed       15,                          in EE, with or without programming abilities (Figure 3). It
AST_        Instru-      30,                          would be nice to have some basic tools, and UI function in
L1A    1A   ment Data    90    No                     EE similar to those offered in the standalone platforms. Be-
                                    SRTM Digi-        low are some screenshots demonstrating or displaying the
AST1        Digital                 tal Elevation     comments mentioned above.
4DE         Elevation               Data Version
M      3    Model        30    No   4
                                                      D. ENVI vs EE

ISSN NO: XXXX-XXXX                             DEC. 2014                                               PAGE NO. 5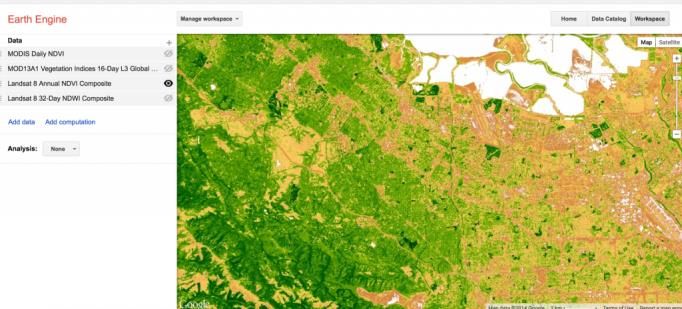
International Journal of Remote Sensing & Geoscience (IJRSG)

ENVI

                                                        Figure 4. Color Palette (without programming & Clouds)

Figure 1. Thermal (4,5,7) Band Selection-ENVI

                                                        Figure 5. Landsat 8 32-Day NDWI- Precomputed (EE)

Figure 2. Color Mapping with Color Tables ENVI

                                                       Figure 6. Landsat 8-Annual NDVI- Precomputed (EE)

Figure 3. Cursor Location/Value- ENVI

EE

                                                       Figure 7. Thermal Band Selection(4,5,7)- EE

                                                       Discussion

ISSN NO: XXXX-XXXX                               DEC. 2014                                             PAGE NO. 6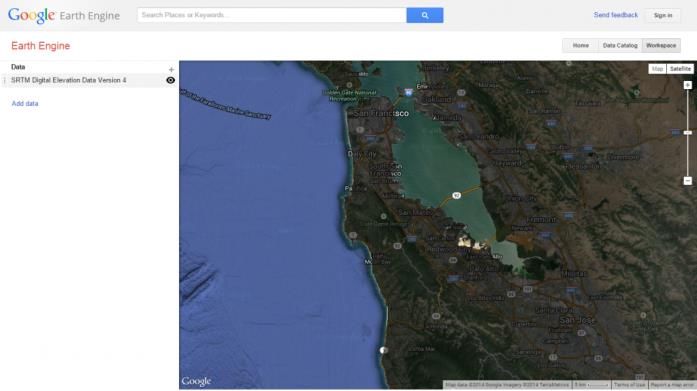
International Journal of Remote Sensing & Geoscience (IJRSG)

A. Data Catalog & Data Usage                                         image is processed you can can obtain an access link, where
                                                                     you copy the the EE ID (Step 2), and paste it into the search
   One of the benefits in using EE is the marriage between           bar of your EE workspace (Step 3). In theory this should
the data source and the analysis software. Unlike the tradi-         prompt the “Custom Assets” option as captured in step 3. In
tional desktop software model, EE allows the user to focus           our experience this has only worked intermittently. Assum-
on the analysis and not on acquiring data since the data has         ing it has worked, you may then manipulate the image you
been precomputed by Google for use on EE platform. A                 have uploaded.
quick search of “Night lights” will immediately show data
from NOAA’s DMSP. Moreover, some data have been fur-                   The pictures below below demonstrates the process of
ther computed for basic information. For example, a quick            uploading a satellite image into Maps Engine, where it is
search on “Landsat” will provide composites (8 days, 32              processed and then available to search In EE.
days, etc.), indices (NDVI, NDSI, EVI, etc.). It is additional-
ly useful that EE combines several temporal data into one
set–that is, a search for “Landsat 8 NDWI” will allow the
user to scrub through all available years that data is available
for.

   However, although EE makes a venerable attempt to sim-
plify the process of acquiring data, there are quirks that
make the process limiting. For example, some data sets are
searchable through the data catalog, but at the same time
cannot be added to the workspace (e.g. Landsat Global Land
Survey 1975). It is unclear why this is, and there is no way
to filter results. Moreover, while it’s good that EE combines
temporal data together, its lack of filtering makes finding the      Step 1
right set difficult. For example: there is no way to only look
for data between a date range, which must be possible since
EE does know which years as available.

B. Uploading Imagery
   One of biggest problems encountered while using EE was
attempting to upload our own imagery. In contrast to other
platforms EE is largely designed to be stand alone. Adding
an image is extremely cumbersome, and the current docu-
mentation can be misleading. For instance you might find             Step 1.5 (Wait for Processing)
contradictory information in the google tutorials about up-
loading images, as stated, “You may wonder about upload-
ing your own imagery to Google Earth Engine for analysis.
This feature is not yet completed, but we plan to offer the
ability to upload and analyze your own imagery in the future
[2].” However, if one takes a deeper look they will find that
you can infact upload external imagery, with a few caveats.

  Primarily, you are required to upload the imagery into
Google Maps Engine, another google platform, not into EE
directly (Step 1). Second, you can only upload one image at          Step 2- Copy Access Link
time, resulting in a very tedious process if you want to ex-
amine multiple bands in a given satellite. Once the image
has uploaded into Maps Engine you have to process the im-
age, which can take quite some time (Step 1.5). After the

ISSN NO: XXXX-XXXX                                         DEC. 2014                                                PAGE NO. 7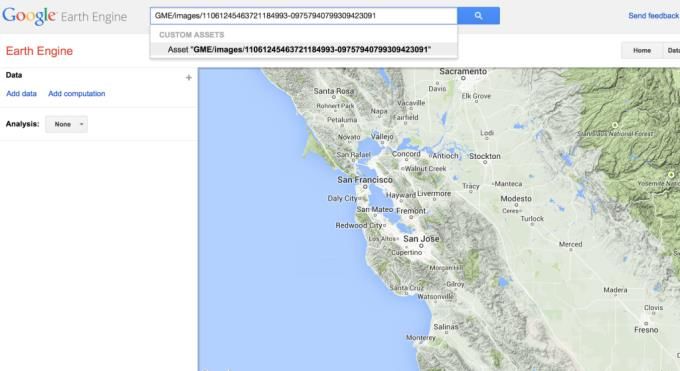
International Journal of Remote Sensing & Geoscience (IJRSG)

                                                                      with similar data. Utilization of this resource may provide
                                                                      boonful to researchers, having access to quicker data up-
                                                                      dates, as well as EE developers themselves since they no
                                                                      longer need to do the processing.

                                                                         It is interesting to compare EE with other remote sensing
                                                                      analysis solution which encourages integration of other plat-
                                                                      forms. As mentioned before, Exelis’ Service Engine prides
                                                                      itself in its ability to integrate different platforms. In fact, it
                                                                      provides no data of its own and depends on the user contrib-
                                                                      uting the data into its repository. Even better, with Jagwire,
                                                                      users are able to upload data live, on site. Moreover, Service
Step 3- Paste Access Link in EE Workspace                             Engine’s capability to connect via OGC and ESRI rest speci-
                                                                      fications, allows Service Engine to be used as part of a
                                                                      greater workflow.

                                                                        It is possible, however, that such capability highlights the
                                                                      fundamental difference between EE and other remote sens-
                                                                      ing softwares. Whereas Service Engine seems to be focused
                                                                      on on-demand analysis, e.g. UAV and military application,
                                                                      EE is aimed for large data crunching for research, which
                                                                      precludes time insensitivity, e.g. Forest deforestation, Global
                                                                      roadless Areas, etc.

                                                                         It behooves the writer to note some issues that may have
Step 4- Finally the image in EE!                                      compromise the data catalog summary and capability. Alt-
                                                                      hough we did our best to find data, EE’s search platform is
  Beyond the issues encountered with uploading imagery,               limited to some degree. Although VIIRS data may not seem
were classification discrepancies. This becomes problematic           to be available if we search “VIIRS,” it may be possible that
since, as shown previously in the results, some data sources          it has been combined with another data set. We hope that the
are not available. Somehow google has managed to thwart               EE team provides a solution and a more robust search solu-
their search functionality within the EE workspace either             tion that searches more than the title, but includes the meta-
intentionally    or    unintentionally.     Moreover,      real       data. To note: EE demonstrates how to calculate Tree Height
time/continuous data, such as NOAA’s GOES, is unavaila-               via LIDAR data. Despite this, searching for “LIDAR” in the
ble for quick retrieval. Thus EE is largely limited by what           data catalog will provide nothing. Looking at the program-
the team deems to be important; although they provide a ton           ming layer for this demonstration, we noticed a data set
of data already, and is often convenient, processing is ulti-         named “Simard_Pinto_3DGlobalVeg_JGR”. Searching for
mately limited due to the inextensibility of the platform.            this,results in nothing as well [8].

   Additionally, unlike most data repository for remote sens-         B. EE Workspace and Remote Sensing
ing, it is not possible to search availability by region of in-
terest. It is to note, that the availability of data may be a re-     Analysis
sult of the platform’s centralized computation paradigm–that
is, since EE stores all its data on Google’s servers than the         Presets
individual users, it may be prohibitive to have a copy of all
possible data.                                                           Currently EE provides several preprocessing of images
                                                                      such as simple indices (see results). Given that EE seems to
  Another data source that we wished EE would have em-                attempt to provide public access to remote sensing analysis
ployed is NASA and USGS’ Web-enabled landsat Data pro-                (e.g. the examples), it may be beneficial to provide addition-
jects (WELD), which provides preprocessed Landsat data                al algorithms to demonstrate the power of the platform to
which has spectral calibration coefficients, solar infor-             those new to the field or EE. We propose some general algo-
mation, reflectance, brightness and temperature, as well as           rithm that has been demonstrated in the field as starting
temporal alignment is another example of data we wished.              points. Since EE already has the ability to change band com-
[7] Such data set would fit perfectly into EE since EE deals          bination, it may be useful to create presets that can highlight

ISSN NO: XXXX-XXXX                                          DEC. 2014                                                      PAGE NO. 8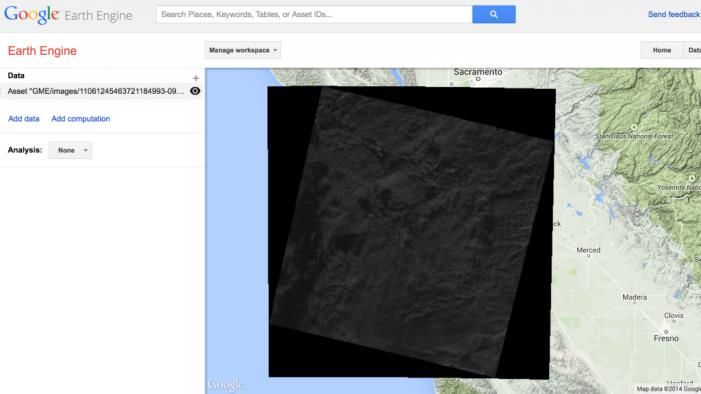
International Journal of Remote Sensing & Geoscience (IJRSG)

different water bodies, soil, vegetation, man-made materials,           EE currently has some advanced methods dealing with
and snow and ice as per common band combinations such as             time series data such as trend analysis (using covariate), and
the one given by Portland State University. In addition, other       cross correlation analysis (resulting in delta x, y and euclide-
classification system can be integrated beside band combina-         an distance difference [8]. We suggest that a basic change
tion, such as the Maximum Likelihood classification [9].             detection tool in the GUI can improve user experience. Their
Another great example of analysis that Google can develop            documentation currently suggests that change detection can
based on existing academic research is Whale Counting [9]            be done by toggling layer visibility. Although layer capabili-
[10] and building types [11]. Additionally, it may be inter-         ties is novel and other remote sensing application should
esting to compare Service Engine’s default preprocessing:            look to this feature, such feature is not a replacement for
find white planes, find red roofs, line of sight, and relative       change detection in comparing raster values. A simple im-
water depth, and look for avenues of possible improvements.          plementation of a tool that takes in two maps from the data
Blab la                                                              catalog and outputs a new map that calculate the difference
                                                                     in each pixel value may prove to be boonful to newcomers
   One of the benefits in using EE is the marriage between           and the general public not used to remote sensing analysis.
the data source and the analysis software. Unlike the tradi-         Such tool would take advantage of the fact that EE already
tional desktop software model, EE allows the user to focus           groups common data sets as well as aligning them together.
on the analysis and not on acquiring data since the data has
been precomputed by Google for use on EE platform. A                 Statistics
quick search of “Night lights” will immediately show data
from NOAA’s DMSP. Moreover, some data have been fur-                 Currently EE allows user to perform statistical analysis
ther computed for basic information. For example, a quick            through their programming layer, such as covariance, stand-
search on “Landsat” will provide composites (8 days, 32              ard deviation, min, max and so forth. However, such a tool is
days, etc.), indices (NDVI, NDSI, EVI, etc.). It is additional-      absent from the GUI layer, limiting its capability. It may be
ly useful that EE combines several temporal data into one            important to view data generated from EE in another format,
set–that is, a search for “Landsat 8 NDWI” will allow the            such as a graph. For example, in Exelis’ ENVI, users may
user to scrub through all available years that data is available     use a tool called “cursor location/values” which provide a
for.                                                                 graph of how values change within a map [9]. such graphical
                                                                     tool may provide information to the user.
Continual computation
                                                                     Mobile
   One of the biggest selling point for EE is its computation
capability. Recent advancement in remote sensing has al-                One of the primary benefit of cloud computing is that
lowed near real time imagery of the earth through different          computation is offloaded from the user’s device and thus a
sensors. “Today, commercial Earth observation satellites             thin client can be used for access. EE should exploit this
collect more than 4 million square kilometers of imagery             capability, allowing users to remote analysis in rural areas
daily, totaling petabytes every year “ [12]. Given that these        via mobile devices. Service Engine’s main feature points to
data are public, EE should allow for utilization of these con-       its ability to be accessible on the ground to provide real time
tinuous data feed, allowing near real time algorithmic analy-        information [5]. Since EE runs on the expansive Google
sis at the global level. Example data feed could be NOAA             network, EE should have no problem in creating a thin client
satellites: Suomi NPP (VIIRS) for weather, climate, ocean            version of EE. In doing so, EE will once again push the field
dynamic, volcanic eruption, forest fire, and global vegetation       by giving information to those traditionally without access to
analysis, GOES for severe weather, storm and hurricane               remote sensing, a goal which they seem to aim for and peo-
warning, DMSP for snow and ice cover, climate change and             ple applaud for in Global Forest Fire.
sea-level rise, cloud type, ocean surface temperatures and
currents, Jason-2 for oceanic depth and temperature, and             3D capability and Topography
DSCOVR for sun-lit face of the earth (not yet launched)
(NOAA). Such capability will be novel and could be                     Although EE can calculate elevation related operations,
groundbreaking for the industry at large.                            such as hillshadow and hillshade, it currently only has one
                                                                     way to view the data–top down. The capability of viewing
Change detection                                                     data within the three-dimensional scope is absent from the
                                                                     current EE GUI. For example: this function is referred to as
                                                                     “3D SurfaceView function” within the Exelis ENVI Classic

ISSN NO: XXXX-XXXX                                         DEC. 2014                                                  PAGE NO. 9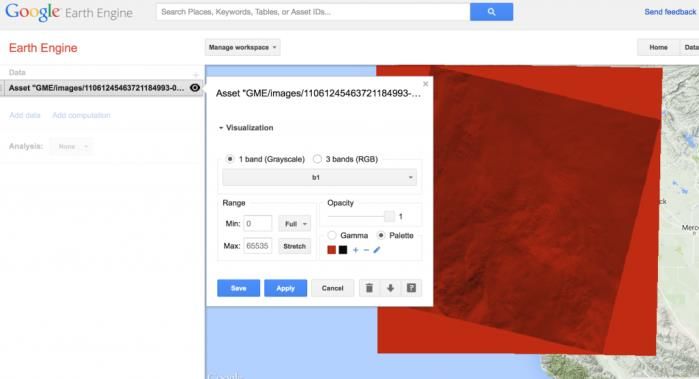
International Journal of Remote Sensing & Geoscience (IJRSG)

software user interface. Furthermore, although EE has the          12Q1     Cover              ly
ability to employ layers, because there is no 3D function                   Type
within it, it is impossible to view two layers simultaneously               Land
beside color layering. For example, when using the DEM,                     Cover
the user can not overlay data on top of it without obscuring       MCD      Dy-                Year-
DEM.                                                               12Q2     namics    500m     ly       No
                                                                            Leaf
                                                                            Area
                                                                            Index
                                                                   MCD      –                                  MCD12Q1-
                                                                   15A2     FPAR      1000m    8 day    No     3 LAI/fPAR
                                                                            Leaf
                                                                            Area
                                                                            Index
                                                                   MCD      –                                  MCD12Q1-
                                                                   15A3     FPAR      1000m    4 day    No     3 LAI/fPAR
                                                                            BRDF-
                                                                            Albedo
                                                                            Model
ASTER DEM ( ASTGDEMV2_0N37W123) + Landsat 5                                 Pa-
                                                                   MCD      rame-              16
                                                                   43A1     ters      500m     day      Yes
                                                                                                               BRDF-
                                                                                                               Albedo
                                                                                                               Model Pa-
                                                                            BRDF-                              rameters 16-
                                                                            Albedo                             Day L3
                                                                   MCD      Quali-             16              Global
                                                                   43A2     ty        500m     day      Yes    500m
                                                                   MCD                         16
                                                                   43A3     Albedo    500m     day      No
                                                                            Nadir
(LT50440342011117PAC01) using ENVI’s 3D surface                             BRDF-
view.                                                                       Ad-
                                                                            justed
                                                                   MCD      Reflec-            16
Appendix                                                           43A4     tance     500m     day      Yes
                                                                                                               BRDF-
Table 6. MODIS Data Products Availability in Google                         BRDF-                              Albedo
Earth Explorer                                                              Albedo                             Model Pa-
                                                                            Model                              rameters 16-
                              Tem-                                          Pa-                                Day L3
          MODI                poral    Avai                        MCD      rame-              16              Global
          S Data              Gran-    lable                       43B1     ters      1000m    day      No     500m
 Short    Prod-     Res       ulari-   in      Alternative                                                     MCD43A2
 Name     uct       (m)       ty       EE      in EE                                                           BRDF-
                                               MCD12Q1                      BRDF-                              Albedo
                                               Land Cover                   Albedo                             Quality 16-
          Land                                 Type Yearly         MCD      Quali-             16              Day Global
 MCD      Cover               Year-            Global              43B2     ty        1000m    day      No     500m
 12C1     Type      5600m     ly       No      500m                MCD                         16
 MCD      Land      500m      Year-    Yes                         43B3     Albedo    1000m    day      Yes

ISSN NO: XXXX-XXXX                                      DEC. 2014                                               PAGE NO.
10
International Journal of Remote Sensing & Geoscience (IJRSG)
MCD43A4 Sur-
Nadir BRDF- face
BRDF- Adjusted Reflec-
Ad- Reflectance tance
justed 16-Day MOD Bands
MCD Reflec- 16 Global 09GQ 1–2 250m Daily Yes
43B4 tance 1000m day No 500m Sur- MOD09GQ
BRDF- face Surface Re-
BRDF- Albedo Reflec- flectance
Albedo Model Pa- tance Daily L2G
Model rameters 16- MOD Bands Global
Pa- Day L3 09Q1 1–2 250m 8 day No 250m
MCD rame- 16 Global Land
43C1 ters 5600m day No 500m Sur-
BRDF- face
Albedo Tem-
Snow- pera-
free ture &
MCD Quali- 16 MOD Emis-
43C2 ty 5600m day No 11A1 sivity 1000m Daily Yes
MCD 16 Land
43C3 Albedo 5600m day No Sur-
MCD43A4 face
Nadir BRDF- Tem-
BRDF- Adjusted pera-
Ad- Reflectance ture &
justed 16-Day MOD Emis-
MCD Reflec- 16 Global 11A2 sivity 1000m 8 day Yes
43C4 tance 5600m day No 500m Land
Ther- Sur- MOD11A2
mal face Land Sur-
Anom- Tem- face Tem-
MCD alies & Mont pera- perature and
45A1 Fire 500m hly No N/A ture & Emissivity
Sur- MOD Emis- 8-Day Glob-
face 11B1 sivity 5600m Daily No al 1km
Reflec- Land
tance Sur- MOD11A2
MOD Bands face Land Sur-
09A1 1–7 500m 8 day Yes Tem- face Tem-
Sur- pera- perature and
face ture & Emissivity
Reflec- MOD Emis- 8-Day Glob-
MOD tance 11C1 sivity 5600m Daily No al 1km
09CM Bands Land
G 1–7 5600m Daily No Sur- MOD11A2
Sur- face Land Sur-
face Tem- face Tem-
Reflec- pera- perature and
tance ture & Emissivity
MOD Bands 500/10 MOD Emis- 8-Day Glob-
09GA 1–7 00m Daily Yes 11C2 sivity 5600m 8 day No al 1km
ISSN NO: XXXX-XXXX DEC. 2014 PAGE NO. 11International Journal of Remote Sensing & Geoscience (IJRSG)
Land 14A1 mal
Sur- MOD11A2 Anom-
face Land Sur- alies &
Tem- face Tem- Fire
pera- perature and Ther-
ture & Emissivity mal
MOD Emis- Mont 8-Day Glob- Anom-
11C3 sivity 5600m hly No al 1km MOD alies &
Land 14A2 Fire 1000m 8 day No N/A
Sur- MOD11A2 Leaf
face Land Sur- Area
Tem- face Tem- Index
pera- perature and MOD –
MOD ture & Emissivity 15A2 FPAR 1000m 8 day No N/A
11_L Emis- 8-Day Glob- Gross
2 sivity 1000m 5 min No al 1km Prima-
Vege- ry
MOD tation 16 MOD Produc
13A1 Indices 500m day Yes 17A2 tivity 1000m 8 day No N/A
MOD13A1 Net
Vegetation Prima-
Indices 16- ry
Vege- Day L3 MOD Produc Year- MCD12Q1-
MOD tation 16 Global 17A3 tivity 1000m ly No 4 NPP
13A2 Indices 1000m day No 500m Vege-
MOD13A1 tation
Vegetation Con-
Indices 16- MOD tinuous 96
Vege- Day L3 44A Cover 250m day No N/A
MOD tation Mont Global Vege-
13A3 Indices 1000m hly No 500m tation
MOD13A1 Con-
Vegetation MOD tinuous Year-
Indices 16- 44B Fields 250m ly Yes
Vege- Day L3 Land
MOD tation 16 Global Water
13C1 Indices 5600m day No 500m Mask
MOD13A1 MOD De-
Vegetation 44W rived 250m None Yes
Indices 16- Sur-
Vege- Day L3 face
MOD tation Mont Global Reflec-
13C2 Indices 5600m hly No 500m tance
Vege- MYD Bands
MOD tation 16 09A1 1–7 500m 8 day Yes
13Q1 Indices 250m day Yes Sur- MYD09GA
Ther- face Surface Re-
mal Reflec- flectance
Anom- MYD tance Daily L2G
MOD alies & 09CM Bands Global 1km
14 Fire 1000m 5 min No N/A G 1–7 5600m Daily No and 500m
MOD Ther- 1000m Daily No N/A MYD Sur- 500/10 Daily Yes
ISSN NO: XXXX-XXXX DEC. 2014 PAGE NO.
12International Journal of Remote Sensing & Geoscience (IJRSG)
09GA face 00m Tem- perature and
Reflec- pera- Emissivity
tance ture & Daily Global
Bands Emis- 1 km Grid
1–7 sivity SIN
Sur- Land MYD11A1
face Sur- Land Sur-
Reflec- face face Tem-
tance Tem- perature and
MYD Bands pera- Emissivity
09GQ 1–2 250m Daily Yes ture & Daily Global
Sur- MYD09GQ MYD Emis- Mont 1 km Grid
face Surface Re- 11C3 sivity 5600m hly No SIN
Reflec- flectance Land MYD11A1
tance Daily L2G Sur- Land Sur-
MYD Bands Global face face Tem-
09Q1 1–2 250m 8 day No 250m Tem- perature and
Land pera- Emissivity
Sur- MYD ture & Daily Global
face 11_L Emis- 1 km Grid
Tem- 2 sivity 1000m 5 min No SIN
pera- Vege-
ture & MYD tation 16
MYD Emis- 13A1 Indices 500m day Yes
11A1 sivity 1000m Daily Yes MYD13A1
Land Vegetation
Sur- Indices 16-
face Vege- Day L3
Tem- MYD tation 16 Global
pera- 13A2 Indices 1000m day No 500m
ture & MYD13A1
MYD Emis- Vegetation
11A2 sivity 1000m 8 day Yes Indices 16-
Land MYD11A1 Vege- Day L3
Sur- Land Sur- MYD tation Mont Global
face face Tem- 13A3 Indices 1000m hly No 500m
Tem- perature and MYD13A1
pera- Emissivity Vegetation
ture & Daily Global Indices 16-
MYD Emis- 1 km Grid Vege- Day L3
11B1 sivity 5600m Daily No SIN MYD tation 16 Global
Land MYD11A1 13C1 Indices 5600m day No 500m
Sur- Land Sur- MYD13A1
face face Tem- Vegetation
Tem- perature and Indices 16-
pera- Emissivity Vege- Day L3
ture & Daily Global MYD tation Mont Global
MYD Emis- 1 km Grid 13C2 Indices 5600m hly No 500m
11C1 sivity 5600m Daily No SIN Vege-
Land MYD11A1 MYD tation 16
MYD Sur- Land Sur- 13Q1 Indices 250m day Yes
11C2 face 5600m 8 day No face Tem- MYD Ther- 1000m 5 min No N/A
ISSN NO: XXXX-XXXX DEC. 2014 PAGE NO. 13International Journal of Remote Sensing & Geoscience (IJRSG)
14 mal [6] “Earth Engine Beta Signup,” Google Docs. [Online].
Anom- Available: https://docs.google.com/forms/d/17-
alies & LSoJQcBUGIwfplrBFLv0ULYhOahHJs2MwRF2Xkrc
Fire M/viewform. [Accessed: 18-Dec-2014].
Ther- [7] USGS, “Web-enabled Landsat data (WELD) Projects,”
mal USGS Landsat Missions. [Online]. Available:
Anom- http://landsat.usgs.gov/WELD.php. [Accessed: 18-Dec-
MYD alies & 2014].
14A1 Fire 1000m Daily No N/A [8] “Tutorial: Introduction to Classification in Google Earth
Ther- Engine – Google Docs.” [Online]. Available:
mal https://docs.google.com/document/d/1JWOi5nTteJ4Fz7
Anom- TaWyiXZTszyED4NijlR7cVcDvfpC8/edit#. [Accessed:
MYD alies & 19-Dec-2014].
14A2 Fire 1000m 8 day No N/A [9] “Esri – GIS Mapping Software, Solutions, Services, Map
Leaf Apps, and Data.” [Online]. Available:
Area http://www.esri.com/. [Accessed: 19-Dec-2014].
Index [10] P. T. Fretwell, I. J. Staniland, and J. Forcada, “Whales
MYD – MCD12Q1- from Space: Counting Southern Right Whales by Satel-
15A2 FPAR 1000m 8 day No 3 LAI/fPAR lite,” PLoS ONE, vol. 9, no. 2, p. e88655, Feb. 2014.
Gross [11] M. Belgiu, I. Tomljenovic, T. J. Lampoltshammer, T.
Prima- Blaschke, and B. Höfle, “Ontology-Based Classification
ry of Building Types Detected from Airborne Laser Scan-
MYD Produc ning Data,” Remote Sens., vol. 6, no. 2, pp. 1347–1366,
17A2 tivity 1000m 8 day No N/A Feb. 2014.
[12] “Demystifying CLOUD COMPUTING for Remote
Sensing Applications « Earth Imaging Journal: Remote
Acknowledgments Sensing, Satellite Images, Satellite Imagery.” .
[13] “MODIS Products Table | LP DAAC :: NASA Land
The authors are thankful to Dr. Thomas Gillespie and Data Products and Services.” [Online]. Available:
Chelsea Robinson for teaching UCLA Geography 169, Re- https://lpdaac.usgs.gov/products/modis_products_table.
mote Sensing, for which the present paper is written for. [Accessed: 19-Dec-2014].
[14] “MEaSUREs Products Table | LP DAAC :: NASA
References Land Data Products and Services.” [Online]. Available:
https://lpdaac.usgs.gov/products/measures_products_tab
le. [Accessed: 19-Dec-2014].
[1] “About Google.” [Online]. Available:
[15] “ASTER Products Table | LP DAAC :: NASA Land
http://www.google.com/about/. [Accessed: 18-Dec-
Data Products and Services.” [Online]. Available:
2014].
https://lpdaac.usgs.gov/products/aster_products_table.
[2] “Google Earth Engine.” [Online]. Available:
[Accessed: 19-Dec-2014].
https://earthengine.google.org/#intro. [Accessed: 18-
Dec-2014].
[3] N. Kshetri, “Cloud Computing in the Global South:
drivers, effects and policy measures,” Third World Q.,
vol. 32, no. 6, pp. 997–1014, Jul. 2011.
[4] E. Kintisch and A. Regalado, “Cancún Delegates See
the Trees Through a Forest of Hot Air,” Science, vol.
330, no. 6011, p. 1597, Dec. 2010.
[5] “dPlan Simplifies UAV Surveillance Mission Planning,”
Exelis VIS. [Online]. Available:
http://www.exelisvis.com/Home/NewsUpdates/TabId/1
70/ArtMID/735/ArticleID/14248/dPlan-Simplifies-
UAV-Surveillance-Mission-Planning.aspx. [Accessed:
18-Dec-2014].
ISSN NO: XXXX-XXXX DEC. 2014 PAGE NO.
14International Journal of Remote Sensing & Geoscience (IJRSG) ISSN NO: XXXX-XXXX DEC. 2014 PAGE NO. 15
You can also read


