Trends in Groundwater Levels in and near the Rosebud Indian Reservation, South Dakota, Water Years 1956-2017
←
→
Page content transcription
If your browser does not render page correctly, please read the page content below
Prepared in cooperation with the Rosebud Sioux Tribe

Trends in Groundwater Levels in and near the Rosebud Indian
Reservation, South Dakota, Water Years 1956–2017

Scientific Investigations Report 2020–5119

U.S. Department of the Interior
U.S. Geological Survey
Trends in Groundwater Levels in and near
the Rosebud Indian Reservation, South
Dakota, Water Years 1956–2017

By Kristen J. Valseth and Daniel G. Driscoll

Prepared in cooperation with the Rosebud Sioux Tribe

Scientific Investigations Report 2020–5119

U.S. Department of the Interior
U.S. Geological Survey
U.S. Department of the Interior DAVID BERNHARDT, Secretary U.S. Geological Survey James F. Reilly II, Director U.S. Geological Survey, Reston, Virginia: 2021 For more information on the USGS—the Federal source for science about the Earth, its natural and living resources, natural hazards, and the environment—visit https://www.usgs.gov or call 1–888–ASK–USGS. For an overview of USGS information products, including maps, imagery, and publications, visit https://store.usgs.gov/. Any use of trade, firm, or product names is for descriptive purposes only and does not imply endorsement by the U.S. Government. Although this information product, for the most part, is in the public domain, it also may contain copyrighted materials as noted in the text. Permission to reproduce copyrighted items must be secured from the copyright owner. Suggested citation: Valseth, K.J., and Driscoll, D.G., 2021, Trends in groundwater levels in and near the Rosebud Indian Reservation, South Dakota, water years 1956–2017: U.S. Geological Survey Scientific Investigations Report 2020–5119, 46 p., https://doi.org/10.3133/sir20205119. Associated data for this publication: U.S. Geological Survey, 2019, USGS water data for the Nation: U.S. Geological Survey National Water Information System database, https://doi.org/10.5066/F7P55KJN. ISSN 2328-0328 (online)
iii

Contents
Abstract�����������������������������������������������������������������������������������������������������������������������������������������������������������1
Introduction����������������������������������������������������������������������������������������������������������������������������������������������������2
     Purpose and Scope������������������������������������������������������������������������������������������������������������������������������2
     Description of Study Area�������������������������������������������������������������������������������������������������������������������2
Data Sources and Analytical Methods������������������������������������������������������������������������������������������������������6
     Data Sources�����������������������������������������������������������������������������������������������������������������������������������������6
           Climate Data���������������������������������������������������������������������������������������������������������������������������������6
           Water-Level Records�������������������������������������������������������������������������������������������������������������������6
           Licensed Groundwater Withdrawals�������������������������������������������������������������������������������������10
     Statistical and Analytical Methods��������������������������������������������������������������������������������������������������15
Analysis of Trends����������������������������������������������������������������������������������������������������������������������������������������17
     Climate Trends�������������������������������������������������������������������������������������������������������������������������������������18
     Groundwater Trends���������������������������������������������������������������������������������������������������������������������������26
Summary�������������������������������������������������������������������������������������������������������������������������������������������������������33
References Cited�����������������������������������������������������������������������������������������������������������������������������������������35
Appendix 1.....................................................................................................................................................37
Appendix 2.....................................................................................................................................................38

Figures
         1.     Map showing location of the study area and the Rosebud Indian Reservation in
                south-central South Dakota��������������������������������������������������������������������������������������������������������3
         2.     Graph showing relations among hydraulic head, bedrock hydrogeologic units,
                and topographic features in the study area�����������������������������������������������������������������������������5
         3.     Maps showing locations of licensed groundwater withdrawals within the study
                area, relative to locations of observations wells������������������������������������������������������������������11
         4.     Graph showing summary of licensed groundwater withdrawals over time for
                the study area������������������������������������������������������������������������������������������������������������������������������15
         5.     Example analysis that includes two graphs showing trends in measured
                groundwater levels and annual precipitation totals, and proximal groundwater
                withdrawals for South Dakota Department of Environment and Natural
                Resources observation well TD-76D���������������������������������������������������������������������������������������17
         6.     Maps showing spatial distribution of statistically significant trends in annual
                climate data within the study area, water years 1956–2017������������������������������������������������19
         7.     Maps showing spatial distribution of statistically significant trends in seasonal
                (October–December) climate data within the study area, water years 1956–2017���������20
         8.     Maps showing spatial distribution of statistically significant trends in seasonal
                (January–March) climate data within the study area, water years 1956–2017���������������21
         9.     Maps showing spatial distribution of statistically significant trends in seasonal
                (April–June) climate data within the study area, water years 1956–2017������������������������22
       10.      Maps showing spatial distribution of statistically significant trends in seasonal
                (July–September) climate data within the study area, water years 1956–2017���������������23
       11.      Graphs showing annual total precipitation and departures from mean for the
                study area, water years 1956–2017������������������������������������������������������������������������������������������24
iv
12. Annual total precipitation and departures from mean for the study area, water
years 1896–2017��������������������������������������������������������������������������������������������������������������������������25
13. Map showing wells completed in the Ogallala aquifer with statistically
significant trends for at least one water-level parameter���������������������������������������������������30
14. Graphs showing correlation analyses for 34 observation wells completed in the
Ogallala aquifer having statistically significant trends in at least one of three
water-level parameters considered����������������������������������������������������������������������������������������32
Tables
1. Summary of water use for calendar year 2015 for selected major categories for
South Dakota counties in the study area����������������������������������������������������������������������������������4
2. Selected site information for observation wells within the study area.............................. 7
3. Selected site and production information for licensed groundwater withdrawal
wells operated by Rosebud Sioux Tribe����������������������������������������������������������������������������������14
4. Results of trend analyses for annual total precipitation for the study area for
three time periods�����������������������������������������������������������������������������������������������������������������������26
5. Summary of results of trend analyses for water levels and annual total
precipitation at observation wells�������������������������������������������������������������������������������������������27
Conversion Factors
U.S. customary units to International System of Units
Multiply By To obtain
Length
inch (in.) 2.54 centimeter (cm)
inch (in.) 25.4 millimeter (mm)
foot (ft) 0.3048 meter
mile (mi) 1.609 kilometer (km)
Area
square mile (mi2) 2.590 square kilometer (km2)
Flow rate
cubic foot per second (ft3/s) 0.02832 cubic meter per second (m3/s)
gallon per minute (gal/min) 0.06309 liter per second (l/s)
million gallons per day (M/gal/d) 0.04381 cubic meter per second (m3/s)
million gallons per day (M/gal/d) 1.54723 cubic foot per second (ft3/s)
Temperature in degrees Fahrenheit (°F) may be converted to degrees Celsius (°C) as follows:
°C = (°F – 32) / 1.8.v Datum Vertical coordinate information is referenced to the National Geodetic Vertical Datum of 1929 (NGVD 29) unless otherwise specified. Horizontal coordinate information is referenced to the North American Datum of 1983 (NAD 83) unless otherwise specified. Altitude, as used in this report, refers to distance above the vertical datum. Supplemental Information Water year (WY) is the 12-month period, October 1 through September 30, and is designated by the calendar year in which it ends. Abbreviations LOESS locally estimated scatterplot smoothing NWIS National Water Information System p-value probability value PRISM Parameter-elevation Regressions on Independent Slopes Model RST Rosebud Sioux Tribe SDDENR South Dakota Department of Environment and Natural Resources STP short-term persistence τ tau from Kendall’s tau nonparametric test Tmax maximum air temperature Tmin minimum air temperature USGS U.S. Geological Survey WY water year
Trends in Groundwater Levels in and near the Rosebud
Indian Reservation, South Dakota, Water Years 1956–2017

By Kristen J. Valseth and Daniel G. Driscoll

                                                                   area. Statistically significant downward trends in Tmax were
Abstract                                                           detected for a very small part of the study area; however, the
                                                                   sparse spatial coverage reduces confidence that these are true
      The U.S. Geological Survey (USGS), in cooperation with       trends. Spatial distributions of statistically significant trends
the Rosebud Sioux Tribe, completed a study to characterize         in seasonal climate data were generally similar to the annual
water-level fluctuations in observation wells to examine           trends, but with substantial differences in the spatial density of
driving factors that affect water levels in and near the Rosebud   the trends.
Indian Reservation, which comprises all of Todd County.                  Groundwater trends for 58 observation wells were
The study investigates concerns regarding potential effects        analyzed for three separate water-level parameters (minimum,
of groundwater withdrawals and climate conditions on               median, and maximum) because wells are measured
groundwater levels within an area that includes Todd County        sporadically and data are biased towards more frequent
and a surrounding area that extends 10 miles north, east, and      measurements during periods of heaviest irrigation demand.
west of the county border. Characterization of water-level         Trends in the time series of annual precipitation (from PRISM)
fluctuations in observation wells and relative driving factors     starting 2 years earlier than for the associated water-level
was accomplished by statistical trend analysis.                    trend also were analyzed for the location of each individual
      Two statistical methods were used for analysis of            observation well. Sen’s slope and Mann-Kendall probability
temporal trends for climatic and hydrologic data. To determine     values (p-values) were computed for the three water-level
which trend analysis to use, applicable datasets were tested       parameters and for the annual precipitation time series.
for statistically significant short-term persistence (STP). In     Graphs showing results of trend analyses for each observation
the absence of significant STP, existence of statistical trends    well also showed changes over time in the sum of licensed
was determined using the standard Mann-Kendall test for            groundwater withdrawals within six specified radii (0.5, 1,
probability values less than or equal to 0.10 (90-percent          2, 3, 4, and 5 miles) of each well as a qualitative indicator of
confidence level); however, a modified Mann-Kendall test           proximal groundwater demand.
was used for datasets where statistically significant STP was            Of all 58 observation wells considered, 28 wells
detected. Trend magnitudes were computed using the Sen’s
                                                                   had significant upward trends for at least one of the three
slope estimator.                                                   water-level parameters, 11 wells had significant downward
      Monthly data from the Parameter-elevation Regressions        trends for at least one water-level parameter, and 19 wells did
on Independent Slopes Model (PRISM) were aggregated to             not have any significant trends. Significant upward trends in
obtain annual and seasonal datasets for total precipitation,       annual precipitation were detected for 48 of the 58 wells.
minimum air temperature (Tmin), and maximum air                          Results of trend analyses likely show the effects of
temperature (Tmax) for the study area and a surrounding buffer     groundwater withdrawals on water levels in the Ogallala
area. Trend tests for total precipitation, Tmin, and Tmax were     aquifer in areas of substantial demand. Precipitation trends
completed for annual and seasonal time series for water years      are significantly upward for 43 of the 48 wells completed in
1956–2017, which is about 2 years before the earliest available    the Ogallala aquifer that were analyzed. Of the 48 Ogallala
water-level measurements. A 2-year offset was arbitrarily          aquifer wells, 24 had significant upward trends for at least
selected because scrutiny of water-level and precipitation data    one water-level parameter (17 with all 3); however, 10 wells
indicated that responses of groundwater levels for many of         had statistically significant downward trends for at least one
the observation wells lagged major changes in precipitation        water-level parameter (8 with all 3 parameters). All but one of
patterns by about 2 years. Statistically significant upward        the wells with significant downward trends are located in the
trends were detected for annual precipitation and annual Tmin      south-central part of the study area where licensed irrigation
for almost all of the study area and the surrounding buffer        withdrawals are concentrated.
2 Trends in Groundwater Levels in and near the Rosebud Indian Reservation, South Dakota, Water Years 1956–2017
For the eight wells completed in the Arikaree aquifer, used to identify areas of concerning groundwater change that
three wells had significant upward trends for all three require further investigation and to identify areas with limited
water-level parameters. A single well that is completed data that could be enhanced with data collection tools, such as
in the Arikaree aquifer had significant downward trends real-time well recorders.
for all three water-level parameters. This well is located The State of South Dakota has jurisdiction for issuing
in the south-central part of the study area where licensed water rights for nontribal lands within and beyond the
groundwater withdrawal wells are concentrated and where reservation boundaries. The RST has water-rights jurisdiction
9 of the 10 Ogallala aquifer wells with statistically significant only for tribal lands within the reservation boundaries.
downward trends for at least one water-level parameter are
located. This well is in an area where the hydraulic head in the
Arikaree aquifer is artesian and generally similar to that of the Purpose and Scope
Ogallala aquifer. Thus, hydraulic head in the Arikaree aquifer
The purpose of this report is to describe trends in
may be affected by withdrawals from the Ogallala aquifer in
groundwater-level fluctuations in observation wells relative
this vicinity.
to selected driving factors that affect groundwater levels
For two wells completed in an alluvial aquifer, one
in and near the Rosebud Indian Reservation. The study
well had a significant upward trend for all three water-level
area includes Todd County and a surrounding area that
parameters and one well had no discernible trends.
extends 10 miles (mi) north, east, and west of Todd County.
Withdrawals from the Arikaree and alluvial aquifers generally
Driving factors considered that affect groundwater levels
are much smaller than from the Ogallala aquifer.
include climate conditions and groundwater withdrawals.
Temporal trends are analyzed for water-level records during
1957–2017 for 58 observation wells operated by the South
Introduction Dakota Department of Environment and Natural Resources
(SDDENR) or the RST and for selected climatic conditions.
The Rosebud Indian Reservation comprises all of Todd Groundwater withdrawals within 5 mi of each observation
County in south-central South Dakota (fig. 1). The primary well are qualitatively compared to water levels. Other factors
sources of groundwater for the Rosebud Indian Reservation that may affect water levels, such as groundwater interactions
are the Ogallala and Arikaree aquifers (saturated areas of the with surface water or ground cover, which can affect recharge,
Ogallala and Arikaree Formations, fig 1), which are part of were not considered. Development of quantitative relations
the High Plains aquifer system that extends as far south as among water levels and driving factors is beyond the scope of
Texas and is the most heavily utilized aquifer system in the the study; however, results of the study could inform future
United States (Weeks and others, 1988). Large-scale irrigation efforts to do so.
development from the High Plains aquifer system has
substantially decreased groundwater storage and reduced water
levels in several States (McGuire, 2011, 2017). In recent years, Description of Study Area
increasing commodity prices have driven the agricultural The study area (fig. 1) includes all of Todd County and
industry towards more intensive agricultural practices aimed a surrounding area that extends 10 mi north, east, and west
at increased crop production, which has potential to increase of Todd County. Agriculture is the primary land use within
irrigation demand. Increased water demand also has potential Todd County (Long and others, 2003), with most land used for
to reduce flow in streams and rivers with base flow sourced grazing or hay production for cattle ranching. Approximately
from the Ogallala and Arikaree aquifers (Long and others, 13 percent of land use is for crops, which include wheat,
2003; Long and Putnam, 2010; Davis and Putnam, 2013; sunflower seeds, corn, and soybeans (U.S. Department of
Davis and others, 2015). The Rosebud Sioux Tribe (RST) is Agriculture, 2017). Most of the cultivated crop land is in
especially concerned about potential effects of groundwater south-central Todd County, where there is extensive irrigation
withdrawals and climate conditions on water levels in from the Ogallala aquifer. Land use in South Dakota counties
the Ogallala and Arikaree aquifers, which are critical for adjacent to Todd County is generally similar; however, the
municipal, domestic, and agricultural water supplies within 2015 reported water use (Dieter and others, 2018) highlights
and near the reservation. To help address these concerns, the that the irrigated area and the total for all groundwater
U.S. Geological Survey (USGS), in cooperation with the RST, use in Todd County is larger than in any of the adjacent
completed a study to characterize water-level fluctuations in counties (table 1). More detailed descriptions of land use,
observation wells to examine driving factors that affect water physiography, and climate are available from Carter (1998),
levels in and near the Rosebud Indian Reservation, which Long and others (2003), Long and Putnam (2010), Davis and
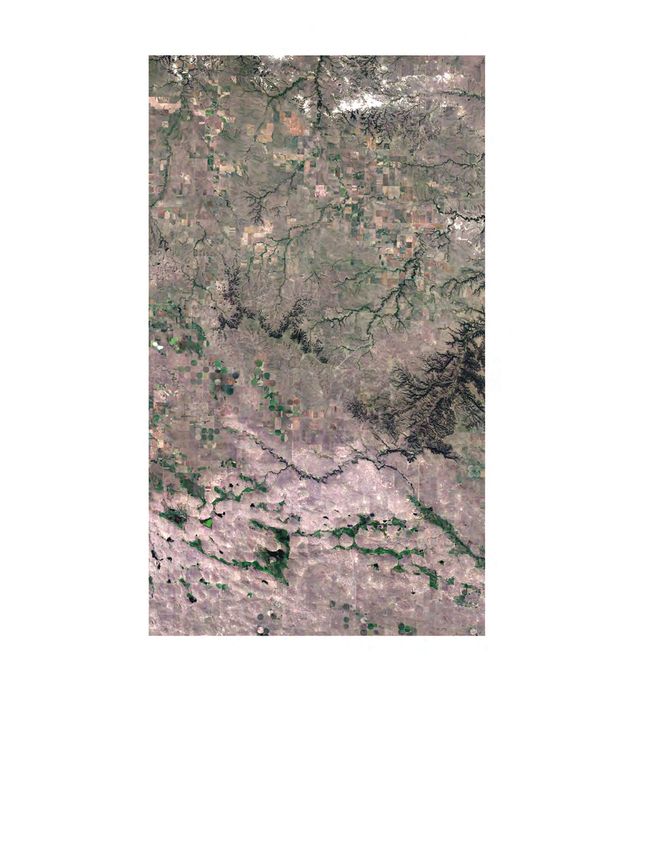
comprises all of Todd County. The results of this study can be Putnam (2013), and Davis and others (2015).Introduction 3
SD SOUTH DAKOTA
High Plains
aquifer system NE
KS
OK
Study area
TX
NEBRASKA
101°20' 101°10' 101°00' 100°50' 100°40' 100°30' 100°20' 100°10' 100°00'
43°30'
Qc
Tw Qt
Kp
S32
B MELLETTE
BS33 S18 COUNTY
B TODD Okreek
COUNTY
er
S17 "
B
Riv
BENNETT COUNTY
43°20' Parmelee
TRIPP COUNTY
Ta " Mission
"
To
B R1 Rosebud B
S1
Key
a B
S21
BR15
ite
S29 " S5 R25
B
Wh
R26 Pah
S28
BBBR14 BR27
R17 S15
a
43°10' B S6 S20 S12
R16 B B B
AB
R2 Saint
B Francis " BB B B Olsonville S2 A'
B B" R18
tle B B S8 B S11 B BS35
R13
S30 Lit
S16 S9 S7 B S14 B BR23 Riv
er
B B BB R12 S13
Qe
S19 BR6 S23B S10BR11 R19
B
S31 B S26 R7
B S22 B
B
R22
B BS25 S3B
R3
BS24
B R9 B S27 R20 S34
SOUTH DAKOTA R4 Qal B S4 B B
R21 B
43°00' B B
NEBRASKA
Base modified from South Dakota Geological Survey and Esri 0 5 10 MILES
Map image is the intellectual property of Esri and is used herein under
license. Copyright © 2020 Esri and its licensors. All rights reserved. 0 5 10 KILOMETERS
1:730,000-scale digital data, 2004
State Plane, South Dakota, South, FIPS 4002
North American Datum of 1983
EXPLANATION
Quaternary-age unconsolidated deposits— Tertiary-age sedimentary deposits— Study area boundary
Martin and others (2004) Martin and others (2004) A A' Line of section
Qal Alluvial deposits To Ogallala Formation Observation well in alluvial aquifer
B
Qc Colluvial deposits Ta Arikaree Formation B
Observation well in Arikaree aquifer
Qt Terrace deposits Tw White River Group B
Observation well in Ogallala aquifer
Qe Eolian deposits Cretaceous-age sedimentary deposits— S3 South Dakota Department of Environment and
Martin and others (2004) Natural Resources observation well identifier
Kp Pierre Shale R3 Rosebud Sioux Tribe observation well identifier
Figure 1. Location of the study area and the Rosebud Indian Reservation in south-central South Dakota.4 Trends in Groundwater Levels in and near the Rosebud Indian Reservation, South Dakota, Water Years 1956–2017
Table 1. Summary of water use for calendar year 2015 for selected major categories
for South Dakota counties in the study area.
[Water use data from Dieter and others (2018); GW, groundwater; SW, surface water; NR, not reported]
Total GW Irrigated areaa
GW Irrigation Irrigation Irrigation
County for all public (thousands of
livestock GW SW total
GW supply acres)
Water use, in millions of gallons per day
Bennett 8.90 0.00 0.30 8.60 0.00 8.60 9.04
Mellette 0.26 0.03 0.22 0.01 0.74 0.75 0.67
Todd 12.77 0.00 0.27 12.50 0.30 12.80 7.89
Tripp 1.94 0.49 0.71 0.74 1.56 2.30 1.60
Total 23.87 0.52 1.50 21.85 2.60 24.45 19.20
Water use, in cubic feet per second
Bennett 13.77 0.00 0.46 13.31 0.00 13.31 13.99
Mellette 0.40 0.05 0.34 0.02 1.15 1.16 1.04
Todd 19.76 0.00 0.42 19.34 0.46 19.81 12.21
Tripp 3.00 0.76 1.10 1.15 2.41 3.56 2.48
Total 36.94 0.80 2.32 33.81 4.02 37.84 29.71
aIrrigated area includes groundwater and surface-water sources.
Water resources of Mellette and Todd Counties were water source where the Ogallala and Arikaree aquifers are
described in detail by Carter (1998). Extensive descriptions of not present (Carter, 1998). The White River aquifer consists
the hydrogeology of Todd County and surrounding counties primarily of the saturated, poorly consolidated siltstones
were provided in conjunction with groundwater-flow models and claystones and interbedded sand layers within the
developed by several investigators (Long and others, 2003; Tertiary-age White River Group (fig. 1). A thick sequence
Long and Putnam, 2010; Davis and Putnam, 2013; Davis of Cretaceous-age formations (primarily shale deposits)
and others, 2015). The main rivers in Todd County are the that include the Pierre Shale (fig. 1) underlie the White
Little White River, which flows through Todd County from River Group.
southwest to northeast; and the Keya Paha River, which An example of the bedrock hydrogeology in Todd County
originates in Todd County and flows to the east (fig. 1). is shown in figure 2 (adapted from Long and Putnam, 2010),
Although the Ogallala and Arikaree aquifers are the which shows a hydrogeologic section for line of section A–A’
primary sources of groundwater in the study area, groundwater on figure 1 (alluvium, eolian deposits, and terrace deposits
also is obtained from several minor aquifers contained in are not shown on fig. 2). In most areas, the hydraulic head
unconsolidated deposits of Quaternary age that include (water-level altitude) in the Arikaree aquifer is above the
alluvium, eolian deposits, and terrace deposits (fig. 1). The top of the aquifer, which indicates an artesian (confined)
Ogallala aquifer comprises the saturated sandstones and silt of condition in which the water level in a well will rise above
the Tertiary-age Ogallala Formation and is present throughout the altitude at which the aquifer is penetrated. The Arikaree
the southern part of the study area (Long and others, 2003). aquifer is confined where overlain by impermeable materials
The Arikaree aquifer comprises the saturated sandstones in the Ogallala Formation, and the deeper part of the Arikaree
and siltstones of the Tertiary-age Arikaree Formation, which aquifer is under confined conditions where impermeable
underlies the Ogallala Formation, where present. The Arikaree material exists in the upper part of the Arikaree Formation
aquifer exists throughout all but the northeastern part of study (Carter, 1998). Hydraulic heads in the Ogallala and Arikaree
area (Long and others, 2003). The Ogallala and Arikaree aquifers are quite similar in many areas, but the hydraulic head
aquifers are included in the High Plains aquifer system that in the Arikaree aquifer is higher than that of the overlying
underlies parts of eight States and extends from southern Ogallala aquifer in most areas. Hydraulic heads in the Ogallala
South Dakota to Texas (fig. 1). The White River aquifer is and Arikaree aquifers are intercepted by the land surface in the
present throughout most of the study area and is used as a vicinity of several incised river or stream channels.WEST EAST
A A'
FEET FEET
3,200 3,200
Little White River
Altitude, in feet above the National Geodetic Vertical Datum of 1929 (NGVD 29)
3,000 3,000
2,800 2,800
Ogallala aquifer
2,600 2,600
Keya Paha River
Arikaree aquifer
2,400 2,400
2,200 2,200
White River Group
2,000 2,000
VERTICAL SCALE GREATLY EXAGGERATED 0 1 2 3 4 MILES Tops of hydrogeologic units modified from Carter (1998)
0 1 2 3 4 KILOMETERS
EXPLANATION
Average hydraulic head in Arikaree aquifer—Water years 1979–98
Average hydraulic head in Ogallala aquifer—Water years 1979–98
General direction of groundwater flow
Introduction 5
Figure 2. Relations among hydraulic head, bedrock hydrogeologic units, and topographic features in the study area (adapted from Long and Putnam, 2010).6 Trends in Groundwater Levels in and near the Rosebud Indian Reservation, South Dakota, Water Years 1956–2017
Climate conditions and groundwater withdrawals are precipitation, monthly means of daily Tmin, and monthly means
widely recognized as two primary factors that affect water of daily Tmax from weather stations to a 2.5-arc-minute grid
levels for any given aquifer. Climate conditions can affect for the conterminous United States. Monthly PRISM data for
groundwater levels primarily through changes in recharge total precipitation, Tmin, and Tmax were aggregated to obtain
conditions. Groundwater discharge from the Ogallala and datasets of annual total precipitation and annual means of
Arikaree aquifers provides substantial base flow to the Little Tmin and Tmax for the study area and a surrounding buffer area.
White River, Keya Paha River, and their tributaries in and near These gridded data were used to display spatial distributions
Todd County (Carter, 1998; Long and others, 2003; Long and of trends in climate data. The time-series data for annual
Putnam, 2010; Davis and Putnam, 2013; Davis and others, precipitation were used to further evaluate precipitation trends
2015). Thus, groundwater levels in these aquifers would for the study area.
decline naturally during prolonged periods of below-mean Monthly PRISM data were summed to annual total
recharge associated with prolonged drought conditions. precipitation for individual well locations for comparisons
Groundwater levels can rise somewhat quickly in response to to water-level records for all observation wells that were
large episodic recharge associated with periods of above-mean considered. Before summing, monthly precipitation for each
precipitation; however, declines in response to prolonged well was estimated by inverse weighting by distance to cell
below-mean precipitation typically are slower. Declining centers of the four closest cell centers of the 2.5-arc-minute
groundwater levels may be further affected by increased grid cell for each well location. PRISM data generally
groundwater withdrawals during dry periods. become progressively less reliable before about 1960 (Gibson
and others, 2002) because of decreasing density of source
data. This was not considered an issue, however, because
precipitation data before 1960 were used only minimally for
Data Sources and Analytical Methods comparisons with water-level records. PRISM data for total
precipitation dating back to 1895, which is the oldest extent of
Analyses primarily involved (1) temporal trends for available PRISM data (Gibson and others, 2002), were used to
measured water levels in observation wells and for estimated provide a perspective on long-term precipitation trends for the
precipitation at each observation well, and (2) qualitative study area.
consideration of effects of groundwater withdrawals on
groundwater levels. All datasets considered are compiled by
water year (WY), which is a 12-month period from October 1 Water-Level Records
through September 30 and is designated by the calendar year
in which it ends. Within this report, all references to years A primary dataset includes publicly available records
involving water-related data are for WYs, unless specifically of measured water levels for 35 observation wells (table 2)
noted as calendar years. monitored by the SDDENR (SDDENR, 2018) that are
within 5 mi of Todd County (fig. 1). The 5-mi buffer is
used to fill data gaps along the Todd County border and to
Data Sources evaluate potential effects of withdrawals near Todd County.
Consideration of observation wells in Nebraska was beyond
The primary data sources used in this report are estimated the scope of the study. Additional water-level records from
climate data from the Parameter-elevation Regressions on 23 observation wells in Todd County monitored by the RST
Independent Slopes Model (PRISM; Daly and others, 1994, also are included (fig. 1). All wells are assigned map numbers
2002, 2008) and records of water levels in observation wells in table 2 that identify the wells on figure 1. SDDENR wells
measured by the SDDENR or RST. Data regarding licensed generally follow a naming convention that identifies the
groundwater withdrawals in and near Todd County, including county, calendar year it was drilled, and a “sequential” letter.
tribal water-use and SDDENR water-rights information, For example, well TD-76D (map number S8, fig. 1) is the
were also considered. Licensed groundwater withdrawals fourth of 10 wells drilled in Todd County during calendar
are used throughout this report and are defined as permitted year 1976. The R in the sequential identifier, such as well
and licensed withdrawals by the SDDENR and estimated TD-57CR, indicates a “replacement” well that was drilled at
municipal and irrigation water use by the RST (SDDENR, the same location as the previous well. RST wells are labelled
2017, 2019). as “RST” followed by a sequential number indicating the
sequence of addition to their network. Water-level data for
the RST wells were provided to USGS by the RST and are
Climate Data
available through the USGS National Water Information
Climate data were estimated using total precipitation, System (NWIS) database (U.S. Geological Survey, 2019).
minimum air temperature (Tmin), and maximum air Additional well-completion information for SDDENR and
temperature (Tmax) outputs from PRISM (Daly and others, RST wells can be obtained from the USGS NWIS database
1994, 2002, 2008). PRISM interpolates monthly total using the site identification numbers that are provided
in table 2.Table 2. Selected site information for observation wells within the study area.
[USGS, U.S. Geological Survey; NGVD 29, National Geodetic Vertical Datum of 1929; M, month; D, day; YYYY, year; SDDENR, South Dakota Department of Environment and Natural Resources; NA, not
available]
Top of
Map Well depth casing First
Well USGS site
number Locationa Aquifer Date drilled (feet below elevation measurement date
number identification number
(fig. 1) land surface) (feet above (M/D/YYYY)
NGVD 29)
SDDENR wells in Todd (TD) County
S1 TD-57B 431516100281501 38N27W24CCBC Alluvial 1/1/1957 18.0 2,428 7/1/1958
S2 TD-57CR 431505100140001 37N25W23ADDA Alluvial 8/9/1957 62.0 2,299 9/12/1957
S3 TD-59A 430148100471001 35N29W07BBBB Ogallala 10/5/1959 82.0 2,903 11/22/1959
S4 TD-59BR 425958100445301 35N29W20AADD Ogallala 11/3/1959 105.0 2,892 11/21/1960
S5 TD-76A 431109100445901 37N29W16AAAA Ogallala 11/30/1976 185.0 2,857 12/2/1976
S6 TD-76B 430924100460601 37N29W29AAAA Ogallala 12/2/1976 205.0 2,860 1/18/1977
S7 TD-76C 430748100455601 37N29W33CCCC Ogallala 11/4/1976 205.0 2,909 1/18/1977
S8 TD-76D 430840100445601 37N29W28DDDD Ogallala 11/3/1976 195.0 2,858 1/18/1977
S9 TD-76E 430610100481701 36N30W13BBBB Ogallala 12/6/1976 225.0 2,916 1/18/1977
S10 TD-76F 430609100434201 36N29W16AAAA Ogallala 12/8/1976 225.0 2,862 1/18/1977
S11 TD-76G 430842100411301 37N28W30CCCB Ogallala 12/9/1976 185.0 2,770 1/18/1977
S12 TD-76H 430932100390001 37N28W21CCCC Ogallala 12/9/1976 165.0 2,772 1/18/1977
S13 TD-76I 430839100373801 37N28W27CCCC Ogallala 12/10/1976 185.0 2,805 1/18/1977
S14 TD-76J 430701100363001 36N28W10BBBB Ogallala 12/10/1976 185.0 2,823 1/18/1977
S15 TD-79A 431020100243501 37N26W16CCBB Ogallalab 10/12/1979 25.0 2,530 5/6/1980
S16 TD-79B 430613101561701 36N31W14BAAA Ogallala 10/16/1979 160.0 2,980 11/17/1980
Data Sources and Analytical Methods 7
S17 TD-79D 432044101115201 39N33W15DDDD Arikaree 10/18/1979 360.0 2,800 5/19/1981
S18 TD-80A 432310101045501 39N32W03AAAA Arikaree 9/23/1980 125.0 2,610 2/18/1981
S19 TD-80B 430340101012301 36N32W25DDDD Ogallala 9/23/1980 125.0 2,841 2/18/1981
S20 TD-80C 430959100444001 37N29W22CCCC Arikaree 9/24/1980 265.0 2,881 2/18/1981
S21 TD-80D 431430100195901 38N25W30BBBB Arikaree 9/25/1980 142.7 2,484 4/21/1981
S22 TD-80E 430310100245501 36N26W31DDAA Ogallala 9/25/1980 121.5 2,620 2/18/1981
S23 TD-90A 430604100445401 36N29W17AADD Ogallala 7/10/1990 245.0 2,890 6/16/1992
S24 TD-90B 430226100445201 35N29W04BCCB Arikaree 7/17/1990 115.0 2,845 6/16/1992
S25 TD-#05c 430159100531001 35N30W06DDDD Ogallala Unknown 84.5 2,853 11/13/1984
S26 TD-#08c 430258100471401 36N30W36DDDD Ogallala Unknown 123.0 2,885 11/13/1984
S27 TD-#10c 430154100411801 35N29W02DDDD Ogallala Unknown 44.4 2,800 11/13/1984Table 2. Selected site information for observation wells within the study area.—Continued
8 Trends in Groundwater Levels in and near the Rosebud Indian Reservation, South Dakota, Water Years 1956–2017
[USGS, U.S. Geological Survey; NGVD 29, National Geodetic Vertical Datum of 1929; M, month; D, day; YYYY, year; SDDENR, South Dakota Department of Environment and Natural Resources; NA, not
available]
Top of
Map Well depth casing First
Well USGS site
number Locationa Aquifer Date drilled (feet below elevation measurement date
number identification number
(fig. 1) land surface) (feet above (M/D/YYYY)
NGVD 29)
SDDENR wells in Bennett (BT) County
S28 BT-76C 431018101152001 37N33W17CCCC Ogallala 11/4/1976 185.0 2,998 11/28/1976
S29 BT-78KR 431250101163701 37N34W01AAAA Ogallala 10/12/2004 259.5 3,115 11/1/1978
S30 BT-80E 430825101151801 37N33W32BBBB Ogallala 9/18/1980 145.0 2,955 2/19/1981
S31 BT-80F NA 36N33W31CCCD Ogallala 9/19/1980 205.0 3,067 4/19/1981
SDDENR wells in Mellette (MT) County
S32 MT-78A 432554101065601 40N32W21BBBB Arikaree 10/3/1978 160.0 2,576 11/1/1978
S33 MT-78B 432411101080701 40N32W32BBBB Arikaree 10/3/1978 260.0 2,640 7/10/1979
South Dakota Department of Environment and Natural Resources wells in Tripp (TR) County
S34 TR-78E 430133100061501 95N78W20CCCC Ogallala 5/4/1978 105.0 2,430 6/19/1978
S35 TR-99A 430813100100001 96N79W14BBCB Arikaree 5/20/1997 49.0 2,240 2/17/1999
Rosebud Sioux Tribe wells
R1 RST 1 431403101020601 38N31W30CBD Ogallala Unknown Unknown 2,970 1/15/1987
R2 RST 2 430726101033501 36N32W02BAA Ogallala Unknown 80.5 2,682 2/15/2000
R3 RST 3 430309100570901 36N31W34DBB Ogallala Unknown 91.0 2,920 1/15/1987
R4 RST 4 430017100595101 35N31W17CDC Ogallala Unknown 62.0 2,896 1/15/1987
R6 RST 6 430501100504901 36N30W21ADD Ogallala Unknown 137.0 2,888 1/15/1987
R7 RST 7 430415100451401 36N29W29ACA Ogallala Unknown 133.5 2,870 1/15/1987
R9 RST 9 430100100460501 35N29W18AAA Ogallala Unknown 83.8 2,870 1/15/1987
R11 RST 11 430530100422501 36N29W14CDD Ogallala Unknown 212.0 2,893 1/15/1987
R12 RST 12 430712100421301 36N29W02CDD Ogallala Unknown 200.0 2,850 1/15/1987
R13 RST 13 430755100582301 37N29W31CCB Ogallala Unknown 275.0 2,921 1/15/1987
R14 RST 14 431116100422001 37N29W12CCD Ogallala Unknown Unknown 2,810 7/1/1986
R15 RST 15 431342100344101 38N28W36ABD Ogallala Unknown 73.0 2,620 1/15/1987
R16 RST 16 430820100371401 37N28W34BDA Ogallala Unknown 171.0 2,783 1/15/1987
R17 RST 17 431027100333001 37N27W18DCC Ogallala Unknown 53.0 2,609 1/15/1987
R18 RST 18 430702100330501 36N28W12AAA Ogallala Unknown 215.0 2,806 1/15/1987
R19 RST 19 430243100371701 36N28W33BDD Ogallala Unknown 74.8 2,753 6/15/1999Table 2. Selected site information for observation wells within the study area.—Continued
[USGS, U.S. Geological Survey; NGVD 29, National Geodetic Vertical Datum of 1929; M, month; D, day; YYYY, year; SDDENR, South Dakota Department of Environment and Natural Resources; NA, not
available]
Top of
Map Well depth casing First
Well USGS site
number Locationa Aquifer Date drilled (feet below elevation measurement date
number identification number
(fig. 1) land surface) (feet above (M/D/YYYY)
NGVD 29)
Rosebud Sioux Tribe wells—Continued
R20 RST 20 430122100344501 35N28W11DBB Ogallala Unknown 94.1 2,728 1/15/1987
R21 RST 21 430057100275401 35N27W14BAB Ogallala Unknown 84.2 2,690 1/15/1987
R22 RST 22 430335100241401 36N26W32BAA Ogallala Unknown 78.4 2,619 1/15/1987
R23 RST 23 430728100135801 36N27W01ACC Ogallala Unknown 58.1 2,627 1/15/1987
R25 RST 25 431428100192701 38N25W30BBC Ogallala Unknown 145.4 2,499 1/15/1987
R26 RST 26 431158100461002 37N29W08ADB Ogallala Unknown 263.0 2,826 1/15/1987
R27 RST 27 431127100532801 37N30W09DDB Ogallala Unknown 150.0 2,880 1/15/1987
aThe well location consists of the township number, followed by “N,” the range number followed by “W,” and the section number followed by a maximum of four uppercase letters that indicate, respectively,
the 160-, 40-, 10-, and 2 1/2-acre tract in which the well is located. These letters are assigned in a counterclockwise direction beginning with “A” in the northeast quarter
bOriginally completed in the Arikaree aquifer at a depth of 137 feet; however, considered an Ogallala aquifer well after the casing broke at a depth of 28 feet.
cWellsTD-#05, TD-#08, and TD-#10 have also been monitored by the Rosebud Sioux Tribe as wells RST 5, RST 8, and RST 10, respectively. However, the SDDENR records are more complete; thus, only
the SDDENR records are considered in this report.
Data Sources and Analytical Methods 910 Trends in Groundwater Levels in and near the Rosebud Indian Reservation, South Dakota, Water Years 1956–2017
SDDENR wells TD-#05, TD-#08, and TD-#10 are owned original permitted rates and usually are somewhat smaller than
by RST and have been monitored by RST and SDDENR. permitted rates. Thus, licensed withdrawal rates were used for
However, the SDDENR records are more complete; thus, only estimation of groundwater withdrawal rates, except for cases
the SDDENR records are considered in this report. where licensing has not yet been completed, which required
The oldest records for SDDENR wells date back to use of permitted withdrawal rates.
September 12, 1957, for TD-57CR; however, only four wells True “starting” dates for permitted or licensed
have records that start before calendar year 1976 (table 2). withdrawals cannot be precisely determined from the
Records for all RST wells date back to January 15, 1987, SDDENR database (SDDENR, 2017) for several reasons. A
with only three exceptions (table 2). The SDDENR and “priority” date for each permitted water right is established
RST datasets consist of sporadic (more or less monthly) by the filing date of each water-right application, and in some
measurements of water levels made primarily during or cases, withdrawals may begin within a year or less of the
near months of typical irrigation demand, with minimal priority date. In other cases, withdrawals may not begin for
measurements during nonirrigation months. Water-level 5 years or more and only slightly in advance of the licensing
records are biased towards more frequent measurements date. Another factor is that some of the licensed groundwater
during irrigation periods; thus, to add perspective, trends in withdrawals in the study area substantially predate South
water levels were analyzed as three annual datasets (minimum, Dakota’s current permitting/licensing system, and in some
median, and maximum water level) for each observation well cases priority dates precede license dates by one or more
(hereafter referred to as “water-level parameters”). decades. Thus, priority dates were used as the starting dates
for estimation of groundwater withdrawals.
Licensed groundwater withdrawals for “center-pivot”
Licensed Groundwater Withdrawals irrigation systems are the primary sources of groundwater
Licensed groundwater withdrawals primarily include demand in the study area. Pumping rates of about 1 to 2 cubic
withdrawals for irrigation and municipal use and exclude feet per second (ft3/s) or about 450 to 900 gallons per minute
minor withdrawals for uses such as domestic and stock-water are typical (SDDENR, 2017) for center-pivot systems that
supplies, as described further within this section. The USGS typically irrigate a circular area within a “quarter-section”
NWIS database (U.S. Geological Survey, 2019) lists a total of of land (one-fourth of a square mile). In some cases, a
2,177 groundwater withdrawal points (wells) in Todd County center-pivot system may be served by a single well; however,
as of March 28, 2019. However, only licensed groundwater in many cases, two or more wells may be needed to produce
withdrawals are used in this report for accumulating estimates sufficient water. The SDDENR database (SDDENR, 2017)
of withdrawals within specified radii of each observation well. provides individual well locations when multiple wells are
Locations of licensed groundwater withdrawals in used to serve a single irrigation system; however, details
the study area are shown in figure 3, which splits the study regarding production rates for individual wells are not
area into three sections and provides sufficient resolution necessarily readily available. Thus, for cases of multiple well
to identify locations of licensed groundwater withdrawals, locations associated with a single water-right permit or license,
relative to locations of observation wells. Circles with radii an assumption of equal production from each well is used for
of 0.5 and 1.0 mi are plotted around each observation well to the qualitative assessments that are performed.
provide a perspective on the number of licensed groundwater Selected site and production information for 8 irrigation
withdrawals within those radii of each observation well. wells and 11 municipal wells that are operated by the RST
Water rights are issued by the State of South Dakota but are not under the jurisdiction of South Dakota water-right
and RST within and beyond Todd County. Locations of licensing because of tribal sovereignty, is provided in
State-permitted/licensed groundwater withdrawals and records table 3. Locations of those wells are included in figure 3;
of (maximum allowable) groundwater usage were obtained however, locations are not distinguished from locations of
from the SDDENR (2017) for consideration in qualitative nontribal wells.
assessments of potential effects of withdrawals on water-level The State of South Dakota does not require permitting/
records for observation wells. The issuance of a groundwater licensing for small-scale groundwater withdrawals of less than
right by SDDENR is a two-step process that consists of initial 25 gallons per minute (0.06 ft3/s) in most instances (SDDENR,
issuance of a water-right permit that is followed by issuance of 2019). No attempt was made to account for groundwater
a water-right license after a required inspection is performed withdrawals not reported by the SDDENR or RST. No attempt
(SDDENR, 2019). A 5-year period is allowed for development was made to account for withdrawals in nearby parts of
of water-use infrastructure before the inspection is required. In Nebraska, because there are very few center-pivot irrigation
most cases, inspections are performed and licenses are issued systems or other sources of groundwater demand in Nebraska
before the 5-year period has elapsed; however, inspections within 5 mi of any of the observation wells considered. An
and licensing can extend beyond 5 years. Licensed (maximum arbitrary maximum distance of 5 mi is used for accumulation
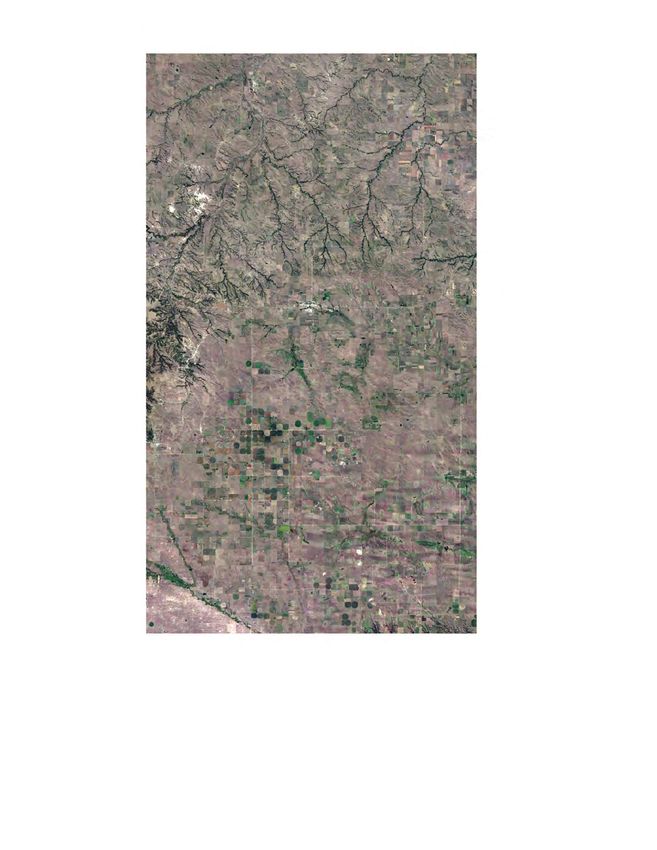
allowable) withdrawal rates are not necessarily identical to the of estimated groundwater withdrawal rates.Data Sources and Analytical Methods 11
A 101°20' 101°10'
MELETTE COUNTY
TRIPP COUNTY
BENNETT
COUNTY
TODD COUNTY
SOUTH DAKOTA
43°30'0"N
43°30'
NEBRASKA
S32
B EXPLANATION
!
MELETTE
! S33 Map extent
COUNTY
B S18
B 1-mile radius
S17
0.5-mile radius
43°20'
B
Study area boundary
BENNETT
COUNTY
COUNTY
Licensed groundwater withdrawal well
TODD
!
B Observation well in Arikaree aquifer
B Observation well in Ogallala aquifer
S17 South Dakota Department of Environment
! R1 and Natural Resources observation
S29 B well identifer
!! !
!!
! !! !! ! B R3 Rosebud Sioux Tribe observation
!
! !!!!
! !! ! well identifier
!!
!!
! ! S28
!
43°10' !!B
! !
! !! ! R2
!!
B B
! !
!!!
! S30
S16
B
!!
!
!!
! S19
! S31
B
!
R3 !
!
!
B
B
R4
SOUTH DAKOTA
43°00' !
B
NEBRASKA
Base modified from U.S. Geological Survey digital data 0 2.5 5 MILES
Base map data from Google, 2016
1:2,500,000-scale digital data 0 2.5 5 KILOMETERS
State Plane, South Dakota, South, FIPS 4002
North American Datum of 1983
Figure 3. Locations of licensed groundwater withdrawals within the study area, relative to locations of observations wells. A, Licensed
groundwater withdrawals in western part of study area. B, Licensed groundwater withdrawals in central part of study area. C, Licensed
groundwater withdrawals in eastern part of study area.12 Trends in Groundwater Levels in and near the Rosebud Indian Reservation, South Dakota, Water Years 1956–2017
B 100°50' 100°40' 100°30'
MELETTE COUNTY
TRIPP COUNTY
BENNETT
COUNTY
TODD COUNTY
SOUTH DAKOTA
NEBRASKA
43°30'
EXPLANATION
Map extent
MELETTE
COUNTY 1-mile radius
TODD
COUNTY 0.5-mile radius
Study area boundary
43°20' ! Licensed groundwater withdrawal well
B Observation well in alluvial aquifer
B Observation well in Arikaree aquifer
B Observation well in Ogallala aquifer
S1
S3 South Dakota Department of Environment
! R15 B and Natural Resources observation
!
! well identifer—Asterisk indicates
!
! ! B example of well analysis that can
!
! ! S5 be seen on figure 5
! !
R27 !
B R14
Rosebud Sioux Tribe observation
B R26 !
BB R17 S15 R6
well identifier
43°10' S6
! ! ! ! ! S20 !
!
!!
!
! S11
!
! ! S12
!!
B B
!! ! !
!BB
!! ! ! !
! !!! ! !!!
! ! ! B! S13
R16
!
R13
! !!! !B ! B ! BB
!! ! ! ! R23
B B
!! ! !! !! !!
!
!! S8* !
R12
!
!!!
!
S14 R18
B
!
! !
!
S9 ! ! !! !!!
S7 !!
! ! B
!! !!
! B
!
B
! !!
!
B ! BB R11
!!
R6
! S23
!!
! !!!!! ! B
B ! ! !! !
R22
! B!
! S10 R19
BB
S26 R7
!
!
!
S25
!!!
B S24 S27
B
B R20 S22
B B B R21
S3 B S4
B B
! SOUTH DAKOTA
43°00' R9
B !
!!
NEBRASKA
Base modified from U.S. Geological Survey digital data 0 2.5 5 MILES
Base map data from Google, 2016
1:2,500,000-scale digital data 0 2.5 5 KILOMETERS
State Plane, South Dakota, South, FIPS 4002
North American Datum of 1983
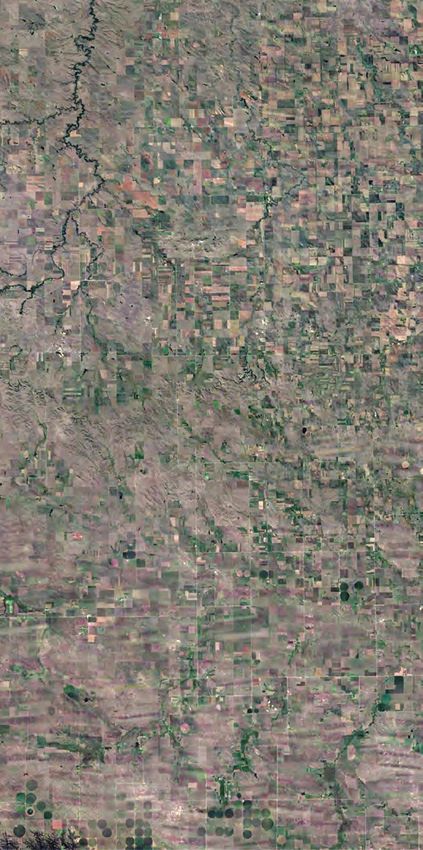
Figure 3. —ContinuedData Sources and Analytical Methods 13
C 100°20' 100°10'
MELETTE COUNTY
TRIPP COUNTY
BENNETT
COUNTY
TODD COUNTY
SOUTH DAKOTA
NEBRASKA
43°30'
!
EXPLANATION
Map extent
MELETTE 1-mile radius
COUNTY
COUNTY
COUNTY
0.5-mile radius
TRIPP
TODD
Study area boundary
43°20' ! Licensed groundwater withdrawal well
B Observation well in alluvial aquifer
B Observation well in Arikaree aquifer
!
B Observation well in Ogallala aquifer
!
S2 South Dakota Department of Environment
S21
and Natural Resources observation
B well identifer
R25
R25 Rosebud Sioux Tribe observation
well identifier
S2
43°10' B
S35
B !
S34
B
!!
!
43°00'
SOUTH DAKOTA
NEBRASKA
Base modified from U.S. Geological Survey digital data 0 2.5 5 MILES
Base map data from Google, 2016
1:2,500,000-scale digital data 0 2.5 5 KILOMETERS
State Plane, South Dakota, South, FIPS 4002
North American Datum of 1983
Figure 3. —ContinuedTable 3. Selected site and production information for licensed groundwater withdrawal wells operated by Rosebud Sioux Tribe.
14 Trends in Groundwater Levels in and near the Rosebud Indian Reservation, South Dakota, Water Years 1956–2017
[M, month; D, day; YYYY, year; gal/min, gallon per minute; ft3/s, cubic feet per second; Withheld, latitude and longitude withheld for security purposes]
Estimated
Tested Estimated mean Estimated mean
Date drilled start date for
Well name Latitude Longitude Depth production rate production rate production rate
(M/D/YYYY) withdrawals
(gal/min) (gal/min) (ft3/s)
(M/D/YYYY)
Irrigation wells
Irrigation-5 43.22694 −100.752 8/7/1984 1/1/1985 Unknown 420 420 0.936
Irrigation-6 43.21861 −100.754 8/8/1984 1/1/1985 Unknown 550 550 1.225
Irrigation-7 43.2125 −100.753 8/8/1984 1/1/1985 Unknown 370 370 0.824
Irrigation-15 43.13389 −100.783 7/24/1984 1/1/1985 Unknown 650 650 1.448
Irrigation-16 43.1325 −100.776 7/23/1984 1/1/1985 Unknown 450 450 1.003
Irrigation-17 43.10778 −100.781 8/1/1984 1/1/1985 Unknown 500 500 1.114
Irrigation-18 43.1075 −100.773 8/2/1984 1/1/1985 Unknown 550 550 1.225
Irrigation-23 43.07083 −100.754 8/9/1984 1/1/1985 Unknown 200 200 0.446
Municipal wells
Rosebud 84-1 Withheld Withheld Unknown 1/1/1984 Unknown Unknown 200 0.446
Rosebud 84-2 Withheld Withheld 1984 1/1/1984 Unknown Unknown 200 0.446
Rosebud 84-3 Withheld Withheld 1984 1/1/1984 Unknown Unknown 200 0.446
Rosebud 98-1 Withheld Withheld 7/8/1998 1/1/1999 262.8 300 200 0.446
Rosebud 98-2 Withheld Withheld 6/29/1998 1/1/1999 210.1 450 300 0.668
Saint Francis 90-1 Withheld Withheld 1989 1/1/1990 Unknown 150 100 0.223
Casino 94-1 Withheld Withheld 7/8/1994 1/1/1995 185.0 30 20 0.045
Casino 94-2 Withheld Withheld 7/22/1994 1/1/1995 165.0 55 40 0.089
Casino 98-1 Withheld Withheld 5/2/1998 1/1/1999 134.5 Unknown 30 0.067
Casino 03-1 Withheld Withheld 9/25/2003 1/1/2004 138.0 40 30 0.067
Casino 03-2 Withheld Withheld 9/30/2003 1/1/2004 140.0 50 30 0.067Data Sources and Analytical Methods 15
A summary of estimated licensed groundwater Some of the statistical analyses involve determination
withdrawals over time throughout study area is shown in of trend magnitude, or the mean change over time for an
figure 4 and shows (1) minimal withdrawals before 1975, analysis period. Trend magnitudes are computed using the
(2) sudden increases in withdrawals between about 1975–78 Sen’s slope estimator (Sen, 1968) using the modifiedmk R
and 1984–86, (3) somewhat minor increases during about package developed by Patakamuri (2018). Sen’s slope, also
1986–2005, and (4) somewhat slow but steady increases since referred to as the Kendall-Theil robust line (Helsel and others,
about 2005. By the end of WY 2017, cumulative licensed 2020), is a nonparametric estimator of trend magnitude per
groundwater withdrawals throughout the study area totaled time interval (slope) for a univariate time series when the time
about 195 ft3/s. Cumulative licensed groundwater withdrawals interval is constant (equally spaced). For use in correlations,
are defined throughout this report as the sum of licensed a time-weighted trend magnitude also is calculated for the
groundwater withdrawals from 1958 to 2017 and include the water-level data with at least one statistically significant
total withdrawals from the Arikaree and Ogallala aquifers. water-level parameter by multiplying the annual median Sen’s
Actual cumulative withdrawal rates (table 1), reported by slope value by the number of years in the period of record for
Dieter and others (2018) are much smaller than shown in each well.
figure 4 because (1) the estimated withdrawals in the current Two statistical analyses were used to test for statistical
study are based on maximum permitted/licensed withdrawal significance of temporal trends. The nonparametric
rates, which typically are approached only during particularly Mann-Kendall test (Helsel and others, 2020; Kendall, 1938) is
dry years; and (2) the irrigation season typically includes less the primary method used to determine statistical significance
than 6 months of each year. of trends. The null hypothesis for this method is “(H0) is
rejected if the value of S is statistically significantly different
from zero” (Helsel and others, 2020, p. 332), where H0 is
Statistical and Analytical Methods no change and S is Kendall’s τ of y versus time variable;
alternatively, a monotonic trend is assumed. Trends are
Various statistical methods are used for analysis of
considered statistically significant for probability values
temporal trends for climatic and hydrologic data. For all
(p-values) less than or equal to 0.10 (90-percent confidence
trend analyses in this report, the independent (x) variable is
level) for the null hypothesis that Kendall’s tau (τ) equals zero.
time (annual or seasonal), and the dependent (y) variable is a
Kendall’s tau measures the degree of correspondence between
climate or hydrologic variable (precipitation, temperature, or
two variables, with τ ranging from −1 to 1. If τ=−1, the data
water levels in wells). Seasons, where applicable, are defined
have a perfect negative correlation or downward trend. If τ=1,
throughout this analysis as October–December, January–
the data have a perfect positive correlation or upward trend. If
March, April–June, and July–September.
τ=0, there is no correlation or trend.
withdrawals, in cubic feet per second
withdrawals, in gallons per minute
Cumulative licensed groundwater
Cumulative licensed groundwater
200 89,767
150 67,325
100 44,883
50 22,442
0 0
1956 1961 1966 1971 1976 1981 1986 1991 1996 2001 2006 2011 2016
Water year
Figure 4. Summary of licensed groundwater withdrawals over time for the study area.You can also read