Interannual variations of water vapor in the tropical upper troposphere and the lower and middle stratosphere and their connections to ENSO and ...
←
→
Page content transcription
If your browser does not render page correctly, please read the page content below
Atmos. Chem. Phys., 19, 9913–9926, 2019
https://doi.org/10.5194/acp-19-9913-2019
© Author(s) 2019. This work is distributed under
the Creative Commons Attribution 4.0 License.

Interannual variations of water vapor in the tropical upper
troposphere and the lower and middle stratosphere and their
connections to ENSO and QBO
Edward W. Tian1,2 , Hui Su1 , Baijun Tian1 , and Jonathan H. Jiang1
1 Jet   Propulsion Laboratory, California Institute of Technology, Pasadena, CA, USA
2 Department     of Economics, University of California, Santa Cruz, CA, USA

Correspondence: Jonathan Jiang (jonathan.h.jiang@jpl.nasa.gov)

Received: 24 September 2018 – Discussion started: 5 December 2018
Revised: 9 July 2019 – Accepted: 11 July 2019 – Published: 7 August 2019

Abstract. In this study, we analyze the Aura Microwave            Warm ENSO phase and westerly QBO phase tend to cause
Limb Sounder water vapor data in the tropical upper tro-          positive water vapor anomalies, while cold ENSO phase
posphere and the lower and middle stratosphere (UTLMS)            and easterly QBO phase tend to cause negative water vapor
(from 215 to 6 hPa) for the period from August 2004 to            anomalies. As a result, the interannual tropical water vapor
September 2017 using time-lag regression analysis and com-        anomalies near the tropopause are different depending on dif-
posite analysis to explore the interannual variations of tropi-   ferent ENSO and QBO phase combinations. In the lower and
cal UTLMS water vapor and their connections to El Niño–           middle stratosphere, QBO is more important than ENSO for
Southern Oscillation (ENSO) and quasi-biennial oscilla-           the interannual tropical water vapor anomalies. For the west-
tion (QBO). Our analysis shows that the interannual tropi-        erly QBO phases, interannual tropical water vapor anoma-
cal UTLMS water vapor anomalies are strongly related to           lies are positive near the tropopause and in the lower strato-
ENSO and QBO which together can explain more than half            sphere but negative in the middle stratosphere and positive
(∼ 50 %–60 %) but not all variance of the interannual trop-       again above. Vice versa for the easterly QBO phases.
ical water vapor anomalies. We find that ENSO’s impact is
strong in the upper troposphere (∼ 215–∼ 120 hPa) and near
the tropopause (∼ 110–∼ 90 hPa), with a ∼ 3-month lag but
weak in the lower and middle stratosphere (∼ 80 to ∼ 6 hPa).      1   Introduction
In contrast, QBO’s role is large in the lower and middle
stratosphere, with an upward-propagating signal starting at       Water vapor (WV) is the dominant greenhouse gas in the at-
the tropopause (100 hPa) with a ∼ 2-month lag, peaking in         mosphere and plays an important role in global weather and
the middle stratosphere near 15 hPa with a ∼ 21-month lag.        climate systems. Since higher temperature is associated with
The phase lag is based on the 50 hPa QBO index used by            higher saturation vapor pressure, water vapor has a positive
many previous studies. This observational evidence supports       feedback to surface warming. Previous studies indicate that
that the QBO’s impact on the tropical stratospheric water va-     the water vapor feedback is the largest positive feedback in
por is from its modulation on the tropical tropopause tem-        climate models that increases the sensitivity of surface tem-
perature and then transported upward with the tape recorder       perature to increasing carbon dioxide (Held and Soden, 2000;
as suggested by many previous studies. In the upper tropo-        Soden and Held, 2006). The middle and upper tropospheric
sphere, ENSO is more important than QBO for the interan-          water vapor dominates the water vapor feedback (e.g., Held
nual tropical water vapor anomalies that are positive during      and Soden, 2000; Riese et al., 2012; Soden et al., 2008).
the warm ENSO phases but negative during the cold ENSO            The stratospheric water vapor may account for about 10 %
phases. Near the tropopause, both ENSO and QBO are im-            of total water vapor feedback (Dessler et al., 2013). In ad-
portant for the interannual tropical water vapor anomalies.       dition, the water vapor in the stratosphere plays an impor-

Published by Copernicus Publications on behalf of the European Geosciences Union.
9914                                    E. W. Tian et al.: The interannual variations of water vapor in the tropical UTLMS

tant role in stratospheric ozone chemistry and global radia-        times of CFCs and some greenhouse gases, and the trans-
tive balance (Forster and Shine, 1999; Solomon et al., 2010).       port and redistribution within the stratosphere of greenhouse
Thus, it is important to study the water vapor variability in       gases, ozone, aerosols, and volcanic and radioactive debris
the upper troposphere and the lower and middle stratosphere         (Butchart, 2014). Driven by wave breaking in the strato-
(UTLMS).                                                            sphere, the BDC varies on subseasonal to decadal timescales.
   The water vapor in the tropical upper troposphere is                The QBO is a major mode of interannual variability in the
mainly from the tropical lower troposphere through con-             tropical upwelling of the BDC (Baldwin et al., 2001; Lindzen
vective transport of water vapor and evaporation of convec-         and Holton, 1968). The QBO describes the quasi-biennial os-
tively transported or in situ produced cloud ices (e.g., Su         cillation of downward-propagating easterly or westerly zonal
et al., 2006; Tian et al., 2004). The majority of the water         winds in the equatorial stratosphere from the middle strato-
vapor in the tropical lower and middle stratosphere (LMS)           sphere to the tropopause with a period of ∼ 28 months (Bald-
is from the tropical upper troposphere through the tropi-           win et al., 2001). It is well known that the QBO causes
cal tropopause. The tropical LMS water vapor concentra-             large-scale circulation changes that affect ozone, water va-
tion is thus mainly determined by the tropical tropopause           por, methane and global weather and climate. The QBO’s
(∼ 100 hPa) temperature that regulates the amount of tropical       impact on the tropical UTLMS water vapor is mainly through
upper tropospheric water vapor entering the tropical strato-        the QBO’s influence on the tropical tropopause tempera-
sphere (e.g., Fueglistaler et al., 2009; Liang et al., 2011; Ran-   ture that regulates the amount of upper tropospheric wa-
del et al., 2004; Zhou et al., 2001, 2004). Part of the water       ter vapor entering the stratosphere (e.g., Fueglistaler et al.,
vapor in the tropical LMS is also from the local methane ox-        2009; Fujiwara et al., 2010; Geller et al., 2002; Kawatani
idation.                                                            et al., 2014; Liang et al., 2011; Randel et al., 2004; Zhou
   The water vapor in the tropical UTLMS exhibits multi-            et al., 2001, 2004). Mostly driven by equatorially trapped
timescale variations ranging from daily to decadal (e.g.,           waves, the QBO triggers an anomalous meridional circula-
Fueglistaler et al., 2009; Fujiwara et al., 2010; Hegglin et al.,   tion in the stratosphere between the tropics and subtropics
2014; Jiang et al., 2015; Mote et al., 1996; Schwartz et al.,       (from the Equator to 30◦ N and 30◦ S) to maintain the ther-
2008; Solomon et al., 2010; Tian et al., 2004, 2006, 2010). In      mal wind balance between the descending QBO wind shear
particular, large interannual variations of water vapor in the      and its temperature anomaly (Diallo et al., 2018; Tweedy
tropical UTLMS have been observed and shown to be im-               et al., 2017). At the Equator, westerly shear (westerlies
portant for both climate and chemical reasons (e.g., Dessler        aloft and easterlies below) is in balance with a downward-
et al., 2013, 2014; Fueglistaler and Haynes, 2005; Liang et         propagating and adiabatically warmed perturbation, while
al., 2011; Liess and Geller, 2012; Randel and Jensen, 2013;         easterly shear (easterlies aloft and westerlies below) pro-
Tao et al., 2015; Ye et al., 2018). Several well-known interan-     duces an upward-propagating and adiabatically cooled per-
nual climate variabilities and their interactions are found to      turbation. The tropical upwelling perturbation is anticorre-
modulate the interannual variations of tropical UTLMS wa-           lated with the tropical temperature perturbation in the lower
ter vapor, such as the El Niño–Southern Oscillation (ENSO)          stratosphere. The enhanced upwelling during easterly shear
(e.g., Dessler et al., 2014; Liang et al., 2011; Randel et al.,     and reduced upwelling during westerly shear in the trop-
2004; Su and Jiang, 2013; Ye et al., 2018), the quasi-biennial      ics are mass balanced by the changes in the subtropical de-
oscillation (QBO) (e.g., Dessler et al., 2014; Fueglistaler and     scent. The circulation is “completed” by the equatorial di-
Haynes, 2005; Geller et al., 2002; Kawatani et al., 2014;           vergence/convergence of air at the levels of maximum east-
Liang et al., 2011; Liess and Geller, 2012; Randel et al.,          erly/westerly winds (Choi et al., 2002). As the westerly shear
2004; Randel and Jensen, 2013; Tao et al., 2015; Ye et al.,         reaches the tropopause, it warms the tropopause and in-
2018), and the interannual variations in the strength of the        creases the amount of the upper tropospheric water vapor
Brewer–Dobson circulation (BDC) (e.g., Dessler et al., 2013,        entering the lower stratosphere. Conversely, as the easterly
2014; Randel et al., 2006; Ye et al., 2018).                        shear reaches the tropopause, it cools the tropopause and de-
   The BDC is a slow stratospheric mean meridional cir-             creases the amount of the upper tropospheric water vapor en-
culation in which air parcels rise in the tropics, drift pole-      tering the lower stratosphere (Diallo et al., 2018; Tweedy et
ward into the stratosphere, and are transported downward in         al., 2017). It is also noted that the QBO modulates the extrat-
the high-latitude regions via its shallow and deep branches         ropical wave activity, an important driver for the BDC, which
(Brewer, 1949; Butchart, 2014). The BDC is one of the few           influences the tropical cold point tropopause temperature.
truly global-scale phenomena observed in the Earth’s at-               ENSO is the interannual oscillation (2–7-year) of sea sur-
mosphere below ∼ 50 km. It is particularly prominent be-            face temperatures (SSTs) and easterly trade winds in the
cause of its widespread controlling influence on the strato-        tropical Pacific Ocean caused by the coupled interactions be-
sphere. For instance, it has important roles in determining         tween the ocean and atmosphere (Wallace et al., 1998). It
the thermodynamic balance of the stratosphere, the temper-          is the primary source of global interannual climate variabil-
ature of the tropical tropopause, the water vapor entry into        ities (Philander, 1990; Wallace et al., 1998). During a warm
the stratosphere, the period of the tropical QBO, the life-         ENSO (El Niño) phase, trade winds are weaker and warm

Atmos. Chem. Phys., 19, 9913–9926, 2019                                              www.atmos-chem-phys.net/19/9913/2019/
E. W. Tian et al.: The interannual variations of water vapor in the tropical UTLMS                                            9915

waters move eastward to the equatorial central and eastern          that the tropical central Pacific SST warming contributes sig-
Pacific. During a cold ENSO (La Niña) phase, trade winds            nificantly to enhanced convection and thus a sudden drop of
are stronger and warm waters move further westward to the           the lower stratospheric (83 hPa) water vapor around 2000.
equatorial western Pacific. ENSO can modulate the tropical          They suggested that the tropical central Pacific SST is an-
UTLMS water vapor through several physical and dynamical            other important driver of the lower stratospheric water vapor
processes, such as convective transport of tropospheric water       variability on inter-decadal timescales.
vapor, evaporation of cloud ice, and the perturbations of the          During the boreal winter 2015–2016, a strong El Niño
tropical tropopause (∼ 100 hPa) temperature (e.g., Dessler et       event (among the three strongest El Niño events on record)
al., 2014; Gettelman et al., 2001; Liang et al., 2011; Ye et al.,   (Huang et al., 2016) was aligned with a westerly QBO phase.
2018; Zhou et al., 2001, 2004). In the tropical upper tropo-        This westerly QBO phase was abruptly disrupted well be-
sphere, ENSO modulates the water vapor mainly through the           fore completion by an easterly phase in January 2016 (New-
convective transport of lower tropospheric water vapor and          man et al., 2016; Osprey et al., 2016). The interplay between
evaporation of cloud ice. In the stratosphere including the         both circulation anomalies caused large changes in trace gas
tropopause region, ENSO modulates the water vapor mainly            transport, the climate implications of which are currently a
through its influence on the tropical tropopause temperature        topic of debate. Avery et al. (2017) argued that the most re-
that regulates the amount of water vapor entering the strato-       cent El Niño event significantly moistened the lower strato-
sphere. From a zonal mean perspective, El Niño events in-           sphere due to convective ice lofting, with the QBO having
duce a tropospheric warming and a stratospheric cooling with        only a small contribution. In contrast, Tweedy et al. (2017)
a node near the tropopause, strengthen the tropical upwelling       attributed the lower stratospheric water vapor changes from
of the BDC, and decrease the tropical lower stratospheric           spring to autumn to the 2015–2016 QBO disruption. Di-
ozone (Calvo et al., 2010; Randel et al., 2009). Lower strato-      allo et al. (2018) showed that the alignment of a strong El
spheric water vapor, however, is predominantly controlled           Niño event with westerly QBO in the early boreal winter of
by cold point temperatures over the tropical western Pacific        2015–2016 substantially increased water vapor in the tropical
(Avery et al., 2017; Diallo et al., 2018). El Niño events are       lower stratosphere (positive anomalies of more than 20 %).
associated with warmer cold point temperatures over this re-        The sudden shift in the QBO from westerly to easterly wind
gion, thereby causing increased lower stratospheric water va-       shear significantly decreased global lower stratospheric wa-
por (e.g., Avery et al., 2017; Calvo et al., 2010; Konopka et       ter vapor from early spring to late autumn and reversed the
al., 2016). In contrast, La Niña events induce an opposite ef-      lower stratosphere moistening to the lower stratosphere dry-
fect.                                                               ing (negative anomalies of close to 20 %). They emphasized
   Many previous studies have significantly improved our            that the control of the lower stratospheric water vapor anoma-
knowledge about the interannual variations of the tropical          lies strongly depends on the interactions between ENSO and
UTLMS water vapor. For example, Liang et al. (2011) stud-           QBO phases. The interaction of El Niño and the westerly
ied the atmospheric water vapor and temperature variabil-           QBO phase leads to large positive lower stratospheric water
ity in the tropical UTLMS using a merged Aqua Atmo-                 vapor anomalies, while the interplay between La Niña and
spheric Infrared Sounder (AIRS) and Aura Microwave Limb             the easterly QBO phase leads to negative water vapor anoma-
Sounder (MLS) temperature and water vapor record (Au-               lies. During weak and moderate ENSO events, the water va-
gust 2004 to March 2010). They found that both ENSO                 por anomalies are mainly controlled by the QBO phase.
and QBO impact the tropical tropopause water vapor and                 However, the aforementioned studies mainly focused on
the water vapor anomalies near the tropical tropopause are          a few specific levels of the UTLMS layer, either 82 hPa
strongly dependent on the alignment of ENSO and QBO                 (Dessler et al., 2013, 2014; Ding and Fu, 2018) or 100 hPa
phases. Dessler et al. (2013, 2014) performed a multi-linear        (Ye et al., 2018) or based on limited data periods (Avery et
regression of the tropical lower stratospheric (82 hPa) water       al., 2017; Diallo et al., 2018; Liang et al., 2011; Tweedy et
vapor variability to the QBO, BDC and tropospheric temper-          al., 2017). A comprehensive investigation of the interannual
ature (which is correlated with ENSO). They found that the          variations of the tropical water vapor in the whole UTLMS
tropical lower stratospheric water vapor lags QBO by about          layer with a much longer period and their relationships with
3 months and lags BDC by 1 month based on the 50 hPa                ENSO and QBO is still lacking. In addition, the relative im-
QBO index. Ye et al. (2018) performed a two-dimensional             portance of ENSO and QBO for the tropical UTLMS water
multivariate linear regression of the tropical tropopause wa-       vapor interannual variabilities at different levels has not been
ter vapor interannual variability to the QBO, BDC and tro-          well investigated in the previous studies.
pospheric temperature as a function of latitude and longitude          This study seeks to investigate the interannual variations of
based on satellite observations and model simulations. They         water vapor in the tropical UTLMS layer and their relation-
found that the evaporation of convective ice from increased         ships with ENSO and QBO using the Aura MLS UTLMS
deep convection as the troposphere warms plays an important         water vapor data. We are particularly interested in the rela-
role in the tropopause water vapor variability in addition to       tive roles of ENSO and QBO in the interannual variations of
changing tropopause temperature. Ding and Fu (2018) found           water vapor in the tropical UTLMS layer at different levels.

www.atmos-chem-phys.net/19/9913/2019/                                                Atmos. Chem. Phys., 19, 9913–9926, 2019
9916                                  E. W. Tian et al.: The interannual variations of water vapor in the tropical UTLMS

This study distinguishes itself from previous studies in the      MLS water vapor data have been used extensively in atmo-
three following ways. (1) The current study investigates the      spheric process analysis studies and climate model evalua-
interannual variations of water vapor in the whole tropical       tions (e.g., Dessler et al., 2013, 2014; Flury et al., 2012; Jiang
UTLMS layer from 215 to 6 hPa instead of a couple of lay-         et al., 2012; Liang et al., 2011; Liu et al., 2018; Solomon
ers in the previous ones. (2) The Aura MLS UTLMS water            et al., 2010; Su et al., 2006; Takahashi et al., 2016; Uma
vapor data of much longer length (August 2004 to Septem-          et al., 2014; Wu et al., 2012). The MLS water vapor data
ber 2017) are used in the current study than the previous         are freely available through the Aura MLS project website
ones. (3) The relative importance of ENSO and QBO on              (https://mls.jpl.nasa.gov, last access: 14 August 2018).
the tropical UTLMS water vapor interannual variabilities for         Since we are mainly interested in the tropical UTLMS, we
the entire UTLMS layer and at different phase lags is more        first averaged the MLS monthly water vapor data between
completely investigated in the current study than the previ-      15◦ S/N, and along the entire latitude band (wvt,p ). Then,
ous ones. (4) This study will present some new observational      the tropical mean seasonal cycle (wvm,p , 12 months) was
evidence to better understand the role of ENSO and QBO in         calculated as the averages of the tropical MLS monthly wa-
the tropical UTLMS water vapor interannual variations, es-        ter vapor data at each calendar month over the whole MLS
pecially regarding the role of QBO and its tape recorder ef-      data record. Next, de-seasonalized monthly tropical water va-
fect. (5) This study will also present a composite view of the    por anomalies were obtained by removing the tropical mean
tropical UTLMS water vapor interannual variations based on        seasonal cycle from the tropical monthly water vapor data
different combinations of ENSO and QBO phases.                    (wv0t,p = wvt,p − wvm,p ). Then, the interannual (2–7 years)
   The rest of this paper is organized as follows. Section 2      tropical water vapor anomalies (or short-handed as anomalies
describes the MLS water vapor data and the analysis meth-         for simplicity) were isolated through the difference between
ods. Section 3 presents the results, followed by summary and      the 12- and 42-month running means of the de-seasonalized
conclusions in Sect. 4.                                           monthly tropical water vapor anomalies to remove the high-
                                                                  frequency (e.g., synoptic, seasonal, intraseasonal, and an-
                                                                  nual) and low-frequency (e.g., solar cycle and decadal) vari-
2   Data and methods                                              abilities. Last, the interannual monthly tropical water vapor
                                                                  anomalies were converted into percentage deviations by di-
We use the Version 4.2 Level 2 daily Aura MLS water va-           viding the interannual monthly tropical water vapor anoma-
por volume mixing ratio product as described in Read et           lies by the long-term tropical mean (wvp ) at the respec-
al. (2007) and Livesey (2015) from 215 to 6 hPa over the          tive pressure level. The resulting interannual monthly trop-
period of August 2004 to September 2017. The MLS wa-              ical water vapor anomalies in percentage deviations are used
ter vapor data were averaged to monthly means and gridded         throughout the analysis.
onto 2.5×2.5 horizontal spatial grids. The MLS Level 2 data          Using the difference of running means of different widths
have a vertical resolution of ∼ 3 km and horizontal resolu-       as a band-pass filter is effective. A 12-month running mean
tions of ∼ 7 km across track and ∼ 200–300 km along track.        will remove the high-frequency variabilities (< 2 years)
The useful altitude ranges are at pressure (p) ≤ 316 hPa, but     and keep the interannual variability (2–7 years) and the
we only use the water vapor data above 215 hPa because            low-frequency variabilities (> 7 years). A 42-month run-
of larger uncertainty below 215 hPa altitude. The measure-        ning mean will remove the high-frequency variabilities
ment uncertainties (including biases) are 20 % in the up-         (< 2 years) and the interannual variability (2–7 years) and
per troposphere (p > 100 hPa) and 10 % near the tropopause        keep the low-frequency variabilities (> 7 years). As a re-
(∼ 100 hPa) and in the stratosphere (p ≤ 100 hPa) (Lambert        sult, the difference between the 12- and 42-month running
et al., 2007; Read et al., 2007). These measurement uncer-        means will remove both the high-frequency (< 2 years) and
tainties are retrieval uncertainties and are estimated based on   low-frequency (> 7 years) variabilities and keep the interan-
(1) the average difference between the simulated retrieval and    nual variability (2–7 years) only. This simple approach of
truth file; and (2) the average difference between MLS mea-       the band-pass filter has been used in the previous studies
surements and the airborne measurements. These uncertain-         related to the Madden–Julian Oscillation (e.g., Tian et al.,
ties should not affect our results because we are interested      2006, 2007, 2011).
in the interannual anomalies instead of its means. In addi-          To represent ENSO phases, we use a bimonthly multi-
tion, Hegglin et al. (2013) show that MLS zonal monthly           variate ENSO index (MEI) downloaded from the National
mean water vapor shows very good to excellent agreement           Oceanic and Atmospheric Administration (NOAA) Earth
with the multi-instrument mean (MIM) in comparison be-            System Research Laboratory (ESRL) website (https://www.
tween 13 instruments, throughout most of the atmosphere           esrl.noaa.gov/psd/enso/mei/, last access: 29 July 2019). Af-
(including the UTLS), with mean deviations from the MIM           ter spatially filtering the individual fields into clusters, the
between +2.5 % and +5 %, making these random errors ir-           MEI is calculated as the first unrotated principal compo-
relevant for the average monthly zonal mean water vapor           nent (PC) of all six observed fields combined, including sea-
anomalies used in this study (Diallo et al., 2018). The Aura      level pressure, zonal and meridional surface winds, sea sur-

Atmos. Chem. Phys., 19, 9913–9926, 2019                                             www.atmos-chem-phys.net/19/9913/2019/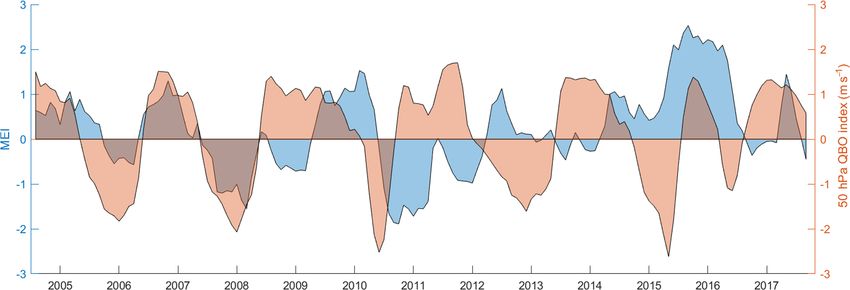
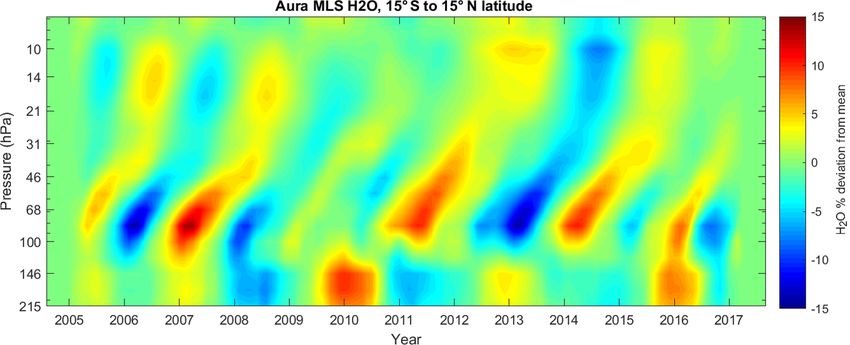
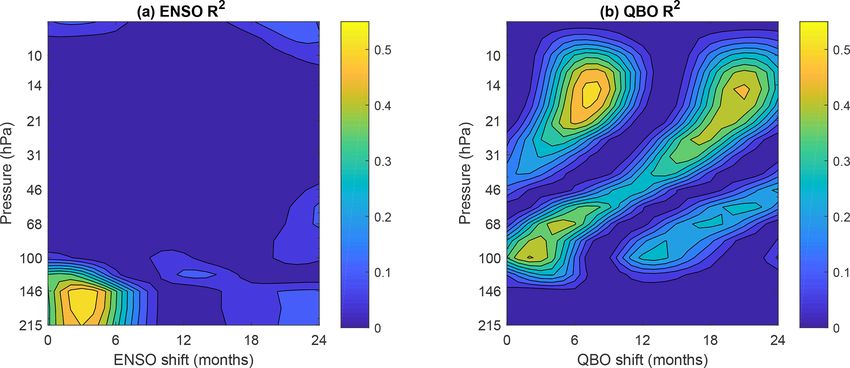
E. W. Tian et al.: The interannual variations of water vapor in the tropical UTLMS                                           9917

face temperature, surface air temperature, and total cloudi-       following strong assumption: the UTLMS water vapor inter-
ness over the tropical Pacific collected and published in the      annual anomaly is a linear function of ENSO or QBO index
International Comprehensive Ocean-Atmosphere Data Set              with a Gaussian distribution. Within the observed interannual
(ICOADS) (Wolter and Timlin, 2011). Positive MEI val-              anomalies of the UTLMS water vapor and climate variabili-
ues indicate warm ENSO (El Niño) phases, while negative            ties, these assumptions are not perfect, but are useful.
MEI values indicate cold ENSO (La Niña) phases. In order              For the composite analysis, we first partitioned the interan-
to keep the MEI comparable, all seasonal values are stan-          nual monthly MLS water vapor anomalies into four different
dardized with respect to each season and to the 1950–1993          cases based on different combinations of ENSO and QBO
reference period. The MEI is computed separately for each          phases: warm ENSO (MEI > 0.3) and westerly QBO (u50 >
of 12 sliding bi-monthly seasons (December/January, Jan-           0.1 m s−1 ) case, warm ENSO (MEI > 0.3) and easterly
uary/February, November/December). We use the MEI value            QBO (u50 < −0.1 m s−1 ) case, cold ENSO (MEI < −0.3)
of month (i − 1) and month (i) as if it were the value for         and westerly QBO (u50 > 0.1 m s−1 ) case, and cold ENSO
month (i) only as advised by the NOAA MEI website.                 (MEI < −0.3) and easterly QBO (u50 < −0.1 m s−1 ) case.
   For QBO, we use the standardized anomaly of monthly             These threshold values were chosen in order to remove the
zonal mean zonal wind at the Equator and 50 hPa (u50 ,             ENSO and QBO neutral phases and have sufficient samples
m s−1 ) based on the National Centers for Environmental Pre-       for the composites at the same time. We then averaged the in-
diction (NCEP)/National Center for Atmospheric Research            terannual monthly MLS water vapor anomalies for each case
(NCAR) reanalysis (CDAS) downloaded from the NOAA                  to create a composite mean profile. The composite analysis
NCEP Climate Prediction Center (CPC) website (http://              was applied to the MLS interannual water vapor anomaly
www.cpc.ncep.noaa.gov/data/indices/qbo.u50.index, last ac-         data for annual means, the summer months (MJJASO) av-
cess: 29 July 2019). Positive u50 values denote westerly           erage and the winter months (NDJFMA) average separately.
QBO phases, while negative u50 values denote easterly QBO
phases. This 50 hPa QBO index has been frequently used by
previous studies (Dessler et al., 2013, 2014; Ye et al., 2018).    3   Results
The ENSO and QBO indices from August 2004 to Septem-
ber 2017 are shown in Fig. 1.                                      Figure 2 shows the interannual monthly mean tropical wa-
   With the ENSO, QBO, and MLS data sets we conducted              ter vapor anomalies from MLS in percentage deviations at
two types of analysis: lead-lag regression analysis and com-       different pressure levels from 215 to 6 hPa and from Au-
posite analysis. The lead-lag regression identifies how much       gust 2004 to September 2017. In the upper troposphere from
time lag exists between the perturbation of a climate mode         ∼ 215 to ∼ 120 hPa, large vertically oriented tropical water
and the response of the UTLMS water vapor anomalies at             vapor anomalies of ±15 % are evident. They seem to be
different pressure levels. We normalized each index by di-         coincident with several El Niño or La Niña events shown
viding each index anomaly by its standard deviation before         in Fig. 1, with positive anomalies during the warm ENSO
performing the linear regressions. For every pressure level        phases and negative anomalies during the cold ENSO phases.
and time shift, a univariate linear regression is performed        In the lower and middle stratosphere (100–6 hPa), large trop-
first with respect to either ENSO or QBO index individually        ical water vapor anomalies of ±15 % are found to propa-
(WV = X0 + X1 × ENSO and WV = X0 + X1 × QBO). The                  gate upward at a speed of about 7 km yr−1 starting around
respective R 2 value of each linear regression, a standard mea-    100 hPa with a first local maximum in the lower stratosphere
sure of proportion of explained variance, is used to indicate      around 68 hPa and a second local maximum in the middle
how much water vapor variability can be described by each          stratosphere around 15 hPa. These have been referred to as
linear regression separately for each pressure level and time      the interannual variability of the stratospheric water vapor
lag. The maximum R 2 value will determine the optimal time         tape recorder (e.g., Geller et al., 2002; Kawatani et al., 2014;
lag for the univariate linear regression at each pressure level.   Liang et al., 2011) and are regulated by QBO. The small in-
A multivariate linear regression with respect to ENSO and          terannual water vapor anomalies at the beginning and ending
QBO together is then performed using the optimal time lags         months of the data record are results of the boundary effect
obtained from the univariate linear regressions to estimate        of using the difference of running means as a band-pass filter.
how much water vapor variability can be described by ENSO             To show the relative importance of ENSO and QBO and
and QBO combined. The residual between the original obser-         their roles in the interannual tropical water vapor anoma-
vation and the multivariate linear regression with respect to      lies at different pressure levels, Fig. 3 shows the R 2 val-
ENSO and QBO together is also calculated to quantify how           ues for the linear regressions between the MLS tropical
much water vapor variability cannot be explained by ENSO           UTLMS interannual monthly water vapor anomalies and
and QBO together and may be due to nonlinear or coupled            the ENSO or QBO index from 215 to 6 hPa with time-lag
ENSO–QBO interaction and other physical processes (e.g.,           shifts from 0 to 24 months. Figure 3a (left) is for ENSO
BDC). We recognize that using the R 2 value of a linear re-        (WV = X0 + X1 × ENSO) and Fig. 3b (right) is for QBO
gression as a proportion of explained variance is based on the     (WV = X0 + X1 × QBO). The time-lag shift indicates the

www.atmos-chem-phys.net/19/9913/2019/                                               Atmos. Chem. Phys., 19, 9913–9926, 2019
9918                                   E. W. Tian et al.: The interannual variations of water vapor in the tropical UTLMS

Figure 1. Bimonthly multivariate ENSO index (MEI, blue) and monthly 50 hPa QBO index (u50 , m s−1 , orange) based on the standardized
anomaly of monthly zonal mean zonal wind at the Equator and 50 hPa, both from NOAA at the period from August 2004 to September 2017.
Positive MEI values indicate warm ENSO (El Niño) phases, while negative MEI values indicate cold ENSO (La Niña) phases. Positive u50
values denote westerly QBO phases, while negative u50 values denote easterly QBO phases.

Figure 2. Monthly interannual tropical water vapor anomalies from MLS in percentage deviations at different pressure levels from Au-
gust 2004 to September 2017.

number of months that the tropical water vapor anomalies             in the upper troposphere and around the tropopause, while
lag the ENSO or QBO index. The maximum time lag of                   its impact on the water vapor interannual variability is very
24 months was chosen due to the fact that 24 months are              small in the stratosphere. The current finding of the strong
close to the period of a QBO cycle and the minimum pe-               impact of ENSO on the water vapor in the upper troposphere
riod of an ENSO cycle. Figure 3a indicates the R 2 value             and around the tropopause is consistent with several pre-
for the linear regressions between the tropical water vapor          vious studies (Dessler et al., 2014; Gettelman et al., 2001;
anomalies and the ENSO index is large (∼ 0.5) in the up-             Liang et al., 2011; Ye et al., 2018) that suggested ENSO
per troposphere, becomes smaller (∼ 0.1) at the tropopause           can strongly modulate the upper tropospheric water vapor
(∼ 100 hPa) and is very small (close to zero) in the strato-         through the convective transport of tropospheric water va-
sphere above 80 hPa. This is consistent with the large verti-        por and the evaporation of cloud ice. In terms of the response
cally oriented water vapor anomalies of ±15 % in the upper           time, the highest correlation is at an ∼ 3-month lag. This is
troposphere that are coincident with several El Niño or La           comparable to the tropospheric temperature response time to
Niña events shown in Fig. 2. This implies that ENSO has              the ENSO SST anomaly (Su et al., 2005). The current finding
a strong impact on the water vapor interannual variability           of the weak influence of ENSO on the water vapor anomalies

Atmos. Chem. Phys., 19, 9913–9926, 2019                                               www.atmos-chem-phys.net/19/9913/2019/
E. W. Tian et al.: The interannual variations of water vapor in the tropical UTLMS                                             9919

Figure 3. R 2 values for the linear regressions between the interannual tropical water vapor anomalies from MLS and the ENSO or QBO
index at each pressure level with time-lag shifts from 0 to 24 months. (a) is for ENSO (WV = X0 + X1 × ENSO) and (b) is for QBO
(WV = X0 + X1 × QBO). The time-lag shift indicates the number of months that interannual tropical water vapor anomalies lag the ENSO
or QBO index.

in the lower and middle stratosphere is also consistent with a      index is similar to the time needed for the QBO signal to
previous study (Ding and Fu, 2018) that suggested the small         propagate downward from the 50 hPa level to the tropopause
effect of ENSO on tropical zonal mean lower stratospheric           (Tweedy et al., 2017). The above vertical structure of the
water vapor is due to the opposite phases of lower strato-          high R 2 value for the linear regressions between the tropical
spheric water vapor anomalies in response to ENSO in the            water vapor anomalies and the 50 hPa QBO index suggests
longitudinal direction. This is due to the compensating effect      that the QBO does not directly affect the water vapor con-
of ENSO on the tropical tropopause temperature anomalies            centration at altitudes higher than 100 hPa; instead, the QBO
between the western equatorial Pacific and the central equa-        signal in the tropical LMS water vapor is imprinted at the
torial Pacific that reduces the zonal mean tropical tropopause      tropopause (about 100 hPa) first, and then it is transported
temperature anomalies found by previous studies (Avery et           upward with the tape recorder. This observational evidence
al., 2017; Gettelman et al., 2001; Kiladis et al., 2001; Liang      supports the QBO’s impact on the stratospheric water vapor
et al., 2011).                                                      being from its modulation on the tropical tropopause temper-
   For the linear regressions between the interannual tropical      ature, as suggested by many previous studies (e.g., Diallo et
water vapor anomalies and the QBO index, Fig. 3b indicates          al., 2018; Fueglistaler et al., 2009; Liang et al., 2011; Randel
that the QBO influence is small in the upper troposphere            et al., 2004; Tweedy et al., 2017; Zhou et al., 2001, 2004).
but large in the lower and middle stratosphere. The high R 2        This is also consistent with the upward-propagating tropical
value between the tropical water vapor anomalies and the            water vapor anomalies of ±15 % in the lower and middle
50 hPa QBO index starts at the tropopause at a time lag of          stratosphere shown in Fig. 2 and is referred to as the interan-
∼ 2 months and propagates upwards, peaking in the middle            nual variability of the stratospheric water vapor tape recorder
stratosphere at ∼ 15 hPa with a time lag of ∼ 21 months and         (e.g., Geller et al., 2002; Liang et al., 2011). This indicates
disappearing at about 6 hPa. The R 2 value is large (∼ 0.5) at      that the interannual variability of the stratospheric water va-
the tropopause at a time lag of ∼ 2 months. Above 100 hPa,          por tape recorder (e.g., Geller et al., 2002; Liang et al., 2011)
it first decreases to about 0.3 at about 40 hPa at a time lag       is a result of the impact of QBO. It is possible that the inter-
of ∼ 13 months. Above 40 hPa, it then increases to about 0.5        annual variations of the BDC play a role here too because the
in the middle stratosphere at about 15 hPa with a time lag of       QBO modulates the extratropical wave activity, an important
∼ 21 months (a local peak). Above 15 hPa, it then decreases         driver for the BDC, which influences the tropical cold point
again till it disappears at about 6 hPa. The peak at ∼ 15 hPa       tropopause temperature.
with a time lag of ∼ 8 months is the result of the upward-             Between about 120 hPa and about 40 hPa, the decrease in
propagating signal starting at the tropopause at a time lag         the high R 2 value with altitude can be easily understood by
of a few months earlier than the 50 hPa QBO index. These            mixing or dilution of the upward transport of the imprinted
phase lags are consistent with the findings of previous stud-       100 hPa signal by the tape recorder. However, the increase
ies (Dessler et al., 2013, 2014; Ye et al., 2018). The time         in the high R 2 value between 40 and 15 hPa and the peak
lag of ∼ 2 months for the high correlation between the trop-        of the high R 2 value at about 15 hPa cannot easily be ex-
ical tropopause water vapor anomalies and the 50 hPa QBO            plained by the tape recorder only. Other sources, such as the

www.atmos-chem-phys.net/19/9913/2019/                                                Atmos. Chem. Phys., 19, 9913–9926, 2019
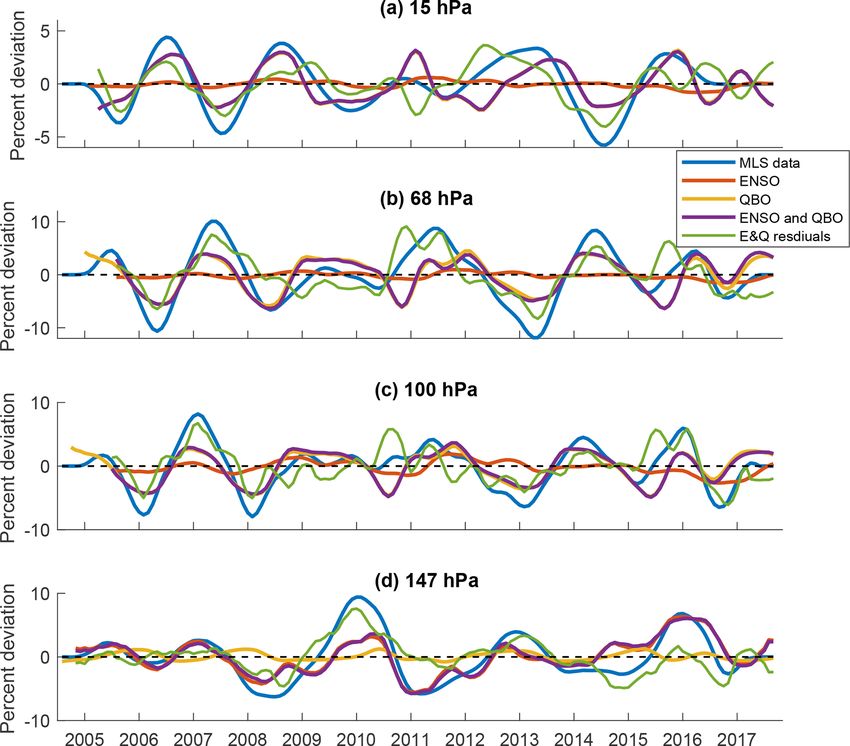
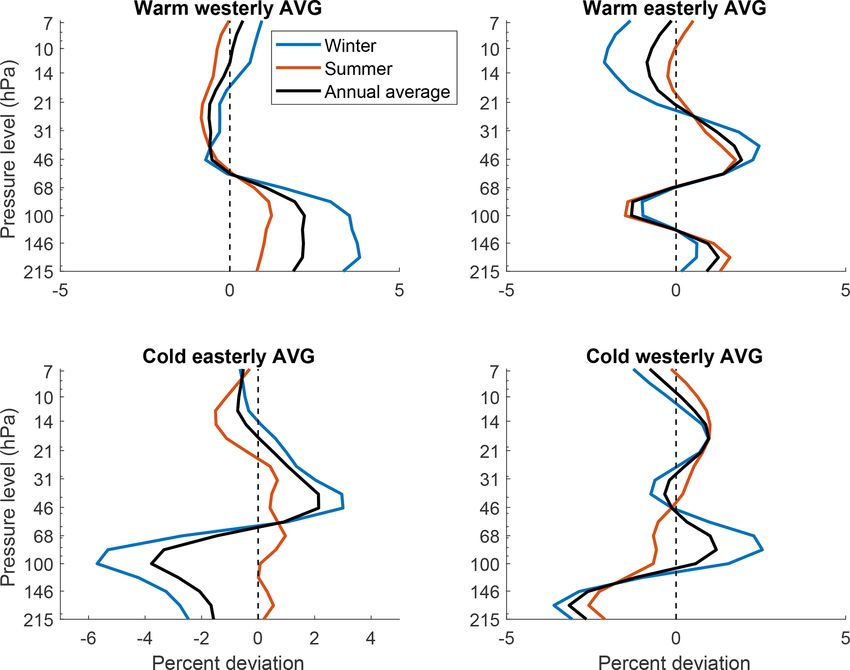
9920                                  E. W. Tian et al.: The interannual variations of water vapor in the tropical UTLMS

downward propagation of water vapor anomalies in the upper        QBO together can explain about more than half (∼ 50 %–
stratosphere due to the methane oxidation, may be responsi-       60 %) the variance of the interannual monthly tropical wa-
ble for this phenomenon (Kawatani et al., 2014).                  ter vapor anomalies under the strong assumption that the
   Figure 4 shows the time series of the monthly interannual      UTLMS water vapor interannual anomaly is a linear func-
tropical MLS water vapor anomalies (blue lines) and the pre-      tion of the ENSO or QBO index with a Gaussian distribution.
dicted interannual monthly tropical water vapor anomalies         However, large residues are still evident in Fig. 4, indicating
based on the univariate linear regressions on the ENSO in-        that nonlinear ENSO–QBO interactions and other physical
dex only (red lines) or the QBO index only (orange lines) at      processes (e.g., BDC) as well as their interactions may be
the time lag less than 12 months with the highest R 2 value       considered in order to explain the full interannual variability
for four specific pressure levels, 147, 100, 68, and 15 hPa,      of the tropical UTLMS water vapor. This issue is beyond the
representing the upper troposphere, tropopause, lower strato-     scope of this paper and will be investigated in the future.
sphere, and mid-stratosphere, respectively. Figure 4 reaffirms       To highlight the different roles of ENSO and QBO phases
the results shown in Fig. 3: the decreasing contributions of      in the interannual tropical water vapor anomalies at differ-
ENSO and the increasing contributions of QBO to the in-           ent pressure levels and in different seasons, Fig. 5 shows
terannual variability of UTLMS water vapor as the altitude        the composite interannual tropical water vapor anomalies
increases. The R 2 value for the linear regressions between       from MLS as a function of pressure levels for winter (ND-
the MLS interannual tropical water vapor anomalies and the        JFMA) (blue lines), summer (MJJASO) (red lines), and an-
ENSO index is ∼ 0.54 at the 147 hPa altitude with a ∼ 3-          nual (black lines) means at four different cases based on dif-
month time lag and ∼ 0.08 at the tropopause with a ∼ 11-          ferent combinations of ENSO and QBO phases. Consistent
month time lag, and deceases to ∼ 0.01 at the 68 hPa altitude     with Figs. 3 and 4, Fig. 5 shows that ENSO mainly impacts
with a ∼ 12-month time lag and ∼ 0.02 at the 15 hPa alti-         the interannual tropical water vapor anomalies in the upper
tude with a ∼ 6-month time lag. In contrast, the R 2 value for    troposphere and at the tropopause, while QBO mainly af-
the linear regressions between the MLS interannual tropical       fects the interannual tropical water vapor anomalies at the
water vapor anomalies and the QBO index is small (∼ 0.03)         tropopause and in the lower and middle stratosphere. In the
at the 147 hPa altitude with a ∼ 0-month time lag, becomes        upper troposphere (215–120 hPa), the interannual tropical
significant and large (∼ 0.46) at the tropopause with a ∼ 2-      water vapor anomalies are mainly related by the ENSO phase
month time lag, ∼ 0.44 at the 68 hPa altitude with a ∼ 5-         and its seasonal change, while the QBO’s effect seems to
month time lag, and ∼ 0.52 at the 15 hPa altitude with a          be small. Positive interannual tropical water vapor anoma-
∼ 8-month time lag. Therefore, for the interannual variabil-      lies are found during the warm ENSO phases, while negative
ity of the UTLMS tropical water vapor, ENSO is more im-           interannual tropical water vapor anomalies are found during
portant than QBO in the upper troposphere (from ∼ 215 to          the cold ENSO phases for the annual, winter, and summer
∼ 120 hPa), both ENSO and QBO are important around the            means no matter what the QBO phases are. However, excep-
tropopause (from ∼ 110 to ∼ 90 hPa), and mainly QBO is            tions exist for the summer and the cold easterly QBO case,
more important than ENSO in the lower and middle strato-          but the sampling for this case is low and we have to interpret
sphere (from ∼ 80 to 6 hPa). This result is consistent with       this result with caution. This is consistent with the aforemen-
many previous studies. For example, Tweedy et al. (2017)          tioned mechanism that ENSO impacts the upper tropospheric
and Diallo et al. (2018) have shown that the sudden shift in      water vapor through the convective transport of water vapor
the QBO from westerly to easterly wind shear in the boreal        (e.g., Jiang et al., 2015). The interannual tropical water vapor
winter of 2015–2016 significantly decreased global lower          anomalies tend to be larger during the winter than during the
stratospheric water vapor from early spring to late autumn        summer because the ENSO events are usually stronger dur-
and reversed the lower stratosphere moistening to the lower       ing the winter than during the summer (Wallace et al., 1998).
stratosphere drying. Their results imply that QBO is more            Near the tropopause (110–90 hPa), both ENSO and QBO
important than ENSO in modulating the lower stratospheric         as well as their season changes can influence the interan-
water vapor.                                                      nual tropical water vapor anomalies. Both warm ENSO phase
   Figure 4 also shows the predicted monthly interannual          and westerly QBO phase tend to cause positive interannual
tropical water vapor anomalies based on the multivariate lin-     tropical water vapor anomalies, while cold ENSO phase and
ear regressions on the ENSO and QBO indices together (pur-        easterly QBO phase tend to cause negative interannual trop-
ple lines) and the differences (green lines) between the orig-    ical water vapor anomalies in this layer. As a result, differ-
inal MLS interannual monthly tropical water vapor anoma-          ent interannual tropical water vapor anomalies are found for
lies (blue lines) and the multivariate linear regression (pur-    different cases depending on the different ENSO and QBO
ple lines) at the four specific pressure levels. Figure 4 indi-   phase combinations and their seasonal variations in this layer
cates that the predicted interannual monthly tropical water       (Liang et al., 2011). For example, very strong positive inter-
vapor anomalies based on the multivariate linear regressions      annual tropical water vapor anomalies are found for the warm
of ENSO and QBO are very similar to the original MLS inter-       westerly case, and very strong negative interannual tropical
annual monthly tropical water vapor anomalies. ENSO and           water vapor anomalies are found for the cold easterly case

Atmos. Chem. Phys., 19, 9913–9926, 2019                                            www.atmos-chem-phys.net/19/9913/2019/
E. W. Tian et al.: The interannual variations of water vapor in the tropical UTLMS                                                     9921

Figure 4. The time series of the monthly interannual tropical water vapor anomalies from MLS (blue lines) and the predicted monthly
interannual tropical water vapor anomalies based on the linear regressions on the ENSO index only (red lines), the QBO index only (orange
lines), and the ENSO and QBO indices together (purple lines) at the time lag less than 12 months with the highest R 2 value for four specific
pressure levels: 15 hPa (a), 68 hPa (b), 100 hPa (c), and 147 hPa (d). The differences between the MLS data (blue lines) and the linear
regression lines based on the ENSO and QBO together (purple lines) are also plotted (green lines).

due to the supporting effect of ENSO and QBO for the win-                stratosphere (below ∼ 50 hPa altitude), negative in the lower
ter season. Weak interannual tropical water vapor anomalies              and middle stratosphere (between ∼ 50 and ∼ 20 hPa alti-
are found for the warm easterly case and the cold westerly               tude), and positive again in the middle stratosphere (above
case due to the compensating effect of ENSO and QBO.                     ∼ 20 hPa altitude) for all seasons. The opposite occurs during
This result is consistent with those results found by Diallo             the easterly QBO phases. The sign reversals of the interan-
et al. (2018) and Liang et al. (2011) that emphasized the im-            nual tropical water vapor anomalies along the pressure levels
portance of the interaction of ENSO and QBO phases in con-               in Fig. 5 are consistent with the upward-propagating water
trolling the tropical tropopause water vapor anomalies. How-             vapor anomalies and the R 2 values shown in Figs. 2 and 3b.
ever, Diallo et al. (2018) focused on the lower stratosphere,            There are some differences in interannual tropical water va-
different from the tropopause layer we discussed here.                   por anomalies between warm and cold ENSO phases and be-
   In the lower and middle stratosphere (80–6 hPa), QBO and              tween the summer and winter seasons, but they are relatively
its seasonal change contribute significantly to the interannual          small.
tropical water vapor anomalies, while the ENSO’s effect is
negligible. QBO explains ∼ 50 %–60 %, in contrast to ∼ 2 %
by ENSO, of the tropical water vapor interannual variance                4   Summary and conclusions
under the strong assumption that the UTLMS water vapor
                                                                         In this study, we have analyzed the Aura MLS tropical
interannual anomaly is a linear function of ENSO or QBO
                                                                         UTLMS monthly water vapor data from 215 to 6 hPa and
index with a Gaussian distribution. As discussed earlier, this
                                                                         from August 2004 to September 2017 using time-lag regres-
result seems to be consistent with Tweedy et al. (2017) and
                                                                         sion analysis and composite analysis to explore the interan-
Diallo et al. (2018) but not with Avery et al. (2017). During
                                                                         nual variations of water vapor in the whole tropical UTLMS
the westerly QBO phases, interannual tropical water vapor
                                                                         layer and their connections to ENSO and QBO. The main
anomalies are positive near the tropopause and in the lower
                                                                         findings of our analysis are summarized below.

www.atmos-chem-phys.net/19/9913/2019/                                                      Atmos. Chem. Phys., 19, 9913–9926, 2019
9922 E. W. Tian et al.: The interannual variations of water vapor in the tropical UTLMS Figure 5. Composite interannual tropical water vapor anomalies from MLS at different pressure levels for winter (NDJFMA) (blue lines), summer (MJJASO) (red lines), and annual (black lines) means at four different cases based on different combinations of ENSO and QBO phases. In the upper troposphere (215–120 hPa), ENSO and its por, the evaporation of cloud ice, and its impact on the tropi- seasonal change contribute significantly to the interannual cal tropopause temperature. In contrast, QBO modulates the tropical water vapor anomalies with a ∼ 3-month time lag, tropical tropopause water vapor mainly by its modulation of while the QBO’s effect is negligible. ENSO explains ∼ 54 %, the tropical tropopause temperature. Both warm ENSO phase in contrast to ∼ 3 % by QBO, of the interannual tropical and westerly QBO phase tend to cause positive interannual water vapor variance under the strong assumption that the tropical water vapor anomalies, while both cold ENSO phase UTLMS water vapor interannual anomaly is a linear func- and easterly QBO phase tend to cause negative interannual tion of ENSO or QBO index with a Gaussian distribution. tropical water vapor anomalies. As a result, different inter- ENSO modulates the upper tropospheric water vapor mainly annual tropical water vapor anomalies are found for differ- through the convective transport of tropospheric water va- ent combinations of ENSO and QBO phases and their sea- por and the evaporation of cloud ice. Positive interannual sonal variations. For example, very strong positive interan- tropical water vapor anomalies are found during the warm nual tropical water vapor anomalies are found for the warm ENSO phases, while negative interannual tropical water va- westerly case and very strong negative interannual tropical por anomalies are found during the cold ENSO phases for water vapor anomalies are found for the cold easterly case all seasons, although the interannual tropical water vapor due to the compatible effects of ENSO and QBO for the win- anomalies tend to be larger during the winter than during the ter season. Weak interannual tropical water vapor anomalies summer. are found for the warm easterly case and the cold westerly Near the tropopause (110–90 hPa), both ENSO and QBO case due to the compensating effects of ENSO and QBO. as well as their seasonal changes are important for the in- This emphasized the importance of the interaction of ENSO terannual tropical water vapor anomalies. ENSO explains and QBO phases in controlling the tropical tropopause water ∼ 8 %, while QBO explains ∼ 46 % of the interannual tropi- vapor anomalies. cal water vapor variance under the strong assumption that the In the lower and middle stratosphere (80–6 hPa), QBO and UTLMS water vapor interannual anomaly is a linear func- its seasonal change contribute significantly to the interannual tion of ENSO or QBO index with a Gaussian distribution. monthly water vapor anomalies, while the ENSO’s effect is ENSO can modulate the tropical tropopause water vapor negligible. QBO explains ∼ 50 %–60 %, in contrast to ∼ 2 % through the convective transport of tropospheric water va- by ENSO, of the interannual tropical water vapor variance Atmos. Chem. Phys., 19, 9913–9926, 2019 www.atmos-chem-phys.net/19/9913/2019/
E. W. Tian et al.: The interannual variations of water vapor in the tropical UTLMS                                                       9923

under the strong assumption that the UTLMS water vapor                  Author contributions. JHJ, HS, and BT designed this study. EWT
interannual anomaly is a linear function of ENSO or QBO                 performed the data analysis and prepared the figures. All the authors
index with a Gaussian distribution. QBO modulates the trop-             contributed to the discussion of the results and the preparation of the
ical lower and middle stratospheric water vapor mainly by               manuscript.
its modulation of the tropical tropopause temperature. Dur-
ing the westerly QBO phase, interannual tropical water va-
por anomalies are positive near the tropopause and in the               Competing interests. The authors declare that they have no conflict
                                                                        of interest.
lower stratosphere (below ∼ 50 hPa altitude), negative in the
lower and middle stratosphere (between ∼ 50 and ∼ 20 hPa
altitude), and positive again in the middle stratosphere (above
                                                                        Acknowledgements. This research was performed at the Jet Propul-
∼ 20 hPa altitude) for all seasons. The opposite occurs during          sion Laboratory, California Institute of Technology (Caltech), un-
the easterly QBO phase. There are some small differences                der a contract with the National Aeronautics and Space Administra-
in interannual tropical water vapor anomalies between warm              tion. The authors thank Andrew Dessler, Michaela Hegglin, and two
and cold ENSO phases and between the summer and winter                  anonymous referees for their constructive and insightful comments
seasons.                                                                that helped to improve the quality of this paper. The first author also
   In summary, ENSO has a strong impact on the interannual              thanks Matthew Worden for his help with the MATLAB code.
variations of tropical water vapor below 90 hPa altitude, i.e.,
in the upper troposphere and at the tropopause. On the other
hand, QBO has a large impact on the interannual variations              Financial support. This research has been supported by the Aura
of tropical water vapor above 110 hPa, i.e., at the tropopause          Microwave Limb Sounder project at JPL.
and in the lower and middle stratosphere. ENSO and QBO
together can explain more than half (∼ 50 %–60 %) but not
all the interannual variations of the tropical UTLMS water              Review statement. This paper was edited by Gabriele Stiller and re-
vapor. Nonlinear ENSO–QBO interactions and other physi-                 viewed by two anonymous referees.
cal processes (e.g., BDC) as well as their interactions may be
considered in future investigations in order to fully explain
the interannual variability of the tropical UTLMS water va-
                                                                        References
por.
   The findings in the current study are generally consistent           Avery, M. A., Davis, S. M., Rosenlof, K. H., Ye, H., and Dessler,
with those from previous studies (e.g., Dessler et al., 2014;             A. E.: Large anomalies in lower stratospheric water vapour and
Diallo et al., 2018; Ding and Fu, 2018; Liang et al., 2011;               ice during the 2015–2016 El Nino, Nature Geosci., 10, 405–409,
Tweedy et al., 2017; Ye et al., 2018). However, the relative              https://doi.org/10.1038/ngeo2961, 2017.
roles of ENSO and QBO in the tropical UTLMS water va-                   Baldwin, M. P., Gray, L. J., Dunkerton, T. J., Hamilton, K., Haynes,
por interannual variabilities for the entire UTLMS layer and              P. H., Randel, W. J., Holton, J. R., Alexander, M. J., Hirota, I.,
at different phase lags and different pressure levels are more            Horinouchi, T., Jones, D. B. A., Kinnersley, J. S., Marquardt, C.,
completely investigated in the current study than the previ-              Sato, K., and Takahashi, M.: The quasi-biennial oscillation, Rev.
ous ones. In addition, this study provides direct empirical               Geophys., 39, 179–229, https://doi.org/10.1029/1999rg000073,
                                                                          2001.
evidence to support a belief that the QBO impacts the tropi-
                                                                        Brewer, A. W.: Evidence for a world circulation provided by
cal UTLMS water vapor mainly through its influence on the
                                                                          the measurements of helium and water vapour distribution
tropical tropopause temperature. These results can serve as               in the stratosphere, Q. J. Roy. Meteor. Soc., 75, 351–363,
an important benchmark for future climate model evaluation                https://doi.org/10.1002/qj.49707532603, 1949.
studies.                                                                Butchart, N.: The Brewer-Dobson circulation, Rev. Geophys., 52,
                                                                          157–184, https://doi.org/10.1002/2013rg000448, 2014.
                                                                        Calvo, N., Garcia, R. R., Randel, W. J., and Marsh, D.
Data availability. The MLS water vapor data used in this research         R.: Dynamical Mechanism for the Increase in Tropical
are freely available through the Aura MLS project website (https://       Upwelling in the Lowermost Tropical Stratosphere dur-
mls.jpl.nasa.gov, last access: 5 August 2019, Read et al., 2017). The     ing Warm ENSO Events, J. Atmos. Sci., 67, 2331–2340,
multivariate ENSO indices used in this research are freely available      https://doi.org/10.1175/2010jas3433.1, 2010.
from the NOAA Earth System Research Laboratory (ESRL) web-              Choi, W., Lee, H., Grant, W. B., Park, J. H., Holton, J. R., Lee, K.
site (https://www.esrl.noaa.gov/psd/enso/mei/data/meiv2.data, last        M., and Naujokat, B.: On the secondary meridional circulation
access: 5 August 2019, Wolter and Timlin, 2011). The 50 hPa               associated with the quasi-biennial oscillation, Tellus B, 54, 395–
QBO indices used in this research are also freely available from          406, https://doi.org/10.1034/j.1600-0889.2002.201286.x, 2002.
the NOAA NCEP Climate Prediction Center (CPC) website (http:            Dessler, A. E., Schoeberl, M. R., Wang, T., Davis, S. M.,
//www.cpc.ncep.noaa.gov/data/indices/qbo.u50.index, last access:          and Rosenlof, K. H.: Stratospheric water vapor feed-
5 August 2019).                                                           back, P. Nat. Acad. Sci. USA, 110, 18087–18091,
                                                                          https://doi.org/10.1073/pnas.1310344110, 2013.

www.atmos-chem-phys.net/19/9913/2019/                                                      Atmos. Chem. Phys., 19, 9913–9926, 2019
9924 E. W. Tian et al.: The interannual variations of water vapor in the tropical UTLMS Dessler, A. E., Schoeberl, M. R., Wang, T., Davis, S. M., Rosenlof, Huang, B., L’Heureux, M., Hu, Z.-Z., and Zhang, H.-M.: K. H., and Vernier, J. P.: Variations of stratospheric water vapor Ranking the strongest ENSO events while incorporat- over the past three decades, J. Geophys. Res., 119, 12588–12598, ing SST uncertainty, Geophys. Res. Lett., 43, 9165–9172, https://doi.org/10.1002/2014jd021712, 2014. https://doi.org/10.1002/2016gl070888, 2016. Diallo, M., Riese, M., Birner, T., Konopka, P., Müller, R., Hegglin, Jiang, J. H., Su, H., Zhai, C. X., Perun, V. S., Del Genio, A., M. I., Santee, M. L., Baldwin, M., Legras, B., and Ploeger, F.: Nazarenko, L. S., Donner, L. J., Horowitz, L., Seman, C., Cole, Response of stratospheric water vapor and ozone to the unusual J., Gettelman, A., Ringer, M. A., Rotstayn, L., Jeffrey, S., Wu, timing of El Niño and the QBO disruption in 2015–2016, Atmos. T. W., Brient, F., Dufresne, J. L., Kawai, H., Koshiro, T., Watan- Chem. Phys., 18, 13055–13073, https://doi.org/10.5194/acp-18- abe, M., Lecuyer, T. S., Volodin, E. M., Iversen, T., Drange, H., 13055-2018, 2018. Mesquita, M. D. S., Read, W. G., Waters, J. W., Tian, B. J., Ding, Q. H. and Fu, Q.: A warming tropical central Pacific Teixeira, J., and Stephens, G. L.: Evaluation of cloud and wa- dries the lower stratosphere, Clim. Dynam., 50, 2813–2827, ter vapor simulations in CMIP5 climate models using NASA https://doi.org/10.1007/s00382-017-3774-y, 2018. “A-Train” satellite observations, J. Geophys. Res., 117, D14105, Flury, T., Wu, D. L., and Read, W. G.: Correlation among cirrus ice https://doi.org/10.1029/2011jd017237, 2012. content, water vapor and temperature in the TTL as observed by Jiang, J. H., Su, H., Zhai, C. X., Wu, L. T., Minschwaner, CALIPSO and Aura/MLS, Atmos. Chem. Phys., 12, 683–691, K., Molod, A. M., and Tompkins, A. M.: An assessment https://doi.org/10.5194/acp-12-683-2012, 2012. of upper troposphere and lower stratosphere water vapor in Forster, P. M. D. and Shine, K. P.: Stratospheric water vapour MERRA, MERRA2, and ECMWF reanalyses using Aura changes as a possible contributor to observed strato- MLS observations, J. Geophys. Res., 120, 11468–11485, spheric cooling, Geophys. Res. Lett., 26, 3309–3312, https://doi.org/10.1002/2015jd023752, 2015. https://doi.org/10.1029/1999GL010487, 1999. Kawatani, Y., Lee, J. N., and Hamilton, K.: Interannual Varia- Fueglistaler, S. and Haynes, P. H.: Control of interannual and tions of Stratospheric Water Vapor in MLS Observations and longer-term variability of stratospheric water vapor, J. Geophys. Climate Model Simulations, J. Atmos. Sci., 71, 4072–4085, Res., 110, D24108, https://doi.org/10.1029/2005jd006019, 2005. https://doi.org/10.1175/jas-d-14-0164.1, 2014. Fueglistaler, S., Dessler, A. E., Dunkerton, T. J., Folkins, I., Fu, Q., Kiladis, G. N., Straub, K. H., Reid, G. C., and Gage, K. S.: Aspects and Mote, P. W.: Tropical tropopause layer, Rev. Geophys., 47, of interannual and intraseasonal variability of the tropopause and RG1004, https://doi.org/10.1029/2008rg000267, 2009. lower stratosphere, Q. J. Roy. Meteor. Soc., 127, 1961–1983, Fujiwara, M., Vomel, H., Hasebe, F., Shiotani, M., Ogino, S. https://doi.org/10.1256/smsqj.57605, 2001. Y., Iwasaki, S., Nishi, N., Shibata, T., Shimizu, K., Nishi- Konopka, P., Ploeger, F., Tao, M. C., and Riese, M.: Zonally re- moto, E., Canossa, J. M. V., Selkirk, H. B., and Oltmans, solved impact of ENSO on the stratospheric circulation and wa- S. J.: Seasonal to decadal variations of water vapor in the ter vapor entry values, J. Geophys. Res., 121, 11486–11501, tropical lower stratosphere observed with balloon-borne cryo- https://doi.org/10.1002/2015jd024698, 2016. genic frost point hygrometers, J. Geophys. Res., 115, D18304, Lambert, A., Read, W. G., Livesey, N. J., Santee, M. L., Manney, https://doi.org/10.1029/2010jd014179, 2010. G. L., Froidevaux, L., Wu, D. L., Schwartz, M. J., Pumphrey, H. Geller, M. A., Zhou, X. L., and Zhang, M. H.: Simulations C., Jimenez, C., Nedoluha, G. E., Cofield, R. E., Cuddy, D. T., of the interannual variability of stratospheric water vapor, Daffer, W. H., Drouin, B. J., Fuller, R. A., Jarnot, R. F., Knosp, J. Atmos. Sci., 59, 1076–1085, https://doi.org/10.1175/1520- B. W., Pickett, H. M., Perun, V. S., Snyder, W. V., Stek, P. C., 0469(2002)0592.0.Co;2, 2002. Thurstans, R. P., Wagner, P. A., Waters, J. W., Jucks, K. W., Toon, Gettelman, A., Randel, W. J., Massie, S., Wu, F., Read, G. C., Stachnik, R. A., Bernath, P. F., Boone, C. D., Walker, K. W. G., and Russell, J. M.: El Nino as a natural ex- A., Urban, J., Murtagh, D., Elkins, J. W., and Atlas, E.: Validation periment for studying the tropical tropopause region, of the Aura Microwave Limb Sounder middle atmosphere water J. Climate, 14, 3375–3392, https://doi.org/10.1175/1520- vapor and nitrous oxide measurements, J. Geophys. Res., 112, 0442(2001)0142.0.co;2, 2001. D24S36, https://doi.org/10.1029/2007jd008724, 2007. Hegglin, M. I., Tegtmeier, S., Anderson, J., Froidevaux, L., Fuller, Liang, C. K., Eldering, A., Gettelman, A., Tian, B., Wong, S., R., Funke, B., Jones, A., Lingenfelser, G., Lumpe, J., Pendlebury, Fetzer, E. J., and Liou, K. N.: Record of tropical interan- D., Remsberg, E., Rozanov, A., Toohey, M., Urban, J., von Clar- nual variability of temperature and water vapor from a com- mann, T., Walker, K. A., Wang, R., and Weigel, K.: SPARC Data bined AIRS-MLS data set, J. Geophys. Res., 116, D06103, Initiative: Comparison of water vapor climatologies from inter- https://doi.org/10.1029/2010jd014841, 2011. national satellite limb sounders, J. Geophys. Res., 118, 11824– Liess, S. and Geller, M. A.: On the relationship between QBO and 11846, https://doi.org/10.1002/jgrd.50752, 2013. distribution of tropical deep convection, J. Geophys. Res., 117, Hegglin, M. I., Plummer, D. A., Shepherd, T. G., Scinocca, J. F., D03108, https://doi.org/10.1029/2011jd016317, 2012. Anderson, J., Froidevaux, L., Funke, B., Hurst, D., Rozanov, Lindzen, R. S. and Holton, J. R.: A theory A., Urban, J., von Clarmann, T., Walker, K. A., Wang, H. J., of quasi-biennial oscillation, J. Atmos. Sci., Tegtmeier, S., and Weigel, K.: Vertical structure of stratospheric 25, 1095–1107, https://doi.org/10.1175/1520- water vapour trends derived from merged satellite data, Nat. 0469(1968)0252.0.co;2, 1968. Geosci., 7, 768–776, https://doi.org/10.1038/ngeo2236, 2014. Liu, R., Su, H., Liou, K. N., Jiang, J. H., Gu, Y., Liu, S. C., and Held, I. M. and Soden, B. J.: Water vapor feedback and Shiu, C. J.: An Assessment of Tropospheric Water Vapor Feed- global warming, Annu. Rev. Energ. Env., 25, 441–475, back Using Radiative Kernels, J. Geophys. Res., 123, 1499– https://doi.org/10.1146/annurev.energy.25.1.441, 2000. 1509, https://doi.org/10.1002/2017jd027512, 2018. Atmos. Chem. Phys., 19, 9913–9926, 2019 www.atmos-chem-phys.net/19/9913/2019/
You can also read