JANUARY 2021 - Observer Research Foundation
←
→
Page content transcription
If your browser does not render page correctly, please read the page content below

Occasional Paper No. 293

                                                                          JANUARY 2021
                           © 2021 Observer Research Foundation. All rights reserved. No part of this publication
                             may be reproduced, copied, archived, retained or transmitted through print, speech
                                                 or electronic media without prior written approval from ORF.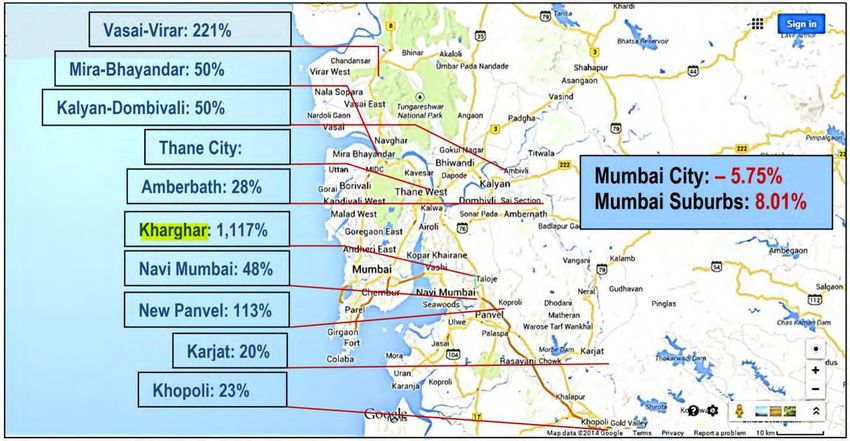
Towards Zero Deaths:
 Imperatives for Safer
 Indian Railways
 Dhaval Desai
 Senior Fellow and Vice President at ORF, Mumbai.

 Abstract
 In 2019, the Indian Railways (IR) recorded zero fatalities from accidents caused by operational
 errors. However, many people continue to meet with train-related mishaps that are beyond the
 IR’s control; many of these accidents result in death. The IR’s experience in preventing deaths in
 accidents caused by operational errors (technically called “consequential accidents”) offers lessons
 on minimising all railways-related fatalities. This paper studies Mumbai’s suburban railway
 network, which accounts for 27 percent of deaths from accidents, and the strategies its officials
 have employed to improve safety. It finds that state governments and local bodies must cooperate
 with the IR to implement long-term and sustainable solutions to prevent deaths in railway-related
 incidents.

Attribution: Dhaval Desai, “Towards Zero Deaths: Imperatives for Safer Indian Railways,” ORF Occasional Paper No. 293,
January 2021, Observer Research Foundation.
I
                       n 2019-2020, the Indian Railways (IR) recorded zero fatalities due to
                       “consequential accidents”—incidents caused by operational lapses, such
                       as derailments, collisions and fires.1 However, since 2017, about 10,000
                       people have lost their lives each year in other railway-related “untoward
                       incidents” that happen due to factors which, according to the IR, are
               beyond its control.2 These accidents include people falling off the tracks or
               trespassers being knocked down by running trains or hit by poles while hanging
               off overcrowded trains. The government think tank NITI Aayog has questioned
               the IR’s claims of “zero deaths”, given the high death rate due to untoward
               incidents—explicitly referring to Mumbai’s suburban railway services. It urged
               IR officials to include such incidents in its purview.3

                The Ministry of Railways’ High-Level Safety Review Committee (HLSRC)
               raised a similar concern in February 2012. The HLSRC had referred to the
               casualties on Mumbai’s suburban railway services as a “massacre which no
               civilised society can accept,” and stressed that the “reluctance of Indian Railways
               to own these casualties, which do
               not fall under the purview of train
               accidents but are nevertheless
               accidents on account of trains can         Since 2017, 10,000
               by no means be ignored.”4
                                                          people in India have
                                                          lost their lives each
Introduction

                 Although the Railway Board
               reiterated to the NITI Aayog that
               no deaths were recorded in 2019-
                                                            year in railway-
               20 in “consequential” accidents,            related accidents.
               it acknowledged that up to 30,000
               people have died in “untoward
               incidents” in the past three years5
               and said that such fatal mishaps “happened primarily due to negligence or
               carelessness on the part of the passengers/public.”6 Given the IR’s stance, these
               numbers remain cold data in the death registers of the Government Railway
               Police (GRP) and Railway Protection Force, and there is little effort to prevent
               the occurrence of such events.

                                  3
T
                                           he IR defines consequential accidents as “train accidents having
                                           serious repercussion in terms of loss of human life, human injury,
                                           loss to railway property or interruption to rail traffic” over the
                                           specified thresholds (for losses to railway property and traffic
                                           interruptions).7 Consequential accidents are categorised as:
                            derailments; manned and unmanned level crossing accidents; collisions; fire/
Enhancing Railway Safety:

                            explosion-related accidents; and miscellaneous/others, including accidents
                            caused by natural elements.8

                              Between 2010-11 and 2019-20, derailments (55 percent) and level crossing-
                            related mishaps (36 percent) accounted for over 90 percent11 of all fatalities
                            caused by consequential accidents
                            (see Table 1).12
                                                                      The railway ministry
                             Over the 2010-17 period, for which
Towards Zero Deaths

                            all-India data on deaths caused in
                                                                         has pledged to
                            consequential accidents is available,         eliminate all
                            being run over by speeding trains
                            at manned and unmanned level              operational accidents
                            crossings led to the highest number             by 2020.
                            of fatalities (863) among the 1711
                            deaths recorded (see Table 2).13

                             Between 2012-13 and 2016-17, 1,634 people were injured in consequential
                            accidents, with about 57 percent of injuries caused by train derailments (see
                            Table 3).15

                             Given the high number of fatalities and injuries due to operational lapses, it
                            was imperative for the IR to accord top priority to reducing and preventing
                            consequential accidents.

                              Although the Special Railway Safety Fund was established in 2001 as a non-
                            lapsable fund to wipe out the arrears in pending safety enhancement works,17 the
                            big push towards reducing the number of accidents came in December 2009 with
                            the introduction of the railway ministry’s Vision 2020 document that pledged to
                            eliminate all consequential accidents by 2020.18 In 2011, the ministry constituted
                            the HLSRC to examine all technical and technology-related aspects to ensure
                            accident-free train operations. In its report submitted in 2012, the HLSRC
                            suggested a slew of safety enhancement measures, seeking an investment of INR
                            1 trillion.19 An expert committee constituted by the railway ministry in 2011 to
                            prepare a roadmap for the modernisation of IR operations estimated investment
                            of INR 400 billion to enhance operational safety.20 However, the IR faced severe
                            funding constraints in adopting both committees’ recommendations.

                                               4
Table 1:
        Consequential accidents by category
        (2010-2020)
         Description

                       2010-11

                                 2011-12

                                           2012-13

                                                     2013-14

                                                                   2014-15

                                                                             2015-16

                                                                                       2016-17

                                                                                                 2017-18

                                                                                                           2018-19

                                                                                                                     2019-20

                                                                                                                               Total
 Derailments           80        55        49        53            63        65        78        53        46        29        571
 Manned level
                       5         7         5         4             6         6         0
 crossing
                                                                                                 13        6         1         354
 Unmanned
                       48        54        53        47            50        29        20
 level crossing
 Collisions            5         9         6         4             5         3         5         3         0         3         43
 Fire                  2         4         9         7             6         0         1         3         6         7         45
 Others                1         2         0         3             5         4         0         0         1         1         17
 Total                 141       131       122       118           135       107       104       72        59        41        1030

Source: NITI Aayog9 and Press Information Bureau10

                                                               5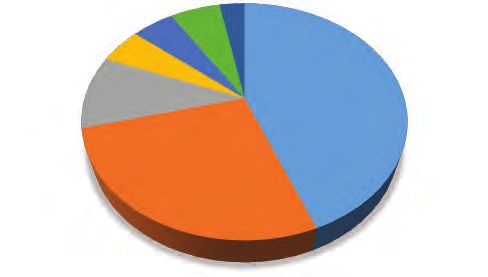
Table 2:
        Deaths caused by consequential accidents by
        category (2010-17)
          Description

                        2010-11

                                  2011-12

                                            2012-13

                                                      2013-14

                                                                2014-15

                                                                          2015-16

                                                                                    2016-17

                                                                                              Total
 Derailments              4        73         5         6       104        36       196       424
 Manned LC                7         6        18         6        31        12         0        80
 Unmanned LC            130       204       123        98       130        58        40       783
 Collisions             240        22        27         1        15         1         5       311
 Fire                     0         9        31        35         0         0         0        75
 Others                   0         5         0         6        12        15         0        38
 Total casualties       381       319       204       152       292       122       241       1711

Source: NITI Aayog14

                                              6
Table 3:
Injuries caused by consequential accidents by
category (2012-17)
Description
2012-13
2013-14
2014-15
2015-16
2016-17
Total
Derailments 159 93 265 100 327 944
Manned LC 25 2 21 10 0 58
Unmanned LC 81 116 85 41 19 342
Collisions 76 7 58 12 28 181
Fire 40 6 0 0 0 46
Others 0 10 28 25 0 63
Total injuries 381 234 457 188 374 1634
Source: NITI Aayog16
7The 12th report of the Parliamentary Standing Committee on Railways,
presented to both houses of parliament in December 2016, reiterated the intent
to prioritise railway safety and tackle it “promptly, precisely and diligently”.21 The
standing committee recommended a separate department to oversee railway
safety, as “inter-disciplinary methods of dealing with this aspect at micro-level
only serves to reduce its efficiency, resulting in delayed response and compromises
Enhancing Railway Safety:
on safety”.22 Subsequently, an internal railway ministry panel recommended an
investment of INR 1.54 trillion for safety enhancements,23 INR 1.19 trillion of
which was to be raised through the Rashtriya Rail Sanraksha Kosh (RSSK), a
separate national corpus, and the rest to be contributed by the IR. The RRSK
was established in 2017 with an initial corpus of INR 1 trillion for five years,
with an annual allocation of INR 200 billion.24
NITI Aayog prepared a fund allocation roadmap for the RRSK25 based on a
comprehensive assessment of consequential accident data and department-wise
Towards Zero Deaths
responsibility. Funding to IR directorates and functions found accountable for
derailments and level crossing accidents was prioritised.
The IR follows an established process for cause analysis (to identify and fix
responsibility) and to determine system deficiencies after a consequential
accident. The directorate-wise responsibilities26 are categorised as:27
1. Failure of railway staff: Accidents caused by lapses by railway personnel
2. Failure other than railway staff (FORS): Involving trespassing and level
crossing accidents
3. Failure of equipment
a. Rolling stock: related to the Mechanical Directorate (for instance,
locomotives, coaches/wagons and wheels)
b. Track: generally associated with lapses of the Engineering Directorate
(for example, rail fractures)
c. Electrical: usually involving the Electrical Directorate (for instance,
failure of overhead equipment, electrical multiple units, or EMUs, and
e-locomotives)
d. Signalling and telecommunications: Related with IR’s Signalling
and Telecommunications Directorate (for instance, signalling and
communications systems failure)
84. Traffic and Commercial: All accidents related to lapses, such as defective
loading and unloading, and train operations with improper route setting
and securing
5. Incidental: Accidents on account of natural or human-made factors, such as
landslides, floods, earthquake or sabotage.
Enhancing Railway Safety:
The FORS (44 percent) and the Electrical Directorate (27 percent) had the
highest responsibility share of the 586 accidents recorded between 2012-13 and
2016-17 (see Figure 1).28
NITI Aayog found human failure, including the fault of railway staff, to have
caused 87 percent of the 586 consequential accidents recorded between 2012-
13 and 2016-17. Year-on-year, the share of fault of railway staff in accidents
grew incrementally.30
Towards Zero Deaths
Safety-related priority projects were identified based on this responsibility
matrix. For the 2017-19 period, RRSK funds (INR 400 billion) have been
allocated as per the finance ministry’s ‘Guidelines for Operating Rashtriya Rail
Sanraksha Kosh’,31 with the IR utilising INR 340.91 billion for priority works
aimed at strengthening and upgrading traffic facilities, rolling stock, tracks, signal
and telecommunication networks, and constructing road over/under bridges at
level crossings.32 The utilisation of funds is periodically reviewed by an RRSK
monitoring committee chaired by the NITI Aayog CEO, and annually by the
Cabinet Committee on Economic Affairs headed by the Prime Minister.33
The IR has made targeted interventions to reduce fatalities caused by derailments
and level crossing accidents, and to address lapses by railway staff through skills
enhancement. Over 300,000 non-gazetted officers across the country have been
trained through a refresher course,34,35 and the IR has eliminated all unmanned
level crossings across its broad gauge and has removed 6,145 manned and
unmanned level crossings on its other route classifications.36,37,38 Many of the
conventional coaches manufactured by the Integral Coaches Factory have been
Human failure caused 87 percent
of the 586 consequential accidents
recorded between 2012-13 and
2016-17.
9Figure 1:
Directorate-wise responsibility for
consequential accidents (2012-13 to 2016-17)
6% 3%
5%
5%
44%
10%
27%
Failure other than railway staff (44%) Engineering Directorate (27%)
Mechanical Directorate (10%) Electrical Directorate (5%)
Traffic & Commercial (5%) Incidental (6%)
Signalling & Telecommunications (3%)
Source: NITI Aayog 29
10replaced with the technologically-superior Linke Hofmann Busch coaches,
which offer better safety, stability and speed (1,469 coaches were introduced in
2016-17, 2,480 in 2017-18 and 4,429 in 2018-19).39
Additionally, the RRSK funds have been utilised for anti-collision systems,
centralised traffic control, train management systems, signalling, bridge
Enhancing Railway Safety:
inspection and management, increased night-time footplate inspection, and
public engagement through safety awareness campaigns.40
Improved cooperation between the IR’s departments and coordination
between the IR and state governments and local bodies has resulted in a decline
in casualties at level crossings. Fatalities due to vehicles or people being run over
by trains at level crossings have declined, from 3,347 in 201041 to 1,762 in 201942
(see Table 4). However, the decline has been inconsistent and still constitutes
about 7 percent of all railway-related accidental deaths.
Towards Zero Deaths
According to National Crime Records Bureau (NCRB) data on accidental
deaths between 2010 and 2019, 252,655 lives were lost to ‘railway accidents’
other than those at level crossings, such as people falling from overcrowded
trains; being hit by poles while hanging out of overcrowded trains; falling in gaps
between the railway coach footboard and the platform; and trespassing on tracks
within the railway station areas, at level crossings and on mid-sections (tracks in
between two stations) along the rail network (see Table 4).
According to NCRB data, in 2019, the death toll from train-related accidents
was 70 per day, a figure nearly six times higher than the Railway Board’s
assessment of up to 10,000 deaths per year.53 The NCRB data does not
differentiate between people committing suicide by coming under running trains
and road vehicles. Of the 6,68,157 suicides recorded by the NCRB across India
between 2015 and 2019, 2.52 percent (17,223) were by people coming under
running trains and road vehicles. The IR cannot be held responsible for suicidal
deaths, and so the NCRB must seek bifurcated data from the states for a more
precise analysis of railway-related deaths due to untoward incidents.
Improved cooperation between the
IR’s departments and coordination
between the IR and state
governments and local bodies has
resulted in a decline in casualties.
11Table 4:
Deaths by railway-related accidents
(2010-19)
Other % of level
Level railway crossing deaths
Year crossing accidental Total of total railway
deaths deaths mishaps
201043 3,347 24,451 27,798 12.04
201144 2,366 25,872 28,238 8.38
201245 1,808 27,402 29,210 6.19
2013 46 1,318 27,765 29,083 4.53
201447 2,575 25,006 27,581 9.33
201548 2,650 26,066 28,716 9.22
201649 3,133 22,970 26,103 12
201750 1,534 23,959 25,493 6.01
201851 1,507 24,545 26,052 5.78
201952 1,762 24,619 26,381 6.67
Total 22,000 252,655 274,655 8.01
Source: Compiled by the author from NCRB’s ‘Accidental Deaths and Suicides in India’ reports of respective years.
12According to NCRB data, 166,533 railway accidents were reported across India
between 2014 and 2019; over 71 percent of these mishaps involved instances of
people falling off running trains or trains running over people on the tracks (see
Table 5).
Fatalities from trespassing continue to remain high along the mid-sections. The
Enhancing Railway Safety:
absence of foot overbridges or subways for safe passage across railway tracks has
meant that people have no alternative but to trespass on the tracks to cross over.
The Mumbai metropolitan region (MMR), which is served by the suburban
services of the Western Railway (WR) and Central Railway (CR) zones of the
IR, illustrates how the lack of appropriate infrastructure (foot overbridges) results
in avoidable casualties from trespassing.
The Mumbai suburban railway system (MSRS) ferries nearly eight million
commuters daily,60 or about 2.92 billion commuters annually. Covering 413
Towards Zero Deaths
route kilometres,61 the MSRS constitutes a minuscule 0.6 percent of the IR’s
national network, which, spread over 68,443 route kilometres,62 is the world’s
third largest railway system.63 The MSRS comprises 65.61 percent of the total
annual ridership of 4.45 billion logged by the IR’s suburban services.64
Of the approximate 30,000 deaths over the last three years that have been
acknowledged by the Railway Board as being caused by ‘untoward incidents,’
over 27 percent occur on the MSRS. Given that the MSRS records nearly one-
third of the countrywide deaths due to ‘untoward incidents’ despite being only
a fraction of the national railway network, it is a true reflection of the problem’s
magnitude.
7 of every 10 of all railway
mishaps from 2014 to 2019
involved people falling off running
trains or trains running over
people on the tracks.
13Table 5:
‘Untoward’ railway accidents
(2014-19)
Falling from trains % of total
Railway
Year and getting run over railway
Accidents by trains accidents
201454 28,360 17,480 61.6
201555 29,419 21,339 72.5
201656 25,927 19,160 73.9
201757 27,197 19,370 71.2
201858 27,643 18,894 68.4
201959 27,987 21,361 76.3
Total 166,533 117,604 70.5
Source: Compiled by the author from NCRB’s ‘Accidental Deaths and Suicides in India’ reports of respective years.
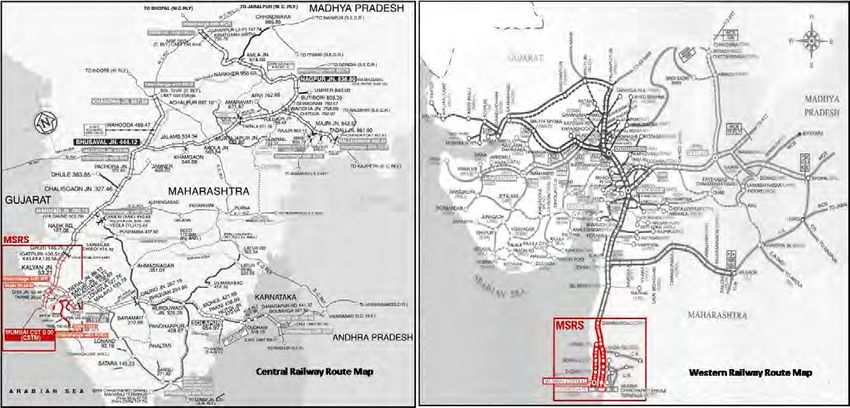
14Cumulative data on deaths on the MSRS between 2010 and 2019 shows that,
on average, nine people have died each day in railway-related mishaps (see Table
6). On average, there have been 3,280 deaths per year, but the year-on-year loss
of life has declined since 2012.
The CR and WR have made several interventions for capacity and safety
enhancements under the Mumbai Urban Transport Project (MUTP) since
2002, which has led to a decline in fatality numbers. But even in 2019, when the
Suburban Railway System
IR achieved its target of zero deaths from consequential accidents, the MSRS
recorded over seven deaths per day (see Table 6). Assuming the pace and scale
of such interventions remain the same as in the past, applying the arithmetic
progression formula suggests that minimising the death count to only extreme
factors such as suicides, natural disasters and sabotage will take over 40 years
(see Figure 2).
Case Study: Mumbai
Although the number of fatalities has declined, the causes of deaths on the
MSRS have essentially remained constant (see Figure 3).
Furthermore, these fatality numbers do not include the railway officials,
gangmen and police personnel who die while on duty. According to joint CR
and WR data, between 2009 and 2013, 139 track maintainers or gangmen died
on the MSRS,67 rising to 150 by February 2016.68
Train accidents caused by ‘untoward incidents’ cause grievous injuries to a larger
number of people. According to GRP data, between 2013 and 2018, more than
20,000 people were injured on the MSRS.69 While fatalities have declined marginally
over the past decade, injury numbers have remained somewhat constant, with
an average of 3,337 injuries caused between 2013 and 2018 (see Table 7).70
Most people who fall off high-speed trains or are knocked down by a fully loaded
freight/passenger/EMU rake suffer severe injuries and may be maimed for life.
There is a high societal, economic and opportunity cost for each life lost and
every injury. If the number of victims who succumb to injuries after admission
in hospitals is tallied, the death toll from train accidents will rise considerably.
But these numbers remain documented as ‘injuries’ in official records.
On average, nine people died each
day in railway-related mishaps on
the MSRS between 2010 and 2019.
15Table 6:
Deaths on Mumbai Suburban Railway
System (2010-2019)
Fallen in platform
Trespass deaths
Total CR+WR
Deaths per day
Track crossing
Railway Zone
running train
Dashing with
as % of total
Fallen from
Others*
deaths
poles
Year
gap
Central 1323 2 519 5 472 2321 6.4
2010 Western 829 4 215 8 333 1389 3.8 58.01%
Total 2152 6 734 13 805 3710 10.2
Central 1207 2 513 10 413 2145 5.9
2011 Western 816 4 223 12 258 1313 3.6 58.50%
Total 2023 6 736 22 671 3458 9.5
Central 1261 6 566 12 452 2297 6.3
2012 Western 718 15 268 8 235 1244 3.4 55.89%
Total 1979 21 834 20 687 3541 9.7
Central 1174 6 591 4 495 2270 6.2
2013 Western 652 13 310 4 257 1236 3.4 52.08%
TOTAL 1826 19 901 8 752 3506 9.6
Central 1216 9 552 2 442 2221 6.1
2014 Western 696 25 245 9 227 1202 3.3 55.86%
TOTAL 1912 34 797 11 669 3423 9.4
Central 1197 12 545 6 427 2187 6.0
2015 Western 604 28 261 7 217 1117 3.1 54.51%
TOTAL 1801 40 806 13 644 3304 9.1
16Fallen in platform
Trespass deaths
Total CR+WR
Deaths per day
Track crossing
Railway Zone
running train
Dashing with
as % of total
Fallen from
Others*
deaths
poles
Year
gap
Central 1165 6 446 0 497 2114 5.8
2016 Western 633 7 211 8 229 1088 3.0 56.15%
TOTAL 1798 13 657 8 726 3202 8.8
Central 1074 5 407 2 440 1928 5.3
2017 Western 577 13 247 10 239 1086 3.0 54.78%
TOTAL 1651 18 654 12 679 3014 8.3
Central 1022 3 482 9 417 1933 5.3
2018 Western 597 3 229 10 209 1048 2.9 54.31%
TOTAL 1619 6 711 19 626 2981 8.2
Central 1763
1455 1236 7.4 54.07%
2019 Western 928
TOTAL 2691
Total deaths on MSRS (2010-2019) 32830 9 55.42%
Include deaths due to suicides, electric shocks, suicides and natural deaths due to illness.
*
Source: Hindustan Times65 for 2019 data and Mumbai GRP data of respective years accessed by the author.
17Figure 2:
Deaths on Mumbai Suburban Railway
System (2010-19)
Source: Based on CR and WR data accessed by the author
Figure 3:
Causes of deaths on MSRS
(2010-2018)
Others*
(20.76%)
Dashing against
poles (0.4%)
Trespassing
(56%)
Falling from
running trains
(22.66%)
Falling in platform gaps
(0.54%)
Includes deaths due to suicides, electric shocks, suicides and natural deaths due to illness.
*
Source: Mumbai GRP data accessed by the author.66
18Accidents like falling off trains or into the gap between the platform and train
footboard, and hitting signal poles occur primarily due to severe overcrowding.
Despite the MSRS augmenting passenger capacity by 33 percent over the past
decade by replacing the existing nine-car rakes with 12-car ones,72 overcrowding
persists. During peak hours, a 12-car train, with a prescribed carrying capacity
of 3,505 passengers, reportedly ferries over 5,000 people.73 Even the induction
of 15-car rakes, which the IR consider a panacea for overcrowding,74 has not had
the desired outcome. While additional coaches may increase passenger carriage
Suburban Railway System
capacity per rake, the increased headway required by 15-car rakes means fewer
trains can operate simultaneously, resulting in overall lower transport output.
In India, incoming trains are often abruptly moved to a different platform just
before arrival, forcing passengers to use the tracks instead of foot overbridges to
ensure reaching the train on time. Such operational lapses have also resulted in
fatal stampedes on foot overbridges.75,76
Case Study: Mumbai
On the MSRS, too, such ad hoc trespassing is a common phenomenon;
commuters wait on foot overbridges, cramping the narrow walkway, and making
a dash to catch the train once the final arrival platform is announced.
An evaluation of accidental deaths on the MSRS reveals trespassing (55.42
percent) and falling off running trains (22.66 percent) as the two most significant
causes of deaths. This is consistent with NCRB data on nationwide railway
accidents, which has attributed nearly 71 percent of total accidents to instances
of falling off or being run over by trains (see Table 5). Falling from overcrowded
trains was the cause of 49 percent of all injuries on the MSRS, followed by
getting hit by trains while trespassing (13 percent) (see Table 7).
In 2012, a study on reducing trespassing at the 12-most affected stations on the
MSRS—Dadar, Kurla, Kanjurmarg, Thane, Thakurli and Kalyan on the CR;
and Dadar, Kandivali, Borivali, Bhayandar, Vasai Road and Nalasopara on the
WR77—recommended design interventions such as foot overbridges, escalators
and elevators, railings, green patches, concrete walls and the reorganisation of
built spaces and entry and exit gates. At an estimated overall cost of INR 1.30
billion,78 the project was funded by the savings from the World Bank loan for the
second phase of the MUTP. In 2018, a situational analysis by the Mumbai Rail
Vikas Corporation (MRVC) to measure the project’s effectiveness found that the
12 stations recorded a 90-percent reduction in trespassing.79
19Table 7:
Injuries on MSRS (2013-2018)
train injuries as
Injuries Per day
Track crossing
Total CR+WR
Railway Zone
running train
Dashing with
platform gap
Falling from
Fallen from
% of total
Fallen in
Others*
injuries
poles
Year
Central 305 4 1082 34 637 2062 5.6
2013 Western 178 13 714 36 315 1256 3.4 54.13%
Total 483 17 1796 70 952 3318 9.1
Central 321 13 1013 44 671 2062 5.6
2014 Western 165 26 701 33 312 1237 3.4 51.96%
Total 486 39 1714 77 983 3299 9.0
Central 305 11 1004 52 728 2100 5.8
2015 Western 163 15 693 37 341 1249 3.4 50.67%
Total 468 26 1697 89 1069 3349 9.2
Central 237 12 786 29 792 1856 5.1
2016 Western 142 7 712 56 590 1507 4.1 55.45%
Total 379 19 1498 85 1382 3363 9.2
Central 241 4 763 30 767 1805 4.9
2017 Western 135 2 671 60 672 1540 4.2 42.87%
Total 376 6 1434 90 1439 3345 9.2
Central 207 5 898 47 763 1920 5.3
2018 Western 116 3 686 43 581 1429 3.9 47.30%
Total 323 8 1584 90 1344 3349 9.2
Total injuries
2515 115 9723 501 7169 20023 9.1 48.58%
(2013-18)
*
Includes deaths due to suicides, electric shocks, suicides and natural deaths due to illness.
Source: Mumbai GRP data of respective years accessed by the author.71
20Figure 4:
Population explosion in MMR
(2010-2011)
Source: Image created by the author from Google Maps using Census 2011 data
21A 2014 study examining 22 heavy trespassing-prone mid-section areas
recommended interventions like constructing 26 new foot overbridges, 36
escalators, 26 elevators and other amenities, at a total estimated cost of INR
3.17 billion.80 The project has since been clubbed with the third phase of the
MUTP.
Boosting MSRS capacity
Suburban Railway System
The complete saturation of the MSRS81 has diminished the efficacy of all
the mega projects aimed at capacity enhancement. With just one Metro line
operational and eight others under construction, the MSRS remains the MMR’s
main transportation lifeline. Even as it has expanded its services to the MMR’s
newer suburbs, the MSRS has struggled to keep pace with the region’s growing
population.82
Case Study: Mumbai
Concerted efforts to improve safety and enhance the commuter experience
on the MSRS came with introducing the MUTP in 2002.83 Initiated jointly
by the IR and Government of Maharashtra with financial assistance from the
World Bank, the MUTP was the city’s first project to find long-term solutions to
Mumbai’s traffic and transportation woes. While the road traffic and transport
component of the MUTP is implemented by the Mumbai Metropolitan Region
Development Authority, the Municipal Corporation of Greater Mumbai and its
subsidiary Brihanmumbai Electric Supply and Transport, the rail component
is implemented by the MRVC. The MRVC was established in 1999 as a joint
venture between the IR and the Maharashtra government with the primary
mandate of executing all MUTP projects.
MUTP-1: The key MSRS-related projects under MUTP’s first phase included
reducing overcrowding by boosting carrying capacity by 35 percent during peak
hours; increasing frequency of train services; converting old trains from DC to
AC power; and optimising all CR and WR suburban railway corridors.84 As part
of the project, 101 EMU rakes were introduced, an additional Borivali-Virar
line on the WR and Kurla-Thane line on the CR were constructed, and the DC-
AC conversion on the WR was completed.85
Various MSRS safety and capacity
enhancement projects have been
initiated under the Mumbai Urban
Transport Project.
22Originally scheduled for conclusion in 2009 at an estimated cost of INR 453
crore, the project ended in late 2011 at a cost of INR 587 crore86 and has been
rated as “moderately satisfactory”.87
MUTP-2: The project’s second phase was jointly conducted by the Maharashtra
government, the World Bank and MRVC. The key objectives were: network and
rolling stock expansion to increase carrying capacity and reduce overcrowding;
service efficiency improvement; and institutional strengthening. The project was
Suburban Railway System
to be implemented in two parts—MUTP-2A and MUTP-2B—at an estimated
cost of INR 53 billion and was scheduled to be completed in 2015.88 While the
MUTP-2A had a World Bank loan component, the MUTP-2B was funded by
the IR and Maharashtra government equally.
The MUTP-2A closed in December 2016. However, several projects under
MUTP-2B, including the construction of the sixth line between Mumbai Central
Case Study: Mumbai
and Borivali and the fifth and sixth lines from Mumbai CST to Kurla—critical
for the segregation of suburban traffic from the long-distance through trains—
are still a work in progress. Thus, many of the perceived benefits of MUTP-2A
could not materialise due to the delays in MUTP-2B.89 The total cost of MUTP-
2 has already touched INR 80.87 billion, according to the MRVC.90,91
The World Bank has criticised these delays, saying that while the demand
has increased since the start of the project, the non-completion of MUTP-2B
has essentially held the entire system back and adversely impacted the project
performance.92 Therefore, “instead of overcrowding in trains decreasing,
crowding has further increased”.93
While the completion of the MUTP-2B is still a few years away, the IR and
Maharashtra government have already approved the third phase of the project.
Split into two sub-projects, the third phase has set more ambitious targets to
decongest and expand the MSRS.
MUTP-3: Sanctioned by the Indian government in December 2016,94 the
MUTP-3 is estimated to cost INR 109.48 billion,95 INR 36 billion of which
will be a loan from the China-led Asian Infrastructure Investment Bank.96 The
project includes mid-section trespass control measures, quadrupling of the
Virar-Dahanu Road line, a new Panvel-Karjat suburban corridor and the Airoli-
Kalwa elevated corridor. With work on the project only starting in 2019, it is
unlikely to meet the 2022 deadline.97
23At the same time, INR 336.90 billion has been sanctioned by the Indian
government for MUTP-3A,98 which is scheduled to be completed by 2025. The
project aims to extend the Harbour Line from Goregaon to Borivali, establish
the fifth and sixth lines of the Borivali-Virar corridor and the fourth line of
the Kalyan-Asangaon corridor, and create a yard in Kalyan to segregate long-
distance and suburban traffic.
The MRVC has also prepared proposals for the fourth phase of the MUTP, to
Suburban Railway System
be implemented in three parts at an estimated cost of INR 290 billion.99
The pending and upcoming instalments of the MUTP are critical to the
MMR’s future needs. However, the implemented phases of the MUTP have
largely failed to prevent the crowd load on local trains, resulting in high fatality
and injury rates.101
Case Study: Mumbai
The MUTP is critical to the
Mumbai Metropolitan Region’ s
future transportation needs.
24Table 8:
MUTP-4 Proposed works and
cost estimates
MUTP-4A (63-km Panvel-Vasai corridor)
Proposed Estimated completion
Description
infrastructure cost (INR billion)
Track gauge 1676 mm (Broad gauge)
Traction system voltage 25 kV AC
Rolling stock Normal EMU, 3600 mm wide 9.78
Number of stations 22 (11 new stations)
Travel time 1 hr 10 min
MUTP-4B (33.8-km CST-Thane underground suburban corridor)
Track gauge 1435 mm (standard gauge)
Traction system voltage 25 kV AC
Rolling stock 3.20 mm wide SS body 155.06
Number of stations 6 (all underground)
Travel time 21 minutes
MUTP-4C (55-km CST-Panvel elevated fast corridor)
Track gauge 1435 mm (standard gauge)
Traction system voltage 25 kV AC
Investment mode Private 123.31
Number of stations 11 (8 elevated, 3 at grade)
Travel time 5 minutes
Total estimated cost of MUTP-4 288.15
Source: MRVC100
25T
he MSRS’s MUTP experience provides many learnings on
enhancing the overall safety of train operations across the IR’s
national network. Several innovative and short-term measures
can prove useful:
Fast-tracking trespass control measures
The IR’s capacity augmentation and safety enhancement projects are clubbed
together under ambitious long-term megaprojects such as the MUTP. While
these projects are significant in
the long-term, the effectiveness of
urgently required interventions is Local authorities and
blunted if there are considerable
time delays. For instance, the mid- state governments
section trespass control project on should work to
the MSRS has been languishing for
Saving Lives on IR
Recommendations:
seven years under MUTP-3. prevent trespassing
The prime function of the
at all mid-section
IR is to run trains, not prevent locations.
trespassing. Providing people with
safe passageway at stations and mid-
sections through foot overbridges
will need close coordination with the central and state governments and other
local bodies. The onus lies with the state and local governments to ensure work
is not held up due to bureaucratic hurdles, lack of finances or a lack of interest.
At the same time, the Railway Board must decentralise. Its zonal/divisional
wings must be empowered to commission all station- and location-specific
interventions independently. The minutes of the 22nd meeting of the ‘Committee
for Effective Development of Mumbai’ held on 14 September 2015 show that
work to eliminate trespassing at 20 mid-section locations on the MSRS was
approved to be “started immediately,”102 but the delay in the initiation of the
MUTP-3 has meant that most of the work is yet to commence.
The onus of preventing trespassing at all mid-section locations lies squarely
with the local authorities and state governments, and must be made part of
urban planning. For instance, the local corporation and state government did
not consider the exponential population growth in the MMR—and the resultant
increased activity on the MSRS—in recent decades in their urban plans, resulting
in the existing foot overbridges and other such amenities being inadequate to
meet the passengers’ needs and leading to a high degree of trespassing.
26Deconstructing Timetables
Reconstructing existing timetables can ensure that trains operate
in a predictable and straightforward pattern with better punctuality.
The high-density sections of the IR’s national network often operate beyond
the prescribed capacity; as of 2015, of the 247 high-density sections, 79 worked
at over 120 percent of the prescribed capacity, while 23 were running at over 150
percent overcapacity.103 This is primarily because all traffic categories (ordinary
passenger trains/locals/freight) ply on the same route with varying speeds and
priorities.104
The saturation of the MSRS is primarily because standard 12-coach rakes jostle
for track space with the long-distance 24-coach trains. Across India, trains operate
with 12, 14, 16 and 18 coaches, running as per varied speed prescriptions.105 The
same routes are also used for freight trains, generally composed of 59 uncovered
wagons or 43 covered wagons.106 Such mixed operations on the same railway
Saving Lives on IR
routes clog the entire network and impact headway, reducing line capacity. This
Recommendations:
is also why incoming passenger trains do not have dedicated docking platforms
at many stations, triggering mass trespassing to crossover to the new arrival
platform.
In 2017, Observer Research Foundation Mumbai undertook a timetable
construction project, called Saral, for the WR’s suburban operations. The
timetable was constructed over eight months by meticulously analysing WR
Timetable No. 74 and all available resources. Without adding a single new rake
or a single kilometre of new track, Saral could press 130 more trains into service
daily—an increase of 10.72 percent with the same number of rakes in operation.
Train kilometres were also increased from 46,249.64 to 51,979.41—an increase
of 12.39 percent (5,729.77 kilometres in absolute terms). Saral could also
enhance the WR’s frequency during peak hours by augmenting train kilometres
from 8,078 to 8,835, effectively tackling the increase in peak rush. Importantly,
under the Saral timetable, almost all trains could get a fixed docking platform,
virtually eliminating trespassing.
The MUTP is critical to the
Mumbai Metropolitan Region’ s
future transportation needs.
27Saral performed at 100 percent accuracy when run under different scenario
simulations on the IR’s RailSys software for route capacity enhancement.
It was also found to be superior to the then existing WR timetable to handle
contingencies. However, repeated consultations with WR staff and detailed
presentations to the Railway Board failed to convince officials of its efficacy.
Unified railway zone for Mumbai
Many of the MSRS’s operational hurdles are because it is governed independently
by the CR and WR. The WR manages the entire traffic operations covering
Gujarat, Madhya Pradesh and Rajasthan, while the CR extends from Itarsi in
Madhya Pradesh to Nagpur in Maharashtra to Gulbarga in Karnataka. For
both, the MSRS is a small part of their mandate (see Figure 5). The CR and
WR priority are freight operations, an important revenue source for the IR,
while the MSRS caters to passenger commute.
Establishing a unified suburban railway zone for Mumbai will have several
Saving Lives on IR
strategic and operational benefits. The CR and WR operate and maintain their
Recommendations:
respective rakes in the sheds and workshops under their control. A pooling of
resources following a merger into a railway zone of the CR and WR’s suburban
divisions will generate synergy to boost revenues and raise the overall standards
of commuter safety and travel. The MSRS contributed nearly 35 percent of the
IR’s 23 million riders in 2018-19.109 Given the high commuter volumes on the
MSRS, converting it into a railway zone is crucial for improved efficiency and
operations.
Going forward, the IR must realise that the real purpose of the MSRS is as a
metropolitan public transport provider. As the national transporter, the IR has
no role to play in the operations of the MSRS. The need for “integrating the
metro and suburban rail systems under a single management in partnership
with the respective state/city authorities” has already been recognised in IR’s
Vision 2020 plan.110 Such integration should be independent of the Ministry of
Railways. Well-functioning models of separate railway operations, such as the
Delhi Metro Rail Corporation and the Mumbai Metro One, can be emulated to
create an independent railway authority for the MSRS.
28Figure 5:
MSRS (in red) as part of the CR and
WR route network
Source: CR and WR websites107,108
29Need for political will
Since 2010, Maharashtra, Uttar Pradesh and West Bengal have consistently
been ranked as India’s top-three states to report the maximum number of
fatalities resulting from railway accidents (see Table 9). According to NCRB
data, the three states account for 48 percent of all railway accidents, excluding
level crossing incidents, and 43 percent of all ‘inconsequential’ deaths.
Tamil Nadu, Bihar, Haryana, Andhra Pradesh and Madhya Pradesh
periodically round up the top five states to report railway fatalities. Together, the
top-five states log 62 percent of all accidents and 58 percent of all deaths.
Political leaders and elected representatives must use their presence on the
consultative railway users’ committees at the divisional, zonal and national levels
to push for improved commuter safety instead of simply pandering to their
electorates through the introduction of new trains, new mid-section halt stations
and new routes. Enhanced railway capacity and safety will also bring political
Saving Lives on IR
dividends.
Recommendations:
Of all states, Maharashtra, UP and
WB have the highest number of
fatalities from railway accidents.
30Table 9:
Railway accidents and accidental deaths –
Top 3 states
Year 2015 2016 2017 2018 2019
Total railway accidents* 29419 25927 27197 27643 27987
Total railway accidents (Top 5 reporting states)
Maharashtra 7806 7160 6818 6349 6338
Uttar Pradesh 4431 3301 3016 3272 3980
West Bengal 2726 2690 2723 2756 2876
Total accidental deaths* 26066 22051 23959 24545 24619
Total railway accidental deaths – Top 3 reporting states
Maharashtra 4719 4462 4017 3801 3916
Uttar Pradesh 4472 3432 2856 3095 3521
West Bengal 2545 2509 2687 2722 2832
*
Excluding level crossing accidents and deaths
Source: Compiled by the author from NCRB’s ‘Accidental Deaths and Suicides in India’ reports of respective years.111
31T
he IR may have already delivered on its promise of zero deaths
from consequential accidents by 2020. Yet thousands of fatalities
due to untoward incidents continue to occur. Part of the solution
lies with the IR. Instead of distancing itself from the problem, it
must accept the challenge and undertake capacity enhancement
projects.
To control trespassing, for instance—which is a significant cause of fatalities—
the IR must empower its zonal and divisional heads to make independent
decisions regarding prioritising and executing urgent work. The IR must also
be willing to experiment with innovative ideas, such as the Saral timetable, to
rationalise its timetable construction practices. If done through a participatory
approach using its existing zonal and divisional consultative bodies, timetable
rationalisation will free up the saturated network for more train operations at
zero to minimal cost.
The integration of the human and technical resources currently under the
independent purview of CR and WR through a unified suburban railway
zone for the MSRS will enable the IR to minimise the death toll by 27 percent.
However, no solution to the larger problem of untoward railway accidents
and deaths can ever be achieved unless all stakeholders collectively take up the
challenge with a commitment to the cause.
Conclusion
321 “First time in 166 years, Indian Railways reports zero accidental deaths in FY20”, Business
Today, December 25, 2019, https://www.businesstoday.in/current/economy-politics/first-
time-in-166-years-indian-railways-reports-zero-passenger-deaths-in-fy19/story/392584.
html
2 “Nearly 30,000 deaths in 3 yrs due to trespassing, ‘untoward incidents’: Railways”,
Hindustan Times, August 20, 2020, https://www.hindustantimes.com/india-news/
nearly-30-000-deaths-in-3-yrs-due-to-trespassing-untoward-incidents-railways/story-
Omq1gmyUIw7zibmJI0CF1H.html#:~:text=In%20a%20letter%20to%20Railway,a%20
thousand%20deaths%20in%20Mumbai
3 Dipak K. Dash, “Niti Aayog CEO queries railways’ claim of zero deaths”, The Times
of India, August 20, 2020, https://timesofindia.indiatimes.com/india/niti-ceo-queries-
railways-claim-of-zero-deaths/articleshow/77634594.cms
4 Government of India, Ministry of Railways, Report of High Level Safety Review
Committee, February 2012, https://www.anilkakodkar.in/assignments/report_of_high_
level_safety_review_committtee_february_2012.pdf
5 Press Trust of India, “Around 30,000 died near tracks in 3 years, says Railways to Niti
Aayog”, Business Standard, August 20, 2020, https://www.business-standard.com/
article/economy-policy/around-30-000-died-near-tracks-in-3-years-says-railways-to-niti-
aayog-120082001574_1.html
6 Anisha Dutta, “Nearly 30,000 deaths in 3 yrs due to trespassing, ‘untoward incidents’:
Railways”, Hindustan Times, August 20, 2020, https://www.hindustantimes.com/india-
news/nearly-30-000-deaths-in-3-yrs-due-to-trespassing-untoward-incidents-railways/story-
Omq1gmyUIw7zibmJI0CF1H.html#:~:text=In%20a%20letter%20to%20Railway,a%20
thousand%20deaths%20in%20Mumbai
7 Government of India, Ministry of Railways (Railway Board), Definition and Re-
classification of Accidents on Indian Railways, December 13, 2000, https://
indianrailways.gov.in/railwayboard/uploads/directorate/safety/downloads/Circulars_
AR_Reclassification_accident_131200.pdf
Endnotes
8 NITI Aayog, Fund Deployment Framework for Rashtriya Rail Sanraksha Kosh (RRSK)
– A Discussion Note, by Bibek Debroy and Kishore Desai, 2016, https://www.niti.gov.in/
niti/writereaddata/files/document_publication/Rail%20Safety%20for%20Public.pdf
9 NITI Aayog, Fund Deployment Framework for Rashtriya Rail Sanraksha Kosh
10 Press Information Bureau, Decline in Train Accidents, December 4, 2019, https://pib.gov.
in/Pressreleaseshare.aspx?PRID=1594954
11 NITI Aayog, Fund Deployment Framework for Rashtriya Rail Sanraksha Kosh
12 Ministry of Railways, Parliamentary Standing Committee on Railways, 12th
Report, Safety and Security in Railways, December 2016, https://eparlib.nic.in/
bitstream/123456789/65764/1/16_Railways_12.pdf
3313 NITI Aayog, Fund Deployment Framework for Rashtriya Rail Sanraksha Kosh
14 NITI Aayog, Fund Deployment Framework for Rashtriya Rail Sanraksha Kosh
15 NITI Aayog, Fund Deployment Framework for Rashtriya Rail Sanraksha Kosh
16 NITI Aayog, Fund Deployment Framework for Rashtriya Rail Sanraksha Kosh
17 https://archive.pib.gov.in/archive/releases98/lyr2001/raug2001/29082001/
r2908200116.html
18 Government of India, Ministry of Railways (Railway Board), Indian Railways Vision
2020, December 2009, https://indianrailways.gov.in/railwayboard/uploads/directorate/
infra/downloads/VISION_2020_Eng_SUBMITTED_TO_PARLIAMENT.pdf
19 Government of India, Ministry of Railways, Report of High Level Safety Review
Committee
20 NITI Aayog, Fund Deployment Framework for Rashtriya Rail Sanraksha Kosh
21 Ministry of Railways, Parliamentary Standing Committee on Railways, 12th Report,
Safety and Security in Railways
22 Ministry of Railways, Parliamentary Standing Committee on Railways, 12th Report,
Safety and Security in Railways
23 T.S. Ramakrishnan, “Short-term plan to make Railways safe”, BusinessLine, September
18, 2017, https://www.thehindubusinessline.com/opinion/shortterm-plan-to-make-
railways-safe/article9864027.ece
24 Budget speech 2017-2018, by Minister of Finance Arun Jaitely, February 1, 2017, https://
www.indiabudget.gov.in/doc/bspeech/bs201718.pdf
25 NITI Aayog, Fund Deployment Framework for Rashtriya Rail Sanraksha Kosh
26 NITI Aayog, Fund Deployment Framework for Rashtriya Rail Sanraksha Kosh
Endnotes
27 Broad cases of train accidents which occurred on Indian Railway (1996-97 to 2010-11 and
2014-15 to 2018-19-up to 31.11.2018, in IndiaStat, https://www.indiastat.com/table/
crime-and-law-data/6/consequential-miscellaneous-train-accidents/21886/11636/data.
aspx, IndiaStat
28 NITI Aayog, Fund Deployment Framework for Rashtriya Rail Sanraksha Kosh
29 NITI Aayog, Fund Deployment Framework for Rashtriya Rail Sanraksha Kosh
30 NITI Aayog, Fund Deployment Framework for Rashtriya Rail Sanraksha Kosh
31 Ministry of Railways (Railway Board), Parliamentary Standing Committee on Railways
(2018-2019), Twenty-Second Report, December 2018, http://164.100.47.193/
lsscommittee/Railways/16_Railways_22.pdf
32 Government of India, Ministry of Railways (Railway Board), Indian Railways Yearbook
2018-19, https://indianrailways.gov.in/railwayboard/uploads/directorate/stat_econ/
Year_Book/Year%20Book%202018-19-English.pdf
3433 Government of India, Ministry of Railways (Railway Board), Indian Railways Yearbook
2018-19
34 Government of India, Ministry of Railways (Railway Board), Indian Railways Yearbook
2017-18, https://indianrailways.gov.in/railwayboard/uploads/directorate/stat_econ/
pdf_annual_report/Railway%20Year%20Book_2017_18.pdf
35 Government of India, Ministry of Railways (Railway Board), Indian Railways Yearbook
2017-18
36 Government of India, Ministry of Railways (Railway Board), Indian Railways
Permanent Way Manual, July 2019, http://www.iricen.gov.in/iricen/Track_Manuals/
IRPWMUPTOACS155.pdf
37 Government of India, Ministry of Railways (Railway Board), Indian Railways Yearbook
2017-18,
38 Government of India, Ministry of Railways (Railway Board), Indian Railways Yearbook
2018-19
39 Government of India, Ministry of Railways (Railway Board), Indian Railways Yearbook
2018-19
40 Government of India, Ministry of Railways (Railway Board), Indian Railways Yearbook
2017-18
41 National Crime Records Bureau, Accidental Deaths in India, 2010, https://ncrb.gov.in/
sites/default/files/accidental-deaths-10.pdf
42 National Crime Records Bureau, Accidental Deaths in India, 2019, https://ncrb.gov.in/
sites/default/files/Chapter-1A-Traffic-Accidents_2019.pdf
43 National Crime Records Bureau, Ministry of Home Affairs, Accidental Deaths and
Suicides Data 2010, Chapter 1, https://ncrb.gov.in/sites/default/files/accidental-
deaths-10.pdf
Endnotes
44 National Crime Records Bureau, Accidental Deaths and Suicides Data 2011, https://
ncrb.gov.in/sites/default/files/accidental-deaths-11_0.pdf
45 National Crime Records Bureau, Accidental Deaths and Suicides Data 2012, https://
ncrb.gov.in/sites/default/files/ADSI2012.pdf
46 National Crime Records Bureau, Accidental Deaths and Suicides Data 2014, https://
ncrb.gov.in/sites/default/files/adsi-2014%20full%20report.pdf
47 National Crime Records Bureau, Accidental Deaths and Suicides Data 2013, https://
ncrb.gov.in/sites/default/files/accidental%20deaths%202013.pdf
48 National Crime Records Bureau, Accidental Deaths and Suicides Data 2015, https://
ncrb.gov.in/sites/default/files/adsi-2015-full-report.pdf
49 National Crime Records Bureau, Accidental Deaths and Suicides Data 2016, https://
ncrb.gov.in/sites/default/files/ADSI-2016-FULL-REPORT-2016.pdf
3550 National Crime Records Bureau, Accidental Deaths and Suicides Data 2017, https://
ncrb.gov.in/sites/default/files/ADSI2017-FULL-REPORT-2017.pdf
51 National Crime Records Bureau, Accidental Deaths and Suicides Data 2018, https://
ncrb.gov.in/sites/default/files/ADSI-2018-FULL-REPORT-2018.pdf
52 National Crime Records Bureau, Accidental Deaths and Suicides Data 2019, https://
ncrb.gov.in/sites/default/files/ADSI_2019_FULL%20REPORT_updated.pdf
53 Press Trust of India, “Around 30,000 died near tracks in 3 years, says Railways to Niti
Aayog”
54 National Crime Records Bureau, Accidental Deaths and Suicides Data 2014
55 National Crime Records Bureau, Accidental Deaths and Suicides Data 2015
56 National Crime Records Bureau, Accidental Deaths and Suicides Data 2016
57 National Crime Records Bureau, Accidental Deaths and Suicides Data 2017
58 National Crime Records Bureau, Accidental Deaths and Suicides Data 2018
59 National Crime Records Bureau, Accidental Deaths and Suicides Data 2019
60 Press Trust of India, “No Commuter Deaths On Mumbai’s Local Train Network On June
26”, NDTV, June 28, 2019, https://www.ndtv.com/mumbai-news/no-commuter-deaths-
on-mumbais-local-train-network-on-june-26-2060494
61 Press Information Bureau, Ministry of Railways, ‘Measures to Enhance Safety of
Passengers’, February 5, 2020, https://pib.gov.in/PressReleasePage.aspx?PRID=1602103
62 World Bank, ‘Rail Lines – India’, https://data.worldbank.org/indicator/IS.RRS.TOTL.
KM?end=2018&locations=IN&start=1995&view=chart
63 National Transport Development Committee, Working Group on Railways, Final Report,
June 2012, https://niti.gov.in/planningcommission.gov.in/docs/sectors/NTDPC/
Endnotes
Working%20Group%20Reports/Railways/Report%20of%20Working%20Group%20
on%20Railways_Submitted%20to%20the%20Govt%20on%20Aug%209th,%202012.pdf
64 Ministry of Railways (Railway Board), Public Accounts Committee (2016-17),
69th report, Suburban Train Services in Indian Railways, https://eparlib.nic.in/
bitstream/123456789/65704/1/16_Public_Accounts_69.pdf
65 Megha Sood, “1,763 deaths reported on CR, 928 on WR in ’19, reveals GRP
data”, Hindustan Times, January 29, 2020, https://www.hindustantimes.com/
mumbai-news/1-763-deaths-reported-on-cr-928-on-wr-in-19-reveals-grp-data/story-
EV9vywLlgt4ybiixHHVkYN.html
66 Collated by the author from GRP data accessed through the MRVC records.
67 Kalpana Verma, “Local trains killed 139 gangmen in four years, says data”, The Indian
Express, September 24, 2013, https://indianexpress.com/article/cities/mumbai/local-
trains-killed-139-gangmen-in-four-years-says-data/
3668 “4 gangmen killed after being run over by train”, The Asian Age, February 20, 2016,
https://www.asianage.com/mumbai/train-runs-over-4-gangmen-560
69 Collated by the author from GRP data accessed through the MRVC records.
70 Collated by the author from GRP data accessed through the MRVC records.
71 Collated by the author from GRP data accessed through the MRVC records.
72 “Mumbai’s last 9-car local will ride into sunset tomorrow”, The Times of India,
September 3, 2016, https://timesofindia.indiatimes.com/city/mumbai/Mumbais-last-9-
car-local-will-ride-into-sunset-tomorrow/articleshow/53986919.cms
73 Rajendra B Aklekar, “Death of a Superstar”, Mid-Day, January 5, 2020, https://www.
mid-day.com/articles/death-of-a-superstar/22376190
74 “All 12-Car Rakes Should Be Transformed Into 15-Car Rake: Piyush Goyal” Mumbai
Live, https://www.mumbailive.com/en/transport/all-12-car-rakes-should-be-
transformed-into-15-car-rakes-railway-minister-piyush-goyal-30728
75 “2 killed in FoB stampede at railway station in West Bengal”, The Pioneer, October 24,
2018, https://www.dailypioneer.com/2018/page1/2-killed-in-fob-stampede-at-railway-
station--in-west-bengal.html
76 “What caused Elphinstone stampede in Mumbai: Probe reveals this ‘truth’”, Financial
Express, October 11, 2017, https://www.financialexpress.com/india-news/what-caused-
elphinstone-stampede-in-mumbai-probe-reveals-this-truth/890209/
77 Mumbai Rail Vikas Corporation, Consultancy for study on Trespassing over Railway
Track in Mumbai Suburban Area & remedial measures thereon, July 2012, https://mrvc.
indianrailways.gov.in/works/uploads/File/EXECUTIVE%20SUMMARY(1).pdf
78 Mumbai Rail Vikas Corporation, Consultancy for study on Trespassing over Railway
Track in Mumbai Suburban Area & remedial measures thereon
79 Iram Siddique, “Trespassing cases at Mumbai railways stations fall”, Mumbai Mirror,
Endnotes
October 26, 2018, https://mumbaimirror.indiatimes.com/mumbai/other/stopping-
death-in-its-tracks/articleshow/66371113.cms
80 Mumbai Rail Vikas Corporation, Consultancy for study on Trespassing in MID-
SECTION over Railway Network in Mumbai Suburban Area & remedial measures
thereon, July 2012, https://mrvc.indianrailways.gov.in/works/uploads/File/1.
Executive%20Summary_Volume%201.pdf
81 Kamal Mishra, “Panvel to be the new railway hub; 11 pairs of private trains to
be operated from Panvel terminus”, Mumbai Mirror, Januar 3, 2020, https://
mumbaimirror.indiatimes.com/mumbai/other/panvel-to-be-the-new-railway-hub/
articleshow/73062924.cms
82 Sharad Vyas, “Mumbai metro region has a fourth of state’s population”, The Times of
India, April 1, 2011, https://timesofindia.indiatimes.com/city/mumbai/Mumbai-metro-
region-has-a-fourth-of-states-population/articleshow/7839699.cms
3783 Mumbai Metropolitan Region Development Authority, Mumbai Urban Transport Project,
https://mmrda.maharashtra.gov.in/mumbai-urban-transport-project1
84 Mumbai Rail Vikas Corporation, MUTP Phase 1, https://mrvc.indianrailways.gov.in/
works/uploads/File/mutp%20i.pdf
85 Mumbai Rail Vikas Corporation, MUTP Phase 1
86 World Bank, Independent Evaluation Group, Project Performance and Assessment Report
– Mumbai Railway Transport Project, June 15, 2016, http://documents1.worldbank.org/
curated/en/153071469129513999/pdf/106391-PPAR-P050668-Box396277B-OUO-9-
india-0716.pdf
87 World Bank, Project Performance and Assessment Report – Mumbai Railway Transport
Project
88 Kailash Korde, “Rs 8,087-cr project failed to reduce overcrowding in Mumbai local:
World Bank report”, Hindustan Times, February 18, 2018, https://www.hindustantimes.
com/mumbai-news/rs-8-087-cr-project-failed-to-reduce-overcrowding-in-mumbai-local-
world-bank-report/story-Pnvnxc67Wi1yEKeUKDR1JP.html
89 World Bank, Independent Evaluation Group, Implementation Completion Report,
Mumbai Urban Transport Project-2A, http://documents1.worldbank.org/curated/
en/230121506531565452/pdf/ICRR-Disclosable-P113028-09-27-2017-1506531537604.
pdf
90 Mumbai Rail Vikas Corporation, MUTP Phase 2A, https://mrvc.indianrailways.gov.in/
works/uploads/File/MUTP%20II%20A.pdf
91 Mumbai Rail Vikas Corporation, MUTP Phase 2B, https://mrvc.indianrailways.gov.in/
works/uploads/File/MUTP%20II%20B.pdf
92 World Bank, Implementation Completion Report, Mumbai Urban Transport Project-2A,
http://documents1.worldbank.org/curated/ru/230121506531565452/pdf/ICRR-Disclo
sable-P113028-09-27-2017-1506531537604.pdf
Endnotes
93 Neha Kulkarni, “Congested suburban rail network: World Bank report blames delay
in completing projects”, The Indian Express, February 5, 2017, https://indianexpress.
com/article/india/congested-suburban-rail-network-world-bank-report-blames-delay-in-
completing-projects/
94 Aroosa Ahmed and Faisal Malik, “Mumbai urban transport project-3 work to begin
after monsoon”, Hindustan Times, August 13, 2019, https://www.hindustantimes.
com/mumbai-news/mumbai-urban-transport-project-3-work-to-begin-after-monsoon/
story-mCRC4OjrRfp7WzcUczsPTK.html#:~:text=The%20deadline%20for%20
completion%20of,corridor%20between%20Panvel%20and%20Karjat.
95 Mumbai Vikas Rail Corporation, Brief on MUTP-III, https://mrvc.indianrailways.gov.
in/works/uploads/File/Brief%20on%20MUTP%20III%20-%2009.10.19.pdf
96 Aroosa Ahmed, AIIB’s `3,500-crore fillip to Railways’ MUTP-3 project in Mumbai
Metropolitan Region”, Hindustan Times, August 25, 2020, https://www.hindustantimes.
com/mumbai-news/aiib-s-3-700-crore-fillip-to-railways-mutp-3-project-in-mumbai-
metropolitan-region/story-A06flSqtNfS295BFYd1VIK.html
38You can also read