Racial disparities in COVID 19 outcomes exist despite comparable Elixhauser comorbidity indices between Blacks, Hispanics, Native Americans, and ...
←
→
Page content transcription
If your browser does not render page correctly, please read the page content below
www.nature.com/scientificreports
OPEN Racial disparities in COVID‑19
outcomes exist despite comparable
Elixhauser comorbidity indices
between Blacks, Hispanics, Native
Americans, and Whites
Fares Qeadan1*, Elizabeth VanSant‑Webb2, Benjamin Tingey1, Tiana N. Rogers2,
Ellen Brooks1, Nana A. Mensah1, Karen M. Winkfield3,4, Ali I. Saeed5, Kevin English6 &
Charles R. Rogers1
Factors contributing to racial inequities in outcomes from coronavirus disease 2019 (COVID-19) remain
poorly understood. We compared by race the risk of 4 COVID-19 health outcomes––maximum length
of hospital stay (LOS), invasive ventilation, hospitalization exceeding 24 h, and death––stratified
by Elixhauser comorbidity index (ECI) ranking. Outcomes and ECI scores were constructed from
retrospective data obtained from the Cerner COVID-19 De-Identified Data cohort. We hypothesized
that racial disparities in COVID-19 outcomes would exist despite comparable ECI scores among non-
Hispanic (NH) Blacks, Hispanics, American Indians/Alaska Natives (AI/ANs), and NH Whites. Compared
with NH Whites, NH Blacks had longer hospital LOS, higher rates of ventilator dependence, and a
higher mortality rate; AI/ANs, higher odds of hospitalization for ECI = 0 but lower for ECI ≥ 5, longer
LOS for ECI = 0, a higher risk of death across all ECI categories except ECI ≥ 5, and higher odds of
ventilator dependence; Hispanics, a lower risk of death across all ECI categories except ECI = 0, lower
odds of hospitalization, shorter LOS for ECI ≥ 5, and higher odds of ventilator dependence for ECI = 0
but lower for ECI = 1–4. Our findings contest arguments that higher comorbidity levels explain elevated
COVID-19 death rates among NH Blacks and AI/ANs compared with Hispanics and NH Whites.
Severe acute respiratory syndrome coronavirus 2 (SARS-CoV-2), the virus that causes COVID-19, has dispro-
portionately affected counties across the United States (US) that have substantially more racially and ethnically
diverse populations1,2. Total deaths from COVID-19 in the US have eclipsed 540,000 (as of March 24, 2021)3,
with the highest mortality occurring among non-Hispanic (NH) Blacks and American Indians/Alaska Natives
(AI/ANs), whose mortality rates are 1.9 and 2.4 times higher, respectively, than those of NH Whites (as of March
12, 2021)4.
A confluence of social, economic, and biologic factors, together with a higher prevalence of comorbidities
in AI/AN, Hispanic/Latino, and NH Black communities, has resulted in a greater COVID-19 burden and worse
outcomes among medically underserved and minority populations2. According to the Centers for Disease Con-
trol and Prevention (CDC), comorbidities such as cardiovascular diseases, cancer, and obesity present some of
the strongest and most consistent evidence for risk of hospitalization, intensive care unit admission, need for
ventilation, and death due to COVID-195. The higher prevalence of comorbidities experienced by Hispanics/
Latinos, NH Blacks, and AI/ANs may account for why these populations are, respectively, 3.1, 2.9, and 3.7 times
more likely than NH Whites to be hospitalized for COVID-194. NH Blacks are more likely to require mechani-
cal ventilation6. Despite similar median lengths of hospital stay across racial/ethnic g roups7,8, and despite race
1
Department of Family and Preventive Medicine, University of Utah School of Medicine, 375 Chipeta Way, Suite
A, Salt Lake City, UT 84108, USA. 2Sorenson Impact Center, University of Utah—David Eccles School of Business,
Salt Lake City, UT, USA. 3Meharry‑Vanderbilt Alliance, Department of Radiation Oncology, Vanderbilt University
Medical Center, Nashville, USA. 4Department of Internal Medicine, Meharry Medical College, Nashville, TN,
USA. 5Norton Thoracic Institute, St. Joseph’s Hospital and Medical Center, Phoenix, AZ, USA. 6Albuquerque Area
Southwest Tribal Epidemiology Center, Albuquerque, NM, USA. *email: fares.qeadan@utah.edu
Scientific Reports | (2021) 11:8738 | https://doi.org/10.1038/s41598-021-88308-2 1
Vol.:(0123456789)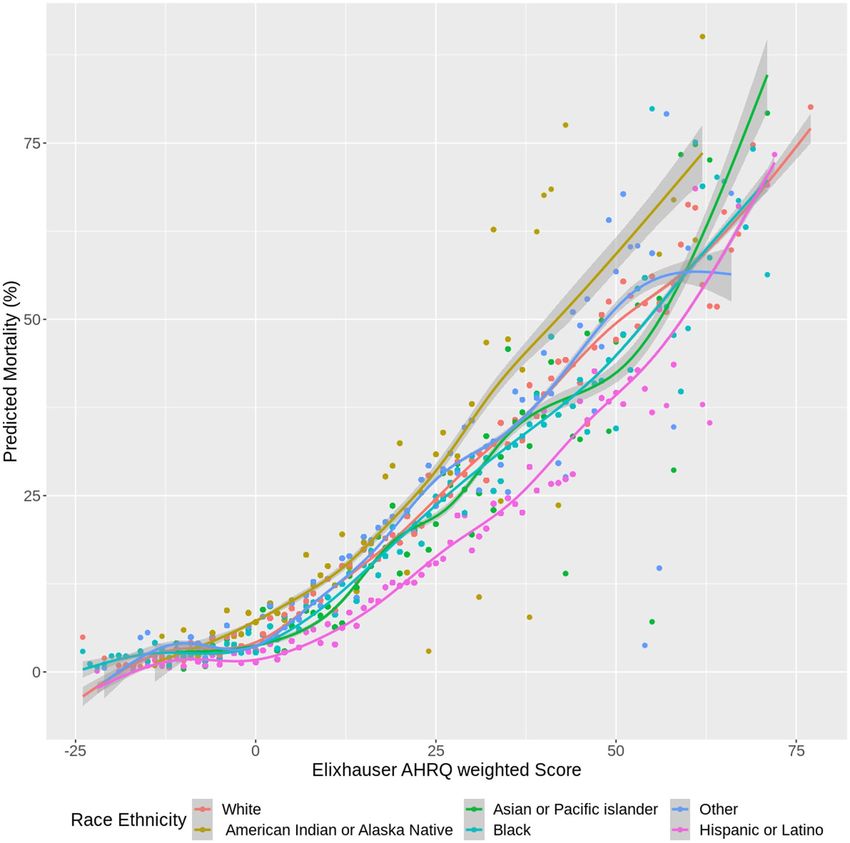
www.nature.com/scientificreports/
not being associated with an increased risk of in-hospital death from COVID-199, minority populations often
experience twice the mortality rate of NH W hites6,10. While studies of other respiratory infectious diseases such
as influenza, specifically H1N1 influenza, have suggested links between race and worse outcomes11,12, the wide-
spread nature of the COVID-19 pandemic also suggests that factors independent of underlying health conditions
may be contributing to COVID-19 severity in the US.
The increased burden of comorbidity among NH B lacks13,14 is hypothesized to be a major contributing fac-
tor to adverse COVID-19 outcomes , including an increased risk of death17,18. However, both single-site and
15,16
multisite studies report that disparities in COVID-19 hospitalizations and deaths among NH Blacks persist after
adjustment for comorbid conditions7,19,20. We hypothesize that racial disparities in COVID-19 outcomes exist
despite comparable Elixhauser comorbidity index (ECI) scores among AI/ANs, NH Blacks, Hispanics/Latinos,
and NH Whites.
We used the E CI21 to further interrogate COVID-19 disparities and objectively ascertain the burden of
comorbid conditions on COVID-19 health outcomes. The ECI encompasses 31 diagnoses, including cardiovas-
cular disease, diabetes, liver disease, and pulmonary disease, each weighted by mortality risk. A total ECI score
is generated from the sum of individual weights; a higher score indicates a higher burden of comorbidity21,22.
Studies with sample sizes ranging from 574 to more than 14,000,000 have established the ECI’s validity as a
prognostic indicator23,24.
Prior studies using the Charlson25 and Elixhauser comorbidity indices to account for comorbid conditions
in the context of COVID-19 have (1) failed to account for racial d isparities26, (2) used data from single sites or
single hospital systems19,27–29 or (3) failed to capture other relevant COVID-19 health outcomes beyond death
and hospitalization (e.g., length of hospital stay30 [LOS], need for ventilation31,32). Our study therefore aimed
to evaluate 4 COVID-19 health outcomes stratified by ECI ranking: hospitalizations exceeding 24 h, maximum
LOS, ventilation, and death.
Methods
Settings. We used data from the Cerner COVID-19 De-Identified Data cohort, a subset of the Cerner Real-
World Data cohort. Data in Cerner Real-World Data is extracted from the electronic health records (EHRs) of
hospitals with which Cerner has a data use agreement and may include pharmacy, clinical and microbiology
laboratory, and admission data, as well as billing information from affiliated patient-care locations. All admis-
sions, medication and dispensing orders, laboratory orders and specimens are date and time stamped, providing
a temporal relationship between treatment patterns and clinical information. Cerner Corporation has estab-
lished Health Insurance Portability and Accountability Act (HIPAA)–compliant operating policies to establish
de-identification for Cerner Real-World D ata33,34. EHR data are cleaned, standardized, and person-matched
before being completely de-identified per HIPAA standards. Records of patients identified as having an encoun-
ter associated with a diagnosis of or a recent (up to 2 weeks prior) positive lab test for COVID-19 between Janu-
ary and June 2020 were included in the COVID-19 data set. To assess possible disease histories, all encounters
and additional medical information for this patient cohort are collected, extending as far back as January 1, 2015,
where available. A total of 62 health systems across the US contributed records to this data set.
The University of Utah Institutional Review Board (IRB #136696) determined that this study did not meet
the definition of human subjects research according to federal regulations because (1) the investigators used
secondary data and did not collect data through intervention or interaction with an individual, and (2) no per-
sonally identifiable information was captured in the data. The IRB also determined that the study did not meet
the US Food and Drug Administration’s (FDA’s) definition of human subjects research because it did not involve
a drug, device, or any other FDA-regulated product. Thus, the IRB waived the requirements for ethical approval
and informed consent for this study.
Measurements. The outcomes of interest involved 4 indications of clinical complications in patients with
COVID-19: hospitalization, maximum hospital LOS, invasive ventilator dependence, and death. These indica-
tions were constructed from EHR data to reflect a unique risk profile per patient. Additionally, every outcome
had to involve a COVID-19 diagnosis or laboratory indication.
We measured maximum LOS by calculating the difference in days between the start and end dates of each
patient encounter and taking the maximum difference per patient. Hospitalization was a binary indicator of
whether a patient ever had an LOS of 1 day or more. Invasive ventilator dependence was a binary indicator of
whether a patient ever had a diagnosis, procedure, encounter, result, or indication signifying reliance on an inva-
sive ventilator. The full list of code types (Current Procedural Terminology [CPT], International Classification
of Diseases [ICD], Logical Observation Identifiers Names and Codes [LOINC], and Systematized Nomenclature
of Medicine—Clinical Terms [SNOMED CT]) and the corresponding codes used to define invasive ventilator
dependence are found in Supplemental Table 1. These codes were kept separate from indications of less-severe
ventilator dependence. Death was a binary indicator of whether a patient died at discharge or any time thereafter
until the time of data collection. For additional analyses, in-hospital death was obtained and restricted to death
at discharge (excluding any later deaths occurring outside of the hospital).
The predictors of interest were race (AI/AN, Asian/Pacific Islander [API], NH Black/African American,
White, other/unknown race); ethnicity (Hispanic or Latino); and a comorbidity score derived from the ECI. Like
the Charlson comorbidity index (CCI)18, the ECI measures patient comorbidity by calculating a risk-assessment
score based on ICD-10 diagnosis codes. However, the ECI considers more chronic disease indications (with some
more relevant to COVID-19 complications) than does the CCI (31 vs. 17)35 The ECI is weighted using the Agency
for Health Care Research and Quality (AHRQ) methodology36 and scores are grouped into categories of less than
0, 0, 1–4, and 5 or higher24. A full list of the diseases involved in the score calculation and the corresponding
Scientific Reports | (2021) 11:8738 | https://doi.org/10.1038/s41598-021-88308-2 2
Vol:.(1234567890)www.nature.com/scientificreports/
ICD-10 codes is found in Supplemental Table 237. Other demographic characteristics included for analysis were
sex, insurance status, and 1-digit zip-code region (categorical variables) and age in years (a continuous variable).
Statistical analysis. Overall demographic characteristics were presented for patients in the COVID-19
cohort. Categorical variables were expressed by frequencies and percentages. Because continuous variables were
not normally distributed, they were expressed as medians and interquartile ranges (IQRs). These characteristics
were also stratified by ECI group to assess significant demographic differences across comorbidity groups. Cat-
egorical variables were compared using a chi-square test and nonparametric continuous variables by a Kruskal–
Wallis rank sum test. Each outcome was presented across the demographic and clinical characteristics of inter-
est: gender, race/ethnicity, insurance status, and ECI group. Medians (IQRs) were presented for maximum LOS
and frequencies (percentages) for hospitalization, invasive ventilator dependence, and death.
To determine the adjusted associations of race/ethnicity and comorbidity with outcomes, multi-level regres-
sion models were fit using logistic regression models for hospitalization, invasive ventilator dependence, and
death. Because LOS followed a continuous, exponential distribution, an exponential regression model was fit for
maximum LOS. Adjusted odds ratios with 95% confidence intervals (CIs) were reported for the logistic model
predictors. Adjusted exponentiated coefficients relating to the percentage change in expected maximum LOS
with 95% CIs were reported for the exponential model predictors. All models were fit with race/ethnicity and
ECI score and adjusted for age, sex, and insurance status. Additionally, models involved a random effect of 1-digit
zip-code to account for clustering of results in similar regions. The predictive ability of the models was assessed
for both logistic and exponential models. For logistic regression models, an area under the receiver operating
characteristic curve (AUC) was calculated to assess the models’ ability to correctly classify outcome categories.
For the exponential model, the coefficient of determination ( R2) was calculated to estimate the percentage of
variation in LOS as explained by the model predictors.
To assess the adjusted impact of race/ethnicity and comorbidity on the hazard of death, a Cox proportional
hazards regression model was fit and adjusted for all variables included in the previous models. The outcome
involved both time (from hospital admission to hospital discharge) and indication of in-hospital death (dead or
alive at discharge).Adjusted hazard ratios (aHRs) and 95% CIs were reported. For all models, diagnostics were
performed to ensure optimal model fit.
To further assess differences across comorbidities, sub-analyses were performed by stratifying the cohort by
ECI groups (less than 0, 0, 1–4, 5 or higher) and running the same models within each group. Additionally, scat-
terplot figures were constructed to show the impact of race/ethnicity and comorbidity on the predicted outcomes
of clinical complications. Each figure showed the predicted outcome against the ECI score. Smoothed lines were
fit amongst the data by generalized additive regression models with shrinkage cubic-regression splines. This
was done by fitting different lines for the different racial/ethnic groups. All hypothesis tests were 2-sided with
a significance level of 5%. R version 3.6.1 (R Foundation for Statistical Computing, Vienna, Austria) was used
for all analyses. In addition, R package “comorbidity” (version 0.5.3) was used to calculate comorbidity scores.
Sample size calculation. Using 80% power, the stratified race/ethnicity distribution by Elixhauser AHRQ-
weighted comorbidity group (Table 1), and the risk of COVID-19 complications by race/ethnicity (Table 2), we
needed a sample size of at least 3,591 subjects for each ECI category, assuming the most stringent comparison
between AI/AN and NH Whites, to achieve a small effect size38 of OR = 1.68 in a 2-sided examination. This sam-
ple size was attainable in our study given that we had a total of 52,411 subjects (8976; 16,177; 4220; and 23,038
for ECI groups less than 0, 0, 1–4, and 5 or higher, respectively), as shown in the data flow chart (Fig. 1).
Results
A total of 52,411 unique patients with a COVID-19 diagnosis or recent positive laboratory result were included
in the analysis cohort. The median (IQR) patient age was 53 years (35–68); 50.6% (26,512) were female. Most
patients were Hispanic/Latino (18,425; 35.2%), followed by NH White (15,048; 28.7%), NH Black/African Ameri-
can (10,667; 20.4%), NH other or unknown race (5754; 11.0%), API (1447; 2.8%), and AI/AN (1070; 2.0%).
Most had private insurance (18,015; 34.4%), followed by Medicare (11,791; 22.5%) or Medicaid (8597; 16.4%)
coverage. Most lived in the southeastern US (9867; 18.8%). Forty-four percent of patients (23,038) had an ECI
score of 5 or higher; 30.9% (16,177) had an ECI score of 0 (Table 1).
Table 1 also shows patient demographic characteristics stratified by ECI group. Those with higher comor-
bidity were older and more likely to be male, NH White, and covered by Medicare. Significant differences were
observed between all demographic groups when stratified by ECI group (all p < 0.001).
Table 2 shows crude risk results for COVID-19-related clinical complications across patient characteristics.
Compared with women, men had higher percentages of hospitalization (55.8% vs. 50.2%), a higher median LOS
(2.0 vs. 1.0), higher percentages of invasive ventilator dependence (14.2% vs. 9.3%), and higher percentages
of death (10.6% vs. 7.4%). NH Whites had the highest outcomes for all clinical complications except invasive
ventilator dependence (hospitalization, 65.2%; median LOS, 3.0 days; death, 13.3%). AI/ANs had the highest
odds of invasive ventilator dependence (22.1%). Hispanics consistently had the lowest risk of complications
across all outcomes. Patients covered by Medicare and those with ECI scores of 5 or higher had the highest risk
of complications across all outcomes.
Table 3 shows the association of the adjusted predictors with the 4 clinical complications of hospitalization,
maximum LOS, invasive ventilator dependence, and death. (Survival modeling for time to death is presented
here; logistic modeling for death is reported in Supplemental Table 3). Older patients and men (compared with
women) consistently showed a higher risk of complications for all outcomes. AI/ANs had consistently higher
risk of complications for all outcomes than NH Whites, all of which were significant (hospitalization aOR 1.21;
Scientific Reports | (2021) 11:8738 | https://doi.org/10.1038/s41598-021-88308-2 3
Vol.:(0123456789)www.nature.com/scientificreports/
Elixhauser AHRQ-weighted comorbidity groupwww.nature.com/scientificreports/
Hospitalization Maximum length of stay (days) Invasive ventilator dependence Deceased
Comparison n (%a) Median (IQR: Q1–Q3) n (%a) n (%a)
Total 27,774 (53.0) 1.6 (0.1–6.5) 6150 (11.7) 4695 (9.0)
Gender
Female 13,307 (50.2) 1.0 (0.1–5.8) 2472 (9.3) 1962 (7.4)
Male 14,406 (55.8) 2.0 (0.1–7.2) 3664 (14.2) 2723 (10.6)
Other 61 (61.6) 2.4 (0.2–6.7) 14 (14.1) 10 (10.1)
Race and ethnicity
Non-Hispanic American Indian or
574 (53.6) 1.9 (0.1–7.8) 236 (22.1) 113 (10.6)
Alaska Native
Non-Hispanic Asian or Pacific
876 (60.5) 2.7 (0.2–8.3) 220 (15.2) 150 (10.4)
Islander
Non-Hispanic Black or African
6131 (57.5) 2.1 (0.2–7.5) 1383 (13.0) 1072 (10.0)
American
Non-Hispanic White 9811 (65.2) 3.0 (0.2–7.8) 2020 (13.4) 1998 (13.3)
Non-Hispanic other 2944 (51.2) 1.2 (0.1–6.9) 822 (14.3) 533 (9.3)
Hispanic or Latino 7438 (40.4) 0.2 (0.1–4.1) 1469 (8.0) 829 (4.5)
Insurance
Private 7067 (39.2) 0.2 (0.1–3.8) 1538 (8.5) 677 (3.8)
Government/miscellaneous 957 (51.6) 1.2 (0.11–6.1) 221 (11.9) 173 (9.3)
Medicaid 4209 (49.0) 0.9 (0.1–5.1) 850 (9.9) 367 (4.3)
Medicare 9442 (80.1) 5.5 (1.9–10.9) 2213 (18.8) 2606 (22.1)
Self-pay 97 (2.0) 0.1 (0.1–0.7) 173 (3.5) 97 (2.0)
Missing 775 (10.7) 3.4 (0.2–8.8) 1155 (15.9) 775 (10.7)
Elixhauser AHRQ-weighted comorbidity groupwww.nature.com/scientificreports/
Hospitalization Maximum length of stay Invasive ventilator dependence Deceased
Variables aOR (95% CI)
a
e β̂b (95% CI) aOR (95% CI)
a
aHRc (95% CI)
Age (years) d
1.30 (1.28, 1.32) 1.30 (1.29, 1.31) 1.16 (1.14, 1.18) 1.58 (1.55, 1.63)
Gender
Female 1 [Reference] 1 [Reference] 1 [Reference] 1 [Reference]
Male 1.23 (1.18, 1.28) 1.22 (1.18, 1.26) 1.55 (1.46, 1.64) 1.40 (1.32, 1.49)
Other 1.60 (1.00, 2.57)f 1.37 (0.96, 1.95)f 1.50 (0.82, 2.75) 1.35 (0.70, 2.60)
Race and ethnicity
Non-Hispanic White 1 [Reference] 1 [Reference] 1 [Reference] 1 [Reference]
Non-Hispanic American Indian or
1.21 (1.03, 1.43) 1.32 (1.16, 1.51) 3.49 (2.87, 4.25) 2.06 (1.70, 2.50)
Alaska Native
Non-Hispanic Asian or Pacific
1.08 (0.95, 1.23) 1.15 (1.05, 1.27) 1.44 (1.22, 1.69) 1.12 (0.95, 1.33)
Islander
Non-Hispanic Black or African
1.02 (0.95, 1.08) 1.13 (1.08, 1.19) 1.31 (1.21, 1.43) 1.22 (1.13, 1.32)
American
Non-Hispanic other 0.99 (0.91, 1.06) 1.06 (1.00, 1.12) 1.72 (1.56, 1.90) 1.58 (1.43, 1.74)
Hispanic or Latino 0.81 (0.77, 0.86) 0.88 (0.85, 0.92) 1.09 (1.00, 1.19) 0.89 (0.82, 0.97)
Insurance
Private 1 [Reference] 1 [Reference] 1 [Reference] 1 [Reference]
Government/misc 1.09 (0.98, 1.22) 1.11 (1.02, 1.21) 0.93 (0.79, 1.09) 1.51 (1.27, 1.79)
Medicaid 1.64 (1.54, 1.74) 1.65 (1.58, 1.74) 1.11 (1.01, 1.22) 1.45 (1.27, 1.65)
Medicare 1.51 (1.41, 1.62) 1.50 (1.42, 1.58) 0.90 (0.82, 0.98) 1.34 (1.22, 1.48)
Self-pay 0.60 (0.55, 0.65) 0.66 (0.62, 0.70) 0.47 (0.40, 0.56) 1.44 (1.16, 1.80)
Missing 1.87 (1.74, 2.01) 1.69 (1.60, 1.78) 1.32 (1.20, 1.45) 1.23 (1.10, 1.37)
Elixhauser AHRQ weighted
2.34 (2.28, 2.41) 1.78 (1.75, 1.80) 1.60 (1.56, 1.63) 1.17 (1.15, 1.20)
comorbidity scoree
AUC 0.86 – 0.86 –
R2 – 0.33 – –
Table 3. Adjusted associations with hospitalization, maximum length of hospital stay, dependence on invasive
ventilator, and death from COVID-19. a Adjusted odds ratio from mixed-effect logistic regression model
(clustering on one-digit zip-code). b Adjusted exponentiated coefficients (mixed-effect exponential regression
model clustering on one-digit zip-code) relating to change in the ratio of expected maximum length of hospital
stay (i.e., “male” coefficient is the ratio of the expected max LOS for males over expected max LOS for females,
so max LOS is 16% greater for males than for females). c Adjusted hazard ratios from Cox-Proportional Hazard
regression model. d Adjusted change in outcome for every 10 year increase in age. e Adjusted change in outcome
for every 10 point increase in ECI. f p values on the boundary of significance: Hospitalization gender other:
0.0503, max LOS gender other: 0.08. Bold indicates statistical significance at the 5% level (i.e., p value < 0.05).
Italic indicates p values are on the boundary of statistical significance (i.e.,0.05)
1.85; 95% CI [1.30, 2.64] for ECI = 0; 1.23; 95% CI [1.12, 1.35] for ECI of 5 or higher); and were more likely to
die (aOR: 1.47; 95% CI [0.95, 2.27] for ECI = 0; 1.13; 95% CI [1.02, 1.25] for ECI of 5 or higher). Compared with
NH Whites, AI/ANs had higher odds of hospitalization for ECI = 0 (aOR: 2.30; 95% CI [1.75, 3.02]) but lower
odds of hospitalization for ECI of 5 or higher (aOR: 0.76; 95% CI [0.57, 1.02]); longer hospital LOS for ECI = 0
(eβ : 2.75; 95% CI [2.28, 3.32]); a higher risk of death (aOR: 3.34; 95% CI [1.17, 9.56]) for ECI of less than 0; aOR:
5.77; 95% CI [3.07, 10.83] for ECI = 0; aOR: 2.69; 95% CI [0.87, 8.31] for ECI = 1–4); and higher odds of ventila-
tor dependence across all ECI categories. Hispanics had a lower risk of death across all ECI categories except for
ECI = 0, lower odds of hospitalization across all ECI categories, shorter hospital LOS for ECI of 5 or higher, and
higher odds of ventilator dependence for ECI = 0 but lower odds of ventilator dependence for ECI = 1–4. Com-
pared with NH Whites, patients of NH other or unknown race had longer LOS for all ECI categories except for
ECI = 0 (aOR: 0.91; 95% CI [0.83, 0.99]), higher odds of invasive ventilator dependence across all ECI categories,
and higher odds of death for ECI = 0 (aOR: 1.81; 95% CI [1.12, 2.91]) and ECI of 5 or higher (aOR: 1.27; 95%
CI [1.11, 1.44]).
Discussion
This study answers the question of whether racial disparities in COVID-19 outcomes exist despite comparable
ECIs among NH Black, Hispanic, AI/AN, and White patients. To our knowledge, it is one of the largest systematic
evaluations in the US of racial and ethnic differences in survival outcomes stratified by ECI score for patients with
COVID-19. Our analyses revealed significant racial disparities in health outcomes among COVID-19 patients
with comparable ECI scores. In particular, compared with NH Whites, most race groups had higher risk for all
outcomes (hospitalization, LOS, ventilation, and death), with greater clinical and statistical significance for AI/
ANs and NH Blacks. For example, using adjusted estimates, NH Blacks had longer LOS and higher odds of both
Scientific Reports | (2021) 11:8738 | https://doi.org/10.1038/s41598-021-88308-2 6
Vol:.(1234567890)www.nature.com/scientificreports/
Figure 2. Predicted mortality versus Elixhauser AHRQ weighted score, among COVID-19 infected patients (by
race).
ventilator dependence and death compared with NH Whites. NH Blacks and Native Americans were at increased
risk for complications and death from COVID-19 compared with NH Whites.
Previous studies suggest that racial disparities in COVID-19 incidence and mortality can be explained by the
complex interaction of inequities in social determinants of health, including access to health care2,39,40, poverty40,41,
systemic racism2,40, socioeconomic status2, lack of testing for SARS-CoV-2 infection39,42, discrimination2, and
virus exposure due to employment in essential-worker o ccupations43,44, all of which may be best viewed through a
biopsychosocial framework akin to the weathering hypothesis, which posits that cumulative exposure to chronic
stress can lead to accelerated aging by inducing physiologic changes that diminish the body’s ability to respond
appropriately to acute stressors45. Preliminary investigations suggest that a higher prevalence of medical comor-
bidities explains the clinical differences in outcomes among patients with COVID-197,17,46–48. Yet in our analysis
of the 4 above-mentioned outcomes stratified by ECI AHRQ-weighted group, we still observed significant racial
disparities in COVID-19 complications. Contrary to previous studies7,17,46,49, our analysis showed that for all
races, the probability of hospitalization due to COVID-19 increased in unison with an increasing ECI. Accord-
ingly, our findings contest arguments that NH Black and AI/AN patients are dying from COVID-19 at higher
rates than their NH White counterparts because they have more comorbidities.
After adjustment for predictive association with our chief outcomes, our analysis revealed a higher risk for all
4 outcomes (hospitalization, LOS, ventilation, and death) among older patients, men (compared with women),
patients with higher ECI scores, and patients covered by Medicare or Medicaid (compared with those covered
by private insurance). These findings align with patterns identified in previous studies of cohorts ranging in size
from 191 to 11,2107,46.
Scientific Reports | (2021) 11:8738 | https://doi.org/10.1038/s41598-021-88308-2 7
Vol.:(0123456789)www.nature.com/scientificreports/
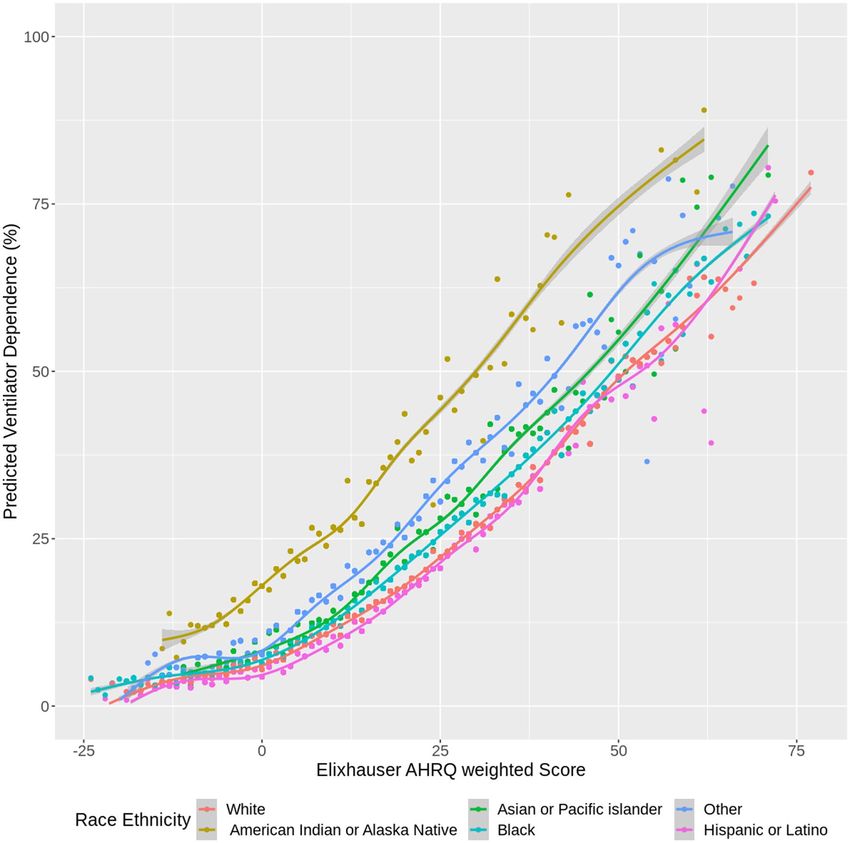
Figure 3. Predicted ventilator dependence versus Elixhauser AHRQ weighted score, among COVID-19
infected patients (by race).
Disaggregation by race and ethnicity of the analysis of all 4 primary outcomes uncovered 3 overarching
disparities while controlling for comorbidity. First, we found that APIs, NH Blacks, and patients of NH other or
unknown race had a higher risk for all outcomes. This aligns with previous findings on racial disparities for NH
Blacks for hospitalization50, mortality19, and ventilation7, and raises questions about the intersection of anti-Asian
discrimination and xenophobia with health outcomes for API p atients51. Secondly, our findings showed that,
compared with NH Whites, AI/AN patients had a higher risk of death and higher odds of ventilator dependence
but lower odds of hospitalization and a trend toward lower LOS for ECI of 5 or higher. These disproportionalities
may be understood by the transfer of patients from Indian Health Service (IHS) facilities to non-IHS facilities, as
IHS facilities are commonly ill-equipped to care for AI/AN patients with COVID-19 (e.g., they may lack invasive
ventilation equipment)52. Third, our analysis showed that, compared with NH Whites, Hispanics/Latinos had a
lower risk for death, hospitalization, and LOS, but higher odds of ventilator dependence for ECI = 0. Although
these findings contradict epidemiological studies that have found a higher risk of COVID-19–related deaths
within Hispanic/Latino communities53,54, they align with the “Hispanic epidemiological paradox,” which sug-
gests that, although the socioeconomic characteristics of Hispanics/Latinos are similar to those of NH Blacks,
comorbidity, mortality, and longevity outcomes in this subpopulation mirror or exceed those of NH Whites55.
Our data clearly show that a higher percentage of older patients were NH White and a higher percentage of
younger patients were Hispanic/Latino (Supplemental Fig. 3). Other studies have found that, compared with
NH Whites, Hispanic/Latino patients with COVID-19 tend to be y ounger56 and that older Hispanic/Latino
patients with COVID-19 may have a higher risk for d eath57,58. Recent reports of higher COVID-19 death rates
among older Hispanic/Latino p opulations57 and higher COVID-19 hospitalization rates among Hispanic/Latino
Scientific Reports | (2021) 11:8738 | https://doi.org/10.1038/s41598-021-88308-2 8
Vol:.(1234567890)www.nature.com/scientificreports/
children59 may challenge the “Hispanic paradox.” To better address the needs of the Hispanic/Latino population,
future researchers should employ additional data disaggregation to address this question.
Lastly, our results indicate that older patients and individuals with higher ECI scores had an increased risk of
death from COVID-19. Likewise, men compared with women, all races (except Hispanics/Latinos) compared
with NH Whites, and patients with all other health insurance types compared with those with private insurance
had an increased likelihood of death. These results are supported by recent findings of higher COVID-19 fatality
rates among men, older persons, and patients with a disproportionate burden of c omorbidities60,61. Emerging
literature also points to an association of minority status and insurance type with poor COVID-19 o utcomes7.
Our logistic regression findings reveal similar associations with minority status and insurance type for hospi-
talizations, death, ventilator dependence, and hospital LOS.
This study has potential limitations. Some of the outcomes and predictors were identified by medical record
codes (i.e., ICD and LOINC) that are known to limit the specificity of a study. However, we additionally applied
a variety of alternative methods, such as text matching, to provide an additional net with which to capture all
possible indications in the data. Medical histories were only available going back 5 years on qualifying patients
included in the cohort. Our study included only patients who sought treatment for COVID-19. It is important
to note that medically underserved and minority populations without insurance may not seek testing and treat-
ment for COVID-1962, which has implications for both Hispanics/Latinos and NH Blacks, who are 2–3 times
more likely to be uninsured compared with their NH White counterparts63. In addition, because (1) the data we
analyzed included only individuals who had accessed health care services, and (2) post-mortem COVID test-
ing is not routinely done, we may have underestimated the death rate among Hispanics/Latinos. Lastly, social
variables that could play a potential confounding role in our study were not captured in the EHR data that we
analyzed and thus were not included in the multilevel analyses.
Conclusion
Compared with NH White patients with similar ECI scores, NH Black patients had significantly higher LOS and
odds of ventilator dependence and death, while AI/AN patients were more likely to have worse indications across
all 4 outcomes analyzed: hospitalization, LOS, ventilation, and death. COVID-19 has laid bare an imperative to
investigate its negative health outcomes that may be exacerbated by a complex interplay of social, environmental,
and behavioral factors faced by indigenous, Hispanic/Latino, and NH Black c ommunities31, indicating a need
for upstream intervention at patient, community, and policy levels to close the health equity gap.
Data availability
The datasets generated and/or analyzed during the current study are not publicly available due to restrictions
by Cerner, the owner of the data. Data may be accessed by signing a data-sharing agreement with Cerner and
covering any costs that may be involved.
Received: 25 November 2020; Accepted: 12 April 2021
References
1. Adhikari, S. et al. Assessment of community-level disparities in Coronavirus Disease 2019 (COVID-19) infections and deaths in
large US metropolitan areas. JAMA Netw. Open 3(7), e2016938. https://doi.org/10.1001/jamanetworkopen.2020.16938 (2020).
2. Saini, G., Swahn, M. & Aneja, R. Disentangling the coronavirus disease 2019 health disparities in African Americans: biological,
environmental, and social factors. Open Forum Infect. Dis. 8(3), ofab064. https://doi.org/10.1093/ofid/ofab064 (2021).
3. United States COVID-19 Cases and Deaths by State. [updated March 24, 2021]. CDC. Accessed 24 March 2021. https://covid.cdc.
gov/covid-data-tracker/#cases_casesinlast7days.
4. COVID-19 Hospitalization and Death by Race/Ethnicity. [updated March 12, 2021]. CDC. Accessed 24 March 2021. https://www.
cdc.gov/coronavirus/2019-ncov/covid-data/investigations-discovery/hospitalization-death-by-race-ethnicity.html.
5. Evidence used to update the list of underlying medical conditions that increase a person’s risk of severe illness from COVID-19.
[updated November 2, 2020]. CDC. Accessed 24 March 2021. https://w ww.c dc.g ov/c orona virus/2 019-n
cov/n
eed-e xtra-p
recau
tions/
evidence-table.html.
6. Selden, T. M. & Berdahl, T. A. COVID-19 and racial/ethnic disparities in health risk, employment, and household composition.
Health Aff. https://doi.org/10.1377/hlthaff.2020.00897 (2020).
7. Price-Haywood, E. G., Burton, J., Fort, D. & Seoane, L. S. Hospitalization and mortality among Black patients and White patients
with Covid-19. N. Engl. J. Med. 382, 2534–2543. https://doi.org/10.1056/NEJMsa2011686 (2020).
8. Yehia, B. R., Winegar, A. & Fogel, R. Association of race with mortality among patients hospitalized with coronavirus disease 2019
(COVID-19) at 92 US hospitals. JAMA Netw. Open 3(8), e2018039. https://doi.org/10.1001/jamanetworkopen.2020.18039 (2020).
9. Wang, Z. et al. Analysis of hospitalized COVID-19 patients in the Mount Sinai Health System using electronic medical records
(EMR) reveals important prognostic factors for improved clinical outcomes. MedRxiv https://doi.org/10.1101/2020.04.28.20075
788 (2020).
10. The color of coronavirus: COVID-19 deaths by race and ethnicity in the U.S. [updated March 5, 2021]. APM Research Lab. Accessed
24 March 2021. https://www.apmresearchlab.org/covid/deaths-by-race.
11. Crouse Quinn, S. et al. Racial disparities in exposure, susceptibility, and access to health care in the US H1N1 influenza pandemic.
Am. J. Public Health https://doi.org/10.2105/AJPH.2009.188029 (2011).
12. Placzek, H. & Madoff, L. Effect of race/ethnicity and socioeconomic status on pandemic H1N1-related outcomes in Massachusetts.
Am. J. Public Health https://doi.org/10.2105/AJPH.2013.301626 (2013).
13. Clements, J. M. et al. Disparities in diabetes-related multiple chronic conditions and mortality: the influence of race. Diabetes Res.
Clin. Pract. 159, 107984. https://doi.org/10.1016/j.diabres.2019.107984 (2020).
14. Zilbermint, M., Hannah-Shmouni, F. & Stratakis, C. A. Genetics of hypertension in African Americans and others of African
descent. Int. J. Mol. Sci. 20(5), 1081. https://doi.org/10.3390/ijms20051081 (2019).
15. Pan, D. et al. The impact of ethnicity on clinical outcomes in COVID-19: a systematic review. EClinicalMedicine. 23, 100404.
https://doi.org/10.1016/j.eclinm.2020.100404 (2020).
Scientific Reports | (2021) 11:8738 | https://doi.org/10.1038/s41598-021-88308-2 9
Vol.:(0123456789)www.nature.com/scientificreports/
16. Meyers, E. M. Compounding health risks and increased vulnerability to SARS-CoV-2 for racial and ethnic minorities and low
socioeconomic status individuals in the United States. https://doi.org/10.20944/preprints202004.0234.v1(2020)
17. Guan, W. et al. Comorbidity and its impact on 1590 patients with COVID-19 in China: a nationwide analysis. Eur. Respir. J. 55,
2000547. https://doi.org/10.1183/13993003.00547-2020 (2020).
18. Wang, B., Li, R., Lu, Z. & Huang, Y. Does comorbidity increase the risk of patients with COVID-19: evidence from meta-analysis.
Aging 12(7), 6049–6057. https://doi.org/10.18632/aging.103000 (2020).
19. Golestaneh, L. et al. The association of race and COVID-19 mortality. EClinicalMedicine. 25, 100455. https://doi.org/10.1016/j.
eclinm.2020.100455 (2020).
20. Rodriguez, F. et al. Racial and ethnic differences in presentation and outcomes for patients hospitalized with COVID-19: findings
from the American Heart Association’s COVID-19 cardiovascular disease registry. Circulation https://doi.org/10.1161/CIRCU
LATIONAHA.120.052278 (2020).
21. Elixhauser, A., Steiner, C., Harris, R. & Coffey, R. M. Comorbidity measures for use with administrative data. Med. Care 36(1),
8–27. https://doi.org/10.1097/00005650-199801000-00004 (1998).
22. Austin, S. R., Wong, Y. N., Uzzo, R. G., Beck, R. J. & Egleston, B. L. Why summary comorbidity measures such as the Charlson
comorbidity index and Elixhauser score work. Med. Care 53(9), e65–e72. https://doi.o rg/1 0.1 097/M
LR.0 b013e 31829 7429c (2015).
23. Lieffers, J. R., Baracos, V. E., Winget, M. & Fassbender, K. A comparison of Charlson and Elixhauser comorbidity measures to
predict colorectal cancer survival using administrative health data. Cancer 117(9), 1957–1965. https://doi.org/10.1002/cncr.25653
(2011).
24. Menendez, M. E., Neuhaus, V., Van Dijk, N. & Ring, D. The Elixhauser comorbidity method outperforms the Charlson index in
predicting inpatient death after orthopedic surgery. Clin. Orthop. Relat. Res. 472, 2878–2886. https://doi.org/1 0.1 007/s11999-014-
3686-7 (2014).
25. Charlson, M. E. et al. A new method of classifying prognostic comorbidity in longitudinal studies: development and validation.
J. Chronic Dis. 40, 373–383. https://doi.org/10.1016/0021-9681(87)90171-8 (1987).
26. Christensen, D. M. et al. Charlson comorbidity index score and risk of severe outcome and death in Danish COVID-19 patients.
J. Gen. Intern. Med. 35, 2801–2803. https://doi.org/10.1007/s11606-020-05991-z (2020).
27. Zhou, W., Qin, X., Hu, X., Lu, Y. & Pan, J. Prognosis models for severe and critical COVID-19 based on the Charlson and Elixhauser
comorbidity indices. Int. J. Med. Sci. 17(15), 2257–2263. https://doi.org/10.7150/ijms.50007 (2020).
28. Escobar, G. J. et al. Racial disparities in COVID-19 testing and outcomes: retrospective cohort study in an integrated health system.
Ann. Intern. Med. https://doi.org/10.7326/M20-6979 (2021).
29. Quan, D. et al. Impact of race and socioeconomic status on outcomes in patients hospitalized with COVID-19. J. Gen. Intern. Med.
https://doi.org/10.1007/s11606-020-06527-1 (2021).
30. Kandil, E. et al. African Americans struggle with the current COVID-19. Ann. Surg. 272(3), e187–e190. https://doi.org/10.1097/
SLA.0000000000004185 (2020).
31. Haynes, N., Cooper, L. A. & Albert, M. A. At the heart of the matter: unmasking and addressing the toll of COVID-19 on diverse
populations. Circulation 142(2), 105–107. https://doi.org/10.1161/CIRCULATIONAHA.120.048126 (2020).
32. Poulson, M. et al. National disparities in COVID-19 outcomes between Black and White Americans. J. Natl. Med. Assoc. https://
doi.org/10.1016/j.jnma.2020.07.009 (2020).
33. Cerner Corporation: Accessed 12/2/2020; available from: https://w ww.c erner.c om/-/m
edia/c ovid-1 9/r espon
se/2 26347 1793_c ovid-
19-de-identified-data-cohort-access-offer-faq_v1.aspx.
34. Ehwerhemuepha, L. et al. HealtheDataLab—a cloud computing solution for data science and advanced analytics in healthcare
with application to predicting multi-center pediatric readmissions. BMC Med. Inform. Decis. Making 20(1), 115. https://doi.org/
10.1186/s12911-020-01153-7 (2020).
35. Garland A, Fransoo R, Olafson K, et al. The Epidemiology and Outcomes of Critical Illness in Manitoba. Winnipeg, MB: Manitoba
Centre for Health Policy. 2012. Accessed 7 October 2020. URL: http://mchp-appser v.cpe.umanitoba.ca/reference/MCHP_ICU_
Report_WEB_(20120403).pdf.
36. Moore, B. J., White, S., Washington, R., Coenen, N. & Elixhauser, A. Identifying increased risk of readmission and in-hospital
mortality using hospital administrative data: the AHRQ Elixhauser comorbidity index. Med. Care 55(7), 698–705. https://doi.org/
10.1097/MLR.0000000000000735 (2017).
37. Quan, H. et al. Coding algorithms for defining comorbidities in ICD-9-CM and ICD-10 administrative data. Med. Care 43(11),
1130–1139. https://doi.org/10.1097/01.mlr.0000182534.19832.83 (2005).
38. Chen, H., Cohen, P., & Chen, S. How big is a big odds ratio? Interpreting the magnitudes of odds ratios in epidemiological studies.
Commun. Stat. - Simul. Comput. 39(4), 860–864 (2010).
39. Nana-Sinkam, P. et al. Health disparities and equity in the era of COVID-19. J. Clin. Transl. Sci. https://doi.org/10.1017/cts.2021.
23 (2021).
40. Tai, D. B. G., Shah, A., Doubeni, C. A., Sia, I. G. & Wieland, M. L. The disproportionate impact of COVID-19 on racial and ethnic
minorities in the United States. Clin. Infect. Dis. https://doi.org/10.1093/cid/ciaa815 (2021).
41. Muñoz-Price, L. S. et al. Racial disparities in incidence and outcomes among patients with COVID-19. JAMA Netw. Open 3(9),
e2021892–e2021892. https://doi.org/10.1001/jamanetworkopen.2020.21892 (2020).
42. Bilal, U., Tabb, L. P., Barber, S. & Roux, A. V. D. Spatial inequities in COVID-19 testing, positivity, confirmed cases and mortality
in 3 US cities: an ecological study. medRxiv https://doi.org/10.1101/2020.05.01.20087833 (2021).
43. Rogers, T. N. et al. Racial disparities in COVID-19 mortality among essential workers in the United States. World Med. Health
Policy. https://doi.org/10.1002/wmh3.358 (2020).
44. Sterling, M. R. et al. Experiences of home health care workers in New York City during the Coronavirus disease 2019 pandemic.
JAMA Intern. Med. https://doi.org/10.1001/jamainternmed.2020.3930 (2020).
45. Forde, A. T., Crookes, D. M., Sugila, S. F. & Demmer, R. T. The weathering hypothesis as an explanation for racial disparities in
health: a systematic review. Ann. Epidemiol. https://doi.org/10.1016/j.annepidem.2019.02.011 (2019).
46. Richardson, S. et al. Presenting characteristics, comorbidities, and outcomes among 5700 patients hospitalized with COVID-19
in the New York City area. JAMA 323(20), 2052–2059. https://doi.org/10.1001/jama.2020.6775 (2020).
47. Williamson, E. J. et al. Factors associated with COVID-19-related death using OpenSAFELY. Nature 584, 430–436. https://doi.
org/10.1038/s41586-020-2521-4 (2020).
48. Guadagno, L. Migrants and the COVID-19 pandemic: An initial analysis. Int Migr. 2020;60. Accessed 7 October 2020. https://
publications.iom.int/system/files/pdf/mrs-60.pdf.
49. Ko, J. Y. et al. Risk factors for COVID-19-associated hospitalization: COVID-19-associated hospitalization surveillance network
and behavioral risk factor surveillance system. Clin. Infect. Dis. https://doi.org/10.1093/cid/ciaa1419 (2020).
50. Azar, K. M. J. et al. Disparities in outcomes among COVID-19 patients in a large health care system in California. Health Aff.
https://doi.org/10.1377/hlthaff.2020.00598 (2020).
51. Chen, J. A., Zhang, E. & Liu, C. H. Potential impact of COVID-19–related racial discrimination on the health of Asian Americans.
Am. J. Public Health https://doi.org/10.2105/AJPH.2020.305858 (2020).
52. COVID-19 and the Indian Health Service. [updated May 1, 2020]. Congressional Research Service, IN11333. Accessed 7 October
2020. https://crsreports.congress.gov/product/pdf/IN/IN11333.
Scientific Reports | (2021) 11:8738 | https://doi.org/10.1038/s41598-021-88308-2 10
Vol:.(1234567890)www.nature.com/scientificreports/
53. Rodriguez-Diaz, C. E. et al. Risk for COVID-19 infection and death among Latinos in the United States: examining heterogeneity
in transmission dynamics. Ann. Epidemiol. https://doi.org/10.1016/j.annepidem.2020.07.007 (2020).
54. Holtgrave, D. R., Barranco, M. A., Tesoriero, J. T., Blog, D. S. & Rosenberg, E. S. Assessing racial and ethnic disparities using a
COVID-19 outcomes continuum for New York State. Ann. Epidemiol. 48, 9–14. https://doi.org/10.1016/j.annepidem.2020.06.010
(2020).
55. Yang, W., Qeadan, F. & Smith-Gagen, J. The hispanic epidemiological paradox in the fastest-growing state in the United States.
Hisp. Health Care Int. https://doi.org/10.1891/1540-4153.7.3.130 (2009).
56. McCarty, T. R. et al. How do presenting symptoms and outcomes differ by race/ethnicity among hospitalized patients with COVID-
19 infection? Experience in Massachusetts. Clin. Infect. Dis. https://doi.org/10.1093/cid/ciaa1245 (2020).
57. Sáenz, R. & Garcia, M. A. The disproportionate impact of COVID-19 on older Latino mortality: the rapidly diminishing Latino
Paradox. J. Gerontol. Ser. B https://doi.org/10.1093/geronb/gbaa158 (2020).
58. Garcia, M. A., Homan, P. A., Garcia, C. & Brown, T. H. The color of COVID-19: Structural racism and the disproportionate impact
of the pandemic on older Black and Latinx adults. J. Gerontol. Ser. B https://doi.org/10.1093/geronb/gbaa114 (2020).
59. Kim, L. et al. Hospitalization rates and characteristics of children agedYou can also read