MENDELIAN RANDOMIZATION ANALYSIS PROVIDES CAUSALITY OF SMOKING ON THE EXPRESSION OF ACE2, A PUTATIVE SARS- COV-2 RECEPTOR - ELIFE
←
→
Page content transcription
If your browser does not render page correctly, please read the page content below
RESEARCH ARTICLE

                                        Mendelian randomization analysis
                                        provides causality of smoking on the
                                        expression of ACE2, a putative SARS-
                                        CoV-2 receptor
                                        Hui Liu1, Junyi Xin2, Sheng Cai3, Xia Jiang4*
                                        1
                                         Biomedical Research Center, Zhejiang Provincial Key Laboratory of Laparoscopic
                                        Technology, Sir Run Run Shaw Hospital, School of Medicine, Zhejiang University,
                                        Hangzhou, China; 2Department of Environmental Genomics, Jiangsu Key Laboratory
                                        of Cancer Biomarkers, Prevention and Treatment, Collaborative Innovation Center
                                        for Cancer Personalized Medicine, School of Public Health, Nanjing Medical
                                        University, Nanjing, China; 3Institute of Drug Metabolism and Pharmaceutical
                                        Analysis, Zhejiang Province Key Laboratory of Anti-Cancer Drug Research, Zhejiang
                                        University, Hangzhou, China; 4Department of Clinical Neuroscience, Center for
                                        Molecular Medicine, Karolinska Institute, Stockholm, Sweden

                                        Abstract
                                        Background: To understand a causal role of modifiable lifestyle factors in angiotensin-converting
                                        enzyme 2 (ACE2) expression (a putative severe acute respiratory syndrome coronavirus 2 [SARS-
                                        CoV-2] receptor) across 44 human tissues/organs, and in coronavirus disease 2019 (COVID-19)
                                        susceptibility and severity, we conducted a phenome-wide two-sample Mendelian randomization
                                        (MR) study.
                                        Methods: More than 500 genetic variants were used as instrumental variables to predict smoking
                                        and alcohol consumption. Inverse-variance weighted approach was adopted as the primary method
*For correspondence:                    to estimate a causal association, while MR-Egger regression, weighted median, and MR pleiotropy
xia.jiang@ki.se                         residual sum and outlier (MR-PRESSO) were performed to identify potential horizontal pleiotropy.
                                        Results: We found that genetically predicted smoking intensity significantly increased ACE2
Competing interests: The
                                        expression in thyroid (b=1.468, p=1.810 8), and increased ACE2 expression in adipose, brain,
authors declare that no
                                        colon, and liver with nominal significance. Additionally, genetically predicted smoking initiation
competing interests exist.
                                        significantly increased the risk of COVID-19 onset (odds ratio=1.14, p=8.710 5). No statistically
Funding: See page 10                    significant result was observed for alcohol consumption.
Received: 20 October 2020               Conclusions: Our work demonstrates an important role of smoking, measured by both status and
Accepted: 19 June 2021                  intensity, in the susceptibility to COVID-19.
Published: 06 July 2021                 Funding: XJ is supported by research grants from the Swedish Research Council (VR-2018–02247)
                                        and Swedish Research Council for Health, Working Life and Welfare (FORTE-2020–00884).
Reviewing editor: M Dawn
Teare, Newcastle University,
United Kingdom
    Copyright Liu et al. This article
is distributed under the terms of
                                        Introduction
                                        The severe acute respiratory syndrome coronavirus 2 (SARS-CoV-2) has led to a worldwide pandemic
the Creative Commons
Attribution License, which              of coronavirus disease 2019 (COVID-19) (Coronaviridae Study Group of the International Commit-
permits unrestricted use and            tee on Taxonomy of Viruses, 2020; World Health Organization, 2020). As a host receptor of
redistribution provided that the        SARS-CoV-2, the expression level of angiotensin-converting enzyme 2 (ACE2) has been found to
original author and source are          influence both the risk and severity of infection (Hoffmann et al., 2020; Wrapp et al., 2020;
credited.                               Zhou et al., 2020a; Li et al., 2003; Li et al., 2005). Moreover, a growing body of evidence from

Liu et al. eLife 2021;10:e64188. DOI: https://doi.org/10.7554/eLife.64188                                                           1 of 18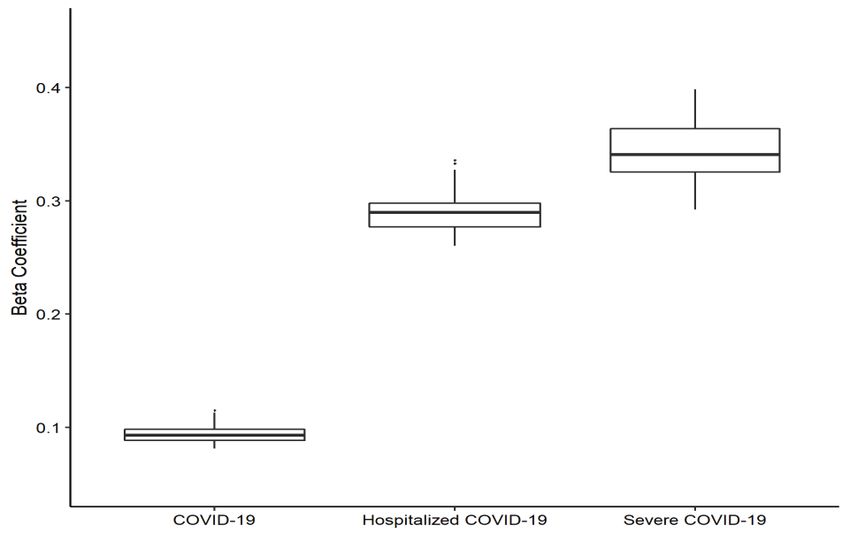
Research article                                                                                     Epidemiology and Global Health

                                    epidemiological investigations has demonstrated a substantial disparity in the susceptibility to infec-
                                    tion (Guan et al., 2020; Hu et al., 2020; Mehra et al., 2020; Patanavanich and Glantz, 2020). For
                                    example, a multi-center study involving 8910 COVID-19 cases from 169 hospitals in Europe and
                                    North America identified an increased risk of in-hospital death among current smokers (odds ratio
                                    [OR]=1.79; 95% CI: 1.29–2.47) compared with ever-smokers or non-smokers (Mehra et al., 2020).
                                        Consistent with findings from large-scale population-based observational studies, a laboratory-
                                    based study involving 131 RNA-sequenced human lung cancer tissues (54 samples of European
                                    ancestry individuals and 77 samples of Asian ancestry individuals) found that smokers expressed a
                                    significantly higher level of ACE2 compared to non-smokers in both populations, leading to a poten-
                                    tially heightened susceptibility to SARS-CoV-2 infection (Cai, 2020). Furthermore, incorporating two
                                    additional DNA microarray datasets of lung cancer, the significant smoking-ACE2 association
                                    observed in a total of 224 samples did not alter after adjusting for age, sex, race, and platforms.
                                    Nevertheless, these samples are derived from lung cancer patients, restricting its generalizability to
                                    normal lung tissues and to the general population. In a related work, Rao et al. conducted a phe-
                                    nome-wide Mendelian randomization (MR) study examining an extensive amount of diseases, traits,
                                    and blood proteins and identified several ‘exposures’ including diabetes, breast cancer, lung cancer,
                                    inflammatory bowel disease, and smoking to increase ACE2 expression in normal lung tissue
                                    (Rao et al., 2020). This analysis, despite its substantially augmented number of exposures (N=3948),
                                    has several limitations. First of all, disease status such as diabetes and cancers are difficult to modify,
                                    at the population level it is more important to discover and intervene with modifiable risk factors
                                    such as smoking and alcohol consumption. However, regarding smoking, only three single nucleo-
                                    tide polymorphisms (SNPs) were used as instrumental variables (IVs) by Rao et al., which explained
                                    negligible phenotypic variation and did not accurately predict smoking status. The hitherto largest
                                    genome-wide association study (GWAS) of tobacco use was conducted in a total of 1.2 million indi-
                                    viduals and discovered over 400 genetic variants associated with smoking initiation and intensity
                                    (Liu et al., 2019). Last but not least, Rao et al. focused on lung tissue instead of systemically examin-
                                    ing all human tissues. Despite lungs being the most relevant and vulnerable organ to a respiratory
                                    syndrome COVID-19, recent studies have identified the involvement of other human tissues (e.g.
                                    gastrointestinal tract) in SARS-CoV-2 infection (Zou et al., 2020).
                                        Motivated by these findings, we aim to explore whether genetic predisposition to common
                                    human modifiable behaviours including smoking and alcohol consumption could lead to an
                                    increased ACE2 expression, which subsequently yields to an increased susceptibility and severity of
                                    COVID-19. Here, we conduct a phenome-wide MR analysis by incorporating ACE2 expressions from
                                    a broad spectrum of tissues/organs available in the GTEx database. As one of the hitherto largest
                                    databases with concomitant information on DNA genotype and RNA expression, GTEx collects a
                                    large variety of tissues (N=44) from healthy population (deceased donors) (Gamazon et al., 2018).
                                    In addition, data on COVID-19 susceptibility and severity were obtained from COVID-19 Host Genet-
                                    ics Initiative, a global project aims to understand the role of host genome in COVID-19 outcome
                                    (COVID-19 Host Genetics Initiative, 2020). Hundreds of genetic variants identified by a large-scale
                                    GWAS of tobacco use and alcohol consumption were used as IVs – incorporating additional loci
                                    greatly enhances the strength of genetic instruments as well as both accuracy and precision of MR
                                    estimates (Liu et al., 2019).

                                    Materials and methods
                                    Data on IV-exposure
                                    IV-exposure associations were extracted from the hitherto largest GWAS conducted by the GCSCAN
                                    consortium (GWAS and Sequencing Consortium of Alcohol and Nicotine use) for tobacco use and
                                    alcohol consumption, totalling 1.2 million individuals of European ancestry (Liu et al., 2019). This
                                    GWAS firstly meta-analysed summary-level data from each participating cohort and identified inde-
                                    pendent SNPs passing genome-wide significance (p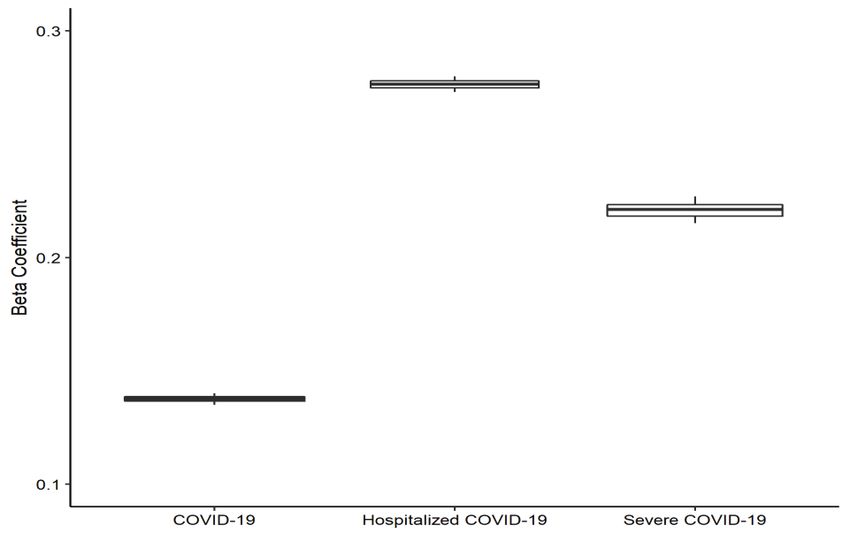
Research article                                                                                     Epidemiology and Global Health

                                       In our analysis, we included two smoking phenotypes and one drinking phenotype, smoking initia-
                                    tion as reflected by never vs. ever smoking (IV=378, N=1,232,091), smoking intensity as reflected by
                                    cigarettes per day (IV=55, N=337,334), and common (opposing to excessive or harmful) alcohol
                                    drinking behaviour defined as drinks per week (IV=99, N=941,280). The proportion of phenotypic
                                    variance explained by IVs accounted for 2.3% for smoking initiation, 1.1% for cigarettes per day, and
                                    0.2% for drinks per week. Detailed information regarding IVs for each exposure were shown in
                                    Supplementary file 1a-1c.
                                       Strong instrumental variable is the basic requirement to ensure a valid MR result. The strength of
                                                                                                          2
                                    IV was verified by calculating F-statistics using the formula F ¼ Rð1ðn R12 ÞkkÞ, where R2 is the proportion
                                    of variance explained by the IV, k refers to the number of IVs, and n indicates the sample size
                                    (Pierce et al., 2011). The F-statistics for smoking initiation, smoking intensity (cigarettes per day),
                                    and alcohol consumption (drinks per week) were 77.2, 67.4, and 17.8, respectively, indicating strong
                                    IVs (F-statistics > 10) for each of our exposure of interest.

                                    Data on IV-outcome
                                    Associations of genetic variants with ACE2 expression were extracted from the GTEx database
                                    release version 8 available at the GTEx Portal (http://www.gtexportal.org). It is one of the largest
                                    databases with concomitant information on genotype and expression data for a large variety of non-
                                    diseased tissues collected from >1000 human donors. Out of the total 54 tissues/organs, we focused
                                    on ACE2 expression in 44 tissues/organs with a decent sample size involving at least 100 individuals
                                    to ensure statistical power (Supplementary file 1d). Specifically, the associations of genotype with
                                    ACE2 expression in adipose tissue, artery, brain, colon, oesophagus, heart, liver, lung, minor salivary
                                    gland, muscle, nerve, ovary, pancreas, pituitary, prostate, skin, small intestine, stomach, testis, thy-
                                    roid, uterus, and vagina were included.
                                        Unlike most existing MR studies that consider disease status as outcomes, this MR study treats
                                    gene expression levels as outcomes. GTEx identifies expression quantitative trait loci (eQTL) by asso-
                                    ciating genetic variations called from GWAS with gene expression levels obtained from RNA-
                                    sequencing. Expression values for each gene were inverse quantile normalized to a standard normal
                                    distribution across samples as previously described (Gamazon et al., 2018). Please note, here we
                                    studied ACE2 RNA expression instead of its actual protein expression. Since ACE2 RNA and protein
                                    quantities have been found to be well correlated in tissues such as lung and kidney (Wang et al.,
                                    2020), ACE2 RNA expression acts as a good proxy for ACE2 protein expression.
                                        In addition to ACE2 expression, associations of genetic variants with COVID-19 susceptibility and
                                    severity were extracted from the COVID-19 Host Genetics Initiative (https://www.covid19hg.org). It
                                    is a global genetics collaboration aiming to explore the genetic determinants of COVID-19 suscepti-
                                    bility and severity. We used the summary statistics from the data freeze 5 of GWAS meta-analysis,
                                    which was released publicly on January 18, 2021. Three COVID-19 outcomes, including susceptibility
                                    to COVID-19, hospitalized COVID-19, and very severe respiratory confirmed COVID-19, were used
                                    in our analysis.
                                        Briefly, susceptibility to COVID-19 cases was defined as individuals with laboratory-confirmed
                                    positive for SARS-Cov-2 infection (via nucleic acid amplification test or serological test), clinician
                                    diagnosis, health record evidence by ICD coding, or self-reported (Ncase=38,984 vs. Ncon-
                                    trol=1,644,784). Hospitalized COVID-19 cases were defined as individuals hospitalized due to
                                    COVID-19 related symptoms with laboratory-confirmed positive for SARS-Cov-2 infection
                                    (Ncase=9986 vs. Ncontrol=1,877,672). Very severe respiratory confirmed COVID-19 cases were defined
                                    as hospitalized individuals with laboratory-confirmed positive for SARS-Cov-2 infection, who needed
                                    respiratory support except for simple oxygen supplementary or died due to COVID-19 (Ncase=5101
                                    vs. Ncontrol=1,383,241).

                                    Statistical analysis
                                    MR uses SNPs as proxies for exposure(s) assuming that SNPs are randomly allotted at conception
                                    mirroring a randomized procedure and that SNPs always precede disease onset to eliminate reverse
                                    causality. Three essential model assumptions need to be fulfilled to guarantee valid IVs
                                    (Zheng et al., 2017), that is, IVs are associated with the exposure (relevance assumption); there is no
                                    association between IVs and any confounders of the exposure-outcome relationship (independence

Liu et al. eLife 2021;10:e64188. DOI: https://doi.org/10.7554/eLife.64188                                                                3 of 18
Research article Epidemiology and Global Health
assumption); and IVs are associated with the outcome only through the studied exposure (exclusion
restriction assumption). If all three model assumptions are satisfied, a causal relationship can be
made based on the observed IV-exposure and IV-outcome associations.
We conducted a two-sample MR, where IV-exposure and IV-outcome associations were estimated
in two non-overlapping samples. The inverse-variance weighted (IVW) approach was applied as the
primary method to estimate the causal link between exposures (smoking and alcohol consumption)
and outcomes (ACE2 expression and COVID-19 related adverse outcomes) (Burgess et al., 2015).
The causal estimate is calculated as a ratio of which the IV-outcome association was divided by the
IV-exposure association for each IV and combined across multiple IVs weighted by the reciprocal of
an approximate expression for their asymptotic variance. To evaluate potential heterogeneity among
causal effects of different genetic variants, Cochran’s Q test was performed and pResearch article Epidemiology and Global Health
GWAS & Sequencing Consortium of Alcohol and Nicotine use (GSCAN)
• Smoking initiation: never vs. ever smoking.
• Cigarettes per day: to measure the heaviness of smoking.
• Drinks per week: to measure alcohol use.
The primary focus of the original GWAS was to test variants
with minor allele frequency (MAF) ≥1%, as these will be
imputed with high confidence. The statistical significance
threshold was set as 5.0ൈ10-8.
Independent SNPs that were associated with each trait
passing the significance threshold were selected as
instruments.
After meta-GWAS
• 378 SNPs were associated with smoking initiation
• 55 SNPs were associated cigarette per day
• 99 SNPs were associated with drinks per week
In our MR analysis, these instruments were further removed
• SNPs that were not matched to the outcome (ACE2
tissue expression and COVID19 related outcomes)
• SNPs with genotyping call rate < 95%
• SNPs with linkage disequilibrium ݎ2 < 0.1
• P-value for Hardy-Weinberg equilibrium test < 1.0ൈ10-6
For our primary MR analysis
• 351-362 smoking initiation-associated SNPs, 45-49 cigarettes/day-
associated SNPs and 84-90 drinks/week-associated SNPs were included.
• Number of instruments differs by different tissue types (our outcome).
• ~80-95% coverage of the original GWAS-identified independent SNPs.
Figure 1. Flowchart on the selection of instrumental variables.
Additionally, increased ACE2 expression in two colon tissues was observed only through the MR-
Egger regression (transverse colon [b=1.129, p=0.017] and sigmoid colon [b=1.925, p=0.042]) and
the direction of estimates remained consistent in the IVW approach. For all these associations, we
did not find apparent heterogeneity as indicated by Cochran’s Q statistics (all p>0.05) or horizontal
pleiotropy as indicted by MR-Egger intercept (all p>0.05) and MR-PRESSO global test (all
p>1.010 6), except that horizontal pleiotropy was observed in transverse colon by MR-Egger inter-
cept (p=0.04). Although significant associations of smoking initiation with ACE2 expression in brain
caudate basal ganglia and in cerebellar hemisphere were found using the IVW approach, the direc-
tion of estimates was opposite in the MR-Egger regression (Supplementary file 1f). These associa-
tions were therefore not considered as informative.
Liu et al. eLife 2021;10:e64188. DOI: https://doi.org/10.7554/eLife.64188 5 of 18Research article Epidemiology and Global Health
Table 1. Causal association of smoking initiation and angiotensin-converting enzyme 2 (ACE2) expression.
Organ/tissue Method N of IVs Beta SE p p*
Adipose – subcutaneous Inverse-variance weighted 358 0.285 0.118 0.016 0.834
MR-Egger 358 0.663 0.522 0.205 0.456
Weighted median 358 0.142 0.186 0.444
MR-PRESSO 358 0.285 0.118 0.017 0.846
Brain – hypothalamus Inverse-variance weighted 356 0.848 0.369 0.022 0.614
MR-Egger 356 0.963 1.588 0.545 0.941
Weighted median 356 0.549 0.566 0.332
MR-PRESSO 356 0.848 0.369 0.022 0.655
Brain – putamen Inverse-variance weighted 357 1.117 0.406 0.006 0.334
(basal ganglia)
MR-Egger 357 1.667 1.724 0.334 0.743
Weighted median 357 1.256 0.607 0.039
MR-PRESSO 357 1.117 0.406 0.006 0.321
Colon – sigmoid Inverse-variance weighted 359 0.314 0.214 0.143 0.887
MR-Egger 359 1.925 0.945 0.042 0.080
Weighted median 359 0.473 0.334 0.156
MR-PRESSO 359 0.314 0.214 0.144 0.904
Colon – transverse Inverse-variance weighted 359 0.193 0.113 0.088 0.348
MR-Egger 359 1.129 0.471 0.017 0.041
Weighted median 359 0.262 0.165 0.114
MR-PRESSO 359 0.193 0.113 0.089 0.362
*
p indicates p-value of heterogenous from inverse-variance weighted (IVW) approach, or p-value of intercept from MR-Egger regression, or p-value from
Mendelian randomization pleiotropy residual sum and outlier (MR-PRESSO) global test.
We further identified that genetically predicted smoking intensity as reflected by cigarettes per
day was associated with a significantly elevated ACE2 expression in thyroid (b=1.468, p=1.810 8),
in liver (b=1.216, p=0.009), in brain hypothalamus (b=1.789, p=0.014), and in ovary (b=1.545,
p=0.026) using the IVW method (Table 2). Results remained directional consistent in the MR-Egger
regression (b=1.739, p=0.062 in thyroid; b=1.132, p=0.226 in liver; b=0.041, p=0.983 in brain hypo-
thalamus; b=1.658, p=0.347 in ovary). On the contrary, levels of ACE2 expression decreased with
genetically instrumented smoking intensity in sigmoid colon tissue (b= 1.971, p=0.019) and in
vagina tissue (b= 3.271, p=0.043) using the MR-Egger regression. For all these associations, no
apparent horizontal pleiotropy and heterogeneity was found (Supplementary file 1g).
For alcohol consumption defined as drinks per week, only one suggestive association with ACE2
expression in tibial nerve was observed using the IVW approach (b= 1.462, p=0.006). However, the
direction of effect from the MR-Egger regression was opposite (b=0.336, p=0.721). We therefore
considered an overall null association as our main finding with alcohol consumption
(Supplementary file 1h).
In the sensitivity analyses where we excluded palindromic or pleiotropic SNPs, results remained
largely consistent with our primary findings (full results shown in Supplementary file 1i-1n). We
sequentially excluded proxy SNPs to identify random error introduced by imperfect proxies. In the
leave-one-out analyses where we iteratively removed one SNP each time and performed the IVW
approach using the remaining SNPs, results were again concordant with our primary findings, indi-
cating an absence of outlying SNPs (Appendix 1—figure 1).
Finally, complementing to findings of ACE2 expression, we tested a putative causal link between
smoking status, smoking intensity, alcohol consumption, and the risk of COVID-19 related adverse
outcomes. We found that smoking initiation significantly increased the risk of COVID-19 onset (IVW:
OR=1.15, 95%CI: 1.07–1.23, p=8.710 5) even after taking into account multiple comparisons
(Table 3). Results remained significant in the weighted median, and MR-PRESSO methods, however,
Liu et al. eLife 2021;10:e64188. DOI: https://doi.org/10.7554/eLife.64188 6 of 18Research article Epidemiology and Global Health
Table 2. Causal association of cigarettes per day and angiotensin-converting enzyme 2 (ACE2) expression.
Organ/tissue Method N of IVs Beta SE p p*
Brain – hypothalamus Inverse-variance weighted 48 1.789 0.730 0.014 0.959
MR-Egger 48 0.041 1.920 0.983 0.310
Weighted median 48 2.182 1.347 0.105
MR-PRESSO 48 1.789 0.730 0.018 0.964
Colon – sigmoid Inverse-variance weighted 47 0.832 0.439 0.058 0.652
MR-Egger 47 1.971 0.807 0.019 0.092
Weighted median 47 1.182 0.747 0.114
MR-PRESSO 47 0.832 0.439 0.064 0.701
Liver Inverse-variance weighted 47 1.216 0.468 0.009 0.807
MR-Egger 47 1.132 0.922 0.226 0.913
Weighted median 47 1.058 0.850 0.213
MR-PRESSO 47 1.216 0.468 0.012 0.843
Ovary Inverse-variance weighted 48 1.545 0.693 0.026 0.837
MR-Egger 48 1.658 1.745 0.347 0.943
Weighted median 48 2.545 1.217 0.037
MR-PRESSO 48 1.545 0.693 0.031 0.844
4
Thyroid Inverse-variance weighted 47 1.468 0.392 1.810 0.604
MR-Egger 47 1.739 0.907 0.062 0.739
Weighted median 47 1.435 0.641 0.025
4
MR-PRESSO 47 1.468 0.392 5.010 0.670
Vagina Inverse-variance weighted 48 1.150 0.688 0.094 0.055
MR-Egger 48 3.271 1.574 0.043 0.142
Weighted median 48 2.644 0.916 0.004
MR-PRESSO 48 1.150 0.688 0.101 0.057
*
p indicates p-value of heterogenous from inverse-variance weighted (IVW) approach, or p-value of intercept from MR-Egger regression, or p-value from
Mendelian randomization pleiotropy residual sum and outlier (MR-PRESSO) global test.
Table 3. Causal link of smoking initiation with the risk of coronavirus disease 2019 (COVID-19) related adverse outcomes.
Outcome Method N of IVs OR (95% CI) p p*
5 5
COVID-19 susceptibility Inverse-variance weighted 352 1.15 (1.07–1.23) 8.710 6.710
MR-Egger 352 1.11 (0.83–1.49) 0.489 0.821
4
Weighted median 352 1.18 (1.08–1.29) 2.910
4 5
MR-PRESSO 352 1.15 (1.07–1.23) 1.010 5.010
5
Hospitalized COVID-19 Inverse-variance weighted 351 1.32 (1.16–1.50) 3.710 0.009
MR-Egger 351 0.78 (0.44–1.36) 0.383 0.059
Weighted median 351 1.37 (1.14–1.66) 0.001
5
MR-PRESSO 351 1.32 (1.16–1.50) 4.610 0.011
Very severe Inverse-variance weighted 352 1.25 (1.03–1.51) 0.025 0.114
respiratory confirmed
COVID-19 MR-Egger 352 0.83 (0.37–1.89) 0.658 0.318
Weighted median 352 1.17 (0.89–1.55) 0.267
MR-PRESSO 352 1.25 (1.03–1.51) 0.025 0.119
*
p indicates p-value of heterogeneous from inverse-variance weighted (IVW) approach, or p-value of intercept from MR-Egger regression, or p-value from
Mendelian randomization pleiotropy residual sum and outlier (MR-PRESSO) global test.
Liu et al. eLife 2021;10:e64188. DOI: https://doi.org/10.7554/eLife.64188 7 of 18Research article Epidemiology and Global Health
showed larger statistical uncertainties in the MR-Egger regression. In addition, smoking initiation
increased the risk of very severe respiratory confirmed COVID-19 and hospitalized COVID-19 using
the IVW approach, but the results were not supported by the MR-Egger regression. Smoking inten-
sity (cigarettes per day) only increased the risk of very severe respiratory confirmed COVID-19 as
shown in the MR-Egger regression (OR=5.99, 95%CI: 1.57–22.84, p=0.012) (Supplementary file 1o).
On the contrary, we did not find a causal link between alcohol consumption (drinks per week) and
the risk of COVID-19 adverse outcomes (Supplementary file 1p). Findings did not alter in the sensi-
tivity analyses (Supplementary file 1q-r and Appendix 1—figure 4).
Discussion
We conducted a large-scale genetic analysis to understand the role of cigarette smoking and alcohol
consumption with ACE2 expression in multiple tissues/organs, comprehending its role in the preven-
tion of COVID-19. Strong IVs were constructed using hundreds of SNPs associated with smoking
and alcohol consumption. We capitalized on the summary statistics of the largest tissue-specific
eQTL conducted for ACE2 expression levels and the most up-to-date GWAS data of COVID-19
related adverse outcomes. We found a putative causal relationship between smoking-related pheno-
types and an increased ACE2 expression in multiple tissues, as well as an increased susceptibility
and severity of COVID-19.
Our findings are supported by previous epidemiological studies which have demonstrated a sig-
nificant association between smoking and COVID-19 disease progression or death (Guan et al.,
2020; Hu et al., 2020; Mehra et al., 2020). For example, a study involving 214 patients with labora-
tory confirmed COVID-19 from Wenzhou China found that compared to non-severe cases, patients
with severe disease were more likely to be smokers (26.3% vs. 6.4%, p = 0.038) (Zheng et al.,
2020). Another study recruiting 78 patients with COVID-19 in Wuhan also found a higher proportion
of ever-smokers in COVID-19 progression group than in the improvement/stabilization group
(OR=14.28, 95% CI:1.58–25.00, p=0.018) (Liu et al., 2020). Consistent with these findings, a meta-
analysis on a total of 11,590 COVID-19 cases demonstrated a higher proportion of smokers among
2133 patients experienced disease progression, suggesting that smoking aggravated COVID-19 pro-
gression (OR=1.91, 95% CI: 1.42–2.59) (Patanavanich and Glantz, 2020). On the contrary, a few
small-scale studies with sample sizes ranging from 44 to 191 conducted in Wuhan China did not
report remarkable association of smoking with COVID-19 severity or progression (Huang et al.,
2020; Yang et al., 2020; Zhang et al., 2020; Zhou et al., 2020b). For instance, a retrospective
study including 191 patients of which 137 survived and 54 non-survived found a comparable propor-
tion of smokers in survivors and non-survivors (9% vs. 4%, p=0.21) (Zhou et al., 2020b). A meta-anal-
ysis including five studies (four in Wuhan and one across 30 provinces in Mainland China)
(Guan et al., 2020; Liu et al., 2020; Huang et al., 2020; Yang et al., 2020; Zhang et al., 2020)
involving 1399 individuals with COVID-19 revealed no significant association between smoking and
disease severity (OR=1.69, 95% CI: 0.41–6.92) (Lippi and Henry, 2020). Opposite to the findings
from Asian population, evidence from the Veterans Affairs Birth Cohort in a US population found
that current smoking was associated with a lower risk of COVID-19 susceptibility (OR=0.45, 95% CI:
0.35–0.57) (Rentsch et al., 2020). The contradictory results in those small-scale studies might be
due to insufficient power, low proportion of smokers, and a limited representativeness of the study
population. For example, compared with the high proportion of smokers in China (an average 26.6%
prevalence in the general population), only 1.4% patients were current smokers in the study con-
ducted by Zhang et al., 2020 and 12.6% in the study conducted by Guan et al., 2020. Given these
discrepancies, additional studies are warranted to confirm the role of smoking in both the onset and
progression of COVID-19.
In addition to clinical observational studies, laboratory examination has demonstrated the impor-
tance of tissues specificity. For example, Cai et al. identified that smoking was associated with an
elevated expression of ACE2 in the lung, providing biological evidence of smoking with an increased
susceptibility to SARS-CoV-2 infection or severity (Cai, 2020). Moreover, Rao et al. conducted a phe-
nome-wide MR study incorporating 3948 traits, diseases, and blood proteins and identified a nomi-
nal significant association between tobacco use and ACE2 expression in the lung (IVW: b=0.918,
p=0.016) (Rao et al., 2020). However, this association did not pass multiple comparisons (p-value
Liu et al. eLife 2021;10:e64188. DOI: https://doi.org/10.7554/eLife.64188 8 of 18Research article Epidemiology and Global Health
for FDR was 0.51), which was consistent with our MR results using a greatly augmented number of
IVs (for smoking status IV=378).
The biological mechanisms underlying smoking and tissue-specific ACE2 expression remain to be
disclosed. ACE2 has been considered as the target receptor of SARS-CoV-2 entry into the host cells
and an increased expression of ACE2 appears to raise both the susceptibility and severity of COVID-
19. As a type I transmembrane metallocarboxypeptidase homologous to ACE, ACE2 is known to be
expressed in a variety of tissues, including respiratory tract, cardio-renal tissues, and gastrointestinal
tissues (Harmer et al., 2002). Our study found that smoking increased ACE2 expression in multiple
tissues including the brain and colon tissues. While SARS-CoV-2 mainly spreads via respiratory tract,
enrichment of SARS-CoV-2 in gastrointestinal tract has been confirmed by testing viral RNA in stool
from 71 patients with COVID-19, suggesting the importance of gastrointestinal involvement in the
infection (Xiao et al., 2020). Furthermore, nearly one-fifth COVID-19 patients remained SARS-CoV-2
RNA-positive in their stool, despite negative results in their respiratory samples. Of those 71
patients, ACE2 was abundantly expressed in the gastrointestinal epithelia, but rarely expressed in
the esophageal epithelia. In addition, findings from public databases (GEO, GTEx, and HPA) have
demonstrated a higher expression level of ACE2 in the gastrointestinal tract (colon, rectal, and small
intestine) and liver than in the lung (Burgueño et al., 2020; Li et al., 2020; Pirola and Sookoian,
2020). Taking these pieces of evidence together, we could reasonably assume that the biological
mechanisms underlying the link between ACE2 expression and COVID-19 susceptibility are compli-
cated, involving multiple organs other than the lung. Consistent with our findings on a link between
smoking and increased ACE2 expression in both transverse colon and sigmoid colon, these results
collectively suggest that smoking mediates ACE2 expression in gastrointestinal tract, subsequently
influence the susceptibility and severity of COVID-19.
We also found that smoking influenced ACE2 expression in the brain tissue, especially in putamen
basal ganglia and hypothalamus. Smoking may promote cellular uptake of SARS-CoV-2 through nic-
otinic acetylcholine receptor (nAChR) signalling (Russo et al., 2020). It is worth noting that nAChR
and ACE2 are known to be co-expressed on many sites such as cortex, striatum, and hypothalamus
within human brain (Dani and Bertrand, 2007; Jones et al., 2009). Nicotine stimulation of the
nAChR increased ACE2 expression within neural cells, indicating a likelihood that smokers are more
vulnerable to COVID-19 (Olds and Kabbani, 2020).
To the best of our knowledge, we performed a large-scale phenome-wide MR study to under-
stand a causal role of smoking and alcohol consumption in ACE2 expression, as well as in COVID-19
related outcomes, totalling 532 genetic associations from 1.2 million individuals of European ances-
try and covering almost all tissues/organs of human body (N=44). In addition, we rigorously selected
proxy SNPs and performed a series of sensitivity analyses to satisfy MR model assumptions, for
example, we satisfied the ‘relevance’ assumption by using GWAS-identified significant SNPs as IVs;
we ensured the ‘independent’ assumption and the ‘exclusion restriction’ assumption by performing
several important sensitivity analyses. However, limitations need to be acknowledged. Although hun-
dreds of SNPs were used as proxies for cigarette smoking and alcohol consumption, these GWAS-
identified SNPs explained only a small fraction (1–2%) of phenotypic variance. In addition, the mini-
mum sample size of 114 in brain substantia nigra tissue further limited the statistical power of MR
analysis, albeit GTEx database is so far the largest available database with both genotype and
expression data. Moreover, data on the genotypes, tissue expression, and COVID-19 related out-
comes of our analyses were all based on European ancestry populations, restricting its generalizabil-
ity to other ethnicities. On the other hand, our data, with exposure and outcome GWAS(s) (or
eQTLs) conducted using individuals of the same underlying populations (all European ancestry),
greatly reduces the population stratification as well as satisfies the MR model assumption – for a
two-sample MR to be valid, the two samples have to be preferably from the same ethnicity. Finally,
we have to acknowledge that few of our significant associations passed the stringent Bonferroni cor-
rections. Our results provide a comprehensive picture for the causal relationship of smoking with
ACE2 expression in various tissues and with COVID-19 susceptibility and severity, yet we stress cau-
tion for interpretation and extra analyses are needed to replicate these findings.
In conclusion, genetically instrumented smoking phenotypes reflected by both smoking initiation
and smoking intensity are significantly associated with a high expression level of ACE2 in multiple tis-
sues/organs, subsequently increasing the susceptibility and severity of COVID-19. Our results pro-
vide important clinical implications on that smokers might be more vulnerable to SARS-CoV-2
Liu et al. eLife 2021;10:e64188. DOI: https://doi.org/10.7554/eLife.64188 9 of 18Research article Epidemiology and Global Health
infection or severe disease. At the population level, smoking cessation is also an important action-
able prevention strategy to COVID-19. Further studies are needed to confirm or refute our findings.
Acknowledgements
We would like to thank the GSCAN consortium, the GTEx Program, and the COVID-19 Host Genet-
ics Initiative for the release of their data.
Additional information
Funding
Funder Grant reference number Author
Swedish Research Council VR-2018-02247 Xia Jiang
Swedish Research Council for FORTE-2020-00884 Xia Jiang
Health, Working Life and Wel-
fare
The funders had no role in study design, data collection and interpretation, or the
decision to submit the work for publication.
Author contributions
Hui Liu, Data curation, Writing - original draft, Writing - review and editing; Junyi Xin, Sheng Cai,
Data curation, Formal analysis, Writing - review and editing; Xia Jiang, Conceptualization, Supervi-
sion, Writing - original draft, Writing - review and editing
Author ORCIDs
Hui Liu https://orcid.org/0000-0002-5531-3640
Junyi Xin http://orcid.org/0000-0001-6677-3936
Xia Jiang https://orcid.org/0000-0001-5878-8986
Decision letter and Author response
Decision letter https://doi.org/10.7554/eLife.64188.sa1
Author response https://doi.org/10.7554/eLife.64188.sa2
Additional files
Supplementary files
. Supplementary file 1. Supplementary results of the causality of smoking and alcohol consumption
on angiotensin-converting enzyme 2 (ACE2) expression and coronavirus disease 2019 (COVID-19)
related outcomes. (a) Information of genome-wide significant single nucleotide polymorphisms
(SNPs) associated with smoking initiation. (b) Information of genome-wide significant SNPs associ-
ated with cigarettes per day. (c) Information of genome-wide significant SNPs associated with drinks
per week. (d) Sample size of ACE2 expression in 44 tissues/organs from GTEx database. (e) Statisti-
cal power in Mendelian randomization study on causal association of smoking and alcohol consump-
tion with ACE2 expression andCOVID-19 related adverse outcomes. (f) Causal association of
smoking initiation and ACE2 expression. (g) Causal association of cigarettes per day and ACE2
expression. (h) Causal association of drinks per week and ACE2 expression. (i) Causal association of
smoking initiation and ACE2 expression excluding palindromic SNPs. (j) Causal association of ciga-
rettes per day and ACE2 expression excluding palindromic SNPs. (k) Causal association of drinks per
week and ACE2 expression excluding palindromic SNPs. (l) Causal association of smoking initiation
and ACE2 expression excluding pleiotropic SNPs. (m) Causal association of cigarettes per day and
ACE2 expression excluding pleiotropic SNPs. (n) Causal association of drinks per week and ACE2
expression excluding pleiotropic SNPs. (o) Causal association of cigarettes per day with the risk of
COVID-19 related adverse outcomes. (p) Causal association of drinks per week with the risk of
COVID-19 related adverse outcomes. (q) Causal association of smoking and alcohol consumption
Liu et al. eLife 2021;10:e64188. DOI: https://doi.org/10.7554/eLife.64188 10 of 18Research article Epidemiology and Global Health
with the risk of COVID-19 related adverse outcomes excluding palindromic SNPs. (r) Causal associa-
tion of smoking and alcohol consumption with the risk of COVID-19 related adverse outcomes
excluding pleiotropic SNPs.
. Transparent reporting form
Data availability
All data generated or analysed during this study are publicly-available. Data of the GSCAN consor-
tium, the GTEx project, and the COVID-19 Host Genetics Initiative can be acessed at https://
genome.psych.umn.edu/index.php/GSCAN, https://www.gtexportal.org, and https://www.cov-
id19hg.org, respectively. Furthermore, data and main programming codes with annotations have
been uploaded to GitHub and made publicly available at https://github.com/hye-hz/MR_Smoke_
COVID19.git (copy archived at https://archive.softwareheritage.org/swh:1:rev:
1a2038517d8f2c7c772e69c9c5abab7713add9bb).
References
Bowden J, Davey Smith G, Burgess S. 2015. Mendelian randomization with invalid instruments: effect estimation
and Bias detection through egger regression. International Journal of Epidemiology 44:512–525. DOI: https://
doi.org/10.1093/ije/dyv080, PMID: 26050253
Bowden J, Davey Smith G, Haycock PC, Burgess S. 2016. Consistent estimation in mendelian randomization with
some invalid instruments using a weighted median estimator. Genetic Epidemiology 40:304–314. DOI: https://
doi.org/10.1002/gepi.21965, PMID: 27061298
Brion MJ, Shakhbazov K, Visscher PM. 2013. Calculating statistical power in Mendelian randomization studies.
International Journal of Epidemiology 42:1497–1501. DOI: https://doi.org/10.1093/ije/dyt179, PMID: 24159078
Burgess S, Scott RA, Timpson NJ, Davey Smith G, Thompson SG, EPIC- InterAct Consortium. 2015. Using
published data in Mendelian randomization: a blueprint for efficient identification of causal risk factors.
European Journal of Epidemiology 30:543–552. DOI: https://doi.org/10.1007/s10654-015-0011-z,
PMID: 25773750
Burgueño JF, Reich A, Hazime H, Quintero MA, Fernandez I, Fritsch J, Santander AM, Brito N, Damas OM,
Deshpande A, Kerman DH, Zhang L, Gao Z, Ban Y, Wang L, Pignac-Kobinger J, Abreu MT. 2020. Expression of
SARS-CoV-2 Entry Molecules ACE2 and TMPRSS2 in the Gut of Patients With IBD. Inflammatory Bowel
Diseases 26:797–808. DOI: https://doi.org/10.1093/ibd/izaa085, PMID: 32333601
Cai G. 2020. Bulk and single-cell transcriptomics identify tobacco-use disparity in lung gene expression of ACE2,
the receptor of 2019-nCov. medRxiv. DOI: https://doi.org/10.1101/2020.02.05.20020107
Coronaviridae Study Group of the International Committee on Taxonomy of Viruses. 2020. The species
severe acute respiratory syndrome-related coronavirus: classifying 2019-nCoV and naming it SARS-CoV-2.
Nature Microbiology 5:536–544. DOI: https://doi.org/10.1038/s41564-020-0695-z, PMID: 32123347
COVID-19 Host Genetics Initiative. 2020. The COVID-19 host genetics initiative, a global initiative to elucidate
the role of host genetic factors in susceptibility and severity of the SARS-CoV-2 virus pandemic. European
Journal of Human Genetics 28:715–718. DOI: https://doi.org/10.1038/s41431-020-0636-6, PMID: 32404885
Dani JA, Bertrand D. 2007. Nicotinic acetylcholine receptors and nicotinic cholinergic mechanisms of the central
nervous system. Annual Review of Pharmacology and Toxicology 47:699–729. DOI: https://doi.org/10.1146/
annurev.pharmtox.47.120505.105214, PMID: 17009926
Gamazon ER, Segrè AV, van de Bunt M, Wen X, Xi HS, Hormozdiari F, Ongen H, Konkashbaev A, Derks EM,
Aguet F, Quan J, Nicolae DL, Eskin E, Kellis M, Getz G, McCarthy MI, Dermitzakis ET, Cox NJ, Ardlie KG, GTEx
Consortium. 2018. Using an atlas of gene regulation across 44 human tissues to inform complex disease- and
trait-associated variation. Nature Genetics 50:956–967. DOI: https://doi.org/10.1038/s41588-018-0154-4,
PMID: 29955180
Greco M FD, Minelli C, Sheehan NA, Thompson JR. 2015. Detecting pleiotropy in Mendelian randomisation
studies with summary data and a continuous outcome. Statistics in Medicine 34:2926–2940. DOI: https://doi.
org/10.1002/sim.6522, PMID: 25950993
Guan WJ, Ni ZY, Hu Y, Liang WH, Ou CQ, He JX, Liu L, Shan H, Lei CL, Hui DSC, Du B, Li LJ, Zeng G, Yuen KY,
Chen RC, Tang CL, Wang T, Chen PY, Xiang J, Li SY, et al. 2020. Clinical Characteristics of Coronavirus Disease
2019 in China. New England Journal of Medicine 382:1708–1720. DOI: https://doi.org/10.1056/
NEJMoa2002032, PMID: 32109013
Harmer D, Gilbert M, Borman R, Clark KL. 2002. Quantitative mRNA expression profiling of ACE 2, a novel
homologue of angiotensin converting enzyme. FEBS Letters 532:107–110. DOI: https://doi.org/10.1016/S0014-
5793(02)03640-2, PMID: 12459472
Hoffmann M, Kleine-Weber H, Schroeder S, Krüger N, Herrler T, Erichsen S, Schiergens TS, Herrler G, Wu NH,
Nitsche A, Müller MA, Drosten C, Pöhlmann S. 2020. SARS-CoV-2 Cell Entry Depends on ACE2 and TMPRSS2
and Is Blocked by a Clinically Proven Protease Inhibitor. Cell 181:271–280. DOI: https://doi.org/10.1016/j.cell.
2020.02.052, PMID: 32142651
Liu et al. eLife 2021;10:e64188. DOI: https://doi.org/10.7554/eLife.64188 11 of 18Research article Epidemiology and Global Health
Hu L, Chen S, Fu Y, Gao Z, Long H, Wang JM, Ren HW, Zuo Y, Li H, Wang J, Qb X, Wx Y, Liu J, Shao C, Hao JJ,
Wang CZ, Ma Y, Wang Z, Yanagihara R, Deng Y. 2020. Risk factors associated with clinical outcomes in 323
COVID-19 hospitalized patients in Wuhan, China. Clinical Infectious Diseases : An Official Publication of the
Infectious Diseases Society of America 3:ciaa539. DOI: https://doi.org/10.1093/cid/ciaa539
Huang C, Wang Y, Li X, Ren L, Zhao J, Hu Y, Zhang L, Fan G, Xu J, Gu X, Cheng Z, Yu T, Xia J, Wei Y, Wu W, Xie
X, Yin W, Li H, Liu M, Xiao Y, et al. 2020. Clinical features of patients infected with 2019 novel coronavirus in
Wuhan, China. The Lancet 395:497–506. DOI: https://doi.org/10.1016/S0140-6736(20)30183-5, PMID: 31
986264
Jones AR, Overly CC, Sunkin SM. 2009. The Allen Brain Atlas: 5 years and beyond. Nature Reviews Neuroscience
10:821–828. DOI: https://doi.org/10.1038/nrn2722, PMID: 19826436
Li W, Moore MJ, Vasilieva N, Sui J, Wong SK, Berne MA, Somasundaran M, Sullivan JL, Luzuriaga K, Greenough
TC, Choe H, Farzan M. 2003. Angiotensin-converting enzyme 2 is a functional receptor for the SARS
coronavirus. Nature 426:450–454. DOI: https://doi.org/10.1038/nature02145, PMID: 14647384
Li W, Zhang C, Sui J, Kuhn JH, Moore MJ, Luo S, Wong SK, Huang IC, Xu K, Vasilieva N, Murakami A, He Y,
Marasco WA, Guan Y, Choe H, Farzan M. 2005. Receptor and viral determinants of SARS-coronavirus
adaptation to human ACE2. The EMBO Journal 24:1634–1643. DOI: https://doi.org/10.1038/sj.emboj.7600640,
PMID: 15791205
Li MY, Li L, Zhang Y, Wang XS. 2020. Expression of the SARS-CoV-2 cell receptor gene ACE2 in a wide variety of
human tissues. Infectious Diseases of Poverty 9:45. DOI: https://doi.org/10.1186/s40249-020-00662-x,
PMID: 32345362
Lippi G, Henry BM. 2020. Active smoking is not associated with severity of coronavirus disease 2019 (COVID-19).
European Journal of Internal Medicine 75:107–108. DOI: https://doi.org/10.1016/j.ejim.2020.03.014, PMID: 321
92856
Liu M, Jiang Y, Wedow R, Li Y, Brazel DM, Chen F, Datta G, Davila-Velderrain J, McGuire D, Tian C, Zhan X,
Choquet H, Docherty AR, Faul JD, Foerster JR, Fritsche LG, Gabrielsen ME, Gordon SD, Haessler J, Hottenga
JJ, et al. 2019. Association studies of up to 1.2 million individuals yield new insights into the genetic etiology of
tobacco and alcohol use. Nature Genetics 51:237–244. DOI: https://doi.org/10.1038/s41588-018-0307-5,
PMID: 30643251
Liu W, Tao ZW, Wang L, Yuan ML, Liu K, Zhou L, Wei S, Deng Y, Liu J, Liu HG, Yang M, Hu Y. 2020. Analysis of
factors associated with disease outcomes in hospitalized patients with 2019 novel coronavirus disease. Chinese
Medical Journal 133:1032–1038. DOI: https://doi.org/10.1097/CM9.0000000000000775, PMID: 32118640
Mehra MR, Desai SS, Kuy S, Henry TD, Patel AN. 2020. Cardiovascular disease, drug therapy, and mortality in
Covid-19. New England Journal of Medicine 382:e102. DOI: https://doi.org/10.1056/NEJMoa2007621,
PMID: 32356626
Olds JL, Kabbani N. 2020. Is nicotine exposure linked to cardiopulmonary vulnerability to COVID-19 in the
general population? The FEBS Journal 287:3651–3655. DOI: https://doi.org/10.1111/febs.15303, PMID: 321
89428
Patanavanich R, Glantz SA. 2020. Smoking Is Associated With COVID-19 Progression: A Meta-analysis. Nicotine
& Tobacco Research 22:1653–1656. DOI: https://doi.org/10.1093/ntr/ntaa082, PMID: 32399563
Pierce BL, Ahsan H, Vanderweele TJ. 2011. Power and instrument strength requirements for Mendelian
randomization studies using multiple genetic variants. International Journal of Epidemiology 40:740–752.
DOI: https://doi.org/10.1093/ije/dyq151, PMID: 20813862
Pirola CJ, Sookoian S. 2020. COVID-19 and ACE2 in the Liver and Gastrointestinal Tract: Putative Biological
Explanations of Sexual Dimorphism. Gastroenterology 159:1620–1621. DOI: https://doi.org/10.1053/j.gastro.
2020.04.050, PMID: 32348773
Rao S, Lau A, So HC, Hc S. 2020. Exploring Diseases/Traits and Blood Proteins Causally Related to Expression of
ACE2, the Putative Receptor of SARS-CoV-2: A Mendelian Randomization Analysis Highlights Tentative
Relevance of Diabetes-Related Traits. Diabetes Care 43:1416–1426. DOI: https://doi.org/10.2337/dc20-0643,
PMID: 32430459
Rentsch CT, Kidwai-Khan F, Tate JP, Park LS, King JT, Skanderson M, Hauser RG, Schultze A, Jarvis CI, Holodniy
M, Vl R, Akgün KM, Crothers K, Taddei TH, Freiberg MS, Justice AC. 2020. Covid-19 testing, hospital
admission, and intensive care among 2,026,227 united states veterans aged 54-75 years. medRxiv. DOI: https://
doi.org/10.1101/2020.04.09.20059964
Russo P, Bonassi S, Giacconi R, Malavolta M, Tomino C, Maggi F. 2020. COVID-19 and smoking: is nicotine the
hidden link? European Respiratory Journal 55:2001116. DOI: https://doi.org/10.1183/13993003.01116-2020
Verbanck M, Chen CY, Neale B, Do R. 2018. Detection of widespread horizontal pleiotropy in causal
relationships inferred from Mendelian randomization between complex traits and diseases. Nature Genetics 50:
693–698. DOI: https://doi.org/10.1038/s41588-018-0099-7, PMID: 29686387
Wang Y, Wang Y, Luo W, Huang L, Xiao J, Li F, Qin S, Song X, Wu Y, Zeng Q, Jin F, Wang Y. 2020. A
comprehensive investigation of the mRNA and protein level of ACE2, the putative receptor of SARS-CoV-2, in
human tissues and blood cells. International Journal of Medical Sciences 17:1522–1531. DOI: https://doi.org/
10.7150/ijms.46695, PMID: 32669955
World Health Organization. 2020. Coronavirus Disease 2019 (COVID-19) Situation Report-36: WHO. https://
www.who.int/publications/m/item/situation-report—36.
Wrapp D, Wang N, Corbett KS, Goldsmith JA, Hsieh CL, Abiona O, Graham BS, McLellan JS. 2020. Cryo-EM
structure of the 2019-nCoV spike in the prefusion conformation. Science 367:1260–1263. DOI: https://doi.org/
10.1126/science.abb2507, PMID: 32075877
Liu et al. eLife 2021;10:e64188. DOI: https://doi.org/10.7554/eLife.64188 12 of 18Research article Epidemiology and Global Health
Xiao F, Tang M, Zheng X, Liu Y, Li X, Shan H. 2020. Evidence for Gastrointestinal Infection of SARS-CoV-2.
Gastroenterology 158:1831–1833. DOI: https://doi.org/10.1053/j.gastro.2020.02.055, PMID: 32142773
Yang X, Yu Y, Xu J, Shu H, Xia J, Liu H, Wu Y, Zhang L, Yu Z, Fang M, Yu T, Wang Y, Pan S, Zou X, Yuan S, Shang
Y. 2020. Clinical course and outcomes of critically ill patients with SARS-CoV-2 pneumonia in Wuhan, China: a
single-centered, retrospective, observational study. The Lancet Respiratory Medicine 8:475–481. DOI: https://
doi.org/10.1016/S2213-2600(20)30079-5, PMID: 32105632
Zhang JJ, Dong X, Cao YY, Yuan YD, Yang YB, Yan YQ, Akdis CA, Gao YD. 2020. Clinical characteristics of 140
patients infected with SARS-CoV-2 in Wuhan, China. Allergy 75:1730–1741. DOI: https://doi.org/10.1111/all.
14238, PMID: 32077115
Zheng J, Baird D, Borges MC, Bowden J, Hemani G, Haycock P, Evans DM, Smith GD. 2017. Recent
Developments in Mendelian Randomization Studies. Current Epidemiology Reports 4:330–345. DOI: https://
doi.org/10.1007/s40471-017-0128-6, PMID: 29226067
Zheng KI, Gao F, Wang XB, Sun QF, Pan KH, Wang TY, Ma HL, Chen YP, Liu WY, George J, Zheng MH. 2020.
Letter to the editor: obesity as a risk factor for greater severity of COVID-19 in patients with metabolic
associated fatty liver disease. Metabolism 108:154244. DOI: https://doi.org/10.1016/j.metabol.2020.154244,
PMID: 32320741
Zhou P, Yang XL, Wang XG, Hu B, Zhang L, Zhang W, Si HR, Zhu Y, Li B, Huang CL, Chen HD, Chen J, Luo Y,
Guo H, Jiang RD, Liu MQ, Chen Y, Shen XR, Wang X, Zheng XS, et al. 2020a. A pneumonia outbreak
associated with a new coronavirus of probable bat origin. Nature 579:270–273. DOI: https://doi.org/10.1038/
s41586-020-2012-7, PMID: 32015507
Zhou F, Yu T, Du R, Fan G, Liu Y, Liu Z, Xiang J, Wang Y, Song B, Gu X, Guan L, Wei Y, Li H, Wu X, Xu J, Tu S,
Zhang Y, Chen H, Cao B. 2020b. Clinical course and risk factors for mortality of adult inpatients with COVID-19
in Wuhan, China: a retrospective cohort study. The Lancet 395:1054–1062. DOI: https://doi.org/10.1016/
S0140-6736(20)30566-3, PMID: 32171076
Zou X, Chen K, Zou J, Han P, Hao J, Han Z. 2020. Single-cell RNA-seq data analysis on the receptor ACE2
expression reveals the potential risk of different human organs vulnerable to 2019-nCoV infection. Frontiers of
Medicine 14:185–192. DOI: https://doi.org/10.1007/s11684-020-0754-0, PMID: 32170560
Liu et al. eLife 2021;10:e64188. DOI: https://doi.org/10.7554/eLife.64188 13 of 18Research article Epidemiology and Global Health
Appendix 1
Appendix 1—figure 1. Leave-one-out analysis of causal association of smoking initiation with angio-
tensin-converting enzyme 2 (ACE2) expression. Each boxplot represents the centralized tendency of
effect sizes (beta coefficients) of smoking initiation on tissue-specific ACE2 expression based on the
results of leave-one-out analysis where we excluded one single nucleotide polymorphism (SNP) at a
time and performed inverse-variance weighted (IVW) using the remaining SNPs.
Liu et al. eLife 2021;10:e64188. DOI: https://doi.org/10.7554/eLife.64188 14 of 18Research article Epidemiology and Global Health
Appendix 1—figure 2. Leave-one-out analysis of causal association of cigarettes per day with angio-
tensin-converting enzyme 2 (ACE2) expression. Each boxplot represents the centralized tendency of
effect sizes (beta coefficients) of cigarettes per day on tissue-specific ACE2 expression based on the
results of leave-one-out analysis where we excluded one single nucleotide polymorphism (SNP) at a
time and performed inverse-variance weighted (IVW) using the remaining SNPs.
Liu et al. eLife 2021;10:e64188. DOI: https://doi.org/10.7554/eLife.64188 15 of 18Research article Epidemiology and Global Health
Appendix 1—figure 3. Leave-one-out analysis of causal association of drinks per week with angio-
tensin-converting enzyme 2 (ACE2) expression. Each boxplot represents the centralized tendency of
effect sizes (beta coefficients) of drinks per week on tissue-specific ACE2 expression based on the
results of leave-one-out analysis where we excluded one single nucleotide polymorphism (SNP) at a
time and performed inverse-variance weighted (IVW) using the remaining SNPs.
Liu et al. eLife 2021;10:e64188. DOI: https://doi.org/10.7554/eLife.64188 16 of 18Research article Epidemiology and Global Health
A
B
C
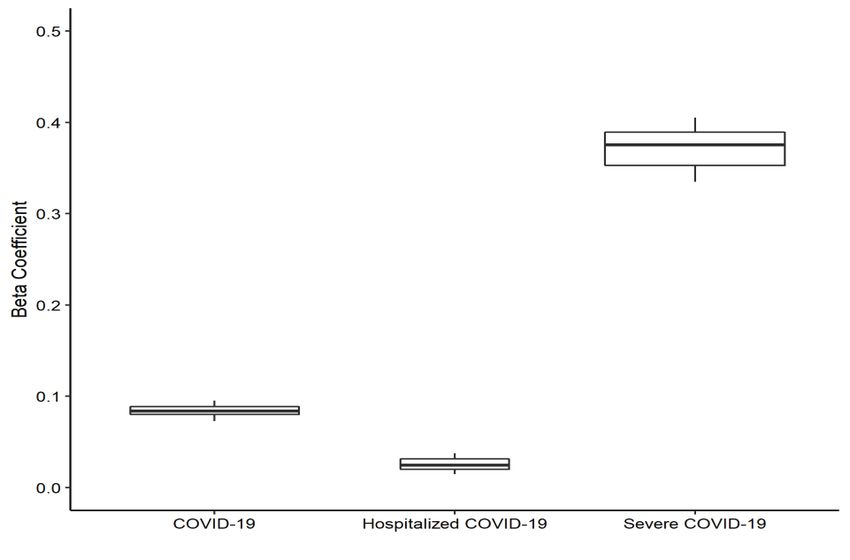
Appendix 1—figure 4. Leave-one-out analysis of causal association of smoking and alcohol con-
sumption with coronavirus disease 2019 (COVID-19) related adverse outcomes. (A) Leave-one-out
analysis of causal association of smoking initiation with COVID-19 related adverse outcomes. (B)
Appendix 1—figure 4 continued on next page
Liu et al. eLife 2021;10:e64188. DOI: https://doi.org/10.7554/eLife.64188 17 of 18Research article Epidemiology and Global Health
Appendix 1—figure 4 continued
Leave-one-out analysis of causal association of cigarettes per day with COVID-19 related adverse
outcomes. (C) Leave-one-out analysis of causal association of drinks per week with COVID-19 related
adverse outcomes. Each boxplot represents the centralized tendency of effect sizes (beta
coefficients) of exposure (including smoking and alcohol consumption) on COVID-19 related adverse
outcomes based on the results of leave-one-out analysis where we excluded one single nucleotide
polymorphism (SNP) at a time and performed inverse-variance weighted (IVW) using the remaining
SNPs. COVID-19 indicates susceptibility to COVID-19. Severe COVID-19 indicates very severe
respiratory confirmed COVID-19.
Liu et al. eLife 2021;10:e64188. DOI: https://doi.org/10.7554/eLife.64188 18 of 18You can also read