AGE/RAGE/DIAPH1 axis is associated with immunometabolic markers and risk of insulin resistance in subcutaneous but not omental adipose tissue in ...
←
→
Page content transcription
If your browser does not render page correctly, please read the page content below
International Journal of Obesity (2021) 45:2083–2094
                                    https://doi.org/10.1038/s41366-021-00878-3

                                        ARTICLE

                                    Clinical Research

                                    AGE/RAGE/DIAPH1 axis is associated with immunometabolic
                                    markers and risk of insulin resistance in subcutaneous but not
                                    omental adipose tissue in human obesity
                                    Henry H. Ruiz 1 Anh Nguyen2 Chan Wang3 Linchen He3 Huilin Li3 Peter Hallowell4 Coleen McNamara2
                                                           ●                  ●                    ●            ●            ●                     ●                         ●

                                    Ann Marie Schmidt1

                                    Received: 8 September 2020 / Revised: 19 May 2021 / Accepted: 27 May 2021 / Published online: 8 June 2021
                                    © The Author(s) 2021. This article is published with open access

                                    Abstract
                                    Background/objectives The incidence of obesity continues to increase worldwide and while the underlying pathogenesis
                                    remains largely unknown, nutrient excess, manifested by “Westernization” of the diet and reduced physical activity have
                                    been proposed as key contributing factors. Western-style diets, in addition to higher caloric load, are characterized by excess
1234567890();,:
                  1234567890();,:

                                    of advanced glycation end products (AGEs), which have been linked to the pathophysiology of obesity and related
                                    cardiometabolic disorders. AGEs can be “trapped” in adipose tissue, even in the absence of diabetes, in part due to higher
                                    expression of the receptor for AGEs (RAGE) and/or decreased detoxification by the endogenous glyoxalase (GLO) system,
                                    where they may promote insulin resistance. It is unknown whether the expression levels of genes linked to the RAGE axis,
                                    including AGER (the gene encoding RAGE), Diaphanous 1 (DIAPH1), the cytoplasmic domain binding partner of RAGE
                                    that contributes to RAGE signaling, and GLO1 are differentially regulated by the degree of obesity and/or how these relate to
                                    inflammatory and adipocyte markers and their metabolic consequences.
                                    Subjects/methods We sought to answer this question by analyzing gene expression patterns of markers of the AGE/RAGE/
                                    DIAPH1 signaling axis in abdominal subcutaneous (SAT) and omental (OAT) adipose tissue from obese and morbidly
                                    obese subjects.
                                    Results In SAT, but not OAT, expression of AGER was significantly correlated with that of DIAPH1 (n = 16; β^ ¼ 0:719,
                                    [0.260, 1.177]; q = 0.008) and GLO1 (n = 16; β^ ¼ 0:773, [0.364, 1.182]; q = 0.004). Furthermore, in SAT, but not OAT,
                                    regression analyses revealed that the expression pattern of genes in the AGE/RAGE/DIAPH1 axis is strongly and positively
                                    associated with that of inflammatory and adipogenic markers. Remarkably, particularly in SAT, not OAT, the expression of
                                    AGER positively and significantly correlated with HOMA-IR (n = 14; β^ ¼ 0:794, [0.338, 1.249]; q = 0.018).
                                    Conclusions These observations suggest associations of the AGE/RAGE/DIAPH1 axis in the immunometabolic patho-
                                    physiology of obesity and insulin resistance, driven, at least in part, through expression and activity of this axis in SAT.

                                                                                                            Introduction

                                                                                                            According to the World Health Organization (WHO), the
                                    Supplementary information The online version contains                   incidence of obesity has nearly tripled over the past 45 years.
                                    supplementary material available at https://doi.org/10.1038/s41366-     While the precise cause of this phenomenon is not fully
                                    021-00878-3.

                                    * Henry H. Ruiz                                                         3
                                                                                                                Division of Biostatistics, Department of Population Health, New
                                      henry.ruiz@nyulangone.org
                                                                                                                York University Grossman School of Medicine, New York, NY,
                                    1                                                                           USA
                                         Diabetes Research Program, Division of Endocrinology, Diabetes
                                                                                                            4
                                         and Metabolism, Department of Medicine, New York University            General Surgery Division, Department of Surgery, University of
                                         Grossman School of Medicine, New York, NY, USA                         Virginia, Charlottesville, VA, USA
                                    2
                                         Cardiovascular Division, Department of Medicine and
                                         Cardiovascular Research Center, University of Virginia,
                                         Charlottesville, VA, USA
2084 H. H. Ruiz et al.
understood, increases in rates of obesity have been accom- transplantation of adipose tissue devoid of brown or sub-
panied by nutrient excess, decreases in physical activity and cutaneous white adipocyte Ager into Wt mice is sufficient to
a “westernization” of diet composition. In addition to higher endow these metabolic protections in high fat-fed mice [17].
fat and sugar content, Western-style diets are highly pro- Collectively, these reports highlight a crucial role for the
cessed and represent a principal source of proteins non- AGE/RAGE axis in regulating obesity and IR, however,
enzymatically modified by sugars and/or lipids called because RAGE lacks intracellular kinase signaling activity,
advanced glycation end products (AGEs) [1], which have the precise mechanism of action remains poorly understood.
been linked to the pathophysiology of obesity and other Our group discovered that Diaphanous 1 (DIAPH1), a
cardiometabolic disorders [2]. There are multiple endogen- member of the formin-family of Rho GTPase binding pro-
ous pre-AGE and AGE-detoxifying systems, principal teins with identified roles in cytokinesis, actin polymeriza-
among these is the glyoxalase (GLO) enzyme system, which tion, cytoskeleton remodeling, and immune cell trafficking
converts the highly reactive glycating dicarbonyl methyl- [18–20], binds to the intracellular domain of RAGE and
glyoxal (MG) into the less toxic D-lactate [3]. Notably, contributes to RAGE signaling [21]. While it remains
recent observations suggest that excess MG due to inhibition unknown whether or not DIAPH1 plays a central role in
or genetic deletion of glyoxalase 1 (Glo1) promotes obesity regulation of adipose tissue biology, obesity and IR,
and impairs glucose metabolism and insulin resistance (IR) ongoing studies in our laboratory suggest that DIAPH1 is a
[4, 5]; likely by altering adipose tissue vascularization and key contributor to obesity. Taken together, current evidence
promoting its expansion [6, 7]. Conversely, dietary manip- suggests that the AGE/RAGE/DIAPH1 signaling axis is an
ulations to increase GLO1 activity improve vascular func- important obesogenic pathway with multiple potential
tion and glycemic control in obese individuals [8]. therapeutic targets.
When detoxification is incomplete or in settings of high Here, we sought to test the hypotheses that (1) GLO1,
AGE overload such as obesity and diabetes, AGEs exert AGER and DIAPH1 are differentially expressed in adipose
their actions via multiple receptors but preferentially bind tissue of adult non-diabetic/normoglycemic obese (Ob) and
the receptor for advanced glycation end products (RAGE), morbidly obese (MOb) human subjects, and (2) that the
which was first identified based on its ability to bind AGEs expression of these genes associates with that of prototypical
[9, 10]. RAGE is expressed in various tissues including markers of adipogenesis and adipose tissue inflammation,
adipose [11], lung, kidney, heart, epithelium and immune such as peroxisome proliferator-activated receptor gamma
cells such as macrophages [12]. In addition to AGEs, the (PPARɣ) and Tumor necrosis factor alpha (TNFα). Fur-
multi-ligand receptor RAGE also binds the S100/cal- thermore, we assessed if such modulation is associated with
granulins, high mobility group protein box-1, amyloid clinically-relevant measures related to obesity. While abso-
β-peptide and oligomeric protein aggregates [13]. Based on lute expression of genes in the AGE/RAGE/DIAPH1 axis in
its expression profile, its preferential ligands and the obser- the surveyed adipose depots was unaltered by the degree of
vations that one of the chief targets of its stimulation obesity, expression of genes in this axis strongly and posi-
includes activation of the Nuclear Factor-κB complex tively correlated with markers of adipogenesis and inflam-
[14, 15], RAGE has been primarily described as a mediator mation, an effect that was more pronounced in SAT than
of inflammation. However, recent reports by our laboratory OAT. Notably, we found that SAT, but not OAT AGER
and others spotlight a role for RAGE in immunometabolism. expression was a strong predictor of subjects’ homeostatic
We previously reported that mice globally devoid of model assessment of insulin resistance (HOMA-IR). Thus,
Ager; the gene encoding RAGE, wild-type (Wt) mice although the AGE/RAGE/DIAPH1 axis pattern of gene
receiving bone marrow transplanted from mice devoid of expression is not differentially affected by the degree of
Ager, or Wt mice treated with soluble RAGE, a splice obesity, our findings support the notion that the degree of
isoform of AGER yielding a circulating protein which is AGER expression associates with increased expression of
hypothesized to act as a decoy receptor, all are protected adipogenic and inflammatory markers in SAT and clinical
from diet-induced obesity (DIO) and IR [16]. In parallel, evidence of IR, further positioning RAGE as a crucial
Gaens et al. found that RAGE expression is significantly mediating gene in immunometabolism.
elevated in subcutaneous adipose tissue (SAT) from obese
(body mass index [BMI] = 34.240 kg/m2) vs. lean (BMI =
23.440 kg/m2) non-diabetic individuals. Among severely Methods
obese subjects (BMI > 40 kg/m2), RAGE expression was
higher in visceral than SAT [11]. The notion that RAGE in Subject samples
adipocytes plays a key role in obesity and IR was supported
by our recent report that adipose-specific deletion of Ager Subcutaneous and omental adipose tissues and blood were
protects mice from obesity and IR. In fact, surgical collected from sixteen (16) obese, non-diabetic humanAGE/RAGE/DIAPH1 axis is associated with immunometabolic markers and risk of insulin resistance in. . . 2085
Table 1 Subject anthropomorphic and clinical data. measures of IR including HOMA-IR [22] and the quanti-
. Obese Morbidly obese p value tative insulin sensitivity check index (QUICKI) [23]. Use of
anti-hypertensive medications was comparable between
Age 44 (12.6) 42 (7.7) 0.655
groups. Informed consent was obtained from all subjects
n=8 n=8
prior to sample collection and in complete compliance with,
Sex 2M/6F 2M/6F N/A
n=8 n=8 and strict adherence to, the guidelines approved by the
Race 1B/7C 3B/5C N/A University of Virginia (UVA) and New York University
n=8 n=8 Langone Health’s institutional review boards.
Height (in) 64.8 (4.4) 66.1 (4.7) 0.553
n=8 n=8 Clinical measures
Weight (Lbs) 232.8 (36.9) 411.8 (41.4) 55 kg/m2, n = 8) and each group Power calculations from experimental model data com-
consisted of two males and six females. In other analyses, paring AGE/RAGE/DIAPH1 axis gene changes in adipose
we considered body weight as a continuous variable for our tissue from lean and obese samples were used to
correlation studies. Both groups were normoglycemic with determine the appropriate sample size. Anthropomorphic
no statistically-significant differences in fasting insulin or data were summarized as mean and standard deviation for2086 H. H. Ruiz et al. Fig. 1 Circulating adiponectin but not MCP-1 correlate with body depicting the association between body weight and serum MCP-1. weight. A Omental adipose and (B) serum adiponectin levels in Ob vs. Box-and-whiskers plots illustrate within group minimum and max- MOb subjects. C Regression plot depicting the association between imum values range. For regression graphs, statistical significance and body weight and serum adiponectin levels. D Omental adipose and (E) strength of association are indicated by p and r2 values respectively, serum MCP-1 levels in Ob vs. MOb subjects. F Regression plot 95% confidence interval in brackets, “n” indicates sample size. continuous variables and count for binary variables. Nor- discovery rate-adjusted p value, is calculated using the BH mal data distribution was assessed and the appropriate procedure for multiple testing correction. All statistical nonparametric tests were used and reported when neces- analyses were performed using the R software environ- sary. In normally distributed data, the T-test was employed ment (Version 3.6) at an alpha level of p ≤ 0.05, selected to evaluate the comparison between Ob and MOb groups apriori as the threshold for significance. p/q values > 0.05 for continuous variables and the Fisher’s exact test was for and
AGE/RAGE/DIAPH1 axis is associated with immunometabolic markers and risk of insulin resistance in. . .                                 2087

    Since no differences were observed in key markers of                    1.203]; q = 0.019) and tended (n = 16; β^ ¼ 0:532, [−0.008,
adipocyte function and systemic inflammation, we exam-                       1.072]; q = 0.095) to correlate in the same direction with
ined both SAT and OAT for these markers. Adiponectin                        TNF while no association was observed with CCL2
content in OAT was not different between Ob and MOb                         (Fig. 3A–C). Comparable to that of AGER, in SAT,
subjects and while plasma adiponectin levels tended to be                   DIAPH1 levels significantly and positively correlated with
generally lower in the MOb vs. Ob groups (p = 0.104), this                  TNF (n = 16; β^ ¼ 0:815, [0.415, 1.215]; q = 0.006)
difference did not reach statistical significance (Fig. 1A–B).               expression but not with CD68 or CCL2 (Fig. 3D–F) and
Although regression analysis showed no relationship                         increased SAT GLO1 expression was significantly asso-
between BMI and serum adiponectin levels, there was a                       ciated with higher levels of CD68 (n = 13; β^ ¼ 0:905,
statistically significant negative correlation between body                  [0.269, 1.541]; q = 0.028) and TNF (n = 16; β^ ¼ 0:678,
weight and levels of serum adiponectin (n = 12; r2 = 0.362,                 [0.199, 1.157]; q = 0.028) but not CCL2 (Fig. 3G–I).
[0.038, 0.687]; p = 0.038) (Fig. 1C). OAT and serum                            We tested for these associations in OAT and found that
MCP1 levels did not differ between groups nor did serum                     other than a statistical trend (n = 16; β^ ¼ 0:646, [0.030,
MCP1 correlate with body weight (Fig. 1D–F).                                1.263]; q = 0.083) for higher expression of CD68 with
    To directly address the AGE/RAGE/DIAPH1 axis, we                        increasing levels of GLO1, no significant correlations were
quantified the SAT and OAT expression of prototypical                        observed between AGER and DIAPH1 gene sets (Supple-
genes involved in this axis (GLO1, AGER, DIAPH1), genes                     mental Fig. 2). Together, these observations suggest a close
involved in adipose inflammation (CD68, TNF, CCL2) and                       association between the AGE/RAGE/DIAPH1 axis in SAT
adipocyte metabolism (PPARG, PPARGC1A, UCP1,                                but not in OAT inflammation.
CIDEA) to determine whether these are regulated or if they                     We also sought to determine if the AGE/RAGE/DIAPH1
associate with clinically-relevant measures. With the                       axis is linked to markers of adipogenesis (PPARG &
exception of PPARGC1A, these genes were not differen-                       PPARGC1A) and metabolic genes that we previously identified
tially regulated in Ob vs. MOb subjects in SAT (Fig. 2A) or                 to be regulated by RAGE in a mouse model of obesity (UCP1
OAT (Fig. 2B). PPARGC1A expression was significantly                         and CIDEA) [17]. SAT AGER was found to significantly and
higher in SAT but not OAT samples from MOb vs. Ob                           positively correlate with expression of PPARG (n = 16;
subjects (Fig. 2A).                                                         β^ ¼ 0:799, [0.432, 1.165]; q = 0.004) while no association
    Using data from all subjects, we probed whether gene                    was observed with PPARGC1A, UCP1 and CIDEA
expression patterns in each category associate with one                     (Fig. 4A–D). SAT DIAPH1 exhibited significant and positive
another. AGER expression in SAT associated strongly and                     associations with PPARG (n = 16; β^ ¼ 0:694, [0.231, 1.158];
positively with DIAPH1 (n = 16; β¼ ^ 0:719, [0.0.260, 1.177];               q = 0.016), PPARGC1A (n = 13; β^ ¼ 0:679, [0.240, 1.118];
q = 0.008) and GLO1 (n = 16; β^ ¼ 0:773, [0.364, 1.182];                    q = 0.016) and CIDEA (n = 13; β^ ¼ 0:675, [0.225, 1.126];
q = 0.004) while a statistical trend (n = 16; β¼    ^ 0:464,                q = 0.016) but not with UCP1 (Fig. 4E–H). Similar to AGER,
[−0.083, 1.012]; q = 0.089) in the same direction was                       higher expression of SAT GLO1 was significantly associated
observed for the association between DIAPH1 and GLO1                        with higher expression of PPARG (n = 16; β^ ¼ 0:931, [0.703,
(Fig. 2C–E). No statistically significant correlations were                  1.158]; q = 0.001) but not the other genes probed (Fig. 4I–L).
observed between genes associated with inflammation or                       In OAT samples, GLO1 expression levels, but not AGER or
adipocyte metabolism (CD68, TNF, CCL2, PPARGC1A, and                        DIAPH1, were significantly and positively correlated with
CIDEA) (Fig. 2F–J) in SAT. Remarkably, in contrast to SAT,                  PPARGC1A (n = 16; β^ ¼ 0:988, [0.586, 1.391]; q = 0.001)
in OAT samples, genes in the AGE/RAGE/DIAPH1 axis did                       and CIDEA (n = 16; β^ ¼ 0:819, [0.380, 1.258]; q = 0.006).
not correlate with one another (Supplemental Fig. 1A-C),                    No other statistically significant correlations were observed for
while statistically significant associations were observed                   these comparisons in OAT (Supplemental Fig. 3). Thus, as
between CD68, TNF and CCL2 (Supplemental Fig. 1D–F)                         with inflammatory markers, the AGE/RAGE/DIAPH1 axis
and PPARG with PPARGC1A (n = 16; β^ ¼ 0:500, [0.124,                        strongly associates with markers of adipocyte metabolism in
0.876]; p = 0.013) but not between UCP1 and CIDEA                           SAT but not in OAT, with the exception of GLO1 and its
(Supplemental Fig. 1G–H). Taken together, these data sug-                   relationship to PPARGC1A in OAT.
gest a potential dichotomy whereby expression of genes in the                  We then assessed whether or not the expression of
AGE/RAGE/DIAPH1 axis is closely associated with each                        selected genes in the AGE/RAGE/DIAPH1 axis, inflam-
other in SAT but not OAT in obesity, while inflammatory                      matory or adipose metabolism categories had predictive
genes associate with each other in OAT but not SAT.                         power for the various clinically-relevant parameters mea-
    We next determined whether genes in the AGE/RAGE/                       sured in this study. In SAT, only AGER expression, but not
DIAPH1 axis associate with markers of adipose tissue                        that of PPARG, DIAPH1, UCP1, GLO1 or CD68, was
inflammation. SAT AGER expression was strongly and                           found to be significantly and positively correlated with
positively correlated with CD68 (n = 13; β^ ¼ 0:718, [0.233,                HOMA-IR (n = 14; β^ ¼ 0:794, [0.338, 1.249]; q = 0.018)
2088 H. H. Ruiz et al. Fig. 2 Significant association in expression pattern among genes in (F–H) inflammatory and (I–J) adipose metabolism genes. Statistical the AGE/RAGE/DIAPH1 axis in obese subcutaneous adipose tis- significance and strength of association are indicated by q and β^ values sue. Expression of target genes in MOb relative to Ob subjects in (A) respectively, 95% confidence interval in brackets, “n” indicates subcutaneous and (B) omental adipose tissue. Regression plots for the sample size. association among (C–E) AGE/RAGE/DIAPH1 axis, prototypical (Fig. 5). In contrast, in OAT, there were no associations adipose depots, of the genes examined in this study, higher between any of these AGE/RAGE/DIAPH1, adipogenic or expression of SAT AGER was found to be linked to higher inflammatory factors with HOMA-IR (Supplement table 3). HOMA-IR values in non-diabetic obese subjects. Finally, we asked whether there were associations with To ascertain whether the associations we have uncovered genes of the AGE/RAGE/DIAPH1 axis and other immu- between genes in the AGE/RAGE/DIAPH1 axis and nometabolic genes with the clinical measures assessed in inflammatory markers as well as clinical measures of IR in this study. After correction for multiple statistical tests, no SAT might be explained by differential AGE burden in the other statistically significant gene/clinically-relevant-mea- two adipose depots, we measured AGEs content by two sure correlations were observed in SAT (Supplemental distinct methods: first, from acid hydrolyzed fraction Table 2) or OAT (Supplemental Table 3). Thus, in these extraction and second, via immunoblotting. We found that
AGE/RAGE/DIAPH1 axis is associated with immunometabolic markers and risk of insulin resistance in. . .                                      2089

Fig. 3 Expression of obese subcutaneous adipose tissue AGE/                 (A–C) AGER, (D–F) DIAPH1 and (G–I) GLO1 respectively. Statis-
RAGE/DIAPH1 axis genes positively correlates with prototypical              tical significance and strength of association are indicated by q and
inflammatory markers. Regression plots depicting the association in          β^ values respectively, 95% confidence interval in brackets, “n” indi-
subcutaneous adipose tissue between CD68, TNF and CCL2 with                 cates sample size.

Fig. 4 Obese subcutaneous adipose tissue PPARG expression is                AGER, (E–H) DIAPH1 and (I–L) GLO1 respectively. Statistical sig-
closely associated with the AGE/RAGE/DIAPH1 axis genes.                     nificance and strength of association are indicated by q and β^ values
Regression plots depicting the association in subcutaneous adipose          respectively, 95% confidence interval in brackets, “n” indicates
tissue between PPARG, PPARGC1A, UCP1 and CIDEA with (A–D)                   sample size.
2090                                                                                                          H. H. Ruiz et al.

Fig. 5 Obese subcutaneous
adipose tissue AGER
expression is positively
associated with HOMA-IR.
Regression plots depicting the
association in subcutaneous
adipose tissue between (A)
AGER, (B) PPARG, (C)
DIAPH1, (D) UCP1, (E) GLO1,
(F) CD68 and subjects’ HOMA-
IR. Statistical significance and
strength of association are
indicated by q and β^ values
respectively, 95% confidence
interval in brackets, “n”
indicates sample size.

AGE content per protein of adipose tissue is comparable        these observations are relevant to obesity in human subjects
between SAT and OAT of our study subjects (Supplemental        has yet to be fully established. When compared to lean
Fig. 4A). There were no statistically significant differences   subjects, obese individuals exhibit lower levels of circulat-
in AGE content in either SAT (Supplemental Fig. 4B) or         ing AGEs in parallel with higher adipose tissue expression
OAT (Supplemental Fig. 4C) when comparing obese to             of RAGE and greater tissue accumulation of AGEs [26],
MOb subjects. These observations were confirmed by              which has led to the tissue “AGE trapping” hypothesis,
immunoblotting studies (Supplemental Fig. 4D–E). Fur-          whereby obesity is characterized by excess tissue AGE
thermore, regression analyses indicated that adipose tissue    buildup and, consequently, low circulating AGEs [26].
AGE content is not correlated with the expression of genes     Notably, these increases in adipose tissue AGEs are asso-
in the AGE/RAGE/DIAPH1 axis in SAT (Supplemental               ciated with greater incidence of IR and risk for metabolic
Fig. 5A–C) or OAT (Supplemental Fig. 5D–F). Thus, dif-         dysfunction. If the expression of GLO1/RAGE/DIAPH1 in
ferences in AGE content between SAT and OAT do not             adipose tissue is altered by increasing degrees of obesity
explain our reported associations between genes in the         and whether the expression of these genes associates with
AGE/RAGE/DIAPH1 axis, inflammatory markers and                  adipose tissue inflammation and adipocyte metabolism
HOMA-IR.                                                       markers was addressed in the present studies.
                                                                  To avoid the potential confounding effects of hypergly-
                                                               cemia on AGEs and RAGE expression, we studied non-
Discussion                                                     diabetic subjects who differed significantly in their degree
                                                               of obesity. With the exception of body weight and BMI,
There is growing experimental evidence supporting a link       study subjects had comparable clinical history, anthro-
between AGE/RAGE/DIAPH1 and the pathophysiology of             pomorphic and IR measures. Furthermore, levels of surro-
obesity and associated metabolic disorders. However, whether   gate measures for renal and hepatic function, and systemic
AGE/RAGE/DIAPH1 axis is associated with immunometabolic markers and risk of insulin resistance in. . . 2091
inflammation were similar between the two groups. There PPARɣ and PGC1α play key roles in adipogenesis and
were no differences in either omental adipose or circulating insulin sensitization, and reportedly increase in expression
adiponectin levels between groups while serum adiponectin during obesity [27, 28]. Further, PPARɣ expression is
levels negatively associated with body weight. Using two negatively correlated with cardiovascular risks [29] and IR
complementary approaches we found no statistically sig- [30]. We did not observe differences between obese and
nificant differences in AGE burden between adipose depots MOb subjects in the expression levels for these genes in
nor between obese and MOb subjects in either adipose either SAT or OAT; these subjects also did not differ by
depot. AGE burden was not associated with differences in measures of insulin sensitivity. Statistical regression ana-
AGER, DIAPH1 or Glo1 and thus we conclude that adipose lyses, however, revealed strong and positive associations
tissue AGEs content does not confound the associations we between all three genes in the AGE/RAGE/DIAPH1 axis
identified between the AGE/RAGE/DIAPH1 axis and and PPARG expression, which may indicate a potential
metabolic variables. counter-regulatory mechanism to defend from the negative
Our first hypothesis was that compared to obese sub- effects of higher AGER and DIAPH1 expression. The
jects, AGER/DIAPH1 expression in adipose tissue would veracity of this hypothesis, which remains to be fully tested,
be significantly higher in subjects with morbid obesity is strengthened by the observation that in SAT, only AGER
whereas lower expression of mRNA transcripts encoding expression was predictive of HOMA-IR. Of note, these
the AGE-detoxifier enzyme GLO1 was predicted in those correlations were specific for AGER and DIAPH1 expres-
individuals. We did not observe statistically-significant sion in SAT as these associations were not observed in
differences in the expression of these genes between groups OAT. While increases in the PPARɣ axis have been asso-
in either SAT or OAT. However, there appeared to be a ciated with improved insulin sensitivity, the fact that neither
tendency for greater AGER expression in SAT from MOb PPARG nor PPARGC1A correlated with HOMA-IR suggest
subjects, an effect for which statistical significance might that in severe obesity, the observed increases are instead,
have been obscured by our limited sample size. Further- likely a reflection of greater adipogenesis where AGER has
more, we speculated that transcript levels for PPARG, also been implicated and may explain the strong correlation
PPARGC1A, CD68, TNFα and CCL2 would be higher in between these genes. Thus, we speculate that the associa-
MOb subjects consistent with greater adiposity and tion between SAT AGER and HOMA-IR are likely inde-
inflammation. We found PPARGC1A expression to be pendent of the PPAR axis.
significantly higher in SAT of MOb vs. obese subjects, On account of the lack of mechanistic link between
however, none of the other target genes were differentially AGER and PPAR and expected changes associated with IR,
expressed in either adipose depot studied nor did the we examined prototypical markers of inflammation. CD68
plasma levels of the protein encoded by CCL2 (MCP-1) is a prototypical marker for adipose tissue macrophages,
differ in OAT. Thus, we conclude that with the exception which contribute to secretion of TNF. TNF is also expressed
of the gene encoding PGC1α, genes in the AGE/AGER/ by adipocytes; its expression is higher in adipose tissue
DIAPH1 axis, inflammatory and adipocyte metabolism from obese vs. lean humans, and high levels are associated
markers are not differentially regulated by the degree of with hyperinsulinemia and IR [31, 32]. We did not observe
obesity among obese subjects. Whether the expression of significant differences between obese and MOb subjects in
these genes differs between the lean state, mild and/or either SAT or OAT with regards to CD68 and TNF
extreme obesity remains an open question. expression. While this was unexpected because increasing
Our second hypothesis was that GLO1/AGER/DIAPH1 obesity is commonly associated with OAT inflammation, it
expression would correlate with one another and positively may be explained by previous observations that adipose
associate with the expression of inflammation and adipo- TNF levels are less variable in subjects with BMIs >40, as is
cyte metabolism markers in SAT and OAT. Regression the case in our samples [31]. Interestingly, statistical
analyses of the association of these genes in SAT revealed regression analyses revealed correlations between the AGE/
several novel correlations. In line with their known close RAGE/DIAPH1 axis genes and the inflammatory markers
interactions, the expression of GLO1, AGER and DIAPH1 CD68 and TNF in SAT, but not OAT. This association
strongly associated with each other. Specifically, subjects appears to be in conflict with the established notion that
expressing higher AGER also expressed higher levels of OAT dysfunction has a superior contribution to whole-body
DIAPH1 and GLO1 in SAT. Notably, subjects with greater metabolic impairment than other adipose depots including
SAT AGER exhibited higher HOMA-IR ratios suggestive SAT [33–35]. This status quo has largely been skewed by
of a potential link between SAT AGER and IR even in studies specifically focusing on OAT analyses [36] and by
clinically non-diabetic patients. We did not observe any comparisons of lean vs. obese/diabetic subjects [37].
association amongst these genes in OAT nor with Whether this is the case amongst obese human subjects is
clinically-relevant measures of IR. not as clear cut. In fact, there is a growing body of evidence2092 H. H. Ruiz et al.
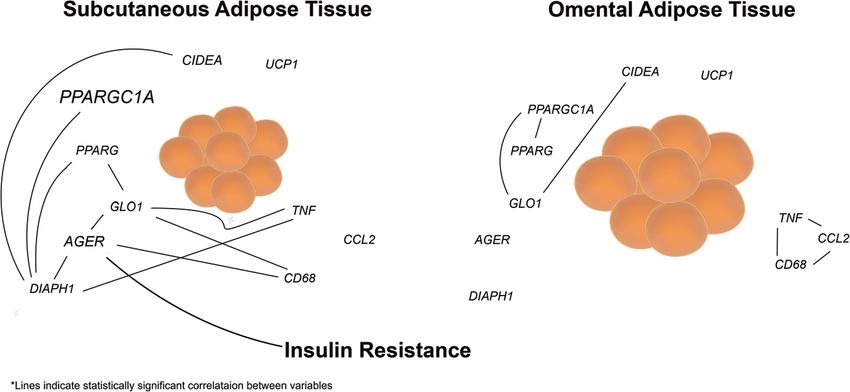
Fig. 6 Proposed model of the
AGE/RAGE/DIAPH1 axis in
obesity. We propose that our
data define a novel paradigm in
which SAT AGER is
significantly associated with
insulin resistance, at least in part
through perturbation of seminal
immune and metabolic
pathways.
that supports the argument that in obesity, SAT dysfunction expression of a select number of genes and whether or not
(e.g., inflammation [38, 39], senescence [40] and morpho- the observed changes in gene expression translate into
logical organization [41]) is strongly associated with changes at the protein level remains to be determined in
metabolic disruptions including IR in humans. Thus, our future studies. Further, in this study, although we were
finding that among obese subjects, the AGE/RAGE/ unable to address the questions raised by our hypothesis
DIAPH1 axis in SAT but not OAT associates with using alternative approaches such as flow cytometry and/
inflammation and IR is not unfounded and opens the pos- or immunohistochemistry, this work sets the stage for
sibility for an adipose-depot specific differential role for this future experimental and clinical studies in which tissues
axis in humans. Furthermore, using an experimental model may be employed for these types of analyses. Such studies
of obesity, we recently highlighted a primary role for SAT are particularly necessary to determine whether the asso-
RAGE in promoting obesity [17]. Specifically, transplan- ciation between AGEs/RAGE/Diaph1 and IR in humans
tation of SAT devoid of adipocyte Ager was sufficient to can be attributed to a cause-and-effect relationship.
prevent obesity and IR in Wt mice fed a high fat diet. Thus, Finally, because adipose tissue samples from lean indivi-
the novel finding that AGER associated with human SAT duals undergoing surgical procedures are difficult to
but not OAT inflammation and IR is in line with our find- obtain in a controlled manner, our conclusions are limited
ings using rodent models. Altogether, these observations to comparisons amongst obese vs. MOb subjects, thus
support and add to a repertoire of studies implicating RAGE leaving open the question as to how the genes studied here
as a key immunometabolic player in human obesity and compare between lean and obese subjects. Nevertheless,
open the possibility that common transcription factors may our novel observations highlight a role for the AGE/
be regulating the genes in the AGE/RAGE/DIAPH1 axis, RAGE/DIAPH1 axis in the pathophysiology of obesity
inflammation and adipose metabolism. Future studies will and IR. Remarkably, these findings pinpoint a new para-
test these concepts. Importantly, CCL2 expression did not digm of RAGE-dependent immunometabolic regulation in
associate with any genes in the AGE/RAGE/DIAPH1 axis SAT, not OAT, that likely is not directly dependent on
in either tissue and OAT expression levels of the protein it PPAR- or TNF-driven mechanisms (Fig. 6). Indeed, as
encodes, MCP1, were not different between the two groups, blockade of TNF has not shown consistent results in
suggesting that MCP1 responses in obesity are likely AGE/ regulation of IR in human obesity [42–44], our findings
RAGE/DIAPH1-independent and suggest novel mechanism may suggest probing potential roles for RAGE as a novel
(s) by which RAGE is associated with increased macro- target for therapeutic intervention in obesity and its
phage markers (such as CD68 and TNF) in human and immunometabolic complications.
mouse obesity.
While our observations provide a set of novel asso- Funding This work was supported by an award from the American
Heart Association (AHA) #17SFRN33520045 (AMS) and the
ciations in SAT between the AGE/RAGE/DIAPH1 axis National institute of health (NIH) grants # 1R01DK109675 (AMS),
and adipose tissue inflammation and metabolism, there are 1P01HL131481-01A1 (AMS), R01HL136098 (CAM) and
notable limitations to our study. First, due to the strict 1K01DK120782-01A1 (HHR).
selection criteria to obtain samples representative of sig-
nificantly different degrees of obesity, our sample size
may have prevented us from unveiling more key asso- Compliance with ethical standards
ciations due to lack of statistical power. Second, the lim-
ited availability of tissue only allowed us to assess the Conflict of interest The authors declare no competing interests.AGE/RAGE/DIAPH1 axis is associated with immunometabolic markers and risk of insulin resistance in. . . 2093
Publisher’s note Springer Nature remains neutral with regard to 13. Fritz G. RAGE: a single receptor fits multiple ligands. Trends
jurisdictional claims in published maps and institutional affiliations. Biochem Sci. 2011;36:625–32.
14. Sousa MM, Yan SD, Stern D, Saraiva MJ. Interaction of the
Open Access This article is licensed under a Creative Commons Receptor for Advanced Glycation End Products (RAGE) with
Attribution 4.0 International License, which permits use, sharing, Transthyretin Triggers Nuclear Transcription Factor kB (NF-kB)
adaptation, distribution and reproduction in any medium or format, as Activation. Lab Investig. 2000;80:1101–10.
long as you give appropriate credit to the original author(s) and the 15. Bierhaus A, Schiekofer S, Schwaninger M, Andrassy M, Humpert
source, provide a link to the Creative Commons license, and indicate if PM, Chen J, et al. Diabetes-Associated Sustained Activation of
changes were made. The images or other third party material in this the Transcription Factor Nuclear Factor-κB. Diabetes.
article are included in the article’s Creative Commons license, unless 2001;50:2792–2808.
indicated otherwise in a credit line to the material. If material is not 16. Song F, Hurtado del Pozo C, Rosario R, Zou YS, Ananthakrish-
included in the article’s Creative Commons license and your intended nan R, Xu X et al. RAGE Regulates the Metabolic and Inflam-
use is not permitted by statutory regulation or exceeds the permitted matory Response to High-Fat Feeding in Mice. Diabetes. 2014;
use, you will need to obtain permission directly from the copyright 63:1948–65.
holder. To view a copy of this license, visit http://creativecommons. 17. Hurtado Del Pozo C, Ruiz HH, Arivazhagan L, Aranda JF, Shim
org/licenses/by/4.0/. C, Daya P, et al. A Receptor of the Immunoglobulin Super-
family Regulates Adaptive Thermogenesis. Cell Rep. 2019;28:
773–791.e7.
References 18. Tominaga T, Sahai E, Chardin P, McCormick F, Courtneidge SA,
Alberts AS. Diaphanous-Related Formins Bridge Rho GTPase
1. Uribarri J, Woodruff S, Goodman S, Cai W, Chen X, Pyzik R, and Src Tyrosine Kinase Signaling. Mol Cell. 2000;5:13–25.
et al. Advanced glycation end products in foods and a practical 19. Shi Y, Zhang J, Mullin M, Dong B, Alberts AS, Siminovitch KA.
guide to their reduction in the diet. J Am Diet Assoc. The mDial formin is required for neutrophil polarization, migration,
2010;110:911–16.e12. and activation of the LARG/RhoA/ROCK signaling axis during
2. Ruiz HH, Ramasamy R, Schmidt AM. Advanced Glycation End chemotaxis. J Immunol (Baltimore, Md.: 1950). 2009;182:3837–45.
Products: building on the Concept of the “Common Soil” in 20. Pan J, Lordier L, Meyran D, Rameau P, Lecluse Y, Kitchen-
Metabolic Disease. Endocrinology 2019;161:1–10. Goosen S, et al. The formin DIAPH1 (mDia1) regulates mega-
3. Sellin S, Mannervik B. Reversal of the reaction catalyzed by karyocyte proplatelet formation by remodeling the actin and
glyoxalase I. Calculation of the equilibrium constant for the microtubule cytoskeletons. Blood. 2014;124:3967–77.
enzymatic reaction. J Biol Chem. 1983;258:8872–5. 21. Hudson BI, Kalea AZ, del Mar Arriero M, Harja E, Boulanger E,
4. Moraru A, Wiederstein J, Pfaff D, Fleming T, Miller AK, D’Agati V et al. Interaction of the RAGE Cytoplasmic Domain
Nawroth P, et al. Elevated Levels of the Reactive Metabolite with Diaphanous-1 Is Required for Ligand-stimulated Cellular
Methylglyoxal Recapitulate Progression of Type 2 Diabetes. Cell Migration through Activation of Rac1 and Cdc42. J Biol Chem.
Metab. 2018;27:926–934.e8. 2008;283:34457–68.
5. Lodd E, Wiggenhauser LM, Morgenstern J, Fleming TH, Poschet 22. Matthews DR, Hosker JP, Rudenski AS, Naylor BA, Treacher
G, Büttner M, et al. The combination of loss of glyoxalase1 and DF, Turner RC. Homeostasis model assessment: insulin resistance
obesity results in hyperglycemia. JCI Insight. 2019;4:12. and beta-cell function from fasting plasma glucose and insulin
6. Rodrigues T, Matafome P, Sereno J, Almeida J, Castelhano J, concentrations in man. Diabetologia. 1985;28:412–9.
Gamas L, et al. Methylglyoxal-induced glycation changes adipose 23. Katz A, Nambi SS, Mather K, Baron AD, Follmann DA, Sullivan
tissue vascular architecture, flow and expansion, leading to insulin G, et al. Quantitative insulin sensitivity check index: a simple,
resistance. Sci Rep. 2017;7:1698. accurate method for assessing insulin sensitivity in humans. J Clin
7. Jia X, Chang T, Wilson TW, Wu L. Methylglyoxal Mediates Endocrinol Metab. 2000;85:2402–10.
Adipocyte Proliferation by Increasing Phosphorylation of Akt1. 24. Schmittgen TD, Livak KJ. Analyzing real-time PCR data by the
PLoS ONE. 2012;7:e36610. comparative CT method. Nat Protoc. 2008;3:1101–08.
8. Xue M, Weickert MO, Qureshi S, Kandala N-B, Anwar A, 25. Benjamini Y, Hochberg Y. Controlling the False Discovery Rate:
Waldron M et al. Improved Glycemic Control and Vascular a Practical and Powerful Approach to Multiple Testing. J Royal
Function in Overweight and Obese Subjects by Glyoxalase 1 Stat Soc: Series B (Methodol). 1995;57:289–300.
Inducer Formulation. Diabetes. 2016; 65:2282–94. 26. Gaens KH, Ferreira I, van de Waarenburg MP, van Greeven-
9. Schmidt AM, Vianna M, Gerlach M, Brett J, Ryan J, Kao J, et al. broek MM, van der Kallen CJ, Dekker JM, et al. Protein-Bound
Isolation and characterization of two binding proteins for advanced Plasma Nε-(Carboxymethyl)lysine Is Inversely Associated With
glycosylation end products from bovine lung which are present on Central Obesity and Inflammation and Significantly Explain a
the endothelial cell surface. J Biol Chem. 1992;267:14987–97. Part of the Central Obesity-Related Increase in Inflammation:
10. Neeper M, Schmidt AM, Brett J, Yan SD, Wang F, Pan YC, et al. The Hoorn and CODAM Studies. Arterioscler Thromb Vasc
Cloning and expression of a cell surface receptor for advanced Biol. 2015;35:2707–13.
glycosylation end products of proteins. J Biol Chem. 27. Vidal-Puig AJ, Considine RV, Jimenez-Liñan M, Werman A,
1992;267:14998–5004. Pories WJ, Caro JF, et al. Peroxisome proliferator-activated
11. Gaens KH, Goossens GH, Niessen PM, van Greevenbroek MM, receptor gene expression in human tissues. Effects of obesity,
van der Kallen CJ, Niessen HW, et al. Nε-(carboxymethyl)lysine- weight loss, and regulation by insulin and glucocorticoids. J Clin
receptor for advanced glycation end product axis is a key mod- Investig. 1997;99:2416–22.
ulator of obesity-induced dysregulation of adipokine expression 28. Ruschke K, Fishbein L, Dietrich A, Kloting N, Tonjes A, Ober-
and insulin resistance. Arterioscler Thromb Vasc Biol. bach A, et al. Gene expression of PPARgamma and PGC-1alpha
2014;34:1199–208. in human omental and subcutaneous adipose tissues is related to
12. Brett J, Schmidt AM, Yan SD, Zou YS, Weidman E, Pinsky D, insulin resistance markers and mediates beneficial effects of
et al. Survey of the distribution of a newly characterized receptor physical training. Eur J Endocrinol. 2010;162:515–23.
for advanced glycation end products in tissues. Am J Pathol. 29. Krempler F, Breban D, Oberkofler H, Esterbauer H, Hell E,
1993;143:1699–712. Paulweber B, et al. Leptin, peroxisome proliferator-activated2094 H. H. Ruiz et al.
receptor-gamma, and CCAAT/enhancer binding protein-alpha lipolysis and inflammation relate to insulin resistance in male
mRNA expression in adipose tissue of humans and their relation obese humans. Sci Rep. 2018;8:4677.
to cardiovascular risk factors. Arterioscler Thromb Vasc Biol. 38. Sbierski-Kind J, Mai K, Kath J, Jurisch A, Streitz M, Kuchen-
2000;20:443–9. becker L, et al. Association between Subcutaneous Adipose
30. Zeghari N, Vidal H, Younsi M, Ziegler O, Drouin P, Donner M. Tissue Inflammation, Insulin Resistance, and Calorie Restriction
Adipocyte membrane phospholipids and PPAR-gamma expres- in Obese Females. J Immunol (Baltimore, Md.: 1950).
sion in obese women: relationship to hyperinsulinemia. Am J 2020;205:45–55.
Physiol. Endocrinol Metab. 2000;279:E736–43. 39. Bigornia SJ, Farb MG, Mott MM, Hess DT, Carmine B, Fiscale
31. Kern PA, Saghizadeh M, Ong JM, Bosch RJ, Deem R, Simsolo A, et al. Relation of depot-specific adipose inflammation to insulin
RB. The expression of tumor necrosis factor in human adipose resistance in human obesity. Nutr Diabetes. 2012;2:e30.
tissue. Regulation by obesity, weight loss, and relationship to 40. Rouault C, Marcelin G, Adriouch S, Rose C, Genser L, Ambrosini
lipoprotein lipase. J Clin Investig. 1995;95:2111–9. M, et al. Senescence-associated β-galactosidase in subcutaneous
32. Hotamisligil GS, Arner P, Caro JF, Atkinson RL, Spiegelman adipose tissue associates with altered glycaemic status and truncal
BM. Increased adipose tissue expression of tumor necrosis factor- fat in severe obesity. Diabetologia. 2021;64:240–54.
alpha in human obesity and insulin resistance. J Clin Investig. 41. Guzmán-Ruiz R, Tercero-Alcázar C, Rabanal-Ruiz Y, Díaz-Ruiz
1995;95:2409–15. A, El Bekay R, Rangel-Zuñiga OA, et al. Adipose tissue depot-
33. Wueest S, Schoenle EJ, Konrad D. Depot-specific differences in specific intracellular and extracellular cues contributing to
adipocyte insulin sensitivity in mice are diet- and function- insulin resistance in obese individuals. FASEB J. 2020;34:
dependent. Adipocyte. 2012;1:153–6. 7520–39.
34. Hardy OT, Perugini RA, Nicoloro SM, Gallagher-Dorval K, Puri 42. Ofei F, Hurel S, Newkirk J, Sopwith M, Taylor R. Effects of an
V, Straubhaar J, et al. Body mass index-independent inflammation engineered human anti-TNF-alpha antibody (CDP571) on insulin
in omental adipose tissue associated with insulin resistance in sensitivity and glycemic control in patients with NIDDM. Dia-
morbid obesity. Surg Obes Relat Dis. 2011;7:60–7. betes. 1996;45:881–5.
35. Kranendonk ME, van Herwaarden JA, Stupkova T, de Jager W, 43. Paquot N, Castillo MJ, Lefèbvre PJ, Scheen AJ. No increased
Vink A, Moll FL, et al. Inflammatory characteristics of distinct insulin sensitivity after a single intravenous administration of a
abdominal adipose tissue depots relate differently to metabolic recombinant human tumor necrosis factor receptor: Fc fusion
risk factors for cardiovascular disease: distinct fat depots and protein in obese insulin-resistant patients. J Clin Endocrinol
vascular risk factors. Atherosclerosis. 2015;239:419–27. Metab. 2000;85:1316–9.
36. Guglielmi V, Cardellini M, Cinti F, Corgosinho F, Cardolini I, 44. Stanley TL, Zanni MV, Johnsen S, Rasheed S, Makimura H, Lee
D’Adamo M, et al. Omental adipose tissue fibrosis and insulin H, et al. TNF-alpha antagonism with etanercept decreases glucose
resistance in severe obesity. Nutr Diabetes. 2015;5:e175. and increases the proportion of high molecular weight adiponectin
37. Verboven K, Wouters K, Gaens K, Hansen D, Bijnen M, Wetzels in obese subjects with features of the metabolic syndrome. J Clin
S, et al. Abdominal subcutaneous and visceral adipocyte size, Endocrinol Metab. 2011;96:E146–50.You can also read